Introduction
Diabetic nephropathy (DN) is a serious microvascular
complication of diabetes mellitus and the leading cause of
end-stage renal disease (ESRD). The incidence of DN in type 2 (T2D)
patients has noticeably increased with the steady increase in the
global prevalence of T2D (1). It is
estimated that ~40% of T2D patients develop DN (2,3), and
despite advances in therapy and patient care, a large percentage of
those patients progress to ESRD (4).
The pathogenicity of DN is extremely complex and the molecular
mechanisms implicated in the development and progression of DN
remain poorly understood. However, it is well established that
hyperglycemia is closely correlated with the progression of DN
(5,6), and increasing evidence indicates that
mitochondrial oxidative stress and mitochondrial dysfunction are
implicated in disease progression (7,8).
Mitochondria are major organelles producing most of the cellular
energy in the form of adenosine triphosphate via oxidative
phosphorylation, and are the major site of reactive oxygen species
(ROS) generation. Overproduction of mitochondrial ROS during
hyperglycemia is considered as a unifying mechanism of vascular
tissue damage in diabetes (9,10).
Indeed, hyperglycemia-induced mitochondrial ROS activate several
pathways implicated in DN, including protein kinase C,
mitogen-activated protein kinases, as well as various cytokines and
transcription factors (9,10), which ultimately enhances the
expression of extracellular matrix genes with progression to renal
fibrosis associated with a declining glomerular filtration rate
(GFR) (11).
The pathophysiological basis of DN is the
development of persistent microalbuminuria with an urinary albumin
excretion rate of 30-300 mg/day, which may progress over a number
of years to macroalbuminuria (urinary albumin excretion rate
>300 mg/day), followed by a gradual decline in the GFR and at a
later stage to kidney failure (12).
Although microalbuminuria has long been considered as the first
sign of renal involvement in T2D patients, it lacks the reliability
to accurately predict kidney-associated outcomes in diabetic
patients (13,14). It has been also indicated that in
certain DN patients, renal impairment may occur even prior to the
appearance of microalbuminuria, and ~20% of patients with impaired
renal function have normoalbuminuria (15). Therefore, evaluation of different
biomarkers and their association with DN at the molecular level may
provide a means of early detection and also for the prevention of
this progressive disease.
Mitochondria carry their own mitochondrial DNA
(mtDNA), a 16.5-kb, double-stranded, circular molecule, which
contains genes encoding for proteins that are essential for normal
mitochondrial function (16). mtDNA
presents in a mammalian cell as a multicopy genome with
1,000-10,000 copies per cell. The quantity of mitochondria is
indicated by the mtDNA copy number (mtDNA-CN), which is used as a
surrogate measure of mitochondrial function (16). Compared to nuclear DNA (nDNA), mtDNA
is more susceptible to oxidative stress due to its close proximity
to the site of free radical generation (17). Increased oxidative stress in human
cells may contribute to alterations in the mtDNA-CN, mtDNA-encoded
gene expression and mitochondrial abundance (18–21). A
previous study by our group has indicated that in response to high
glucose-induced chronic oxidative stress, the renal mtDNA-CN is
decreased and the mitochondria are impaired (21). Furthermore, decreased mtDNA-CN in the
peripheral blood has also been reported in several diseases
associated with oxidative stress. For instance, low mtDNA-CN in the
whole blood of patients with T2D precedes the development of
diabetes (22) and a reduction in
mtDNA-CN in peripheral leukocytes is associated with insulin
resistance in T2D patients (23),
insulin sensitivity in offspring of T2D patients (24) and the age at onset of T2D (25). In addition, decreased peripheral
blood mtDNA-CN is linked to other diseases, including cancer
(26), and associated with the
severity of coronary heart disease (27). These clinical and experimental
studies suggest that altered mtDNA-CN, which reflects the
oxidant-induced cell damage, may provide a useful disease
biomarker.
The present study investigated the potential of
mtDNA-CN in the peripheral blood as a biomarker for DN. mtDNA-CN
was quantified as the DNA ratio between a target mitochondrial gene
and a reference nuclear gene (mtDNA/nDNA) in blood
samples from T2D patients without DN, T2D patients with DN and
non-diabetic healthy subjects.
Materials and methods
Study population
The study included 50 non-diabetic healthy controls
and 100 T2D patients. Of the T2D patients, 50 had no DN and 50 had
DN. The participants were recruited between November 2013 and
January 2015 from King Abdullah University Medical Centre (Arabian
Gulf University, Manama, Kingdom of Bahrain). Healthy subjects were
recruited during visitation to the Centre either for a routine
check-up or due to the fact that they had a family history of
T2D.
T2D was diagnosed according to the World Health
Organization criteria (28) with
fasting glucose (FG) levels of ≥7.0 mmol/l and glycated hemoglobin
A1c (HbA1c) levels of >6.5%.
The albuminuria status was classified based on the
albumin-to-creatinine ratio (ACR) as normoalbuminuria (ACR <2.5
mg/mmol for men and ACR <3.5 mg/mmol for women),
microalbuminuria (ACR 2.5-25 mg/mmol for men and ACR 2.8-28 mg/mmol
for women) or macroalbuminuria (ACR of >25 mg/mmol for men and
ACR >28 mg/mmol for women) (29).
Renal function was assessed using the estimated glomerular
filtration rate (eGFR) based on the Modification of Diet in Renal
Disease formula (30). The
non-diabetic healthy individuals had no history of diabetes and no
evidence of kidney disease. The exclusion criteria were
cardiovascular disease, hepatic dysfunction, neoplastic diseases
and systemic disorders. Clinical data, including age, gender, body
mass index (BMI) and blood pressure, were collected from the
medical records of the participants.
Extraction of genomic DNA
Genomic DNA was extracted from peripheral blood
samples of 50 T2D patients, 50 DN patients and 50 non-diabetic
healthy subjects using the QIAMP DSP DNA kit (Qiagen, Hilden,
Germany) as per the manufacturer's protocols. In brief, 20 µl
protease was mixed with 200 µl EDTA-blood followed by the addition
of lysis buffer (200 µl) and incubation at 56°C for 10 min.
Following centrifugation at 20,000 × g for 1 min at 4°C, absolute
ethanol (200 µl) was added and the lysate was centrifuged at 6,000
× g for 1 min. Washing steps were performed using 500 µl washing
buffer followed by centrifugation at 6,000 × g for 1 min and then
at 20,000 × g for 3 min. To elute the genomic DNA, elution buffer
(200 µl) was added, followed by incubation at room temperature for
1 min and subsequent centrifugation at 6,000 × g for 1 min. DNA
concentrations were determined using a Nanodrop ND-1000
ultraviolet-visible light spectrophotometer (Thermo Fisher
Scientific, Inc., Waltham, MA, USA). The concentrations of the DNA
samples were adjusted to 200 ng/µl. All genomic DNA samples were
stored at −20°C until further analysis.
Determination of mtDNA-CT
Quantitative real-time polymerase chain reaction
(qPCR) analysis was used to determine the mtDNA-CN. TaqMan assays
designed for the mitochondrial cytochrome b (CYTB) gene and the
single-copy nuclear β-2-microglobulin (B2M) gene were used in the
present study. The primers and probes for CYTB and B2M were as
follows: CYTB forward primer, 5-GCCTGCCTGATCCTCCAAAT-3′, CYTB
reverse primer, 5-AAGGTAGCGGATGATTCAGCC-3′ and CYTB probe,
5FAM-CACCAGACGCCTCAACCGCCTT-TAMRA3; B2M forward primer,
5-CCAGCAGAGAATGGAAAGTCAA-3, B2M reverse primer,
5-TCTCTCTCCATTCTTCAGTAAGTCAACT-3 and B2M probe,
5FAM-ATGTGTCTGGGTTTCATCCATCCGACA-TAMRA3. The PCR mixture contained
200 nM primers, 100 nM TaqMan probe (Applied Biosystems; Thermo
Fisher Scientific, Inc.), 200 ng DNA and 200 nM 2.5 Premix Ex Taq
(Takara Bio Inc, Otsu, Japan) in a final volume of 20 µl. qPCR was
performed with a 7900HT real-time PCR system (Applied Biosystems;
Thermo Fisher Scientific, Inc.) using the following cycling
conditions: 1 cycle of 50°C for 2 min, 1 cycle of 95°C for 10 min,
and 30 cycles of 95°C for 15 sec and 60°C for 1 min. For each PCR
run, standard curves were established from 5 serially diluted,
purified PCR products (1×10² to 1×10⁷ ng/ml)
from the CYTB gene and the B2M gene to generate quantification data
as previously described (19,21).
Quantification of mtDNA was accomplished by calculating the ratio
of mtDNA-encoded CYTB gene to the nDNA-encoded B2M gene and
mtDNA-CN data were expressed as mtDNA per nDNA. Each measurement
was repeated twice and a non-template control (with template DNA
omitted) was included in each experiment.
Statistical analysis
SPSS software (version 23; IBM Corp., Armonk, NY,
USA) was used for statistical analysis. A two-tailed Student's
t-test was used for comparison between two groups and one-way
analysis of variance followed by a post hoc Tukey's HSD test for
multiple-group comparisons. The receiver operating characteristic
(ROC) curve was used as a measure of diagnostic accuracy of
mtDNA-CN and the area under the curve (AUC) was calculated to
evaluate the specificity and sensitivity. The association between
mtDNA-CN and DN was assessed using multivariate regression models.
The odds ratios (ORs) and 95% confidence intervals (CIs) were
computed with these models with multi-adjustment for clinical
variables. The correlation between mtDNA-CN and clinical variables
was analyzed by calculating Pearson's correlation coefficient.
P<0.05 was considered to indicate a statistically significant
difference. All values are expressed as the mean ± standard
deviation.
Results
Clinical data
A total of 50 non-diabetic healthy subjects and 100
T2D patients were included in the present study. Of all of the
patients, 50 patients with T2D had DN and 50 had no DN. The
diabetic subjects were sub-divided based on the ACR into T2D
patients with normoalbuminuria (n=50), DN patients with
microalbuminuria (n=29) and DN patients with macroalbuminuria
(n=21). The clinical data of the participants are displayed in
Table I. The patients with T2D with
and without DN were older than the non-diabetic individuals
(P<0.05). However, there was no significant difference in gender
between the controls and the patients with T2D with and without DN
(P>0.05). Other parameters, including the BMI, mean blood
pressure, FG, HbA1c, albuminuria, ACR, serum creatinine, estimated
(e)GFR, low-density lipoprotein (LDL) and triglycerides differed
significantly between the controls and the patients with T2D with
and without DN (P<0.05). Furthermore, the T2D patients with DN
were older than those without DN (P=0.012) and had a significantly
higher blood pressure (P<0.05), albuminuria (P<0.05), ACR
(P<0.05), serum creatinine (P<0.05), LDL (P<0.05) and
triglycerides (P<0.05), and a lower eGFR (P<0.05). In
addition, DN patients with macroalbuminuria were older, had a
higher mean blood pressure and a longer duration of diabetes than
those with microalbuminuria and T2D patients with normoalbuminuria
(P<0.05). Patients with macroalbuminuria also had higher levels
of FG, HbA1c, albuminuria, ACR, serum creatinine, LDL,
triglycerides, total cholesterol and lower eGFR than patients with
microalbuminuria and normoalbuminuria (P<0.05). In terms of sex,
there were more males in the microalbuminuria group than in the
macroalbuminuria group (P<0.05).
 | Table I.Clinical data. |
Table I.
Clinical data.
|
Characteristics | Healthy (n=50) | T2D without DN
(normoalbuminuria, n=50) | T2D with DN
(n=50) | T2D with DN
(microalbuminuria subgroup, n=29) | T2D with DN
(macroalbuminuria subgroup, n=21) |
|---|
| Age (years) |
56±5.2 |
62±10.7a |
64.5±6.3a | 62.5±6.5 |
67.0±5.4c,d |
| Male | 22 | 25 | 24 | 16 | 8c |
| Female | 28 | 25 | 26 | 13 | 13 |
| BMI
(Kg/m2) | 24.2±4.1 | 24.8±4.4 |
26.3±5.2a | 26.7±5.1 | 25.8±4.7 |
| Mean blood pressure
(mm Hg) | 83.9±2.5 |
88.8±10.2 |
96.2±12.6a,b |
92.8±10.5 |
99.5±13.4c,d |
| FG (mmol/l) |
4.3±0.6 |
8.6±2.1a |
8.7±1.2a |
8.6±1.4 |
8.8±1.1c,d |
| HbA1c (%) |
4.9±0.7 |
8.9±2.2a |
9.3±1.8a |
8.1±1.1 |
10.6±1.4c,d |
| Diabetes
duration | – |
15±4.5 | 17.5±4.6 | 16.4±4.4 |
19.0±4.1c,d |
| Albuminuria
(mg/day) |
5.4±1.7 |
5.5±1.9 |
223±117.9a,b | 113.4±52.2 |
332.8±28.7c,d |
| ACR (mg/mmol) |
0.9±0.4 | 0.94±0.5 |
28.3±12.0a,b |
22.2±15.8 |
34.3±7.7c,d |
| Serum creatinine
(µm/l) |
54.7±11.7 |
64.7±15.7a |
119.2±45.8a,b | 121.2±41.1 |
176.8±41.2c,d |
| eGFR (ml/min/1.73
m2) | 104.3±13.2 |
94±8.1 |
66.0±14.8a,b |
78.2±14.1 |
53.7±7.7c,d |
| LDL (mmol/l) | 2.14±0.8 | 2.62±1.1 |
4.4±1.5a,b |
3.7±1.2 |
4.3±1.0c,d |
| HDL (mmol/l) |
1.3±0.2 | 1.26±0.3 | 1.3±0.3 |
1.4±0.2 | 1.2±0.3 |
| Triglyceride
(mmol/l) |
1.6±0.6 |
1.6±0.5 |
2.5±1.3a,b |
1.8±1.3 |
3.2±1.1c,d |
| Total cholesterol
(mmol/l) | 4.02±0.8 | 4.4±1a |
4.6±1.1a,b |
4.3±1.2 |
4.9±0.9c,d |
Accuracy of qPCR assays
For accurate quantification of mtDNA-CN, standard
curves were established using dilution series of purified PCR
products obtained from the mtDNA gene CYTB and the nDNA gene B2M as
previously described (19,21). The regression curves calculated with
five dilutions ranging from 1×10² to 1×10⁷
ng/ml had excellent and significant correlation coefficients (r
−1.00, P=0.013 for CYTB and r −1.00, P=0.024) for B2M), indicating
a high accuracy of mtDNA-CN quantification.
Peripheral blood mtDNA-CN is decreased
in T2D patients without and further decreased in those with DN
The mtDNA-CN, defined as the copy number ratio of
mtDNA to nDNA (CYTB/B2M) was measured in peripheral blood samples
from T2D patients without DN, T2D patients with DN and non-diabetic
healthy controls by TaqMan-based real-time PCR.
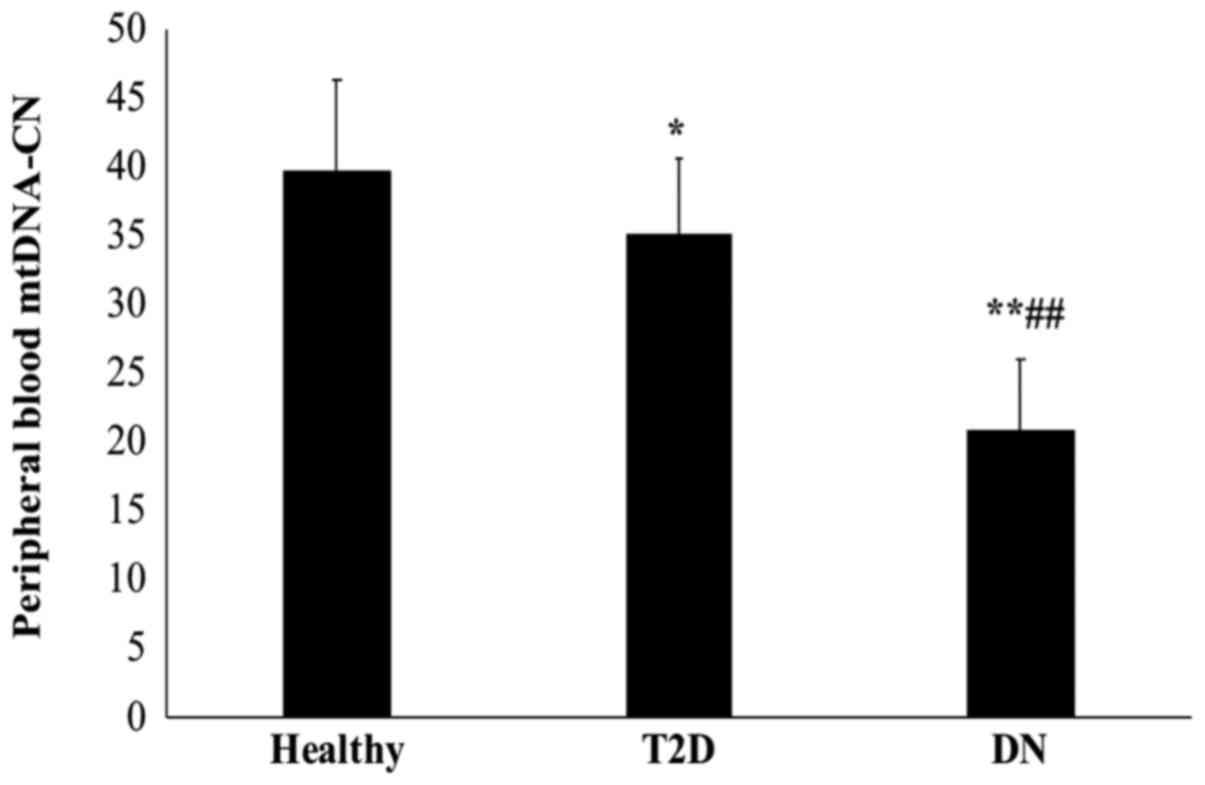
As presented in Fig.
1, T2D patients with DN had a significantly lower mtDNA-CN than
those without DN and the healthy control subjects (P<0.01).
Furthermore, the mtDNA-CN was significantly lower in T2D patients
than in healthy controls (P=0.048). The mean mtDNA copy number was
39.75±6.6 in healthy subjects, 35.11±5.4 in T2D patients and
20.85±5.2 in DN patients.
Peripheral blood mtDNA-CN is decreased
with the severity of DN
Next, the association between peripheral blood
mtDNA-CN and the severity of DN was examined by measurement of
albuminuria in the patient groups. Based on the ACR, the patients
were categorized into T2D patients without DN and normoalbuminuria
(n=50), and T2D patients with DN and microalbuminuria (n=29) or
macroalbuminuria (n=21).
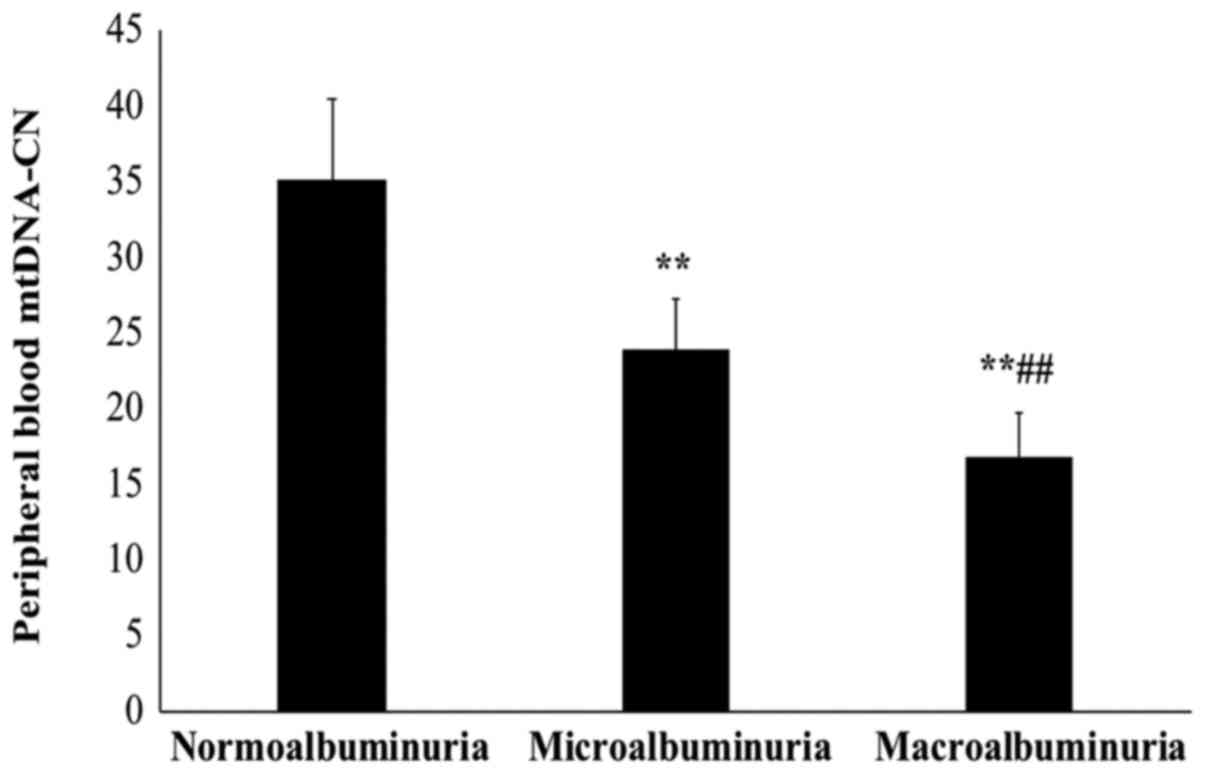
The sub-group analysis with stratification based on
the ACR indicated that the mtDNA-CN in patients with
macroalbuminuria was significantly lower than that in patients with
microalbuminuria and normoalbuminuria (P<0.01; Fig. 2). Of note, the mtDNA-CN in patients
with macroalbuminuria was also significantly lower than that in
patients with microalbuminuria (P<0.01). The mean mtDNA-CN was
35.11±5.4 in normoalbuminuria patients, 23.8±3.5 in
microalbuminuria patients and 16.7±2.9 in macroalbumiuria
patients.
ROC analysis of peripheral blood
mtDNA-CN
Analysis using the ROC curve was used to evaluate
the diagnostic value of peripheral blood mtDNA-CN as a biomarker
for DN.
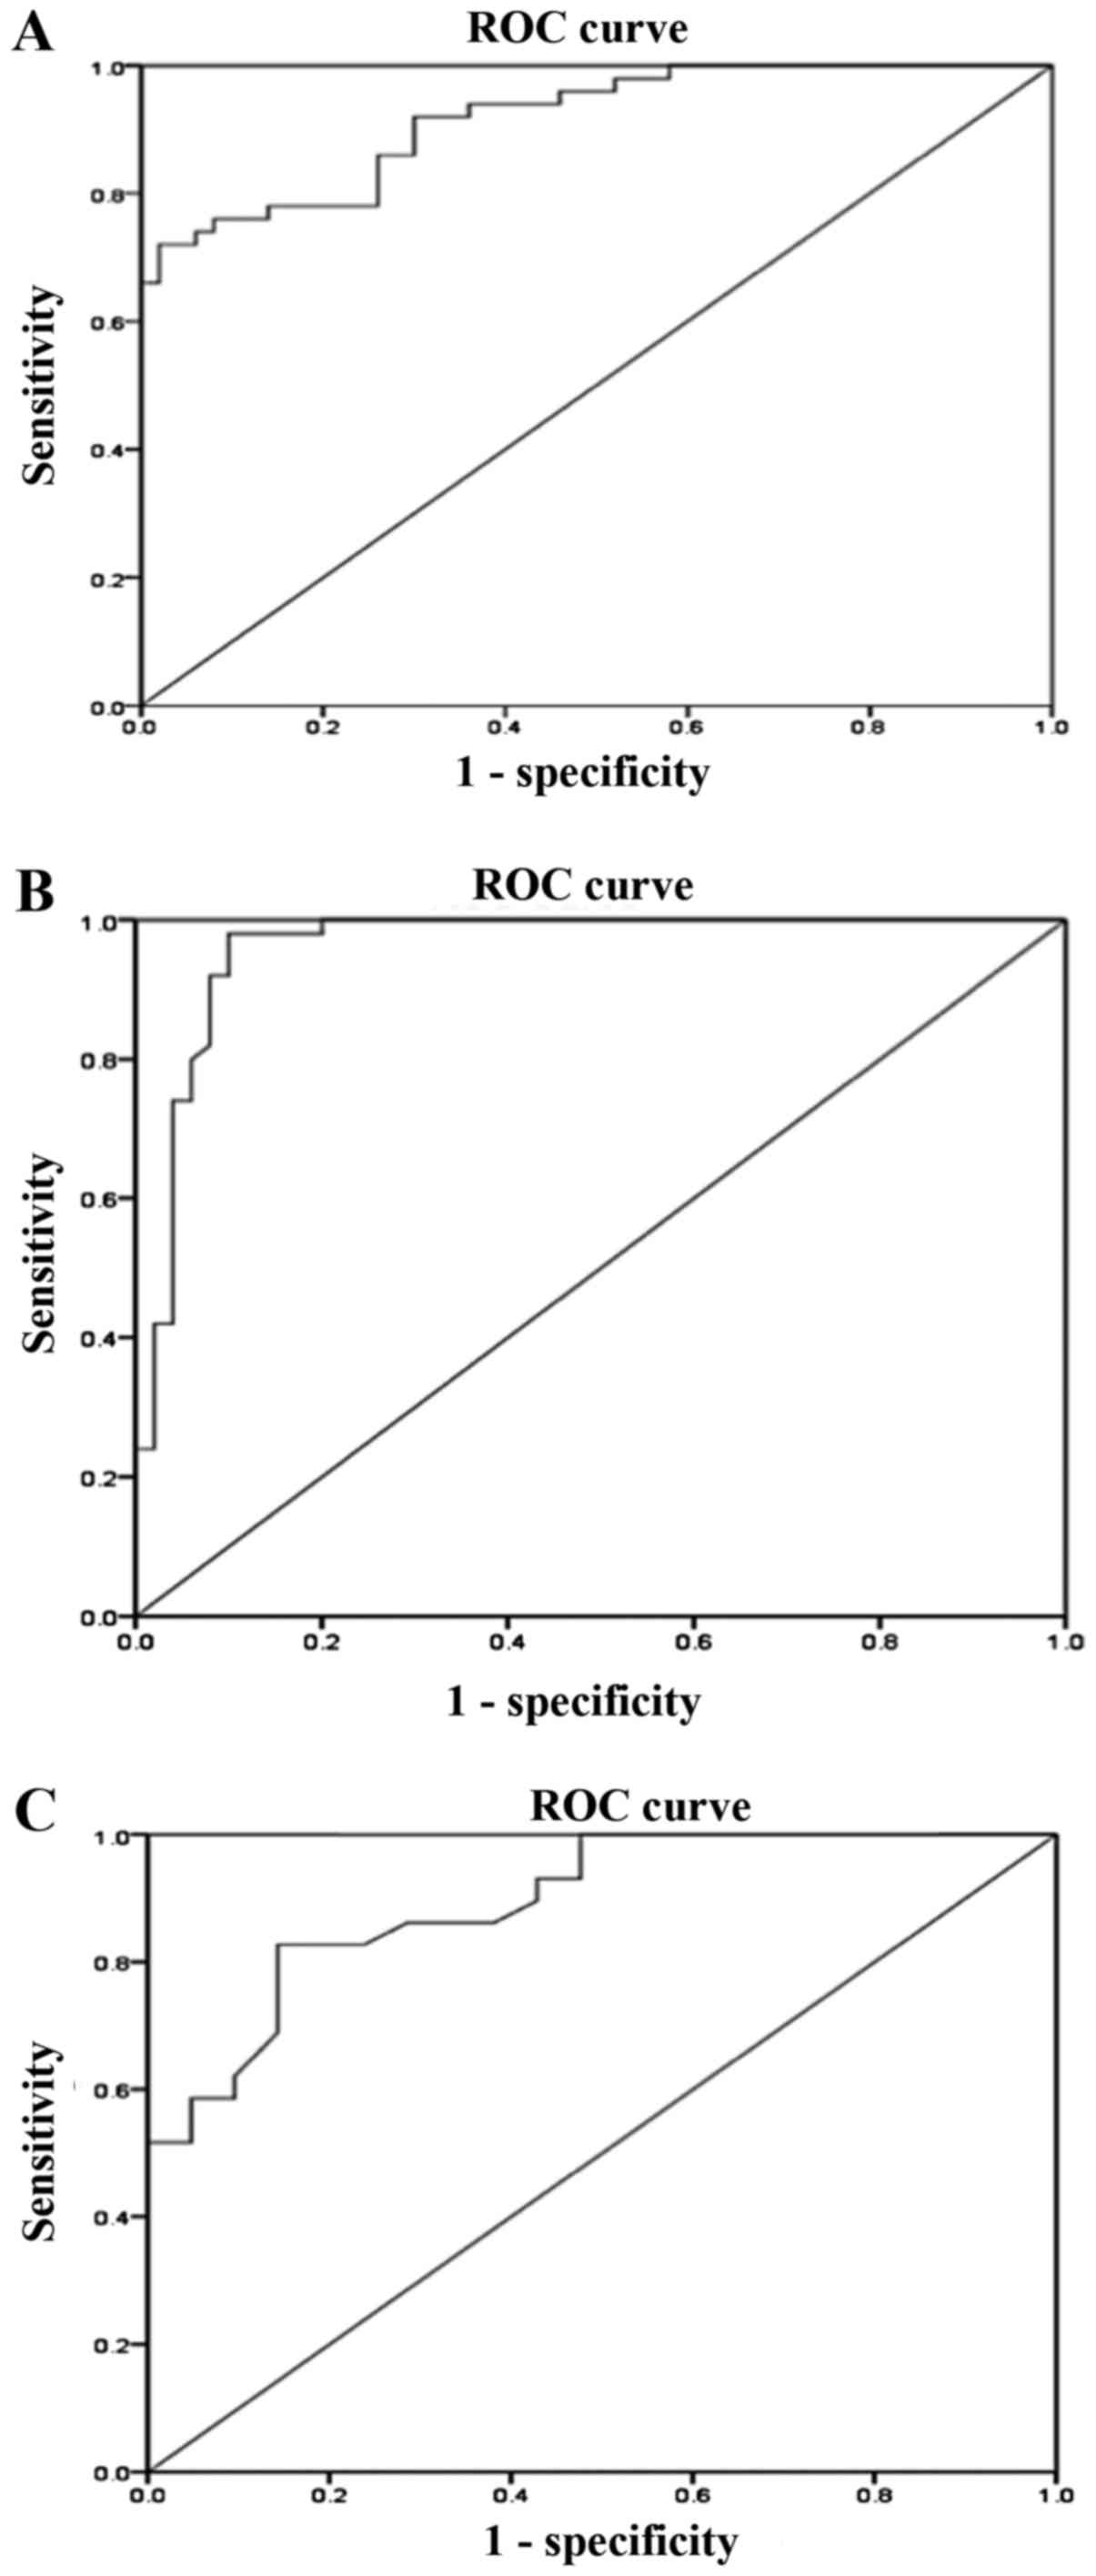
The results revealed that the AUC of mtDNA-CN for
discriminating T2D patients with DN from those without DN was 0.92
(95% CI: 0.86-0.97, P<0.01; Fig.
3A) with a sensitivity of 86% and a specificity of 74%
(Table II). Furthermore, regarding
the discrimination of T2D patients with DN from healthy controls,
the AUC for mtDNA-CN was 0.96 (95% CI: 0.92-1.000, P<0.01;
Fig. 3B) with a sensitivity of 96%
and a specificity of 88% (Table
II). The AUC of mtDNA-CN for differentiating between patients
with microalbuminuria and macroalbuminuria was 0.895 (95% CI:
0.81-0.98, P<0.01; Fig. 3C) with
a sensitivity of 83% and a specificity of 85% (Table II). The sensitivity and specificity
of a quantitative test were dependent on the cut-off points above
or below which the test is positive. The higher the sensitivity,
the lower the specificity and vice versa. The optimal cut-off
values were selected from the maximum sensitivity and specificity
values of the ROC curve output.
| Table II.Receiver operating characteristic
analysis for the peripheral blood mitochondrial DNA copy
number. |
Table II.
Receiver operating characteristic
analysis for the peripheral blood mitochondrial DNA copy
number.
| Comparison of
groups | AUC | 95% CI | P-value | Cut-off point | Sensitivity
(%) | Specificity
(%) |
|---|
| DN vs. T2D | 0.916 | 0.864-0.968 | <0.01 | 24.75 | 86 | 74 |
| DN vs. healthy | 0.961 | 0.921-1.000 | <0.01 | 28.95 | 96 | 88 |
| Microalbuminuria
vs. macroalbuminuria | 0.895 | 0.810-0.980 | <0.01 | 21.33 | 83 | 85 |
Association between peripheral blood
mtDNA-CN and DN
A multivariate logistic regression analysis was
performed using different models to define the association between
peripheral blood mtDNA-CN and DN. The group of patients with T2D
without DN was used as the reference category and the group of T2D
patients with DN as the dependent variable. The results indicated a
significant association between mtDNA-CN and the occurrence of DN
(P<0.05; Table III). This
association remained significant after adjustment for several
variables, including age, mean blood pressure, HbA1c and total
cholesterol (P<0.05). In addition, when the group of
non-diabetic healthy control subjects was regarded as the reference
category and the group of DN patients as the dependent variable
(Table III), the mtDNA-CN was
significantly associated with the presence of DN prior to and after
adjustment for the abovementioned clinical variables
(P<0.05).
| Table III.Association between the peripheral
blood mtDNA-CN and DN. |
Table III.
Association between the peripheral
blood mtDNA-CN and DN.
|
| The reference
category: T2D group without DN | The reference
category: Healthy control group |
|---|
|
|
|
|
|---|
|
| DN | DN |
|---|
|
|
|
|
|---|
| Models | OR | 95% CI | P-value | OR | 95% CI | P-value |
|---|
| Model 1 | 0.662 | 0.552-0.792 | <0.01 | 0.694 | 0.593-0.812 | <0.01 |
| Model 2 | 0.712 | 0.600-0.845 | <0.01 | 0.696 | 0.594-0.85 | 0.015 |
| Model 3 | 0.662 | 0.516-0.851 | <0.01 | 0.698 | 0.592-0.833 | 0.02 |
| Model 4 | 0.634 | 0.474-0.848 | 0.028 | 0.671 | 0.558-0.806 | <0.01 |
|
| The reference
category: T2D without DN (nornoalbuminuria group) |
|
|
| DN with
microalbuminuria | DN with
macroalbuminuria |
|
|
|
|
| Models | OR | 95% CI | P-value | OR | 95% CI | P-value |
|
| Model 1 | 0.727 | 0.620-0.853 | <0.01 | 0.463 | 0.345-0.621 | <0.01 |
| Model 2 | 0.728 | 0.620-0.855 | <0.01 | 0.461 | 0.340-0.625 | <0.01 |
| Model 3 | 0.718 | 0.608-0.848 | <0.01 | 0.443 | 0.316-0.622 | <0.01 |
| Model 4 | 0.697 | 0.579-0.839 | 0.047 | 0.480 | 0.336-0.684 | 0.017 |
Next, the normoalbuminuria group (T2D patients
without DN) was regarded as the reference category and the
microalbuminuria or macroalbuminuria group as the dependent
variable (Table III). It was
revealed that the mtDNA-CN was independently associated with
microalbuminuria and macroalbuminuria even after adjustment for
age, mean blood pressure, HbA1c and total cholesterol (P<0.05),
suggesting its independent association with the progression of
DN.
Correlation analysis
Pearson's correlation coefficient was calculated to
determine the correlation between peripheral blood mtDNA-CN and
different clinical variables in T2D patients with DN.
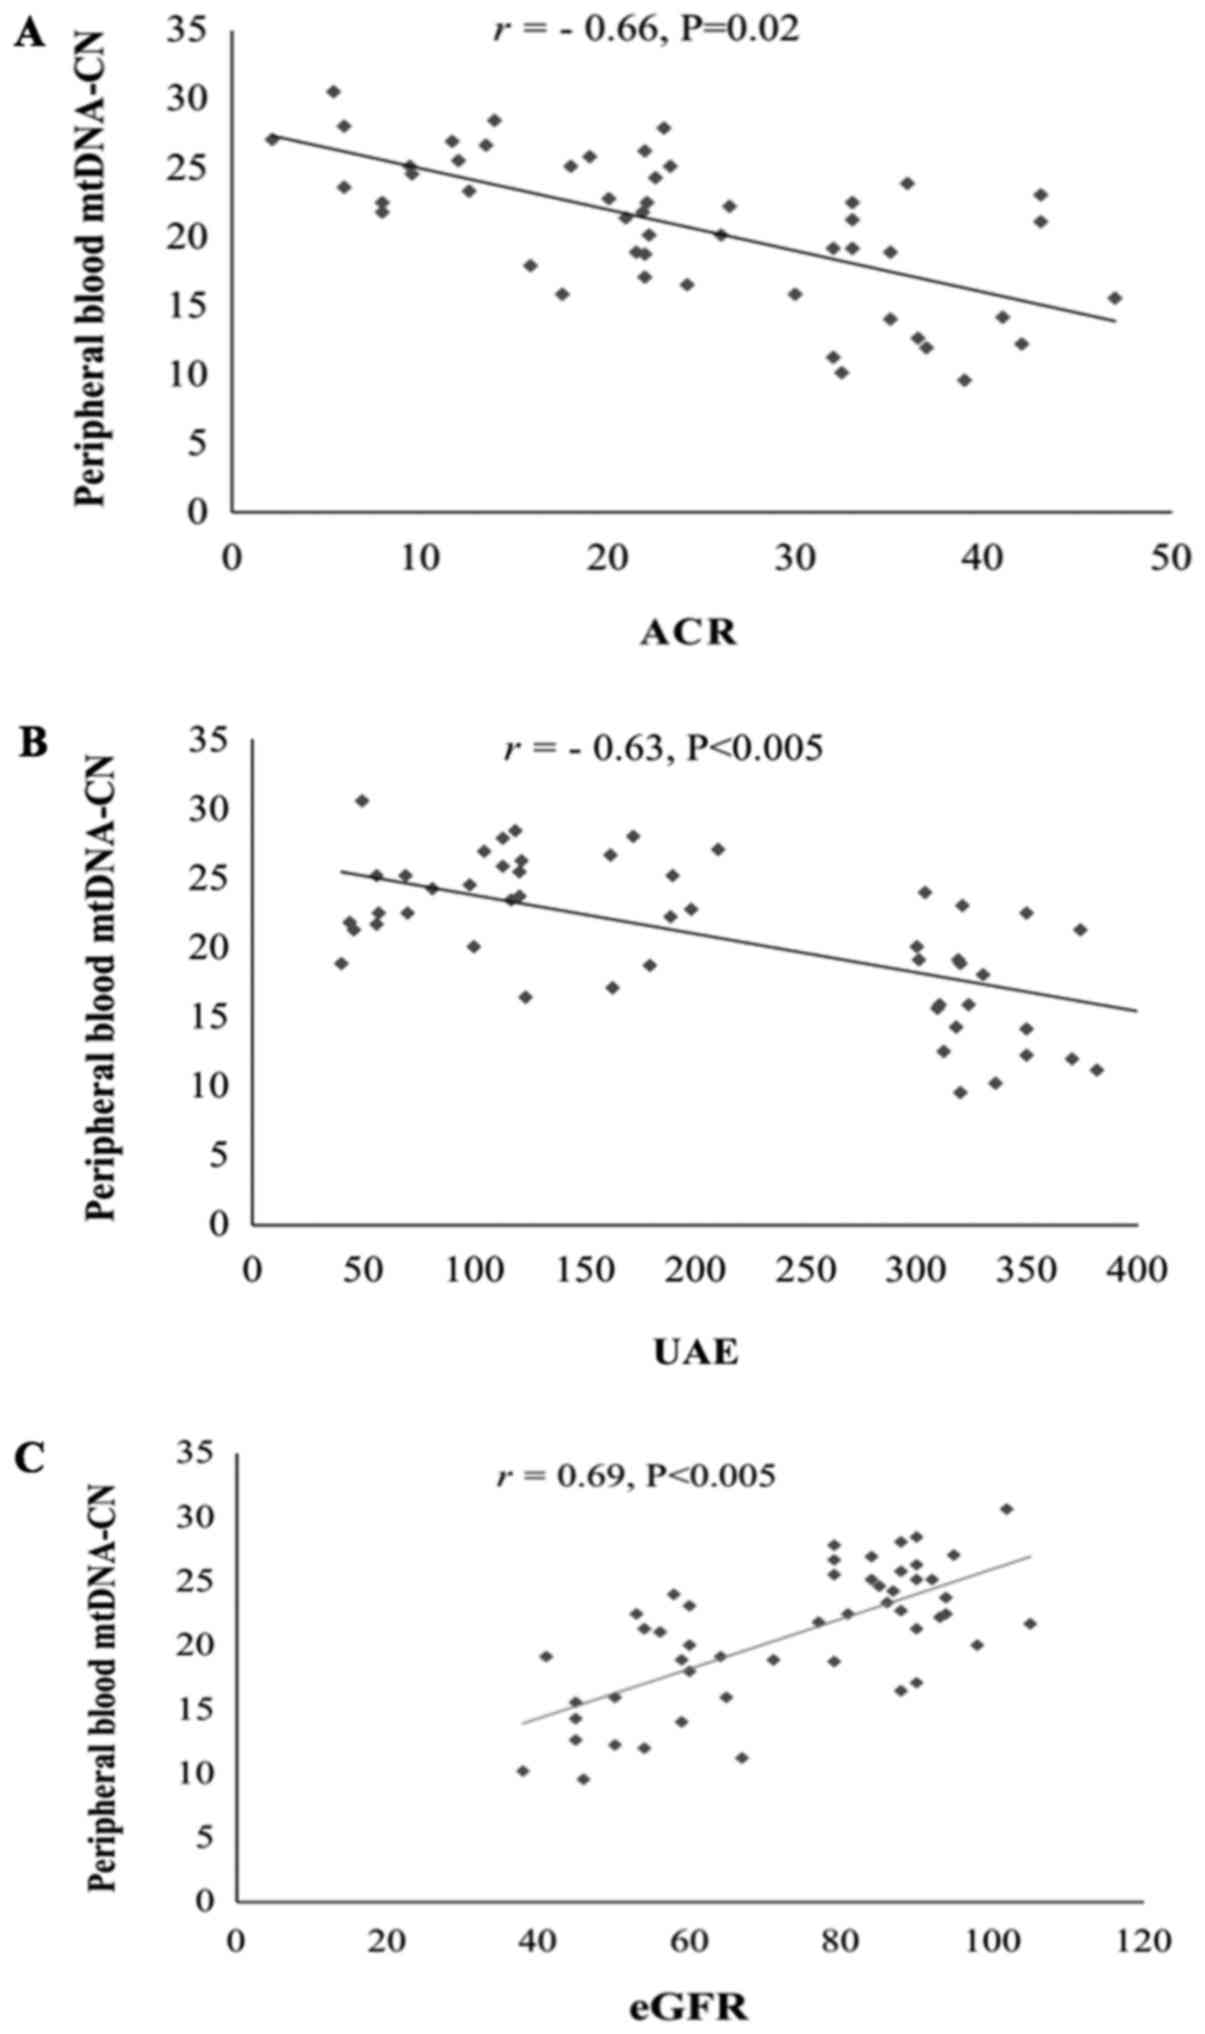
Regarding the kidney function parameters, the
results indicated that mtDNA-CN was negatively correlated with the
ACR (r=−0.66, P=0.02; Fig. 4A) and
urinary albumin excretion (UAE; r=−0.63, P<0.05; Fig. 4B), and was positively correlated with
the eGFR (r=0.69, P<0.05; Fig.
4C).
Regarding other clinical variables (Table IV), the mtDNA-CN was negatively
correlated with age (r=−0.32, P<0.05), mean blood pressure
(r=−0.22, P=0.021), FG (r=−0.25, P<0.05), HbA1c (r=−0.50,
P<0.05) and diabetes duration (r=−0.44, P<0.05), but was
positively correlated with the BMI (r=0.06, P<0.005). In
addition, the mtDNA-CN was negatively correlated with various lipid
profile parameters, including LDL (r=−0.31, P=0.034), triglycerides
(r=−0.53, P<0.05) and total cholesterol (r=−0.34,
P<0.05).
| Table IV.Correlation between peripheral blood
mtDNA-CN and clinical parameters of T2D patients with DN. |
Table IV.
Correlation between peripheral blood
mtDNA-CN and clinical parameters of T2D patients with DN.
| Parameter | r | P-value |
|---|
| Age | −0.32 | <0.01 |
| BMI | 0.06 | <0.01 |
| Mean blood
pressure | −0.22 | 0.021 |
| FG | −0.25 | <0.01 |
| HbA1c | −0.50 | <0.01 |
| Diabetes
duration | −0.44 | <0.01 |
| LDL | −0.31 | 0.034 |
| Triglycerides | −0.53 | <0.01 |
| Total
cholesterol | −0.34 | <0.01 |
Discussion
The earliest clinical indication of diabetic
nephropathy (DN) is microalbuminuria, which may progress over a
number of years (4-6 years) to macroalbuminuria (12). This results in a gradual decline in
glomerular filtration rate, eventually leading to end stage renal
disease (12). However, renal
impairment may occur prior to microalbuminuria in certain patients
with DN (15). Furthermore, ~20% of
patients with impaired renal function exhibit normoalbuminuria
(15). In the present study, T2D
patients without DN (with normoalbuminuria), DN patients with
microalbuminuria or macroalbuminuria, and non-diabetic healthy
controls were selected to investigate the potential of the mtDNA-CN
as a marker for DN. The mtDNA-CN was measured by qPCR in the
presence of calibration standards as the ratio between a target
mitochondrial gene and a reference nuclear gene (CYTB vs. B2M) in
blood samples from the subject groups.
Using qPCR, it was identified that the mtDNA-CN was
significantly decreased in the peripheral blood of DN patients
compared with that in T2D patients without DN and the controls.
Furthermore, the mtDNA-CN was progressively declined in patients
with higher levels of albuminuria, and was lower in the
macroalbuminuric group than in the microalbuminuric and
normoalbuminuric groups, suggesting an association between mtDNA-CN
and the severity of DN.
Consistent with the results of decreased peripheral
blood mtDNA-CN in the T2D patients of the present study, Lee et
al (22) determined low mtDNA-CN
in pre-diabetic patients who developed T2D after two years. Other
studies also indicated a decline in peripheral blood mtDNA-CN in
association with insulin resistance and insulin sensitivity
(23,24), as well as with the age at onset of
T2D (25). Decreased peripheral
blood mtDNA-CN was also reported in other diseases associated with
oxidative stress, including cancer and cardiovascular disease
(26,27).
While a previous study by Lee et al (31) demonstrated an association between
mtDNA-CN in the peripheral blood and the prevalence of
microalbuminuria in patients with chronic kidney disease, the
present study was the first to investigate the peripheral blood
mtDNA-CN in T2D patients with different levels of albuminuria, in
patients with T2D without DN and including normoalbuminuria, and
patients with DN with microalbuminuria and macroalbuminuria and its
link with the severity of DN.
Mitochondria, the major intracellular source of
energy and the major site of ROS generation, have their own DNA,
which encodes genes for proteins that are essential for normal
mitochondrial function (16). The
copy number of mtDNA reflects the abundance of mitochondria and may
change according to the cell's energy requirements, as well as the
physiological or environmental conditions (16,18). Due
to its close proximity to the sites of free radical generation in
the mitochondria, mtDNA is particularly vulnerable to oxidative
damage (17). The oxidative damage
to mtDNA may impair the electron transport system and results in a
decline in mitochondrial function, which in turn leads to enhanced
ROS production and further oxidative damage of mtDNA (17,32).
Mitochondrial dysfunction is central to the pathogenesis of
diabetes and its complications that include DN (7,8).
According to the conventional theory, hyperglycemia-induced
overproduction of mitochondrial ROS has a major role in diabetic
vascular complications (9,10). In vivo and in vitro
studies have indeed demonstrated that elevated ROS production and
increased oxidative damage of mtDNA are linked to the pathogenicity
and development of DN (33–35). Increased oxidative stress may have a
critical role in regulating the mtDNA-CN in stressed cells
(18). Although the mtDNA-CN may be
increased in response to initial oxidative stress to compensate for
damaged DNA (18,19), chronic oxidative stress decreases the
mtDNA-CN and increases mtDNA damage (18,21). A
previous study by our group identified a significant decrease in
renal mtDNA-CN and mitochondrial function in response to high
glucose-induced chronic oxidative stress (21). In the present study, decreased
peripheral blood mtDNA-CN was identified in DN patients, which was
correlated with the development DN. These results suggest that
decreased mtDNA-CN in the peripheral blood of DN patients may be a
consequence of diabetes-induced oxidative stress. In support of
this notion, previous studies have indicated that diabetic patients
with DN have higher oxidative stress than non-diabetic individuals
(36,37). Furthermore, a study by Zhou et
al (38) reported that reduced
peripheral blood mtDNA-CN as a result of hyperglycemia-induced
oxidative stress is closely associated with glucose-stimulated
insulin secretion in diabetic patients.
In recent years, activation of the immune system and
chronic inflammation have been proposed as novel pathways involved
in DN. Various inflammatory molecules, including chemokines,
adhesion molecules, pro-inflammatory cytokines and growth factors,
nuclear factors, as well as immune cells, including monocytes,
lymphocytes and macrophages, have been reported to have important
roles in DN (39). Altered
mitochondrial biology has been implicated in the development of
chronic systemic inflammation and impaired physiological function
(40). Inflammation-induced
mitochondrial dysfunction results in decreased oxidative
phosphorylation and increased oxidative stress (41). Furthermore, low mtDNA-CN has been
indicated to be linked with inflammation in aged individuals
(42).
For the study of mtDNA-CN, DNA is usually obtained
from peripheral blood mononuclear cells (PBMCs). However, platelet
contamination may lead to overestimation of mtDNA-CN measurements
in such samples (43). In addition,
it has been indicated that healthy individuals have more platelets
(14-90 times higher) than leukocytes in peripheral blood, and this
may affect the quantification of mtDNA-CN (44). It has been recently reported that not
taking the platelet/leukocyte ratio into account in whole-blood
measurements may lead to overestimation and misclassification if
interpreted as leukocyte mtDNA-CN (44). Therefore, most large-scale
epidemiological studies on genetic factors for common diseases have
used DNA from whole blood and not from PBMCs (45). Several studies have also used whole
blood to measure mtDNA-CN in variety of diseases, including T2D
(22) and cancer (46).
The present study evaluated the diagnostic value of
peripheral blood mtDNA-CN in DN using ROC analysis. The mtDNA-CN
was revealed to have an excellent value in determining DN, as
demonstrated by its ability to discriminate DN patients from T2D
patients and from healthy subjects with high sensitivity and
specificity. In addition, the mtDNA-CN displayed an excellent
ability in separating patients with microalbuminuria and
macroalbuminuria with good sensitivity and specificity.
Patients with T2D may remain undiagnosed for
numerous years and chronic diabetic complications may already be
present at the time of diagnosis (47,48). As
~40% of T2D patients are at risk of developing DN (2,3),
biomarkers for the early detection of DN are essential for the
timely management of the disease prior to its progression. Although
microalbuminuria has long been used as a clinical indicator of DN,
the test lacks specificity and accuracy as a predictive marker
(13–15). The present results clearly
demonstrated and provided the first evidence that the mtDNA-CN may
serve as a novel blood biomarker for DN.
Previous studies have reported the potential of
mtDNA-CN in the peripheral blood as a diagnostic biomarker for T2D
(49), and as a marker to predict
the clinical outcomes of patients with ESRD (50). A recent study by Mishra et al
(51) also suggested that a
decreased mtDNA-CN in the peripheral blood is a potential biomarker
for diabetic retinopathy.
The results of the present study further confirmed
the association between the mtDNA-CN and DN. As demonstrated by
multivariate logistic regression analysis, the mtDNA-CN was
significantly and independently associated with the occurrence and
the development of DN even after adjustment for several variables,
including age, mean blood pressure, HbA1c and total cholesterol. As
hyperglycemia, hypertension and hyperlipidemia are well-established
risk factors for DN progression (52,53), the
present results indicate that decreased mtDNA-CN in DN patients is
an independent risk factor for DN.
In the Pearson's correlation coefficient analysis
performed on T2D patients with DN in the present study, the
mtDNA-CN was identified to be negatively correlated with kidney
function parameters, including ACR, UAE rate and serum creatinine,
and positively correlated with the eGFR. In addition, the mtDNA-CN
was negatively correlated with age, mean blood pressure, glycemic
parameters (FG, HbA1c and diabetes duration) and lipid parameters
(LDL, triglycerides and total cholesterol). These results suggest
an association of decreased mtDNA-CN with the decline in renal
function and the progression of DN.
In conclusion, the results of the present study
suggest that mtDNA-CN may serve as a novel blood biomarker for the
early diagnosis of DN and that decreased mtDNA-CN is another risk
factor for DN. These results may be of importance in the aspect of
preventive medicine, and further validation in a larger cohort is
required.
Acknowledgements
The authors would like to thank the technical staff
at the Department of Molecular Medicine and the Al-Jawhara Centre
for Molecular Medicine, Genetics and Inherited Disorders, College
of Medicine and Medical Sciences, (Arabian Gulf University, Kingdom
of Bahrain) for their assistance.
Funding
This work was supported by the College of Medicine
and Medical Sciences, Arabian Gulf University, Kingdom of Bahrain
(grant no. 81).
Availability of data and materials
The datasets used and/or analyzed during the current
study are available from the corresponding author on reasonable
request.
Authors' contributions
GA developed the project and edited the manuscript;
AA, AK and MB collected the data; and all authors performed data
analysis, managed the data and wrote the manuscript. The final
version of the manuscript has been read and approved by all
authors, and each author believes that the manuscript represents
honest work.
Ethical approval and consent to
participate
All subjects provided written informed consent. The
study received ethical approval from the Research and Ethics
Committee of the College of Medicine and Medical Sciences (Arabian
Gulf University, Manama, Kingdom of Bahrain).
Consent for publication
Not applicable.
Competing interests
The authors declare that they have no competing
interests.
References
|
1
|
Wild S, Roglic G, Green A, Sicree R and
King H: Global prevalence of diabetes: Estimates for the year 2000
and projections for 2030. Diabetes Care. 27:1047–1053. 2004.
View Article : Google Scholar : PubMed/NCBI
|
|
2
|
Ghaderian SB, Hayati F, Shayanpour S and
Mousavi SSB: Diabetes and end-stage renal disease; a review article
on new concepts. J Renal Inj Prev. 4:28–33. 2015.PubMed/NCBI
|
|
3
|
Ritz E and Orth SR: Nephropathy in
patients with type 2 diabetes mellitus. N Engl J Med.
341:1127–1133. 1999. View Article : Google Scholar : PubMed/NCBI
|
|
4
|
Remuzzi G and Ruggenenti P: Slowing the
progression of diabetic nephropathy. N Engl J Med. 329:1496–1497.
1993. View Article : Google Scholar : PubMed/NCBI
|
|
5
|
Nathan DM, Bayless M, Cleary P, Genuth S,
Gubitosi-Klug R, Lachin JM, Lorenzi G and Zinman B: DCCT/EDIC
Research Group; Diabetes control and complications
trial/epidemiology of diabetes interventions and complications
study at 30 years: Advances and contributions. Diabetes.
62:3976–3985. 2013. View Article : Google Scholar : PubMed/NCBI
|
|
6
|
Implications of the diabetes control
complications trial. American diabetes association. Diabetes.
42:1555–1558. 1993. View Article : Google Scholar : PubMed/NCBI
|
|
7
|
Forbes JM, Coughlan MT and Cooper ME:
Oxidative stress as a major culprit in kidney disease in diabetes.
Diabetes. 57:1446–1454. 2008. View Article : Google Scholar : PubMed/NCBI
|
|
8
|
Sivitz WI and Yorek MA: Mitochondrial
dysfunction in diabetes: From molecular mechanisms to functional
significance and therapeutic opportunities. Antioxid Redox Signal.
12:537–577. 2010. View Article : Google Scholar : PubMed/NCBI
|
|
9
|
Nishikawa T, Edelstein D, Du X L,
Yamagishi S, Matsumura T, Kaneda Y, Yorek MA, Beebe D, Oates PJ,
Hammes HP, et al: Normalizing mitochondrial superoxide production
blocks three pathways of hyperglycaemic damage. Nature.
404:787–790. 2000. View
Article : Google Scholar : PubMed/NCBI
|
|
10
|
Brownlee M: Biochemistry and molecular
cell biology of diabetic complications. Nature. 414:813–820. 2001.
View Article : Google Scholar : PubMed/NCBI
|
|
11
|
Arora MK and Singh UK: Molecular
mechanisms in the pathogenesis of diabetic nephropathy: An update.
Vascul Pharmacol. 58:259–271. 2013. View Article : Google Scholar : PubMed/NCBI
|
|
12
|
Parving HH, Smidt UM, Friisberg B,
Bonnevie-Nielsen V and Andersen AR: A prospective study of
glomerular filtration rate and arterial blood pressure in
insulin-dependent diabetics with diabetic nephropathy.
Diabetologia. 20:457–461. 1981. View Article : Google Scholar : PubMed/NCBI
|
|
13
|
Maclsaac RJ, Ekinici E and Jerums G:
Progressive diabetic nephropathy. How useful is microalbuminuria?
Contra'. Kidney Int. 86:50–57. 2014.
|
|
14
|
Glassock RJ: Is the presence of
microalbuminuria a relevant marker of kidney disease? Curr
Hypertens Rep. 12:364–368. 2010. View Article : Google Scholar : PubMed/NCBI
|
|
15
|
Rigalleau V, Lasseur C, Raffaitin C,
Beauvieux MC, Barthe N, Chauveau P, Combe C and Gin H:
Normoalbuminuric renal-insufficient diabetic patients. Diabetes
Care. 30:2034–2039. 2007. View Article : Google Scholar : PubMed/NCBI
|
|
16
|
Clay-Montier LL, Deng JJ and Bai Y: Number
matters: Control of mammalian mitochondrial DNA copy number. J
Genet Genomics. 36:125–131. 2009. View Article : Google Scholar : PubMed/NCBI
|
|
17
|
Santos JH, Hunakova L, Chen Y, Bortner C
and Van Houten B: Cell sorting experiments link persistent
mitochondrial DNA damage with loss of mitochondrial membrane
potential and apoptotic cell death. J Biol Chem. 278:1728–1734.
2003. View Article : Google Scholar : PubMed/NCBI
|
|
18
|
Lee HC and Wei YH: Mitochondrial
biogenesis and mitochondrial DNA maintenance of mammalian cells
under oxidative stress. Int J Biochemy and Cell Biol. 37:822–834.
2005. View Article : Google Scholar
|
|
19
|
Al-Kafaji G and Golbahar J: High
glucose-induced oxidative stress increases the copy number of
mitochondrial DNA in human mesangial cells. Biomed Res Int.
2013:7549462013. View Article : Google Scholar : PubMed/NCBI
|
|
20
|
Al-Kafaji G, Sabry MA and Bakhiet M:
Increased expression of mitochondrial DNA-encoded genes in human
renal mesangial cells in response to high glucose-induced reactive
oxygen species. Mol Med Rep. 13:1774–1780. 2016. View Article : Google Scholar : PubMed/NCBI
|
|
21
|
Al-Kafaji G, Sabry MA and Skrypnyk C:
Time-course effect of high glucose-induced reactive oxygen species
on mitochondrial biogenesis and function in human renal mesangial
cells. Cell Biol Int. 40:36–48. 2016. View Article : Google Scholar : PubMed/NCBI
|
|
22
|
Lee H, Song JH, Shine CS, Park DJ, Park
KS, Lee KU and Koh CS: Decreased mitochondrial DNA content in
peripheral blood precedes the development of non-insulin-dependent
diabetes mellitus. Diabetes Res Clin Pract. 42:161–167. 1998.
View Article : Google Scholar : PubMed/NCBI
|
|
23
|
Gianotti TF, Sookoian S, Dieuzeide G,
Garcia S, Gemma C, González CD and Pirola CJ: A decreased
mitochondrial DNA content is related to insulin resistance in
adolescents. Obesity (Silver Spring). 16:1591–1595. 2008.
View Article : Google Scholar : PubMed/NCBI
|
|
24
|
Song J, Oh JY, Sung YA, Pak YK, Park KS
and Lee HK: Peripheral blood mitochondrial DNA content is related
to insulin sensitivity in offspring of type 2 diabetic patients.
Diabetes Care. 24:865–869. 2001. View Article : Google Scholar : PubMed/NCBI
|
|
25
|
Xu FX, Zhou X, Shen F, Pang R and Liu SM:
Decreased peripheral blood mitochondrial DNA content is related to
HbA1c, fasting plasma glucose level and age of onset in type 2
diabetes mellitus. Diabet Med. 29:e47–e54. 2012. View Article : Google Scholar : PubMed/NCBI
|
|
26
|
Hu L, Yao X and Shen Y: Altered
mitochondrial DNA copy number contributes to human cancer risk:
Evidence from an updated meta-analysis. Sci Rep. 6:358592016.
View Article : Google Scholar : PubMed/NCBI
|
|
27
|
Liu LP, Cheng K, Ning MA, Li HH, Wang HC,
Li F, Chen SY, Qu FL and Guo WY: Association between peripheral
blood cells mitochondrial DNA content and severity of coronary
heart disease. Atherosclerosis. 261:105–110. 2017. View Article : Google Scholar : PubMed/NCBI
|
|
28
|
Alberti KG and Zimmet PZ: Definition,
diagnosis and classification of diabetes mellitus and its
complications. Part 1: Diagnosis and classification of diabetes
mellitus provisional report of a WHO consultation. Diabet Med.
15:539–553. 1998.
|
|
29
|
Mattix HJ, Hsu CY, Shaykevich S and Curhan
G: Use of the albumin/creatinine ratio to detect microalbuminuria:
Implications of sex and race. J Am Soc Nephrol. 13:1034–1039.
2002.PubMed/NCBI
|
|
30
|
Stoves J, Lindley EJ, Barnfield MC,
Burniston MT and Newstead CG: MDRD equation estimates of glomerular
filtration rate in potential living kidney donors and renal
transplant recipients with impaired graft function. Nephrol Dial
Transplant. 17:2036–2037. 2002. View Article : Google Scholar : PubMed/NCBI
|
|
31
|
Lee JE, Park H, Ju YS, Kwak M, Kim J, Oh
HY and Seo JS: Higher mitochondrial DNA copy number is associated
with lower prevalence of microalbuminuria. Exp Mol Med. 41:253–258.
2009. View Article : Google Scholar : PubMed/NCBI
|
|
32
|
Ide T, Tsutsui H, Hayashidani S, Kang D,
Suematsu N, Nakamura K, Utsumi H, Hamasaki N and Takeshita A:
Mitochondrial DNA damage and dysfunction associated with oxidative
stress in failing hearts after myocardial infarction. Circ Res.
88:529–535. 2001. View Article : Google Scholar : PubMed/NCBI
|
|
33
|
Catherwood MA, Powell LA, Anderson P,
McMaster D, Sharpe PC and Trimble ER: Glucose-induced oxidative
stress in mesangial cells. Kidney Int. 61:599–608. 2002. View Article : Google Scholar : PubMed/NCBI
|
|
34
|
Ha H and Lee HB: Reactive oxygen species
amplify glucose signalling in renal cells cultured under high
glucose and in diabetic kidney. Nephrology (Carlton). 10
Suppl:S7–S10. 2005. View Article : Google Scholar : PubMed/NCBI
|
|
35
|
Kakimoto M, Inoguchi T Sonta T, Yu HY,
Imamura M, Etoh T, Hashimoto T and Nawata H: Accumulation of
8-hydroxy-2-deoxyguanosine and mitochondrial DNA deletion in kidney
of diabetic rats. Diabetes. 51:1588–1595. 2002. View Article : Google Scholar : PubMed/NCBI
|
|
36
|
Pan HZ, Zhang L, Guo MY, Sui H, Li H, Wu
WH, Qu NQ, Liang MH and Chang D: The oxidative stress status in
diabetes mellitus and diabetic nephropathy. Acta Diabetol. 47 Suppl
1:S71–S76. 2010. View Article : Google Scholar
|
|
37
|
Inci A, Olmaz R, Sarı F, Coban M, Ellidag
HY and Sarıkaya M: Increased oxidative stress in diabetic
nephropathy and its relationship with soluble Klotho levels.
Hiprokratia. 20:198–203. 2016.
|
|
38
|
Zhou M, Zhu L, Cui X, Feng L, Zhao X, He
S, Ping F, Li W and Li Y: Reduced peripheral blood mtDNA content is
associated with impaired glucose-stimulated islet β cell function
in a Chinese population with different degrees of glucose
tolerance. Diabetes Metab Res Rev. 32:768–774. 2016. View Article : Google Scholar : PubMed/NCBI
|
|
39
|
Duran-Salgado MB and Rubio-Guerra AF:
Diabetic nephropathy and inflammation. World J Diabetes. 5:393–398.
2014. View Article : Google Scholar : PubMed/NCBI
|
|
40
|
Cherry AD and Piantadosi CA: Regulation of
mitochondrial biogenesis and its intersection with inflammatory
responses. Antioxid Redox Signal. 22:965–976. 2015. View Article : Google Scholar : PubMed/NCBI
|
|
41
|
Chawla A, Nguyen KD and Goh YP:
Macrophage-mediated inflammation in metabolic disease. Nat Rev
Immunol. 11:738–749. 2011. View Article : Google Scholar : PubMed/NCBI
|
|
42
|
Wu IC, Lin CC, Liu CS, Hus CC, Chen CY and
Hsiung CA: Interrelations between mitochondrial DNA copy number and
inflammation in older adults. J Gerontol A Biol Sci Med Sci.
72:937–944. 2017. View Article : Google Scholar : PubMed/NCBI
|
|
43
|
Cossarizza A: Tests for mitochondrial
function and DNA: Potentials and pitfalls. Curr Opin Infect Dis.
16:5–10. 2003. View Article : Google Scholar : PubMed/NCBI
|
|
44
|
Hurtado-Roca Y, Ledesma M, Gonzalez-Lazaro
M, Moreno-Loshuertos R, Fernandez-Silva P, Enriquez JA and
Laclaustra M: Adjusting MtDNA quantification in whole blood for
peripheral blood platelet and leukocyte counts. PLoS One.
11:e01637702016. View Article : Google Scholar : PubMed/NCBI
|
|
45
|
Steinberg K, Beck J, Nickerson D,
Garcia-Closas M, Gallagher M, Caggana M, Reid Y, Cosentino M, Ji J,
Johnson D, et al: DNA banking for epidemiologic studies: A review
of current practices. Epidemiology. 13:246–254. 2002. View Article : Google Scholar : PubMed/NCBI
|
|
46
|
Xia P, An H-X, Dang C-X, Radpour R, Kohler
C, Fokas E, Engenhart-Cabillic R, Holzgreve W and Zhong XY:
Decreased mitochondrial DNA content in blood samples of patients
with stage I breast cancer. BMC Cancer. 9:4542009. View Article : Google Scholar : PubMed/NCBI
|
|
47
|
Demmer RT, Zuk AM, Rosenbaum M and
Desvarieux M: Prevalence of diagnosed and undiagnosed type 2
diabetes mellitus among US adolescents: Results from the continuous
NHANES, 1999-2010. Am J Epidemiol. 178:1106–1113. 2013. View Article : Google Scholar : PubMed/NCBI
|
|
48
|
Gedebjerg A, Almdal TP, Berencsi K, Rungby
J, Nielsen JS, Witte DR, Friborg S, Brandslund I, Vaag A,
Beck-Nielsen H, et al: Prevalence of micro- and macrovascular
diabetes complications at time of type 2 diabetes diagnosis and
associated clinical characteristics: A cross-sectional baseline
study of 6,958 patients in the Danish DD2 cohort. J Diabetes
Complications. 32:34–40. 2018. View Article : Google Scholar : PubMed/NCBI
|
|
49
|
Cho SB, Koh I, Nam HY, Jeon JP, Lee HK and
Han BG: Mitochondrial DNA copy number augments performance of A1C
and oral glucose tolerance testing in the prediction of type 2
diabetes. Sci Rep. 7:432032017. View Article : Google Scholar : PubMed/NCBI
|
|
50
|
Rao M, Li L, Demello C, Guo D, Jaber BL,
Pereira BJ and Balakrishnan VS: HEMO Study Group; Mitochondrial DNA
injury and mortality in hemodialysis patients. J Am Sco Nephrol.
20:189–196. 2009. View Article : Google Scholar
|
|
51
|
Mishra M, Lillvis J, Seyoum B and Kowluru
RA: Peripheral blood mitochondrial DNA damage as a potential
noninvasive biomarker of diabetic retinopathy. Invest Ophthalmol
Vis Sci. 57:4035–4044. 2016. View Article : Google Scholar : PubMed/NCBI
|
|
52
|
Jayakumar RV: Risk factors in diabetic
nephropathy. Int J Diabetes Dev Ctries. 32:1–3. 2012. View Article : Google Scholar
|
|
53
|
Unsal A, Koc Y, Basturk T, Akgun AO,
Sakaci T and Ahbap E: Risk factors for progression of renal disease
in patient with diabetic nephropathy. Eur Rev Med Pharmacol Sci.
16:878–883. 2012.PubMed/NCBI
|