Introduction
It has been established that acute thromboembolic
(AT) events, including acute coronary syndrome (ACS) (1), cerebral arterial thrombosis, pulmonary
embolism and deep venous thrombosis are among the most common
causes of morbidity and mortality worldwide, particularly in
elderly patients (2). AT events may
disturb the blood supply for vital organs and subsequent ischemia
of the organs may cause systemic dysfunction or even mortality
(3). Numerous factors contribute to
the complex pathogenesis of AT, including endothelial injury and
dysfunction, platelet activation, over-activation of the
coagulation system, blood stasis, and hypercoagulability (4,5).
Imbalance of coagulation and hemorrhage may also be
an underlying cause of AT. Non-steroidal anti-inflammatory drugs
(NSAIDs) are a class of medications that provide analgesic and
antipyretic effects, and exhibit anti-inflammatory effects when
administered at higher doses (6).
NSAIDs are widely used for the treatment of various conditions,
primarily cardiovascular events and rheumatic disorders (7). Gastrointestinal bleeding (GIB) is an
adverse side effect that is common to all classes of NSAIDs
(8). In clinical practice, cases of
AT have been observed among patients with NSAID-induced GIB
(3). Previous studies have indicated
that patients with NSAID-induced GIB, particularly those with ACS
or stroke comorbidities who frequently take aspirin, are at a
higher risk of developing AT (9,10).
Furthermore, patients with ACS who suffered from GIB are at a
significantly increased risk of fatal myocardial infarction
(11). The incidence of
NSAID-induced GIB has been reported to be increasing progressively,
likely due to an increasing number of prescriptions for
antiplatelet medications, including aspirin, for the primary and
secondary prevention of cardiovascular and cerebrovascular diseases
(12). Therefore, it may be
hypothesized that the frequency of AT in patients with
NSAID-induced GIB is likely to also increase, which could make it
challenging to balance hemostatic and anticoagulant therapy.
Furthermore, patients with NSAID-induced GIB who have also suffered
from an AT event tend to have worse prognosis (3), which highlights the importance of AT
prevention in patients with NSAID-induced GIB.
Early identification of patients with NSAID-induced
GIB who are at a higher risk of AT is of clinical significance for
the prevention of fatal cardiovascular events. Although certain
previous studies have been performed to assess AT in patients with
NSAID-induced GIB (13,14), recent studies with parameters derived
from novel hemostatic and anticoagulant testing are rare.
Thromboelastography (TEG) is a novel tool used to monitor the
hemostatic and anticoagulant condition of the body in real time,
which may also serve as a guide for the adjustment of the dose of
anti-thrombosis medications. The present study aimed to evaluate
the clinical parameters to predict the occurrence of AT in a cohort
of patients with NSAID-induced GIB, with an emphasis on TEG-derived
parameters. The results of the present study may provide novel
evidence to aid in the prevention of AT events in patients with
NSAID-induced GIB.
Patients and methods
Study design, setting and
participants
A retrospective propensity score matching (PSM)
study was conducted to evaluate the incidence of AT events and
associated risk factors in patients with NSAID-induced GIB.
Patients were included if the following criteria were met: i) Age
≥60 years; ii) Chinese nationality; iii) taking NSAIDs; iv)
outpatients with onset of GIB and patients hospitalized with GIB;
and v) clinically and/or endoscopically verified GIB. Patients were
excluded if they were: i) <60 years old; ii) not taking NSAIDs;
iii) bleeding from varicose veins, gastrointestinal tumors,
vascular malformations or diverticula; iv) taking a combination of
anticoagulants and other antiplatelet drugs (including
Rivaroxaban); v) unable to consent to participation. The study
participants included 928 patients >60 years of age who were
diagnosed with NSAID-associated GIB at the Xuanwu Hospital in
Beijing from January 2007 to January 2017. Patients were further
grouped according to whether they developed AT during
hospitalization, including 98 patients with AT and 930 patients
without AT. Events of AT were diagnosed as ACS, cerebral embolism
and venous thrombosis. Seven types of NSAIDs were used in the
present study, including aspirin, ibuprofen, indomethacin,
diclofenac, loxoprofen, meloxicam and celecoxib. However, aspirin,
also known as the acetylsalicylic acid, accounted for 90% of all
NSAIDs used. Since aspirin serves an important role in the primary
and secondary prevention of cardiovascular and cerebrovascular
diseases, it has become the most widely used NSAID (15). Data were collected from electronic
case systems. This study was approved by the Ethics Committee of
Xuanwu Hospital. The patients signed informed consent to be
included.
Data sources and assessment
The diagnosis of GIB was defined as a gastric,
duodenal, peptic or gastrojejunal ulcer with hemorrhage or
perforation [International Classification of Diseases (ICD)-10
category codes K250, K251, K252, K254, K255, K256, K260, K261,
K262, K264, K265, K266, K270, K271, K272, K274, K275, K276, K280,
K281, K282, K284, K285, K286], acute hemorrhagic gastritis (K290),
hematemesis (K920), melena (K921) or unspecified GI hemorrhage
(K922). AT events were defined as ACS [including acute myocardial
infarction (AMI; ICD-10 I21) and unstable angina (UA; ICD-10 I20)],
cerebral infarction (I63) or venous thrombosis (I26, I80.2).
Information was collected regarding the following potentially
relevant factors: Age, sex, history of cardiovascular and
cerebrovascular diseases (including coronary heart disease,
myocardial infarction, cerebral hemorrhage and cerebral
thrombosis), Acute Physiology and Chronic Health Evaluation
(APACHE) II score, hemoglobin, D-dimer, fibrinogen (Fib) and
platelet (PLT) levels, PLT aggregation test (pAgt) results, and
blood coagulation values [including reaction time (R value),
coagulation forming time (K value), solidification angle, maximum
amplitude (MA) and coagulation index (CI)]. Incidence of AT was the
primary outcome, including the incidence of ACS, cerebral
infarction or venous thrombosis.
TEG measurement
Venous blood samples (2-3 ml) were obtained from all
participants in a fasted state for routine blood, coagulation and
platelet aggregation tests, and TEG detection. All tests were
completed within 2 h after blood collection. The TEG test was
performed in a blinded fashion by an experienced technician in the
Department of Clinical Laboratory of Xuanwu Hospital using a
Thrombelastograph® Hemostasis Analyzer System and its
supporting reagents (Kaolin, Calcium Chloride, Rapid TEG™ Reagent
and Heparinase; Haemonetics Corporation, Braintree, MA, USA)
according to the manufacturer's protocol. The parameters derived
from TEG were presented as follows: The abscissa represented time
(min) and the ordinate represented the amplitude (mm). TEG results
provided data that reflected the ex vivo coagulation
function, including the five parameters (R value, K value,
Solidification angle, MA value and CI value) described below. The R
value (min) was used to determine the time required to detect the
formation of fibrin (2 mm curve) from the start of sample
detection. The normal values range from 5-10 min and reflect the
combined effects of all clotting factors in the coagulation
process, including the endogenous and exogenous coagulation
pathways. The R value increases in the presence of anticoagulant
drugs, in the absence of coagulation factors or when the levels of
fibrin in the blood serum are low. Conversely, the R value
decreases in a state of hypercoagulability. The normal K values
range from 1-3 min from the end of R to a curve amplitude of 20 mm.
The K value is determined based on the interaction of Fib and PLT
in the formation of blood clot. It reflects the rate of blood clot
formation. Anticoagulants that affect PLT and Fib function
increases the K value. Solidification angle is the angle between
the horizontal line and the tangent line from the formation point
of the blood clot to the maximum curve. A normal solidification
angle value falls between 53-72° and the formation rate of blood
clots is primarily affected by PLT and Fib levels. MA (mm) reflects
the maximum strength and the stability of blood clots. A normal MA
value is between 50-70 mm and is mainly affected by PLT and Fib
levels. CI aids in evaluating the coagulation process. Normal CI
values range between −3 and +3. A CI value <-3 is considered a
low coagulation state, whereas a CI value >+3 is considered a
high coagulation state.
Statistical analysis
Continuous variables with normal distribution were
presented as the mean ± standard deviation. For continuous
variables with a skewed distribution, the median and interquartile
range were used. An independent t-test or Mann-Whitney U test were
applied for continuous variables with normal or skewed
distribution. Categorical variables were presented as the number
(percentage) and a chi-square test was used for the analysis.
Considering the impact of potential confounding factors and
selection bias in the present study, PSM was used at a ratio of 1:3
between the AT group and the non-AT group. Age-, sex- and history
of cardiovascular disease-matched PSM was applied to derive the
cohort. Nonrandom package (V1.42) of R-3.3.3 (www.r-project.org) was used to implement propensity
matching. Multivariate logistic regression analysis was used to
extract risk factors associated with AT and the results were
presented as an odds ratio (OR) with 95% confidence intervals. The
Mean Decrease Gini (MDG) coefficients from a random forest
algorithm were used to rank the important indexes associated with
AT. MDG scores provide a method to quantify the contribution of
each index to the classification accuracy. A greater MDG value
indicated that the degree of impurity arising from a category could
be reduced the most by a single variable, and, therefore, suggested
an important associated index. Statistical analysis was performed
using SPSS software (version 17.0; SPSS, Inc., Chicago, IL, USA)
and the randomForest package (V4.6-12) of R software. All
statistical tests were two-sided and P<0.05 was considered to
indicate a statistically significant difference.
Results
Baseline patient data
Patients in the AT group were between 60 and 93
years old (75.04±6.35 years of age) with 66 males (67.3%) and 32
females (32.7%). Patients in the non-AT group were between 60 to 95
years old (71.75±7.77 years of age), with 497 males (59.9%) and 333
females (40.1%) (Table I). Among the
98 patients with AT, 30 patients were diagnosed with AMI (30.6%),
34 with UA (34.7%), 28 with cerebral infarction (28.6%) and six
with venous thrombosis (6.1%). Patients in the AT group exhibited
an increased prevalence of cerebrovascular disease history, as well
as increased APACHE II scores, D-dimer, Fib, PLT and PLT
aggregation levels, solidification angle, MA and CI, and decreased
hemoglobin levels, and R and K values compared with the non-AT
group.
 | Table I.Baseline patient data in the AT and
the non-AT groups. |
Table I.
Baseline patient data in the AT and
the non-AT groups.
| Characteristic | AT group
(n=98) | Non-AT group
(n=830) |
|---|
| Age (years) | 75.04±6.35 | 71.75±7.77 |
| Male | 66 (67.3) | 497 (59.9) |
| History of
cardiovascular and cerebrovascular diseases | 91 (92.9) | 665 (80.1) |
| APACHE II
score | 26 (24-28) | 23 (21-24) |
| Hemoglobin
(g/l) | 72.33±9.50 | 79.64±8.03 |
| D-dimer
(ug/ml) | 2.25
(1.29-3.13) | 0.95
(0.26-1.20) |
| Fibrinogen
(mg/dl) | 3.37
(3.10-3.94) | 2.68
(2.11-3.13) |
| PLT (×109/l) | 196.49±62.13 | 194.97±60.74 |
| pAgt (%) | 68 (63-73) | 57 (53-60) |
| R value (min) | 5.1 (4.6-5.7) | 6.4 (5.8-6.9) |
| K value (min) | 1.6 (1.2-2.0) | 2.4 (1.8-2.9) |
| Solidification
angle (°) | 70.5
(69.0-71.6) | 57.5
(53.1-61.2) |
| MA (mm) | 64.0
(60.1-68.1) | 55.2
(50.9-59.7) |
| CI | 0.55
(0.10-1.13) | −0.84
(−1.82-0.60) |
PSM
PSM for the AT group to the non-AT group was used at
a ratio of 1:3, respectively. The matched variables were age, sex
and history of cerebrovascular disease. The sex was balanced
(χ2=2.048; P=0.152), while the age (χ2=4.038;
P<0.001) and history of cerebrovascular disease
(χ2=9.417; P<0.002) were not (data not shown).
Following PSM, there were 98 cases in the AT group and 294 cases in
the non-AT group, who were balanced in terms of age, sex and
history of cerebrovascular disease (Table II).
| Table II.Comparisons of the matching variables
following propensity score matching (%). |
Table II.
Comparisons of the matching variables
following propensity score matching (%).
| Variable | AT group
(n=98) | Non-AT group
(n=294) | t-value or χ2 | P-value |
|---|
| Age (years) | 75.04±6.35 | 75.04±6.78 | 0.000 (t) | 1.000 |
| Male | 66 (67.3) | 197 (67.0) | 0.004 (χ2) | 0.951 |
| Cerebrovascular
disease history | 91 (92.9) | 273 (92.9) | 0.000 (χ2) | 1.000 |
Comparison of important indexes
between groups
The R and K values of the AT group were
significantly lower compared with the non-AT group (both
P<0.001), while the solidification angle, MA and CI
significantly increased compared with the non-AT group (all
P<0.001). In the AT group, the D-dimer levels, pAgt results, Fib
levels and APACHE II scores were significantly increased (all
P<0.001), while hemoglobin levels were significantly lower
compared with the non-AT group (P<0.001). There was no
difference in the number of PLTs between the two groups (P=0.898;
Table III). The comparison of the
solidification angle, R value, D-dimer levels and pAgt results
between the two groups was presented in Fig. 1.
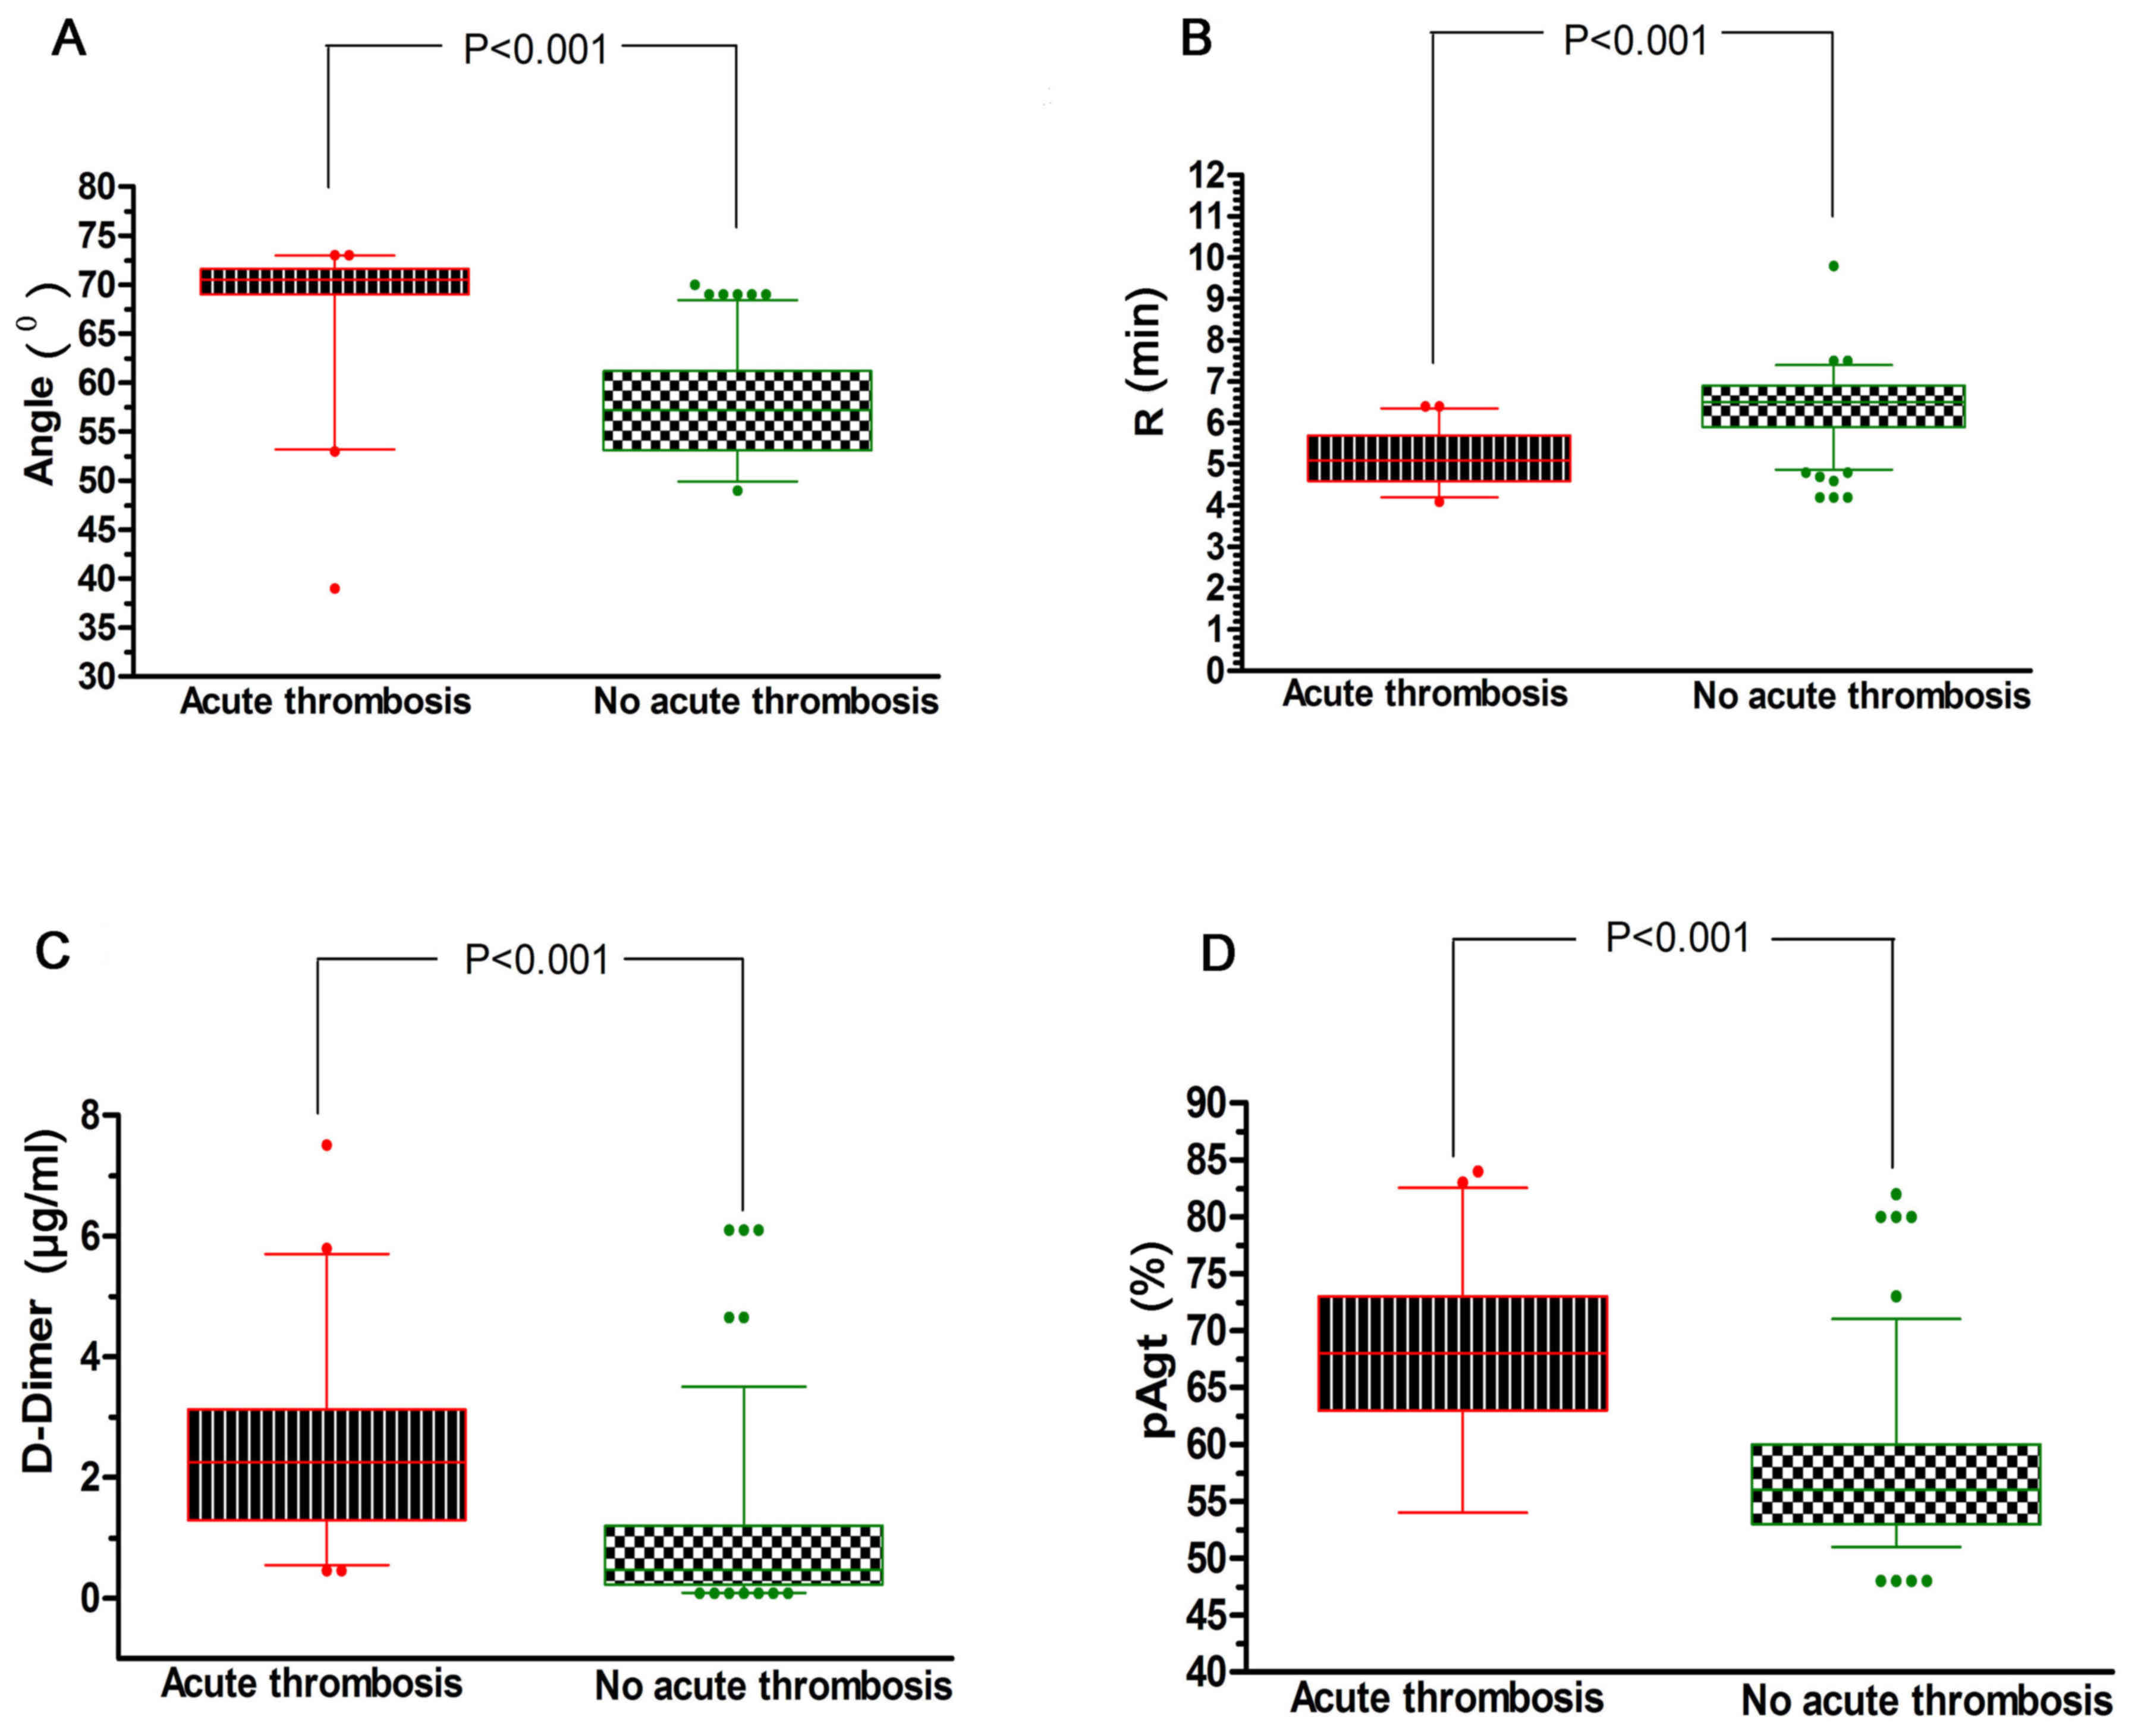 | Figure 1.Comparison of TEG indexes and
coagulation function between AT and non-AT groups. (A) The TEG
solidification angle of the AT group was 70.5 (69.0-71.6),
significantly higher compared with the non-AT group 57.2
(53.1-61.2), which indicated a rapid formation of blood clots in
the AT group. (B) The TEG R value of the AT group was 5.1
(4.6-5.7), significantly lower compared with the non-AT group 6.5
(5.9-6.9), which reflected the short time required for the
formation of fibrin in the blood sample and a high coagulation
state compared with the non-AT group. (C) The D-dimer value of the
AT group was 2.25 (1.29-3.13), significantly higher compared with
the non-AT group (0.47; 0.23-1.30), indicating that the AT group
was more vulnerable to thrombosis compared with the non-AT group.
(D) The pAgt value of the AT group was 68 (63–73), significantly
increased compared with the non-AT group at 56 (53–60), indicating
that the AT group was more likely to exhibit platelet aggregation
promoting the formation of blood clots. TEG, thromboelastography;
AT, acute thromboembolism; R value, reaction time; pAgt, platelet
aggregation test; angle, solidification angle. |
| Table III.Index comparisons between the AT and
non-AT groups. |
Table III.
Index comparisons between the AT and
non-AT groups.
| Index | AT group
(n=98) | Non-AT (n=294) | Z or t-vlaue | P-value |
|---|
| R value (min) | 5.1 (4.6-5.7) | 6.5 (5.9-6.9) | 11.829 (Z) | <0.001 |
| K value (min) | 1.6 (1.2-2.0) | 2.4 (1.7-2.9) | 7.428 (Z) | <0.001 |
| Solidification
angle (°) | 70.5
(69.0-71.6) | 57.2
(53.1-61.2) | 13.427 (Z) | <0.001 |
| MA (mm) | 64.0
(60.1-68.1) | 52.9
(50.5-59.6) | 10.165 (Z) | <0.001 |
| CI | 0.55
(0.10-1.13) | −1.30
(−1.84-0.60) | 8.154 (Z) | <0.001 |
| D-dimer
(ug/ml) | 2.25
(1.29-3.13) | 0.47
(0.23-1.30) | 10.198 (Z) | <0.001 |
| pAgt (%) | 68 (63-73) | 56 (53-60) | 10.942 (Z) | <0.001 |
| Fibrinogen
(g/l) | 3.37
(3.10-3.94) | 2.44
(2.11-3.16) | 8.703 (Z) | <0.001 |
| APACHE II | 26 (24-28) | 22 (21-24) | 10.119 (Z) | <0.001 |
| Hemoglobin
(g/l) | 72.33±9.50 | 79.79±8.11 | 6.932 (t) | <0.001 |
| PLT (×109/l) | 196.49±62.13 | 195.57±61.18 | 0.128 (t) | 0.898 |
Predictors of AT events in patients
with NSAID-induced GIB
Results of the multivariate logistic regression
analysis indicated that the thrombus elastic figure.index values
(including the following five indicators: R value, K value,
solidification angle, MA and CI), Fib, hemoglobin and D-dimer
levels, pAgt results, and APACHE II scores were all potential
independent predictors of AT events in patients with NSAID-induced
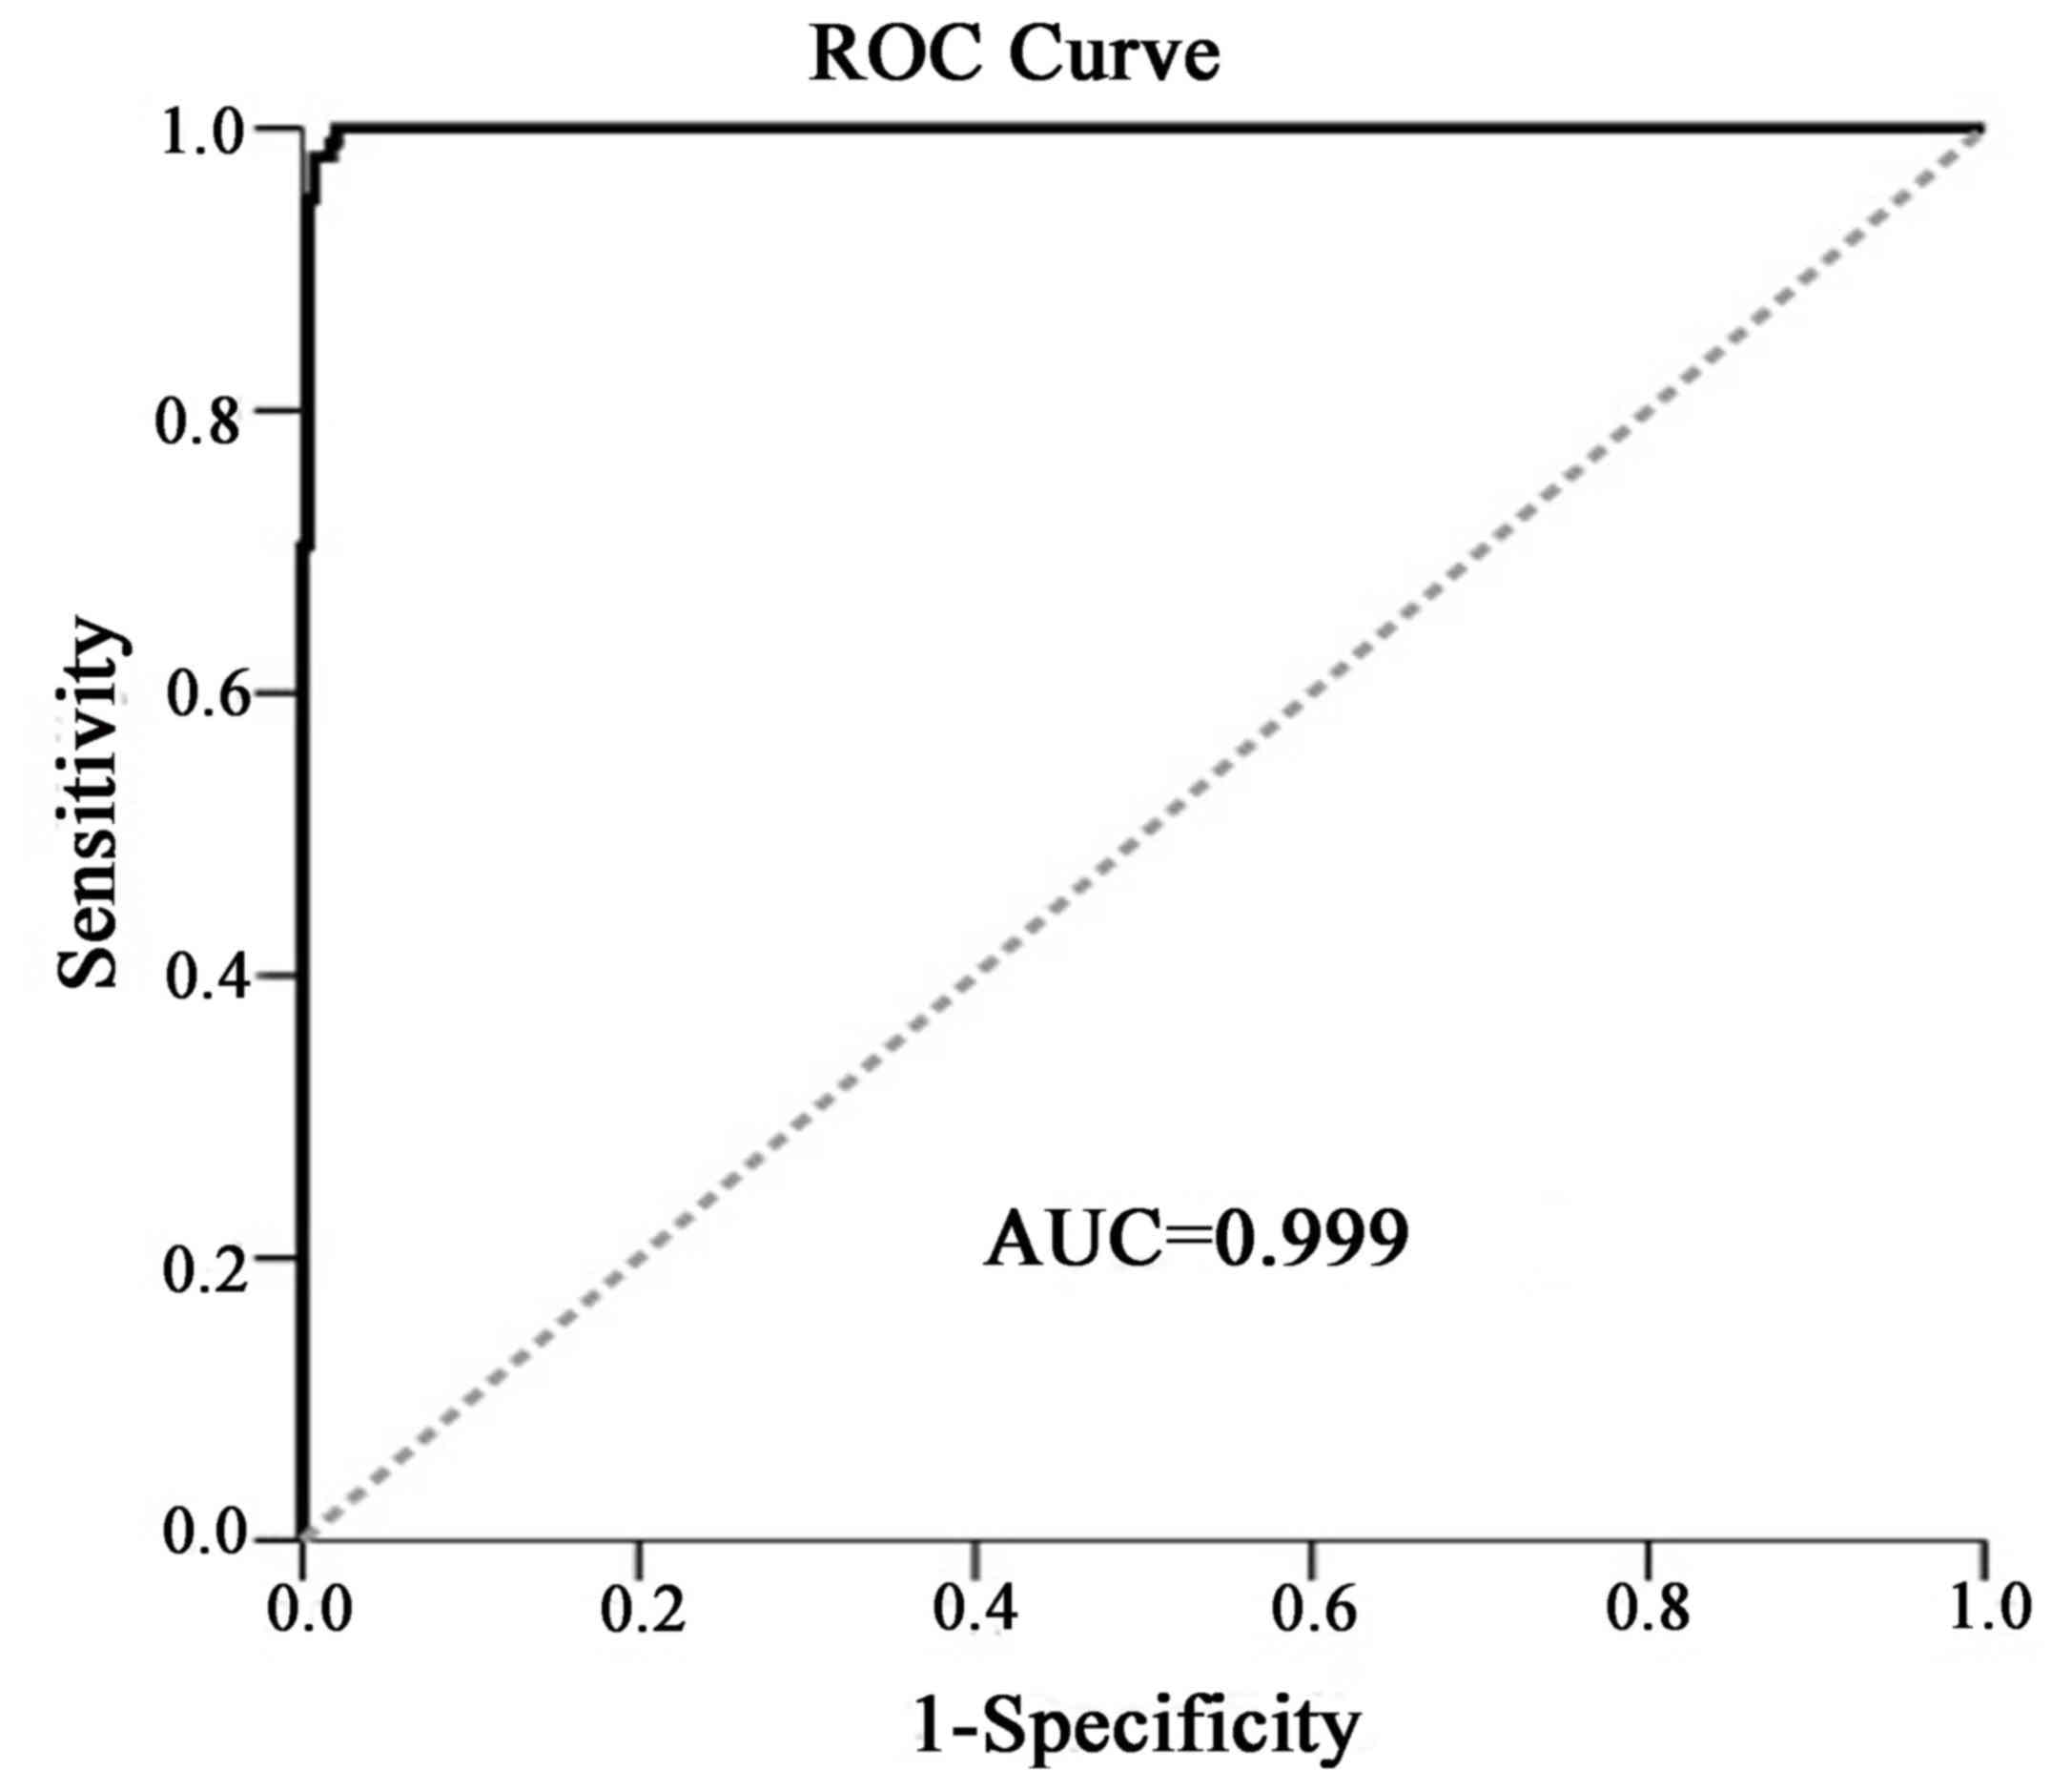
GIB (Table IV). The overall
predictive efficacy using these parameters was good and the area
under the curve (AUC) of the receiver operating characteristic
curve was 0.999 (95% confidence interval: 0.996-1.001; Fig. 2). However, the entire cohort of
participants was used to construct and validate the logistic
regression model, which may have resulted in over-fitting.
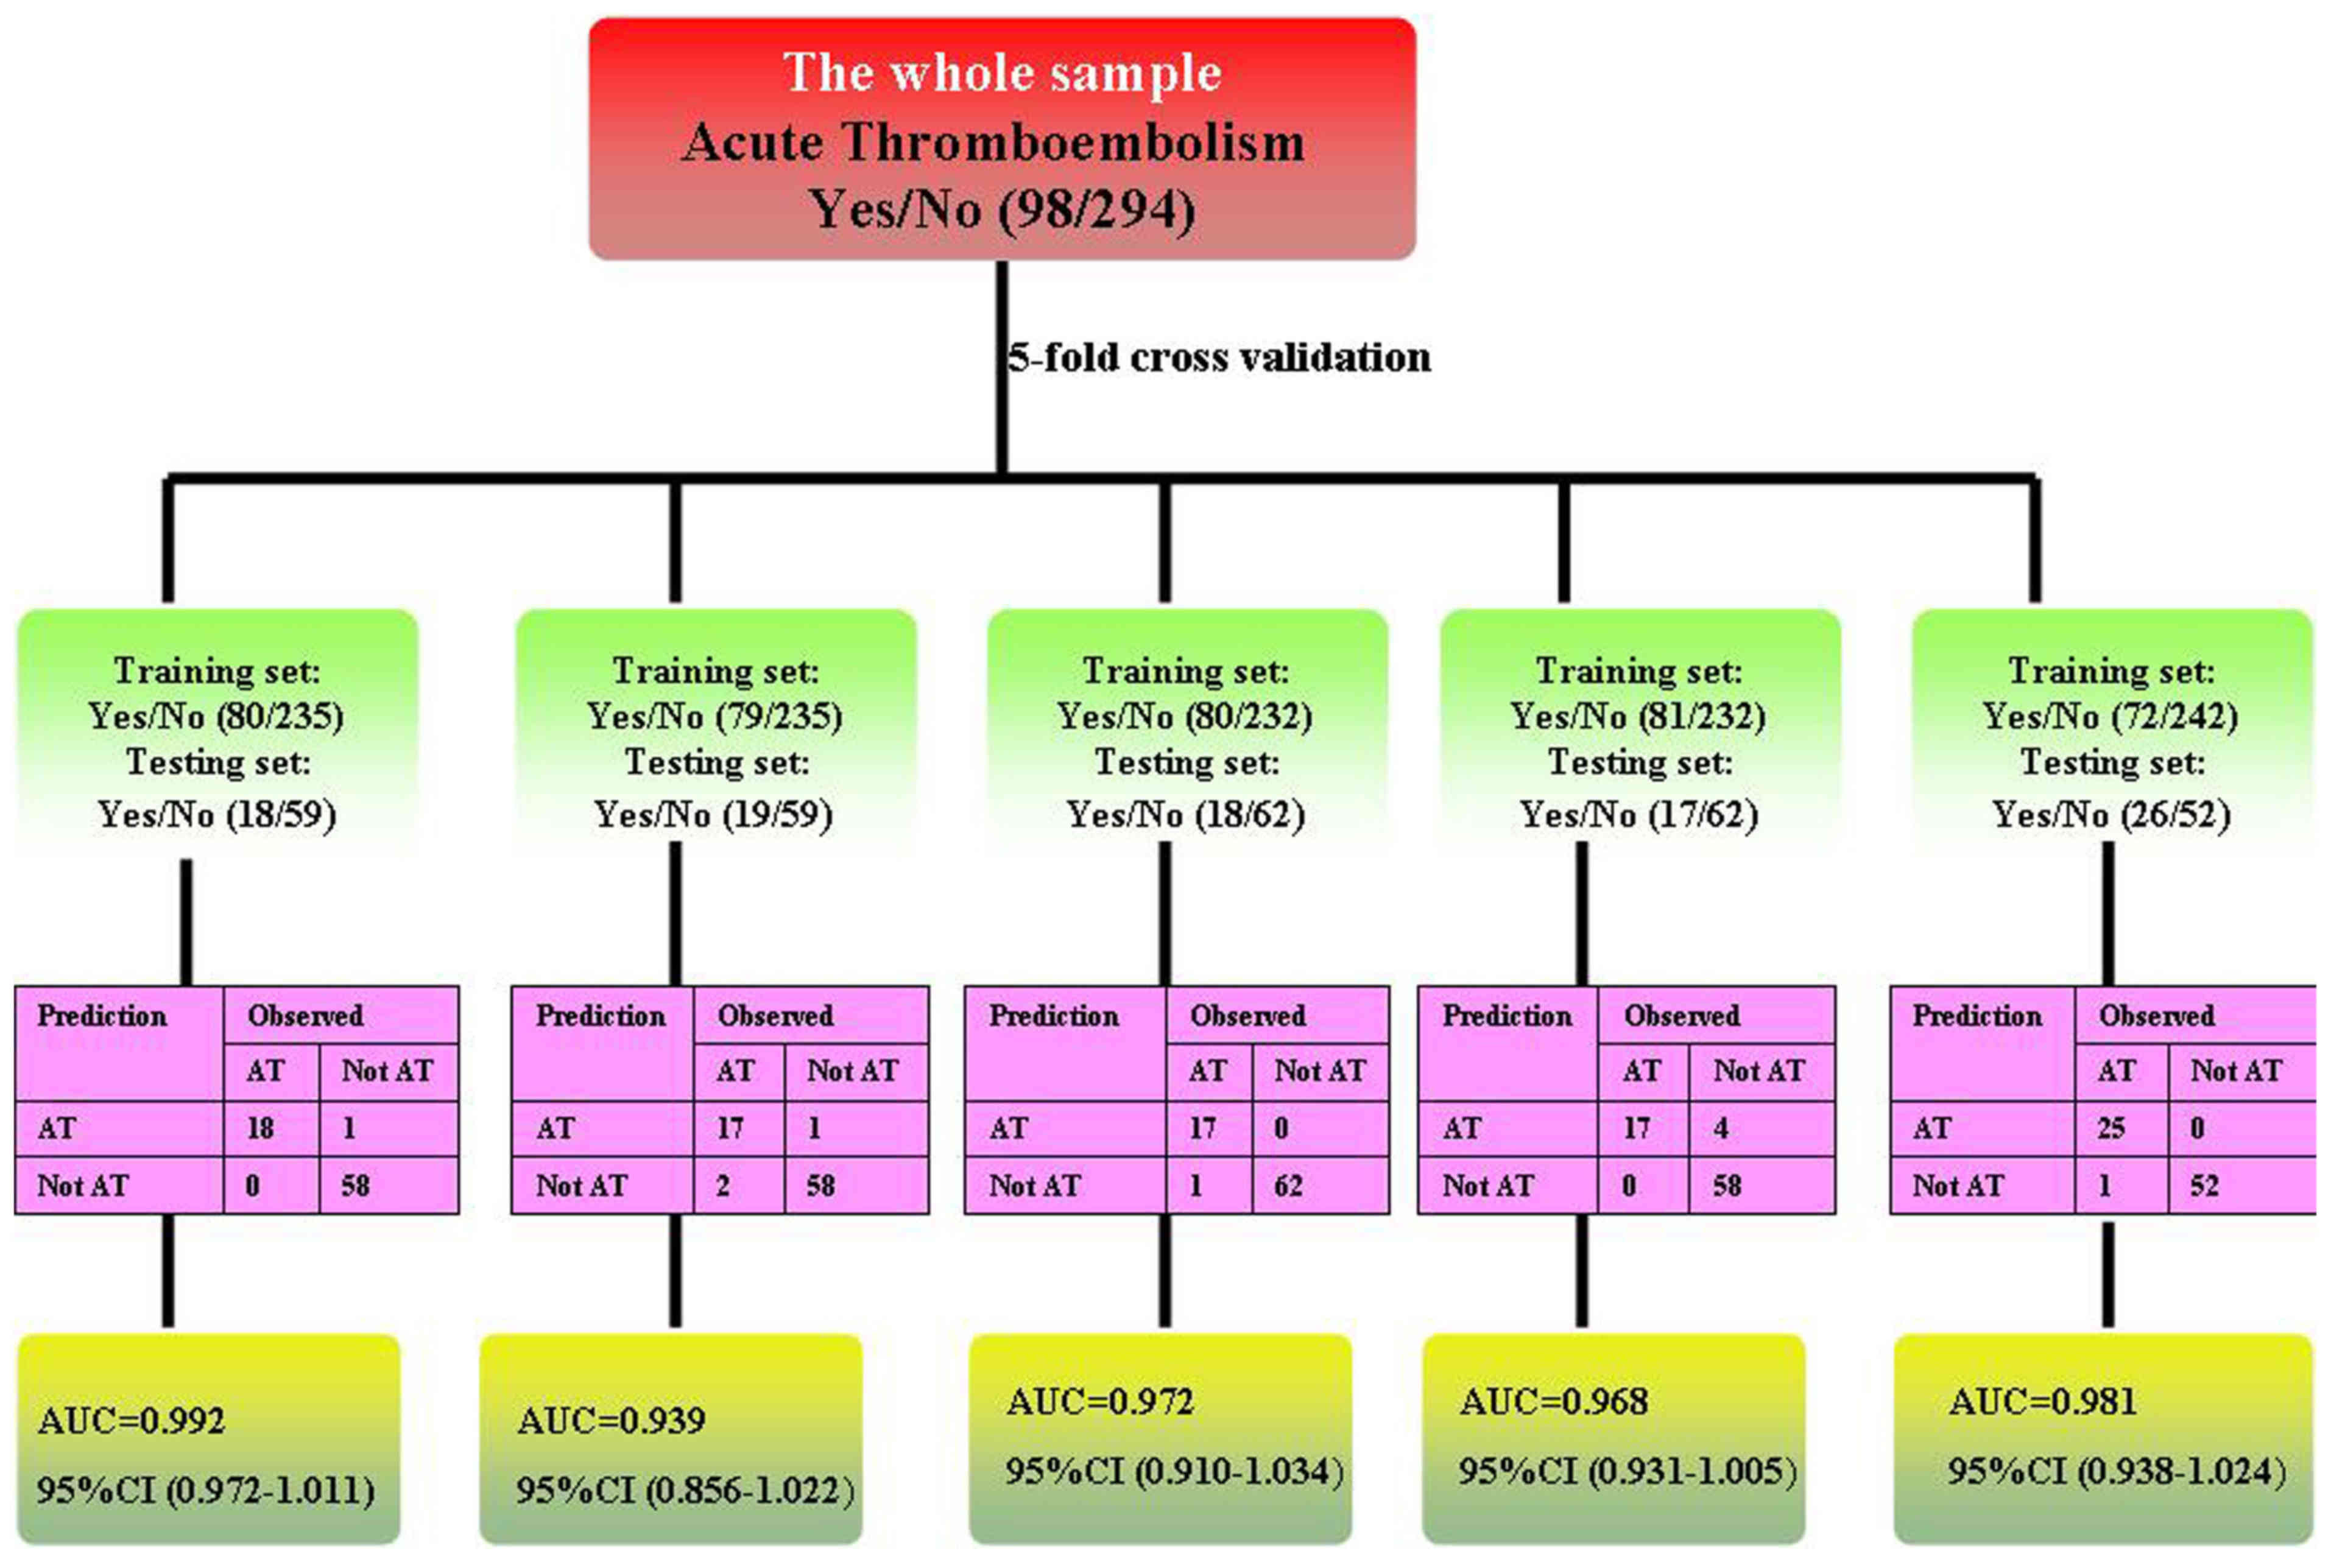
Therefore, the present study additionally adopted a 5-fold cross
validation to re-analyze the data. During the analysis, the data
were divided into five sets. For each analysis, one set was
considered the testing data to validate the classification
performance of the logistic regression model whereas the remaining
sets were considered training data to construct the logistic
regression model. The classification accuracy rates and AUC for the
testing data were presented in Fig.
3.
| Table IV.Multivariate logistic regression
analysis evaluating the predictive efficacy of clinical parameters
for AT in patients with NSAIDs-induced GIB. |
Table IV.
Multivariate logistic regression
analysis evaluating the predictive efficacy of clinical parameters
for AT in patients with NSAIDs-induced GIB.
| Index | Regression
coefficient | Standard error | Wald | P-value | OR value | 95% CI |
|---|
| R value (min) | −2.536 | 0.983 | 6.651 | 0.010 | 0.079 | 0.012-0.544 |
| K value (min) | −1.640 | 0.947 | 3.002 | 0.083 | 0.194 | 0.030-1.240 |
| Solidification
angle (°) | 0.296 | 0.102 | 8.376 | 0.004 | 1.345 | 1.100-1.644 |
| MA (mm) | 0.228 | 0.110 | 4.319 | 0.038 | 1.256 | 1.013-1.558 |
| CI | 1.034 | 0.633 | 2.668 | 0.102 | 2.812 | 0.813-9.721 |
| D-dimer
(ug/ml) | 1.360 | 0.540 | 6.330 | 0.012 | 3.895 | 1.350-11.231 |
| pAgt (%) | 0.270 | 0.110 | 5.973 | 0.015 | 1.310 | 1.055-1.626 |
| Fibrinogen
(g/l) | 1.464 | 0.850 | 2.970 | 0.085 | 4.325 | 0.818-22.869 |
| APACHE II | 0.444 | 0.290 | 2.349 | 0.125 | 1.559 | 0.884-2.750 |
| Hemoglobin
(g/l) | −0.088 | 0.067 | 1.699 | 0.192 | 0.916 | 0.803-1.045 |
AT-associated indicators evaluated by
the random forest algorithm
The random forest algorithm was used to rank the
significant indexes in single factor comparisons. The analysis
included parameters of thrombus elastic figure. index values
(including R value, K value, solidification angle, MA and CI), Fib,
hemoglobin and D-dimer levels, and pAgt and APACHE II scores. The
most important indicators extracted according to the MDG scores
(MDGS) were the solidification angle, R value, pAgt results,
D-dimer levels and CI (Table V;
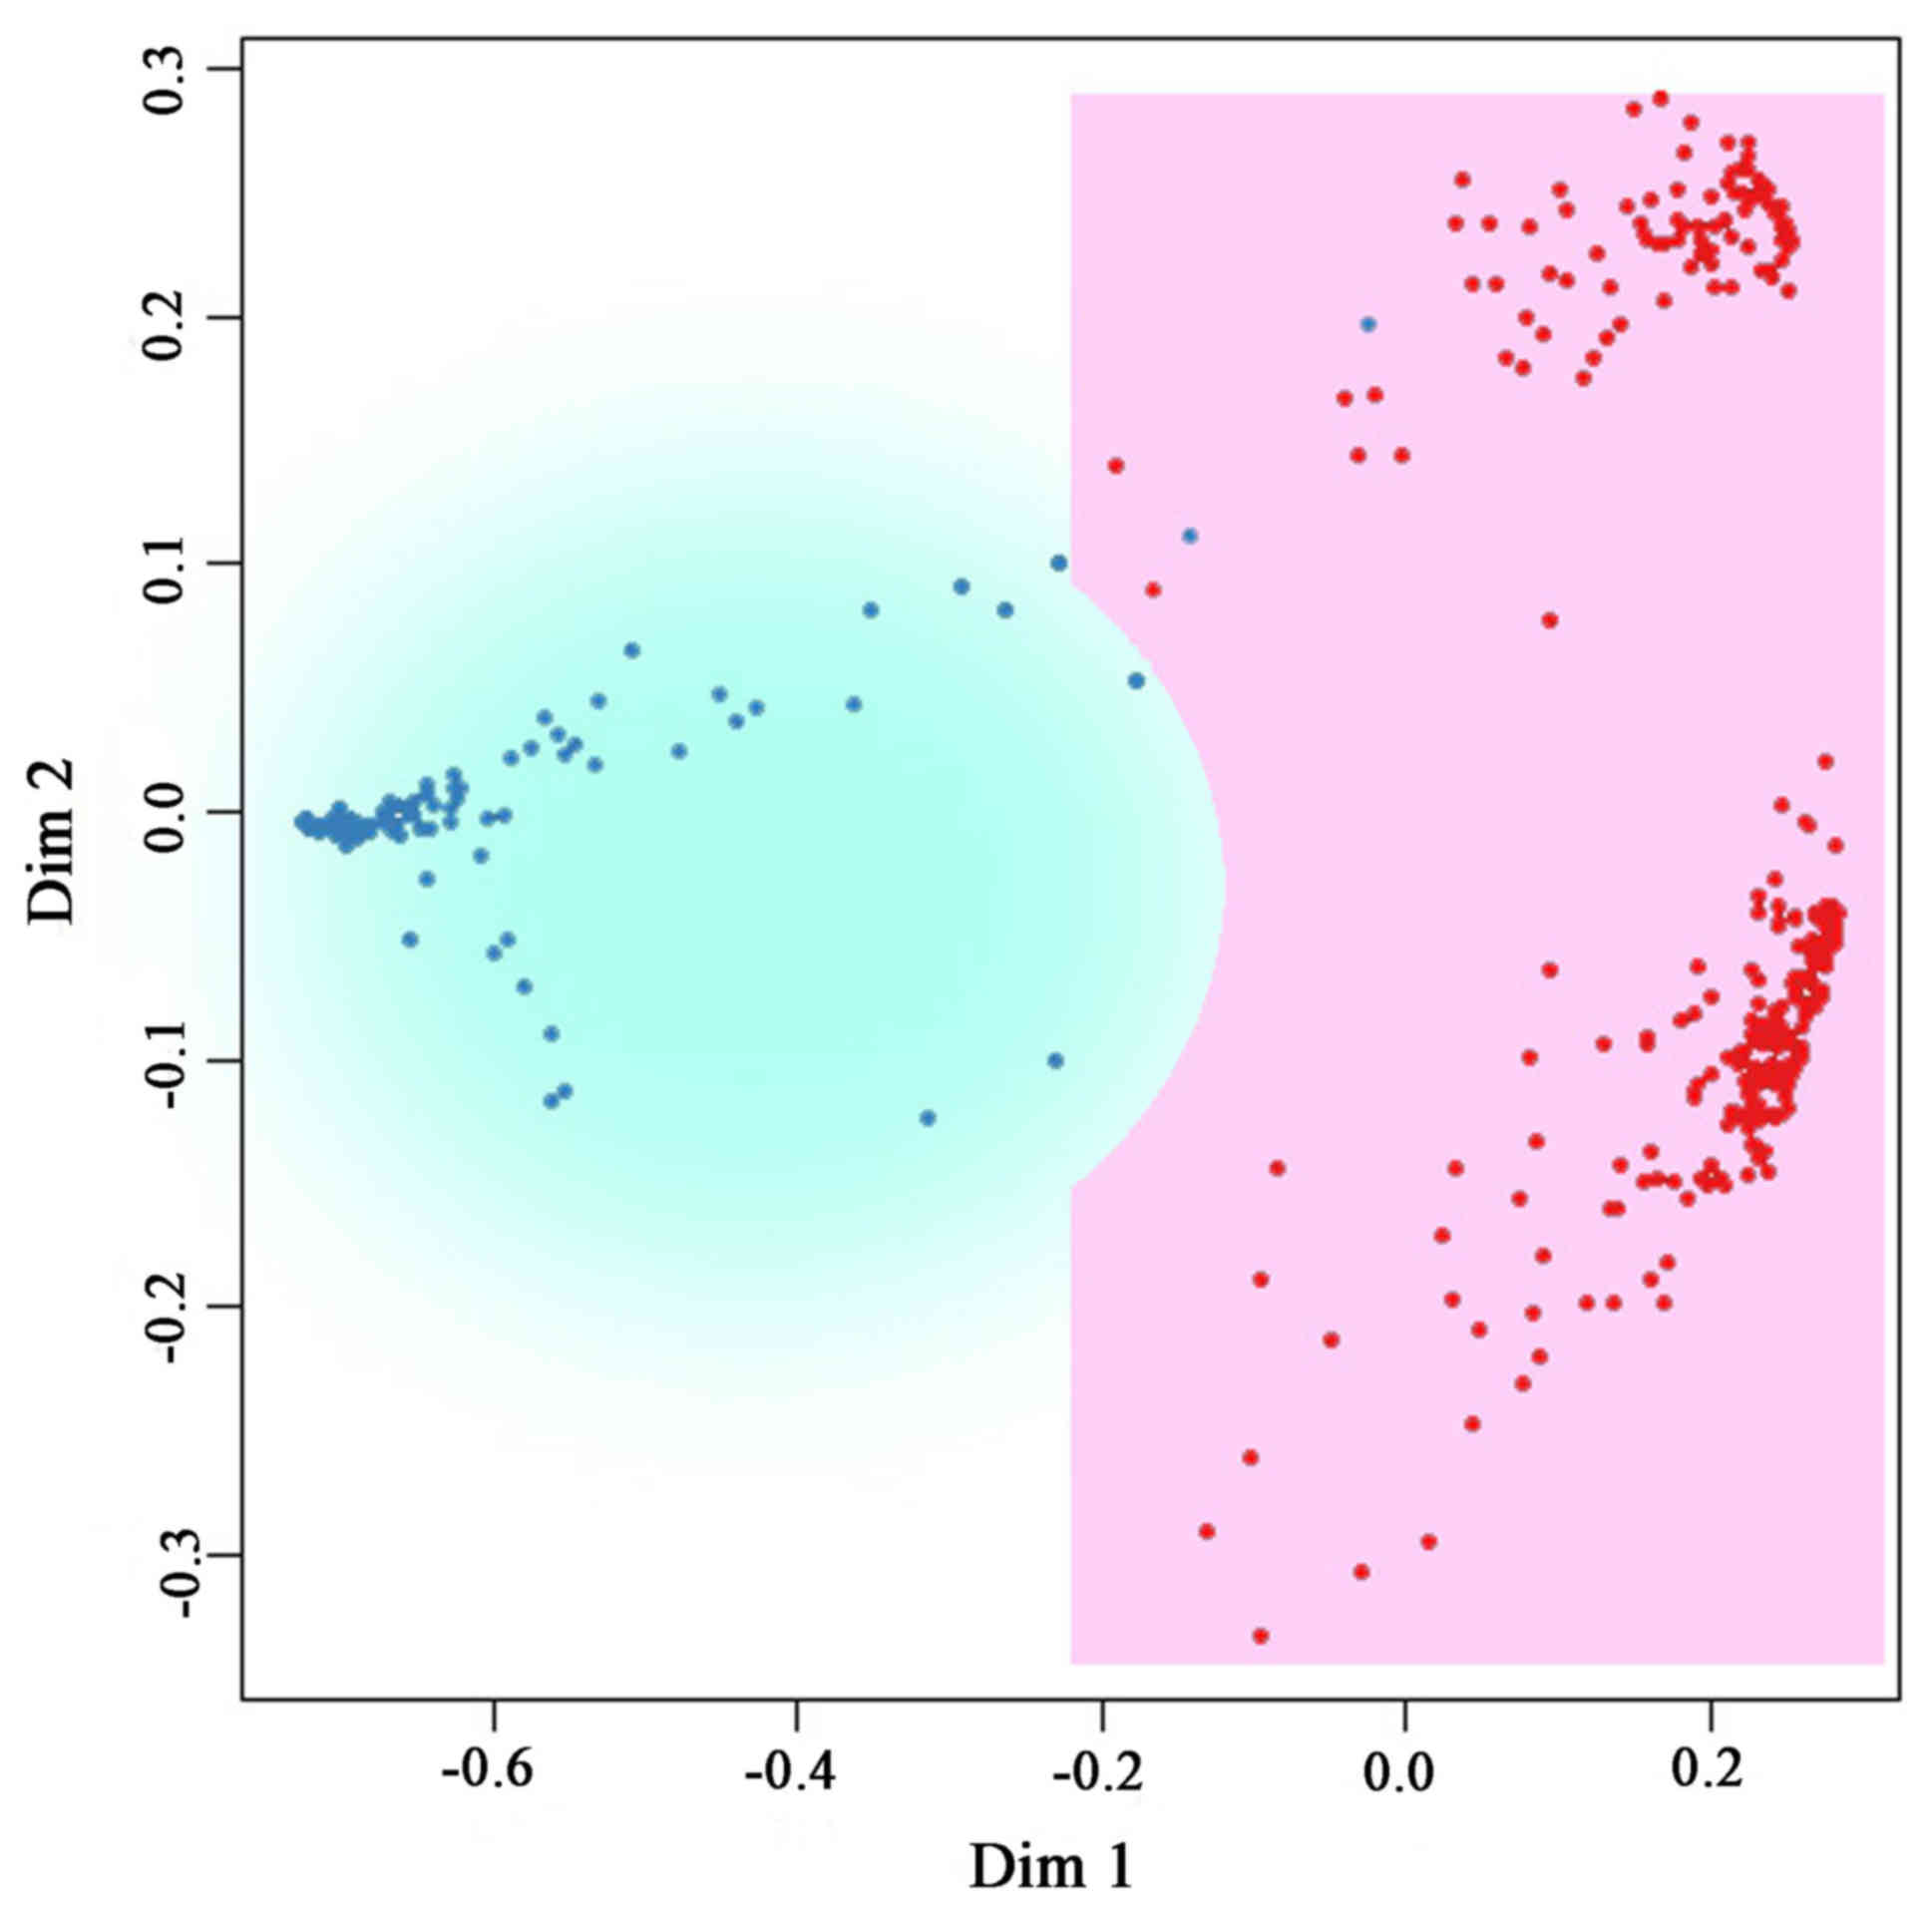
Fig. 4). A two-dimensional
classification graph of samples was constructed based on the random
forest classification algorithm of the neighboring matrix,
providing a multidimensional scaling lattice diagram (Fig. 5). The samples could be well
classified by the above-mentioned indicators.
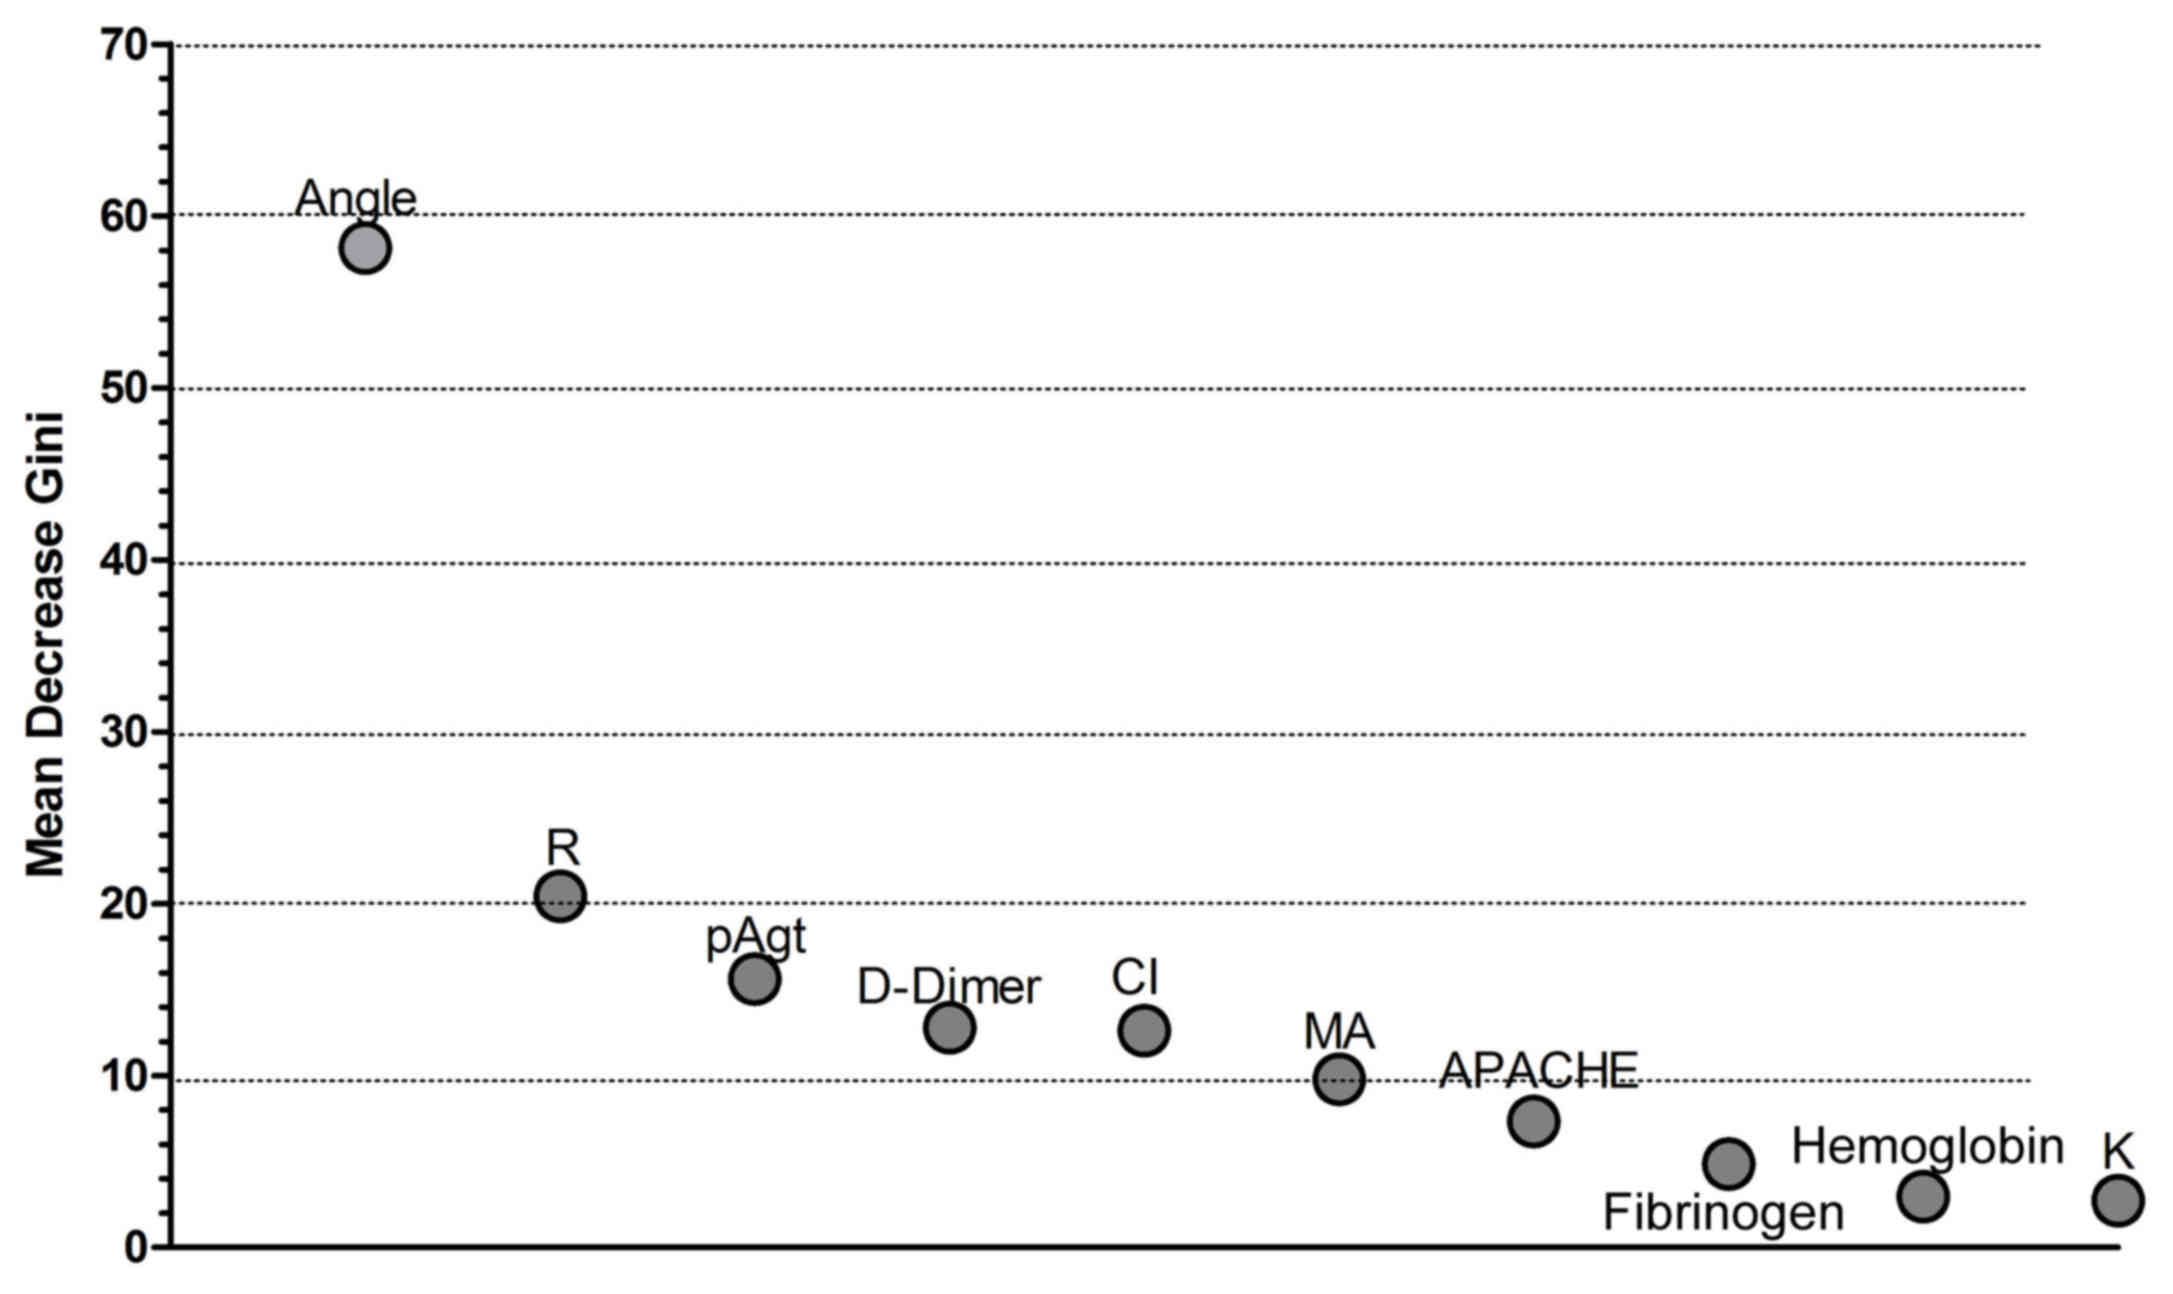 | Figure 4.MDG plot for important indexes
associated with AT. AT-associated indicators evaluated by the
random forest algorithm. The random forest algorithm was used to
rank significant indexes in single factor comparisons, including
the R and K values, solidification angle, MA, CI, and hemoglobin,
D-dimer and Fib levels, and pAgt and APACHE II scores. The most
important indicators according to the MDG scores were
solidification angle, R value, pAgt score, D-dimer levels and CI.
MDG, Mean Decrease Gini; APACHE, Acute Physiology and Chronic
Health Evaluation; pAgt, platelet aggregation test; R value,
reaction time; MA, maximum amplitude; CI, coagulation index; K
value, coagulation forming time; AT, acute thromboembolism. |
| Table V.Ranking of important indexes
associated with AT based on MDG. |
Table V.
Ranking of important indexes
associated with AT based on MDG.
| Index | MDG |
|---|
| Solidification
angle (°) | 58.14 |
| R value (min) | 20.42 |
| pAgt (%) | 15.61 |
| D-Dimer
(ug/ml) | 12.78 |
| CI | 12.61 |
| MA (mm) | 9.77 |
| APACHE II | 7.33 |
| Fibrinogen
(g/l) | 4.86 |
| Hemoglobin
(g/l) | 2.95 |
| K value (min) | 2.72 |
Discussion
Previous studies indicated that elderly patients are
at an increased risk of developing NSAID-induced gastrointestinal
injuries (16,17). Patients with a history of previous
peptic ulcer bleeding are 13 times more at risk (18–20). The
digestive tract bleeding associated with the use of NSAID has been
reported since 1934, when Aschenbrenner had published case reports
of AMI associated with GIB (21). In
the present study, patients with GIB, especially those with
NSAID-associated GIB, tended to be at a higher risk of
thromboembolic events, including cerebrovascular and cardiovascular
events, which was consistent the results of a recent report
(3). The present study indicated
that among patients with NSAID-associated GIB, 10.6% experienced AT
events, which was similar to previous reports (13,22). AT
events may affect the prognosis of patients with GIB, leading to an
increased risk of morbidity and mortality (23). A previous study has suggested that
patients with ACS with severe GIB and even those with minor
bleeding events are at a higher risk of MI and 30-day mortality
(24). Among patients with ACS in
the Acute Catheterization and Urgent Intervention Triage Strategy
trial, GIB was associated with reduced 1-year survival rates
[hazard ratio (HR): 4.0] and increased incidences of MI (HR: 2.9),
composite ischemia (HR: 1.9), stroke (HR: 4.2) and mortality (HR:
2.6) (9,11). Among 6,853 patients with ischemic
disease, GIB significantly increased the mortality of patients
[odds ratio (OR): 3.3], as well as incidence of recurrent cerebral
infarction (OR: 3.7) and MI (OR: 2.8) (25).
Additionally, a study of patients with GIB who were
taking anticoagulant drugs indicated that suspension of
anticoagulants lead to an increased incidence of thromboembolism in
90 days (HR: 14-20), as well as an increased overall mortality (HR:
3.3) (26). The exact mechanisms
underlying the pathogenesis of GIB complicated by AT remain to be
elucidated, although possible explanations have been suggested. For
instance, a large amount of blood loss occurring shortly after GIB
(>20% of circulating blood volume) may lead to insufficient
perfusion of the coronary artery and brain (22). Subsequently, a sudden decrease of
blood flow in the heart reduces the flow within the coronary
artery, causing an atheromatous plaque rupture, followed by
ischemia in the coronary artery (27). Furthermore, the sympathetic nervous
system and the adrenal medullary system may be activated as a
response to the rapid decrease in the blood volume, which leads to
constriction of the vessels and aggravation of artery stenosis, if
it is already present (28). If
patients experienced a previous cerebral infarction and MI, the
endogenous coagulation system could be activated, resulting in
acute thrombus formation (29). In
response to the aforementioned events, the bone marrow may increase
platelet production, followed by a release of the platelet factors
including thrombin and catecholamine, making patients more
vulnerable to blood clots and ischemic events (29,30).
Furthermore, antithrombotic drugs may be discontinued due to
concerns of bleeding (26,31), and the incidence of AT may also
increase.
Predictors for AT events in NSAID-induced GIB have
not been well evaluated previously. Bhatti et al (13) demonstrated that patients with
GIB-related MI had significantly more cardiac risk factors
(2.4+/−0.2 vs. 1.6+/−0.1), lower presenting hematocrits (26.0+/−1.3
vs. 30.5+/−0.8), and lower hematocrit in the first 48 h (22.3+/−0.9
vs. 25.1+/−0.6) than those without MI. Emenike et al
(14) found that elderly patients
with high APACHE II scores on admission to intensive care units and
presenting additional risk factors for coronary artery disease are
more likely to experience AT events. The study also found that age
and low levels of hemoglobin were risk factors for AT (14). The above results were confirmed by
the present study, which also demonstrated that high APACHE II
scores and low hemoglobin levels were associated with an increased
risk of AT in patients with NSAID-induced GIB. The novelty of the
present study directly pertains to the inclusion of TEG-derived
parameters for evaluation of the risk of AT in patients with
NSAID-induced GIB, to complement the conventional clinical
parameters. Compared with the traditional coagulation detection,
TEG could comprehensively analyze the plasma composition and its
influence on blood coagulation, which may better reflect the
precise blood coagulation parameters of patients (32). TEG graphically demonstrates the
process of coagulation, including the initiation, formation of
blood clots and fibrinolysis using 20 standard parameters (33). TEG accurately reflects the presence
of the hypercoagulable state in the blood (33). Compared with the conventional
methods, TEG is more rapid and accurate, and is a sensitive test
for the overall evaluation of coagulation function (34).
Traditional coagulation test parameters, including
activated partial thromboplastin time (APTT), prothrombin time
(PT), thrombin time and Fib levels, only examine a part of the
plasma and blood coagulation cascade, rather than the whole body
blood coagulation reaction condition, and, therefore, cannot
determine whether PLT function and fibrinolytic system are normal
(35). A number of patients with
normal PLT, PT and APTT exhibit active bleeding and abnormal
coagulation (36,37). Blood coagulation and an increase in
PLT adhesion serve roles in the occurrence and development of acute
thrombosis (27). TEG can accurately
determine whether the blood is in a state of high coagulation
(38). Previous studies have
indicated that MA can be used to predict bleeding following heart
surgery, deep venous thrombosis following severe trauma, as well as
stroke events, stent thrombosis and post-traumatic mortality
(39–43). For vein embolization, TEG has been
shown to directly indicate if patients are prone to developing a
thrombotic disease when the high coagulation state changes (R value
decreases and MA value increases) (40). It has been reported that the MA value
in TEG can be used to predict an increased risk of venous
thromboembolism in patients with severe lower limb trauma (40). The MA value of rapid TEG is also an
independent predictor of pulmonary embolism (44,45).
Other studies have reported that CI had a predictive value for deep
venous thrombosis and thrombosis in prostate cancer (46,47).
Furthermore, the TEG method simulates the entire process of venous
thrombosis ex vivo, and, therefore, the CI value can reflect
a composite index of venous thrombosis formation. Usually, when the
blood is in a state of high coagulation, TEG is exhibits decreased
R and K values, and an increased solidification angle, MA value and
CI value (48). The present study
indicated that the average R value in the 98 patients of the AT
group was lower compared with the non-AT group, and the
solidification angle, MA and CI increased compared with the non-AT
group. The results indicated that the R value, MA, solidification
angle and CI were sensitive indicators of high coagulation in TEG,
and coagulation increased in the AT group compared with non-AT
patients. These results require confirmation by future studies with
a larger cohort.
APACHE II scores, and hemoglobin and Fib levels
differed between patients with or without AT events, however, the
results of the multivariate analysis suggested that none were
independent risk factors for AT in patients with NSAID-induced GIB.
D-dimer, is a well characterized sensitive marker of thrombosis
with fiber dissolving activity (49), which had a predictive value for AT in
patients with NSAID-induced GIB in the present study. D-dimer is a
degradation product produced during the hydrolysis of fibrinolytic
enzymes and is a specific indicator of hypercoagulability and
secondary fibrinolysis (49).
Secondary fibrinolytic activity was primarily enhanced in patients
with AT, who typically present with reduced levels of plasminogen
and increased levels of D-dimer (50). However, conventional coagulation
monitoring indicators (including D-dimer and Fib) frequently fail
to reflect the coagulation balance in vivo and only
partially record the process of blood coagulation (51). The results are easily influenced by
low molecular weight heparin, which may exhibit a strong
antithrombotic effect by controlling the activity of coagulation
factors, patriculaly Xa, and thus promoting the release of tissue
plasminogen activator (T-PA) and the dissolution of fibrin
(52). However, this may also be
influenced by other substances, including low molecular dextran and
urokinase (53). A study by Ridker
et al (54) found that the
presence of D-dimers was closely associated with ischemic
cardiomyopathy. The elevated levels of D-dimers indicate an
increased risk of MI, however, D-dimer was not an independent
predictor (49). Previous studies
have suggested that the activation of blood coagulation was an
independent risk factor of cerebral infarction, where the D-dimer
level and the degree of cerebral infarction were linearly
correlated, and could be used to infer the prognosis of patients
with cerebral infarction (55,56).
pAgt primarily reflects the aggregation function of PLTs. The
results of the present study suggested that pAgt was elevated in
patients with AT, which is consistent with the results of previous
research (54). pAgt function is
positively associated with Fib levels in plasma (54). In the present study, the plasma Fib
concentration in the AT group was significantly increased compared
with the non-AT group, which also confirmed previous results
(56). Although D-dimer levels and
pAgt can provide reference data for clinical thrombosis, the
information provided by TEG detection is more comprehensive and can
reflect the coagulation function state more accurately.
Furthermore, TEG is a simpler, faster and more sensitive detection
method and can be implemented by the bedside (37).
The present study has limitations which should be
considered when interpreting the results. The retrospective design
of the present study does not allow for subject recruitment and
outcome design, which could be adapted in a prospective study. The
results after matching cannot completely reflect the results of the
original data. To determine whether TEG parameters, D-dimer levels
and pAgt results are independent predictors of AT in patients with
GIB, a large prospective cohort study should be performed. Another
limitation is that patients with NSAID-associated GIB had
additional comorbidities at baseline that could have contributed to
the development of AT events during the follow-up period. Although
the present study attempted to match certain variables, the
multivariate model did not account for all potential adjusted
confounding factors associated with GIB. Finally, the number of
thromboembolic events was relatively small, which may have resulted
in insufficient statistical power for multivariate analysis of
certain variables.
In conclusion, TEG-derived parameters including the
R value, solidification angle, MA, and CI, as well as D-dimer
levels and pAgt results may be significant predictors of AT in
patients with NSAID-induced GIB. These parameters may aid early
identification of patients with NSAID-induced GIB who are at a
higher risk of developing AT events.
Acknowledgements
Not applicable.
Funding
The present study was supported by grants from
Beijing Medical and Health Foundation (grant no.
YWJKJJHKYJJ-A617).
Availability of data and materials
The datasets used and/or analyzed during the current
study are available from the corresponding author on reasonable
request.
Authors' contributions
T-YC wrote the manuscript. T-YC, H-MZ and YL
performed the experiments. T-YC analyzed the data. MZ and TC
interpreted the data and revised the manuscript. MZ conceived and
managed the study design and approved the manuscript for
publication.
Ethics approval and consent to
participate
This study was approved by the Ethics Committee of
Xuanwu Hospital. The patients signed informed consent was also
obtained.
Patient consent for publication
The patients agreed to the publication of any
associated data in the present study.
Competing interests
The authors declare that they have no competing
interests.
References
|
1
|
Roffi M, Patrono C, Collet JP, Mueller C,
Valgimigli M, Andreotti F, Bax JJ, Borger MA, Brotons C and Chew
DP: 2015 ESC Guidelines for the management of acute coronary
syndromes in patients presenting without persistent ST-segment
elevation: Task force for the management of acute coronary
syndromes in patients presenting without persistent ST-segment
elevation of the European society of cardiology (ESC). Eur Heart J.
37:267–315. 2016. View Article : Google Scholar : PubMed/NCBI
|
|
2
|
Benjamin EJ, Blaha MJ, Chiuve SE, Cushman
M, Das SR, Deo R, de Ferranti SD, Floyd J, Fornage M, Gillespie C,
et al: Heart disease and stroke statistics-2017 update: A report
from the american heart association. Circulation. 135:e146–e603.
2017. View Article : Google Scholar : PubMed/NCBI
|
|
3
|
Nagata N, Sakurai T, Shimbo T, Moriyasu S,
Okubo H, Watanabe K, Yokoi C, Yanase M, Akiyama J and Uemura N:
Acute severe gastrointestinal tract bleeding is associated with an
increased risk of thromboembolism and death. Clin Gastroenterol
Hepatol. 15:1882–1889.e1. 2017. View Article : Google Scholar : PubMed/NCBI
|
|
4
|
Poredoš P: Interrelationship between
venous and arterial thrombosis. Int Angiol. 36:295–298.
2017.PubMed/NCBI
|
|
5
|
Connors JM: Thrombophilia testing and
venous thrombosis. N Engl J Med. 377:1177–1187. 2017. View Article : Google Scholar : PubMed/NCBI
|
|
6
|
Moore RA, Derry S, Simon LS and Emery P:
Nonsteroidal anti-inflammatory drugs, gastroprotection, and
benefit-risk. Pain Pract. 14:378–395. 2014. View Article : Google Scholar : PubMed/NCBI
|
|
7
|
Salles-Montaudon N, Fourrier A, Dartigues
JF, Rainfray M and Emeriau JP: Evolution of drug treatments in the
aged living at home. Rev Med Interne. 21:664–671. 2000.(In French).
View Article : Google Scholar : PubMed/NCBI
|
|
8
|
Rafaniello C, Ferrajolo C, Sullo MG, Sessa
M, Sportiello L, Balzano A, Manguso F, Aiezza ML, Rossi F,
Scarpignato C and Capuano A: Risk of gastrointestinal complications
associated to NSAIDs, low-dose aspirin and their combinations:
Results of a pharmacovigilance reporting system. Pharmacol Res.
104:108–114. 2016. View Article : Google Scholar : PubMed/NCBI
|
|
9
|
Nikolsky E, Ston GW, Kirtan AJ, Dangas GD,
Lansky AJ, McLaurin B, Lincoff AM, Feit F, Moses JW, Fahy M, et al:
Gastrointestinal bleeding in patients with acute coronary
syndromes: Incidence, predictors, and clinical implications:
Analysis from the ACUITY (Acute Catheterization and Urgent
Intervention Triage Strategy) trial. J Am Coll Cardiol.
54:1293–1302. 2009. View Article : Google Scholar : PubMed/NCBI
|
|
10
|
Ng FH, Wong SY, Lam KF, Chang CM, Lau YK,
Chu WM and Wong BC: Gastrointestinal bleeding in patients receiving
a combination of aspirin, clopidogrel, and enoxaparin in acute
coronary syndrome. Am J Gastroenterol. 103:865–871. 2008.
View Article : Google Scholar : PubMed/NCBI
|
|
11
|
Staerk L, Lip GY, Olesen JB, Fosbøl EL,
Pallisgaard JL, Bonde AN, Gundlund A, Lindhardt TB, Hansen ML,
Torp-Pedersen C and Gislason GH: Stroke and recurrent haemorrhage
associated with antithrombotic treatment after gastrointestinal
bleeding in patients with atrial fibrillation: Nationwide cohort
study. BMJ. 351:h58762015. View Article : Google Scholar : PubMed/NCBI
|
|
12
|
Berger PB, Bhatt DL, Fuster V, Steg PG,
Fox KA, Shao M, Brennan DM, Hacke W, Montalescot G, Steinhubl SR,
et al: Bleeding complications with dual antiplatelet therapy among
patients with stable vascular disease or risk factors for vascular
disease: Results from the Clopidogrel for high atherothrombotic
risk and ischemic stabilization, management, and avoidance
(CHARISMA) trial. Circulation. 121:2575–2583. 2010. View Article : Google Scholar : PubMed/NCBI
|
|
13
|
Bhatti N, Amoateng-Adjepong Y, Qamar A and
Manthous CA: Myocardial infarction in critically ill patients
presenting with gastrointestinal hemorrhage: Retrospective analysis
of risks and outcomes. Chest. 114:1137–1142. 1998. View Article : Google Scholar : PubMed/NCBI
|
|
14
|
Emenike E, Srivastava S, Amoateng-Adjepong
Y, Al-Kharrat T, Zarich S and Manthous CA: Myocardial infarction
complicating gastrointestinal hemorrhage. Mayo Clin Proc.
74:235–241. 1999. View
Article : Google Scholar : PubMed/NCBI
|
|
15
|
Goli RR, Contractor MM, Nathan A, Tuteja
S, Kobayashi T and Giri J: Antiplatelet therapy for secondary
prevention of vascular disease complications. Curr Atheroscler Rep.
19(56)2017.PubMed/NCBI
|
|
16
|
Aalykke C and Lauritsen K: Epidemiology of
NSAID-related gastroduodenal mucosal injury. Best Pract Res Clin
Gastroenterol. 15:705–722. 2001. View Article : Google Scholar : PubMed/NCBI
|
|
17
|
Kim J, Lee J, Shin CM, Lee DH and Park BJ:
Risk of gastrointestinal bleeding and cardiovascular events due to
NSAIDs in the diabetic elderly population. BMJ Open Diabetes Res
Care. 3:e0001332015. View Article : Google Scholar : PubMed/NCBI
|
|
18
|
Lanas Á, Carrera-Lasfuentes P, Arguedas Y,
Garcia S, Bujanda L, Calvet X, Ponce J, Perez-Aísa Á, Castro M,
Muñoz M, et al: Risk of upper and lower gastrointestinal bleeding
in patients taking nonsteroidal anti-inflammatory drugs,
antiplatelet agents, or anticoagulants. Clin Gastroenterol Hepatol.
13:906–912.e2. 2015. View Article : Google Scholar : PubMed/NCBI
|
|
19
|
Rao SV, O'Grady K, Pieper KS, Granger CB,
Newby LK, Van de Werf F, Mahaffey KW, Califf RM and Harrington RA:
Impact of bleeding severity on clinical outcomes among patients
with acute coronary syndromes. Am J Cardiol. 96:1200–1206. 2005.
View Article : Google Scholar : PubMed/NCBI
|
|
20
|
Ibáñez L, Vidal X, Vendrell L, Moretti U
and Laporte JR; Spanish-Italian Collaborative Group for the
Epidemiology of Gastrointestinal Bleeding, : Upper gastrointestinal
bleeding associated with antiplatelet drugs. Aliment Pharmacol
Ther. 23:235–242. 2006. View Article : Google Scholar : PubMed/NCBI
|
|
21
|
Aschenbrenner R: Magenblutung und Anoxie
des Herzmuskels. Z klin Med. 127:160–165. 1935.(In German).
|
|
22
|
van Hattum ES, Algra A, Lawson JA,
Eikelboom BC, Moll FL and Tangelder MJD: Bleeding increases the
risk of ischemic events in patients with peripheral arterial
disease. Circulation. 120:1569–1576. 2009. View Article : Google Scholar : PubMed/NCBI
|
|
23
|
Manguso F, Riccio E, Bennato R, Picascia
S, Martino R, De Nucci G, Fioritoc R and Balzano A: In-hospital
mortality in non-variceal upper gastrointestinal bleeding Forrest 1
patients. Scand J Gastroenterol. 43:1432–1441. 2008. View Article : Google Scholar : PubMed/NCBI
|
|
24
|
Kelly JP, Kaufman DW, Jurgelon JM, Sheehan
J, Koff RS and Shapiro S: Risk of aspirin-associated major
upper-gastrointestinal bleeding with enteric-coated or buffered
product. Lancet. 348:1413–1416. 1996. View Article : Google Scholar : PubMed/NCBI
|
|
25
|
O'Donnell MJ, Kapral MK, Fang J, Saposnik
G, Eikelboom JW, Oczkowski W, Silva J, Gould L, D'Uva C and Silver
FL; Investigators of the Registry of the Canadian Stroke Network, :
Gastrointestinal bleeding after acute ischemic stroke. Neurology.
71:650–655. 2008. View Article : Google Scholar : PubMed/NCBI
|
|
26
|
Sengupta N, Feuerstein JD, Patwardhan VR,
Tapper EB, Ketwaroo GA, Thaker AM and Leffler DA: The risks of
thromboembolism vs. recurrent gastrointestinal bleeding after
interruption of systemic anticoagulation in hospitalized inpatients
with gastrointestinal bleeding: A prospective study. Am J
Gastroenterol 110: 328-335, 2015. Am J Gastroenterol 110: 328-335,
2015. 110: 328-335, 2015:328-335, 2015–335, 2015. 2015.
|
|
27
|
Chung JW, Bang OY, Lee MJ, Hwang J, Cha J,
Choi JH and Choe YH: Echoing plaque activity of the coronary and
intracranial arteries in patients with stroke. Stroke.
47:1527–1533. 2016. View Article : Google Scholar : PubMed/NCBI
|
|
28
|
Hammadah M, Alkhoder A, Al Mheid I, Wilmot
K, Isakadze N, Abdulhadi N, Chou D, Obideen M, O'Neal WT, Sullivan
S, et al: Hemodynamic, catecholamine, vasomotor and vascular
responses: Determinants of myocardial ischemia during mental
stress. Int J Cardiol. 243:47–53. 2017. View Article : Google Scholar : PubMed/NCBI
|
|
29
|
Johnston JH: Endoscopic risk factors for
bleeding peptic ulcer. Gastronitest Endose. 36 5 Suppl:S16–S20.
1990.
|
|
30
|
McMichael M: New models of hemostasis. Top
Companion Anim Med. 27:40–45. 2012. View Article : Google Scholar : PubMed/NCBI
|
|
31
|
Witt DM, Delate T, Garcia DA, Clark NP,
Hylek EM, Ageno W, Dentali F and Crowther MA: Risk of
thromboembolism, recurrent hemorrhage, and death after warfarin
therapy interruption for gastrointestinal tract bleeding. Arch
Intern Med. 172:1484–1491. 2012. View Article : Google Scholar : PubMed/NCBI
|
|
32
|
Da Luz LT, Nascimento B, Shankarakutty AK,
Rizoli S and Adhikari NK: Effect of thromboelastography
(TEG®) and rotational thromboelastometry
(ROTEM®) on diagnosis of coagulopathy, transfusion
guidance and mortality in trauma: Descriptive systematic review.
Crit Care. 18:5182014. View Article : Google Scholar : PubMed/NCBI
|
|
33
|
Trautman CL, Palmer WC, Taner CB, Canabal
JM, Getz T, Goldman A, Heckman MG, Diehl NN, Lee DD and
Stancampiano FF: Thromboelastography as a predictor of outcomes
following liver transplantation. Transplant Proc. 49:2110–2116.
2017. View Article : Google Scholar : PubMed/NCBI
|
|
34
|
Somani V, Amarapurkar D and Shah A:
Thromboelastography for assessing the risk of bleeding in patients
with cirrhosis-moving closer. J Clin Exp Hepatol. 7:284–289. 2017.
View Article : Google Scholar : PubMed/NCBI
|
|
35
|
Müller MC, Meijers JC, Vroom MB and
Juffermans NP: Utility of thromboelastography and/or
thromboelastometry in adults with sepsis: A systematic review. Crit
Care. 18:R302014. View
Article : Google Scholar : PubMed/NCBI
|
|
36
|
Lancé MD: A general review of major global
coagulation assays: Thrombelastography, thrombin generation test
and clot waveform analysis. Thromb J. 13(1)2015. View Article : Google Scholar
|
|
37
|
Girdauskas E, Kempfert J, Kuntze T, Borger
MA, Enders J, Fassl J, Falk V and Mohr FW: Thromboelastometrically
guided transfusion protocol during aortic surgery with circulatory
arrest: A prospective, randomized trial. J Thorac Cardiovasc Surg.
140:1117–1124.e2. 2010. View Article : Google Scholar : PubMed/NCBI
|
|
38
|
Differding JA, Underwood SJ, Van PY, Khaki
RA, Spoerke NJ and Schreiber MA: First place residents'
competition: Trauma induces a hypercoagulable state that is
resistant to hypothermia as measured by thrombelastogram. Am J
Surg. 201:587–591. 2011. View Article : Google Scholar : PubMed/NCBI
|
|
39
|
Welsby IJ, Jiao K, Ortel TL, Brudney CS,
Roche AM, Bennett-Guerrero E and Gan TJ: The kaolin-activated
Thrombelastograph predicts bleeding after cardiac surgery. J
Cardiothorac Vasc Anesth. 20:531–535. 2006. View Article : Google Scholar : PubMed/NCBI
|
|
40
|
Gary JL, Schneider PS, Galpin M, Radwan Z,
Munz JW, Achor TS, Prasarn ML and Cotton BA: Can thrombelastography
predict venous thromboembolic events in patients with severe
extremity trauma? J Orthop Trauma. 30:294–298. 2016. View Article : Google Scholar : PubMed/NCBI
|
|
41
|
Yao X, Dong Q, Song Y, Wang Y, Deng Y and
Li Y: Thrombelastography maximal clot strength could predict
one-year functional outcome in patients with ischemic stroke.
Cerebrovasc Dis. 38:182–190. 2014. View Article : Google Scholar : PubMed/NCBI
|
|
42
|
Bliden KP, Tantry US, Gesheff MG, Franzese
CJ, Pandya S, Toth PP, Mathew DP, Chaudhary R and Gurbel PA:
Thrombin-induced platelet-fibrin clot strength identified by
thrombelastography: A novel prothrombotic marker of coronary artery
stent restenosis. J Interv Cardiol. 29:168–178. 2016. View Article : Google Scholar : PubMed/NCBI
|
|
43
|
Nystrup KB, Windeløv NA, Thomsen AB and
Johansson PI: Reduced clot strength upon admission, evaluated by
thrombelastography (TEG), in trauma patients is independently
associated with increased 30-day mortality. Scand J Trauma Resusc
Emerg Med. 19:522011. View Article : Google Scholar : PubMed/NCBI
|
|
44
|
Tantry US, Bonello L, Aradi D, Price MJ,
Jeong YH, Angiolillo DJ, Stone GW, Curzen N, Geisler T, ten Berg J,
et al: Consensus and update on the definition of on-treatment
platelet reactivity to adenosine diphosphate associated with
ischemia and bleeding. J Ame College Cardiol. 62:2261–2273. 2013.
View Article : Google Scholar
|
|
45
|
Cotton BA, Minei KM, Radwan ZA, Matijevic
N, Pivalizza E, Podbielski J, Wade CE, Kozar Ra and Holcomb JB:
Admission rapid thrombelastography predicts development of
pulmonary embolism in trauma patients. J Trauma Acute Care Surg.
72:1470–1475. 2012. View Article : Google Scholar : PubMed/NCBI
|
|
46
|
Brill JB, Badiee J, Zander AL, Wallace JD,
Lewis PR, Sise MJ, Bansal V and Shackford SR: The rate of deep vein
thrombosis doubles in trauma patients with hypercoagulable
thromboelastography. J Trauma Acute Care Surg. 83:413–419. 2017.
View Article : Google Scholar : PubMed/NCBI
|
|
47
|
Toukh M, Siemens DR, Black A, Robb S,
Leveridge M, Graham CH and Othman M: Thromboelastography identifies
hypercoagulablilty and predicts thromboembolic complications in
patients with prostate cancer. Thromb Res. 133:88–95. 2014.
View Article : Google Scholar : PubMed/NCBI
|
|
48
|
McDonald MM, Almaghrabi TS, Saenz DM, Cai
C, Rahbar MH, Choi HA, Lee K, Grotta JC and Chang TR: Dual
antiplatelet therapy is associated with coagulopathy detectable by
thrombelastography in acute stroke. J Intensive Care Med. Jan
1–2017.(Epub ahead of print). View Article : Google Scholar : PubMed/NCBI
|
|
49
|
Hsu PJ, Chen CH, Yeh SJ, Tsai LK, Tang SC
and Jeng JS: High plasma D-dimer indicates unfavorable outcome of
acute ischemic stroke patients receiving intravenous thrombolysis.
Cerebrovasc Dis. 42:117–121. 2016. View Article : Google Scholar : PubMed/NCBI
|
|
50
|
Zang RS, Zhang H, Xu Y, Zhang SM, Liu X,
Wang J, Gao YZ, Shu M, Mei B and Li HG: Serum C-reactive protein,
fibrinogen and D-dimer in patients with progressive cerebral
infarction. Transl Neurosci. 7:84–88. 2016. View Article : Google Scholar : PubMed/NCBI
|
|
51
|
Toh JM, Ken-Dror G, Downey C and Abrams
ST: The clinical utility of fibrin-related biomarkers in sepsis.
Blood Coagul Fibrinolysis. 8:839–843. 2013. View Article : Google Scholar
|
|
52
|
Sarin SK and Khanna R: Non-cirrhotic
portal hypertension. Clin Liver Dis. 18:451–476. 2014. View Article : Google Scholar : PubMed/NCBI
|
|
53
|
Weinmann EE and Carpenter JP:
Intraoperative urokinase as an alternative to heparin for patients
with suspected heparin-induced thrombocytopenia requiring arterial
reconstruction: Report of a case and review of the literature. J
Cardiovasc Surg (Torino). 37:463–465. 1996.PubMed/NCBI
|
|
54
|
Ridker PM, Hennekens CH, Cerskus A and
Stampfer MJ: Plasma concentration of cross-linked fibrin
degradation product (D-dimer) and the risk of future myocardial
infarction among apparently healthy men. Circulation. 90:2236–2240.
1994. View Article : Google Scholar : PubMed/NCBI
|
|
55
|
Berge E, Friis P and Sandset PM:
Hemostatic activation in acute ischemic stroke. Thromb Res.
101:13–21. 2001. View Article : Google Scholar : PubMed/NCBI
|
|
56
|
Krarup LH, Sandset EC, Sandset PM and
Berge E: D-dimer levels and stroke progression in patients with
acute ischemic stroke and atrial fibrillation. Acta Neurol Scand.
124:40–44. 2011. View Article : Google Scholar : PubMed/NCBI
|