Introduction
Nitric oxide (NO) is an endogenous free radical that
has previously been challenging to measure within blood samples,
due to its reactive nature and short half-life; however, the Griess
assay is currently widely applied to measure NO via the
quantification of nitrite (NO2−); Wen and
Paik (1) indirectly measured
aliphatic β-nitroalcohols and the Greiss assay has also been used
to investigate the NO-dependent egradation pathway of CYP2C22
(2). Jansen et al (3) also used the Greiss assay to study the
nitric oxide synthase (NOS) active site. As NO reacts with
molecular oxygen to generate nitrate (NO3−)
and NO2−, the latter is soluble in water and
is easier to detect (4). The
NO2− is acidified (usually with phosphoric
acid) to form nitrous acid to allow diazotization via the
nitrosation of sulfanilic acid. Once sulfanilamide is produced, the
reaction with N-1-napthylethylenediamine dihydrochloride produces a
purple chromophore with an absorbance at 540 nm (5).
The Griess reaction is inexpensive, simple and fast;
however, the limit of detection is ~0.5 µM, which restricts the
application of this colorimetric method for quantifying micromolar,
nanomolar and picomolar levels of NO2−, and
therefore physiological amounts (6).
Furthermore, the media composition in biological systems may alter
the measurements of NO due to the presence of other proteins, such
as hemoglobin, which is also detected at 540 nm (7). More sophisticated methods have also
been used to measure biological NOS. Independently of whether it is
a prokaryotic or eukaryotic culture, NO may be classified via
direct or indirect methods. In the latter methods, other biological
components may be measured in addition to
NO2− or NO3−, such as
guanosine monophosphase (cGMP) (8),
L-citrulline (9) and nitrosothiols
(10).
As NO is a free radical, electron paramagnetic
resonance spectroscopy may be used as a direct method to estimate
NO levels; however low levels of NO, poor sensitivity and the
complexity of the evaluation of the results, reduces the efficacy
of this method in biological contexts (11,12).
Fluorescence assays are more precise, indirect
methods to measure NO with a sensitivity of 0.6–0.8 nM. This
technique involves a reaction between a secondary metabolite of NO
and a derivatizing agent, which generates a fluorescent molecule
(6). This technique has been used in
biological samples, including culture with mammalian cells as it
allows real-time measurements, ease of use and high sensitivity
(13,14).
High-performance liquid chromatography (HPLC) has
been used previously to quantify NO (15) due to its high sensitivity (16) and was identified as a potentially
more useful method to quantify NO in hepatocyte cell culture, based
on the reaction of NO2 with 2, 3-diaminonaphthalene
(DAN) as an indicator of NO formation, under acidic conditions to
obtain the fluorescent product 2, 3-naphthotriazole (NAT) (13). DAN has excitation and emission
wavelengths of 375 and 415 nm, respectively, and a 10–30 nM
detection limit (14).
NO has numerous molecular targets in various
biological schemes, for instance in the cardiovascular system, it
stimulates cardioprotective signaling pathways (11); whereas in the nervous system it
modulates synaptic functions (17),
and has implications in learning, memory and visual recognition
(18). Through endogenous metabolic
pathways, NO is mainly synthesized by three different isoforms of
NOS depending on the cell type and stimulus: Neuronal NOS (nNOS or
NOS I), endothelial NOS (eNOS or NOS III) and inducible NOS (iNOS
or NOS II) (19).
It has previously been demonstrated that
acetylsalicylic acid (ASA) exhibits antiviral properties against
hepatitis C virus (HCV) (20).
Therefore, one possible explication for the antiviral properties of
ASA is that it may be mediated by the antioxidant properties of SOD
(21). In addition, it has been
confirmed in our laboratory that hepatocytes increase NO expression
when exposed to higher concentrations of ASA. However, as NO is
produced in the picomolar range within hepatocyte cells culture
(5), more precise quantification
techniques are required.
The aim of the present study was to measure NO in
culture medium of subgenomic HCV-replicon expressing Huh-7 cells
following treatment with ASA.
Materials and methods
Cell culture and ASA treatment
Human liver Huh-7 cells containing HCV subgenomic
replicon from genotype 1b (harboring the subgenomic HCV replicon
I389/NS3-30), the original wild-type pFKI389-NS3-3′
replicon HCV from genotype 1b and the generation of Huh7 HCV
replicon hepatoma cells expressing HCV non-structural proteins have
been previously described (22) and
were kindly donated by Dr Volker Lohmann (University Hospital
Heidelberg, Heidelberg, Germany) (23) were cultured in Advanced Dulbecco's
modified Eagle's medium (Gibco; Thermo Fisher Scientific, Inc.,
Waltham, MA, USA) supplemented with 2% heat-inactivated fetal
bovine serum, 1% non-essential amino acids, 100 U penicillin G, and
100 µg streptomycin/ml (all Gibco; Thermo Fisher Scientific, Inc.)
at 37°C in a humidified atmosphere with 5% CO2. Cells
were maintained in culture in the presence of 500 µg/ml G418
(Gibco; Thermo Fisher Scientific, Inc.) selection agent.
Huh-7-HCV-replicon cells were plated the previous day, media was
replaced and cells were treated with 4 mM ASA at 37°C for 24, 48
and 72 h (Sigma-Aldrich; Merck KGaA, Darmstadt, Germany). Alamar
Blue (Invitrogen; Thermo Fisher Scientific, Inc.) was used to
determine whether there were any cytotoxic effects; none were
observed.
Cell viability assay
Cell viability was assessed in Huh-7 cells using
alamar blue in 96-well plates at 37°C for 24, 48 and 72 h
post-incubation. The absorbance was monitored at 570 and 600
nm.
HPLC system
A Waters HPLC system (Waters Corporation, Milford,
MA, USA) including a 600E quaternary pump equipped with a column
oven, a 717p automatic injector and a 2475 multi-wavelength
fluoresce detector was used. The system was controlled by the
Empower software version. 2.0 (Waters, Elstree, UK) and the
information was processed with the same software. A standard curve
was generated with NO2− stock. The NO
production was quantified in the culture medium through the
measurement of nitrites NO2− using the HPLC
system with a fluorescence detector; λ excitation 375 nm and λ
emission 415 nm.
Sample preparation and NO
quantification by HPLC analysis
Briefly, 100 µl supplemented culture medium (blank)
or 100 µl medium derived from a viral cell culture (45,000 cells)
was mixed with 200 µl analytical grade acetonitrile. Samples were
homogenized using a vortex for 30 sec and centrifuged at 7,800 × g
for 30 min at room temperature. The supernatant was recovered and
the solvent was evaporated using a Savant VLP80 Vacuum Pump-Dry
Compressor for 3–4 h. Each sample was dehydrated as in the previous
step and then reconstituted in 100 µl Milli-Q H2O. A
total of 1 mg 2′-DAN (Sigma-Aldrich; Merck KGaA) was mixed with 1
ml 0.62 M HCl. For each sample (100 µl), 10 µl DAN was added for
the conversion to fluorescent NAT. Tubes were incubated at 27°C for
10 min. Subsequently, 5 µl 2.8 M NaOH was added. These mixtures
were directly used for the chromatographic analysis. The mixture
was injected into the HPLC equipment using a flow of 1 ml/min and a
mobile phase of phosphate:methanol buffer (50:50) under isocratic
conditions; 375 and 415 nm were selected as excitation and emission
wavelengths, respectively. Each sample was analysed by
triplicate.
Mobile phase with 50% of 15 mM sodium phosphate
buffer (pH=7.5) and 50% methanol, was pumped through the HPLC
system at a flow rate of 1 ml/min. A Symmetry 4.6×150 mm,
reversed-phase C18 column and a guard-column packed with C18 were
used for the assay, and the inner column was heated to 37°C. A
total of 10 µl of the derivative nitrite solution was injected into
the HPLC system. Fluorescence was monitored with an excitation
wavelength of 375 nm, emission of 415 nm and a gain of 10.
Measurement of NO
The calibration curve was produced using the culture
medium as matrix and the interference by ASA was eliminated by
measuring 4 mM ASA without NO2− standard
(125, 250, 500, 750 and 1,000 pM), and was validated by linear
regression. The medium cell-derived Huh-7-HCV replicon-exposed to 4
mM ASA was processed with acetonitrile to remove proteins and
retain only the salt deposits. Each sample was incubated at 27°C
for 10 min with 1 mg DAN-derivative agent to yield a fluorescent
signal, detected by HPLC with a fluorescence detector; λ excitation
375 nm and λ emission 415 nm. The resulting readings were
interpolated in the calibration curve.
As controls of NO production, arginine (inducer of
NO) and inhibitor of NO (L-NIL) were selected to confirm whether
the cell model was responsive to ASA stimuli and therefore regulate
NO production.
Statistical analysis
Experiments were performed in triplicate and were
analyzed using one-way analysis of variance and Dunnett's test. The
calibration curves were evaluated by linearity (y= mx+b) and the
coefficient of variation was calculated using the following
formula: % coefficient of variation (CV)=[(standard deviation/mean)
×100] to evaluate the precision between the triplicates. Data are
presented as the mean ± standard deviation. P<0.05 was
considered to indicate a statistically significant difference. The
data was analyzed using SPSS version 20 (IBM Corp., Armonk, NY,
USA).
Results
Calibration curve linearity and
precision
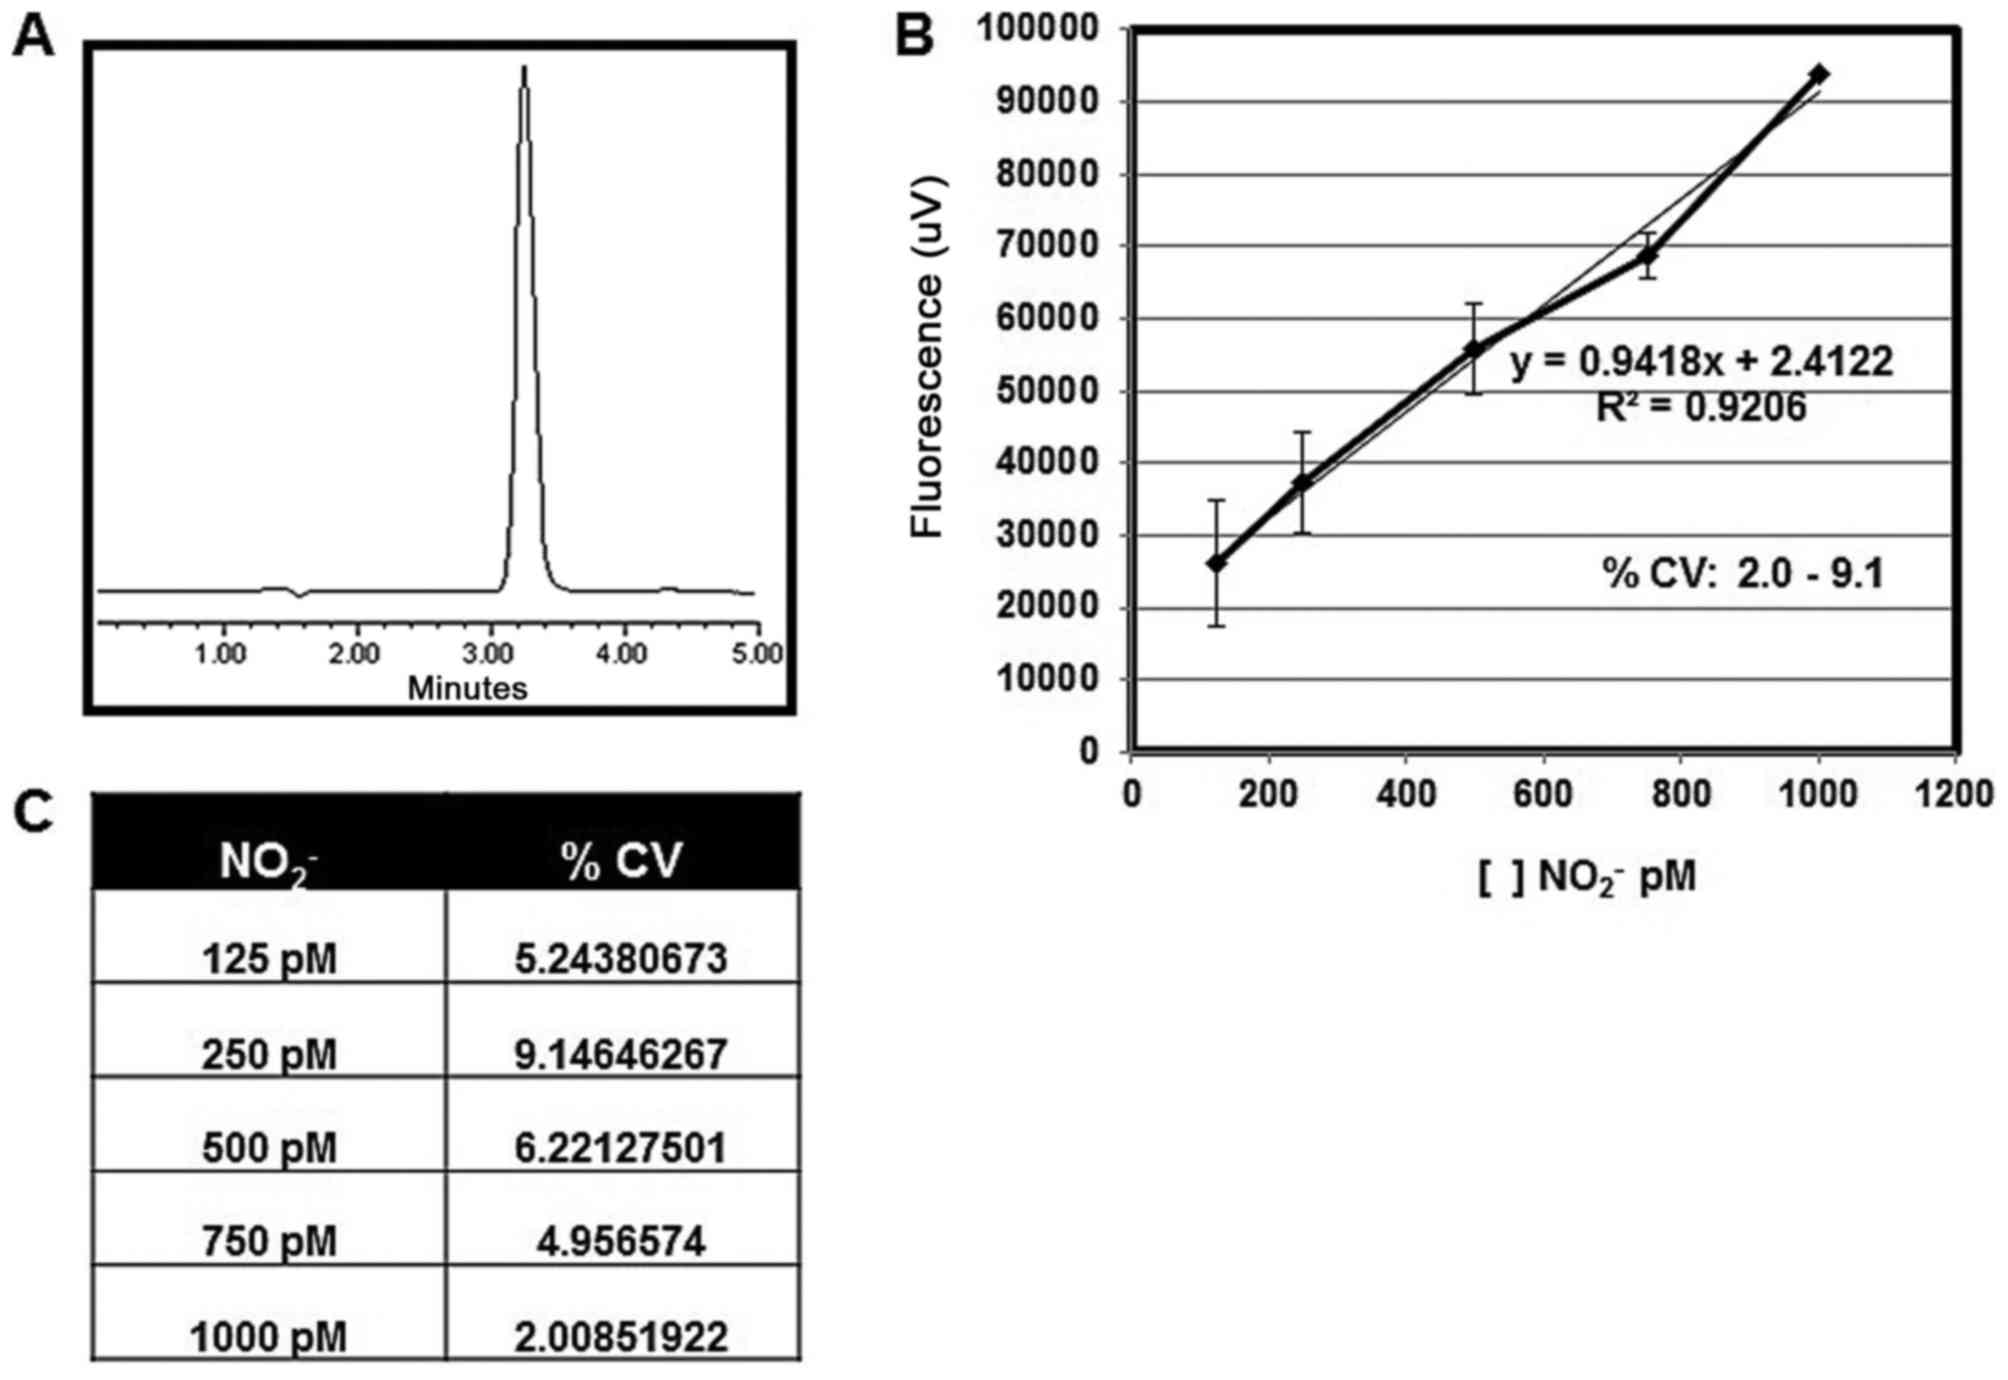
The calibration curve was prepared using different
concentrations of NO2− standard (125, 250,
500, 750 and 1,000 pM); these concentrations were assayed in
triplicate. The curve presented good linearity
(R2=0.9206) and the equation obtained was
y=0.9418×+2.4122 (x=NO pM; y=fluorescense unit). The CV range was
2.0–9.1%. In the chromatograms, single peaks were observed with
~3.2 min as retention time (Fig.
1).
Determination of NO in
Huh-7-HCV-replicon cells culture medium
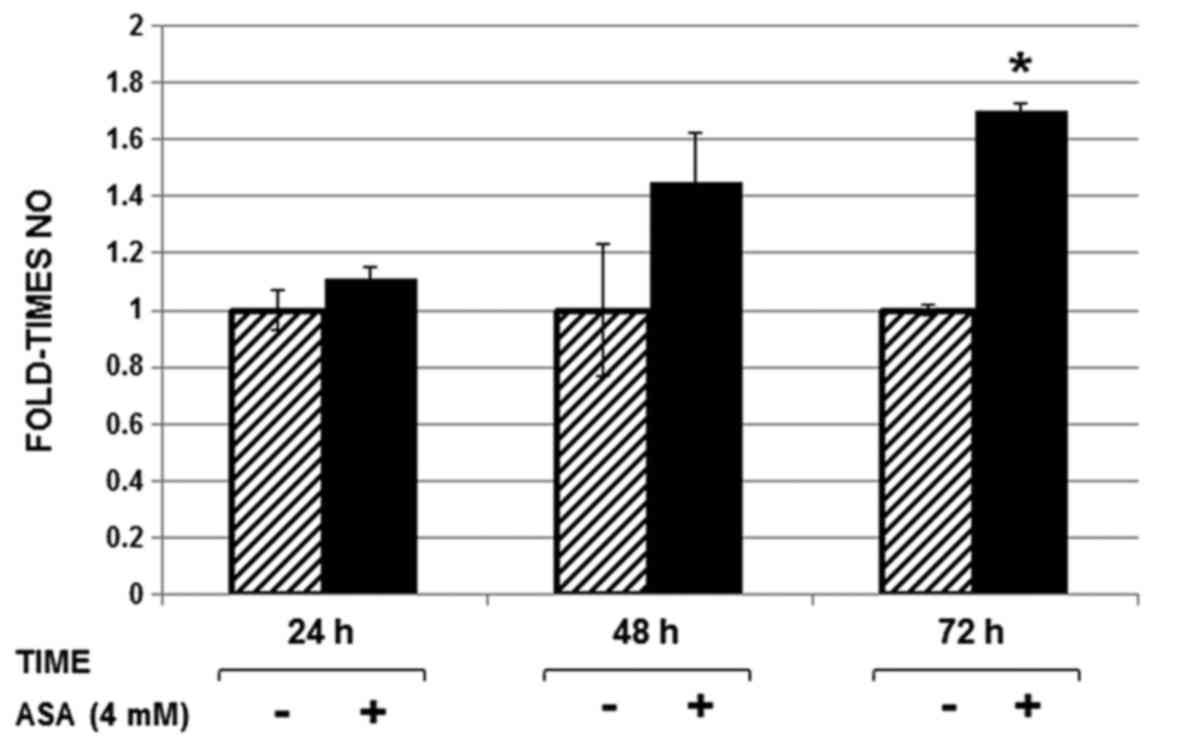
Each sample was incubated with DAN (derivative
agent) and thereafter analyzed by HPLC. NO levels were
significantly higher (1.7 fold) in Huh-7 replicon cells treated
with ASA at 72 h post-treatment compared with NO levels from
untreated cells (Fig. 2).
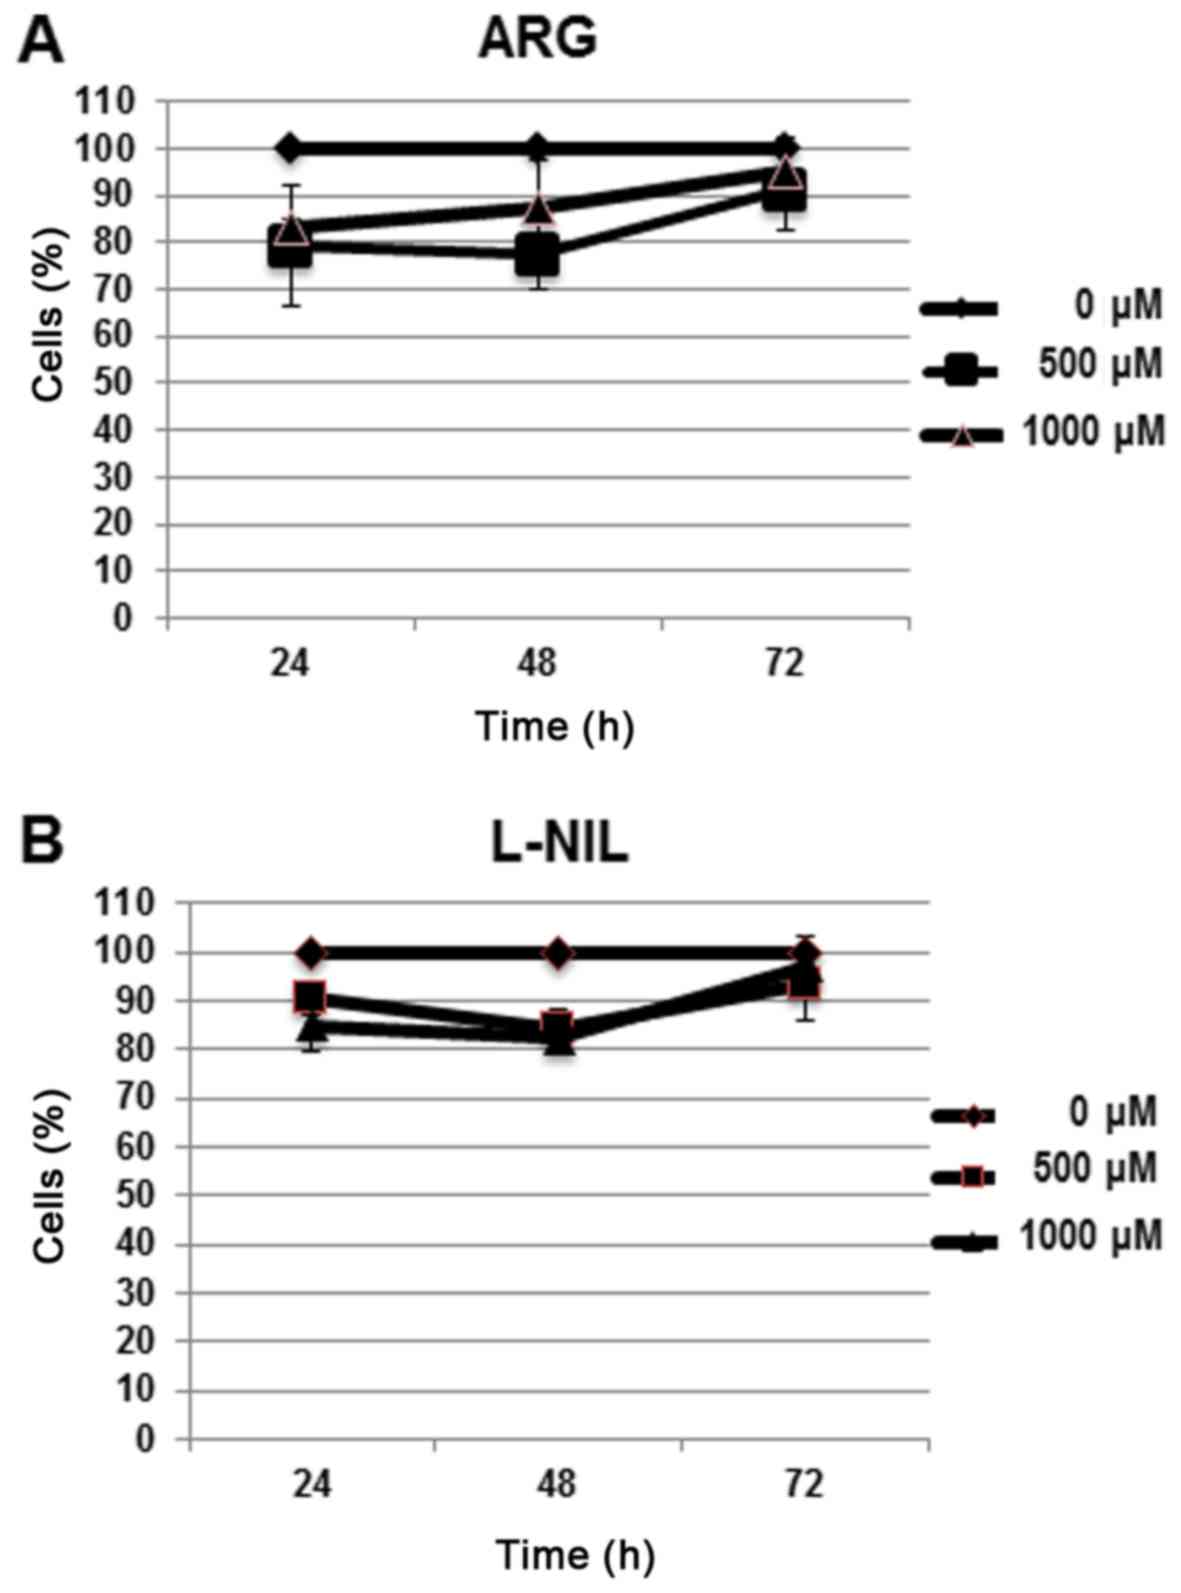
To identify non-cytotoxic concentrations of the
control solutions in Huh-7 cell line, a cell viability assay with
alamar blue was performed (Fig. 3A and
B); 1,000 µM was selected for arginine and 250 µM was selected
for L-NIL as the non-cytotoxic concentrations in the model
(Table I).
 | Table I.Cell viability assay, measuring the
percentage of viable cells using alamar blue for 500 and 1,000 µM
ARG, and with 100 and 500 µM L-NIL at 24, 48 and 72 h. |
Table I.
Cell viability assay, measuring the
percentage of viable cells using alamar blue for 500 and 1,000 µM
ARG, and with 100 and 500 µM L-NIL at 24, 48 and 72 h.
| A, ARG |
|---|
|
|---|
| Time (h) | 0 µM (%) | 500 µM (%) | 1,000 µM (%) |
|---|
| 24 | 100.00 | 79.30±12.8 | 83.00±2.00 |
| 48 | 100.00 | 77.60±7.70 |
87.60±10.00 |
| 72 | 100.00 | 91.00±8.70 | 95.00±7.20 |
|
| B,
L-NIL |
|
| Time
(h) | 0 µM
(%) | 100 µM
(%) | 500 µM
(%) |
|
| 24 | 100.00 | 90.33±3.21 | 85.00±5.29 |
| 48 | 100.00 | 84.00±4.35 | 82.33±3.05 |
| 72 | 100.00 | 93.30±7.23 | 97.00±6.08 |
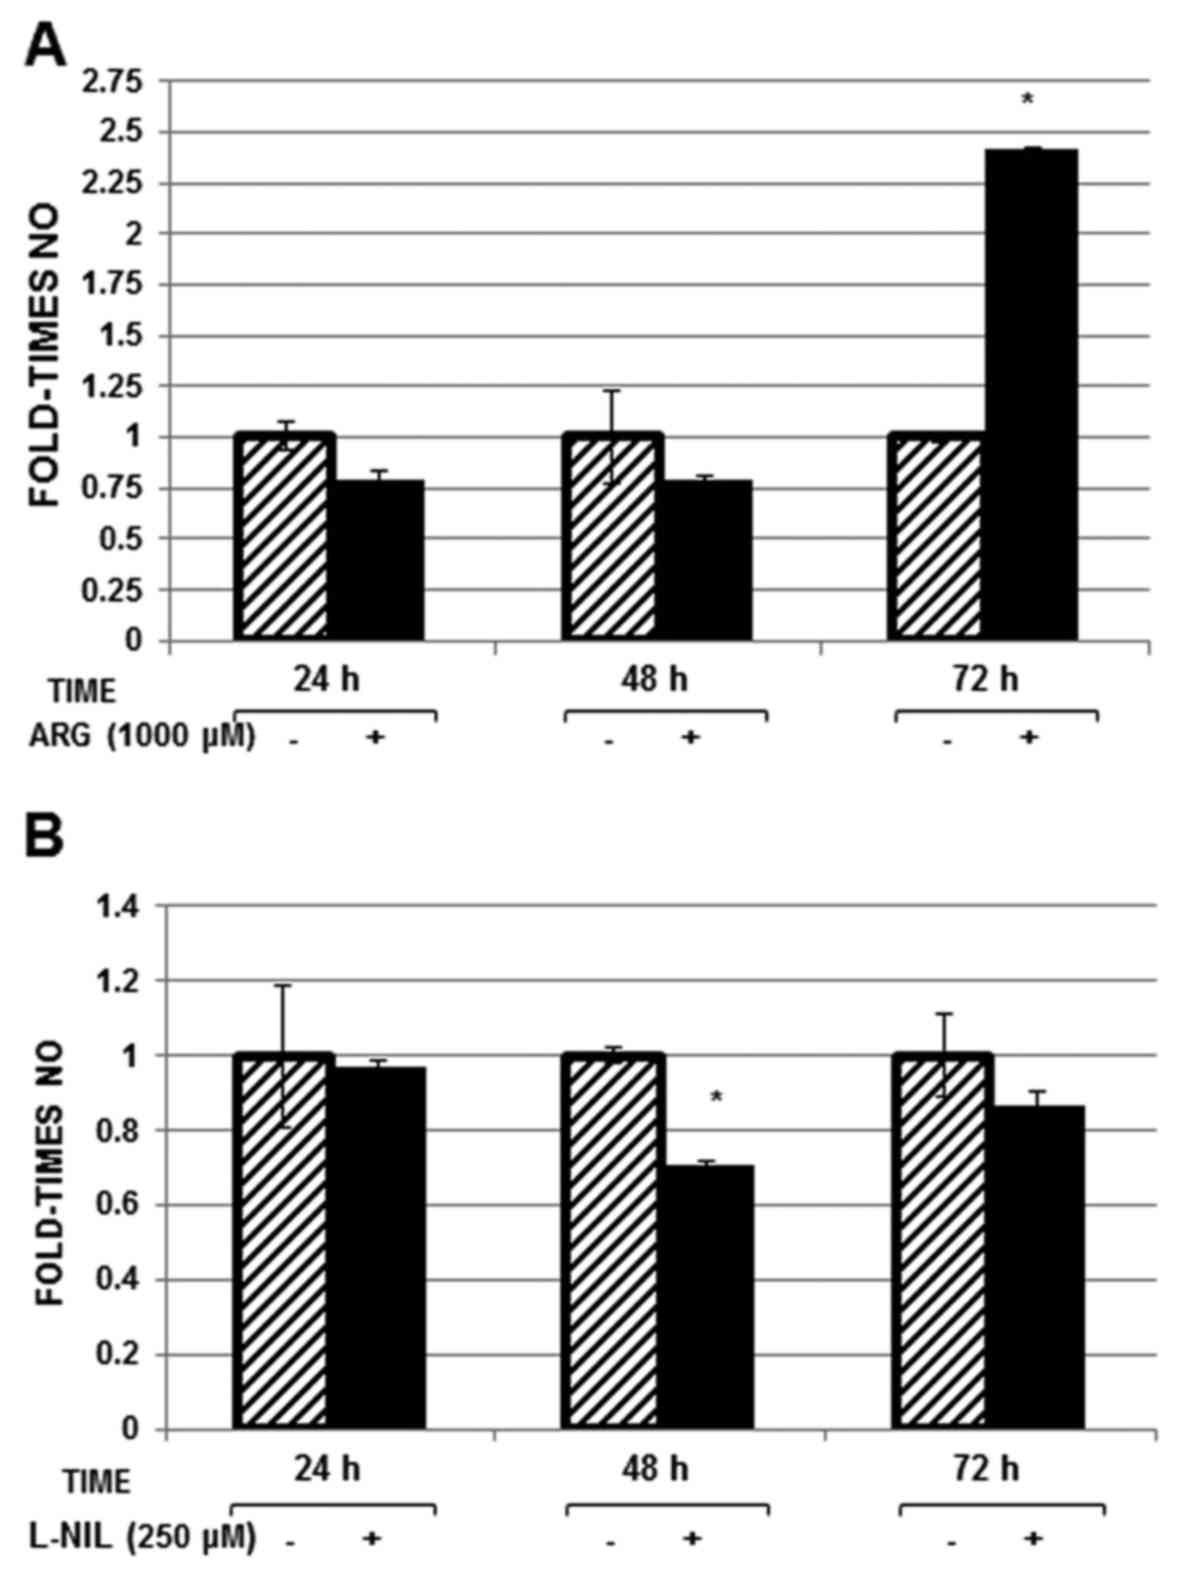
At 72 h arginine treatment, NO levels increased (2.3
fold; Fig. 4A), whereas NO levels
decreased ~30% at 48 h (P<0.05; Fig.
4B) in Huh-7 replicon cells treated with L-NIL compared with in
untreated cells.
Discusion
Hepatocytes produce NO in picomolar levels (6), therefore it is difficult to detect and
quantify NO levels within them. In the present study, the
HPLC-fluorescence detector method was employed. The aim of the
present study was to describe a simple and precise methodology to
quantify low concentrations of NO2−.
In a previous study performed in our laboratory, ASA
increased the activity and expression of superoxide dismutase
enzyme (20), which suggested that
the antiviral activity of ASA on HCV (22) is mediated, at least in part, by its
antioxidant properties. Therefore, the present study aimed to
quantify variations in NO levels upon this event under different
conditions.
It has been previously reported that iNOS-derived NO
has antiviral properties (4). The
transcription factors nuclear factor-κB and interferon regulatory
factor 1 induce the expression of iNOS to stimulate antiviral
activity to inhibit human herpes simplex virus 1 replication in
fibroblasts and macrophages (24);
however the mechanism by which it exerts the antiviral activity
requires further investigation (25). In addition, ASA has been reported to
increase NO production in endothelial cells via the NO-cGMP
signaling pathway, exhibiting numerous beneficial effects in
patients with chronic stable coronary disease (26).
To investigate whether ASA was able to increase the
levels of NO in liver cells, Huh-7-HCV replicon cells were exposed
to 4 mM ASA for 24, 48 and 72 h. A time-dependent increase by
1.7-fold after 72 h of exposure was observed, confirming the
potential of ASA to induce the production of NO. As a control
parameter, the levels of NO were measured in cells exposed to 1,000
µM arginine or 250 µM L-NIL (inducer and inhibitor of NO
respectively). An increase in the levels of NO was observed in
cells exposed to arginine, equivalent to two orders of magnitude,
whereas L-NIL reduced NO production and iNOS expression at the
transcriptional level. NO was previously quantified using the
Griess method (27), but the
detection range of the calibration curve using Griess method was
1.56–100 µM, whereas for the HPLC-fluorescence method the range was
125–1,000 pM. Therefore, HPLC may be more useful for the detection
of low NO concentrations.
Marzinzig, et al (28) previously compared and improved
standard methods to determine NO2−,
NO3− and S-nitrosothiol levels in cell
culture supernatants. The conventional Griess reaction was modified
by replacing sulfanilamide with dapsone
(4,4′-diamino-diphenylsulfone) and the NO2−
levels were measured. The modification, along with ultrafiltration
of the samples, resulted in an enhanced sensitivity to measure
NO2− at 0.2 µM. The detection limit was
further improved to 0.02 µM when NO2− was
identified by DAN.
Li et al (29)
previously separated NAT on a 5-micron reverse-phase C18 column
(inner diameter, 150×4.6 mm) guarded by a 40-µm reverse-phase C18
column (inner diameter, 50×4.6 mm), and eluted with 15 mM sodium
phosphate buffer (pH 7.5) containing 50% methanol (flow-rate, 1.3
ml/min). Fluorescence was monitored with excitation at 375 nm and
emission at 415 nm with fluorescence intensity of NAT was linear
with NO2− or NO3−
concentrations ranging from 12.5–2,000 nM, whereas the curve in the
present study was linear between 125 and 1,000 pM.
In the present study, the supernatant media was
subjected to evaporation with vacuum and cooling to obtain the salt
deposits containing NO2−, salts were
subsequently reacted with DAN agent for derivatization under acidic
conditions (HCl), which reacts with NO2− to
form a fluorescent molecule, NAT. The reaction was performed for 10
min at 27°C and the product was stabilized with NaOH. The product
of the derivatization was injected (10 µl) into a C18 reverse phase
column with a flow of 1 ml/min using as a mobile phase a mixture of
15 mM phosphate buffer pH 7.5 + methanol in a 50:50 ratio under
isocratic conditions (the same proportion is always maintained in
the mobile phase mixture). Finally, the signal was detected by
fluorescence with a 375 nm excitation wavelength and an emission of
415 nm.
The modulation of NO in the presence of ASA in
hepatocarcinoma cells with the structural proteins of HCV was
quantified in the present study. Therefore, it may be of importance
to analyze the effects of NO against the treatment with the
complete viral particles.
NO is a soluble and highly labile gas that is
released by the conversion of the amino acid L-arginine to
L-citrulline. For the synthesis of NO, in addition to L-arginine as
substrate, the presence of calmodulin (CaM) and four other
cofactors is required: Flavin mononucleotide (FMN), flavin adenine
dinucleotide (FAD), tetrahydrobloptenin (TBH) and nicotinamide
adenine dinucleotide phosphate (NADPH) (30). This reaction is catalyzed by the
enzyme NOS and can be inhibited by structural derivatives of the
amino acids N-mono-methyl-L-arginine and N-nitro-L-arginine methyl
esters (31).
When CaM is not bound to the enzyme, the electrons
donated by NAPDH do not flow from the reductase domain to the
oxygenase domain, but are accepted by cytochrome c and other
electron acceptors (32). In the
presence of CaM, the electrons donated by NADPH are transported by
FAD and by FMN to the heme group. L-arginine is converted to
N-hydroxyalanine, then to NO and L-citrulline (33). A limitation of the present study was
the fact that it was an in vitro investigation. The results
of the present study should be validated in samples from patients
infected with HCV.
In conclusion, the HPLC-fluorometric method was
confirmed to have the precision and linearity to produce confident
measures for NO levels in the cellular medium and therefore may be
used for routine monitoring of NO variation under various cell
media conditions. In the present study, ASA was observed to induce
NO production in Huh-7-HCV-replicon cells. These results suggest
that NO may be associated with the negative regulation of ASA on
HCV, particularly as NO is associated with antiviral properties on
certain viruses, including Epstein Barr, Dengue and human
immunodeficiency viruses, which supports previous research
(33).
Acknowledgements
Not applicable.
Funding
No funding was received.
Availability of data and materials
Not applicable.
Authors' contributions
AMRE and CPRI conceived and designed the study.
AMRE, CPRI, VTdlC and AGOR analyzed the data. AMRE and CPRI
interpreted the results of the experiments. AMRE, CPRI, VTdlC and
AGOR drafted the manuscript. AMRE, CPRI and VTdlC performed the
experiments. AMRE, CPRI, VTdlC and AGOR prepared the figures. AMRE,
CPRI, VTdlC and AGOR edited and revised the manuscript. AMRE, CPRI,
VTdlC and AGOR approved the final version of manuscript to be
published.
Ethics approval and consent to
participate
Not applicable.
Consent for publication
Not applicable.
Competing interests
The authors declare that they have no competing
interests.
References
|
1
|
Wen Q and Paik DC: Using the Griess
colorimetric nitrite assay for measuring aliphatic β-nitroalcohols.
Exp Eye Res. 98:52–57. 2012. View Article : Google Scholar : PubMed/NCBI
|
|
2
|
Lee CM, Lee BS, Arnold SL, Isoherranen N
and Morgan ET: Nitric oxide and interleukin-1β stimulate the
proteasome-independent degradation of the retinoic acid hydroxylase
CYP2C22 in primary rat hepatocytes. J Pharmacol Exp Ther.
348:141–152. 2014. View Article : Google Scholar : PubMed/NCBI
|
|
3
|
Labby Jansen K, Li H, Roman LJ, Martásek
P, Poulos TL and Silverman RB: Methylated N(ω)-hydroxy-L-arginine
analogues as mechanistic probes for the second step of the nitric
oxide synthase-catalyzed reaction. Biochemistry. 52:3062–3073.
2013. View Article : Google Scholar : PubMed/NCBI
|
|
4
|
Mehta DR, Ashkar AA and Mossman KL: The
nitric oxide pathway provides innate antiviral protection in
conjunction with the type I interferon pathway in fibroblasts. PLoS
One. 7:e316882012. View Article : Google Scholar : PubMed/NCBI
|
|
5
|
Gharavi N and El-Kadi AO: Measurement of
nitric oxide in murine Hepatoma Hepa1c1c7 cells by reversed phase
HPLC with fluorescence detection. J Pharm Pharm Sci. 6:302–307.
2003.PubMed/NCBI
|
|
6
|
Csonka C, Páli T, Bencsik P, Görbe A,
Ferdinandy P and Csont T: Measurement of NO in biological samples.
Br J Pharmacol. 172:1620–1632. 2015. View Article : Google Scholar : PubMed/NCBI
|
|
7
|
Hunter RA, Storm WL, Coneski PN and
Schoenfisch MH: Inaccuracies of nitric oxide measurement methods in
biological media. Anal Chem. 85:1957–1963. 2013. View Article : Google Scholar : PubMed/NCBI
|
|
8
|
Bartus K, Pigott B and Garthwaite J:
Cellular targets of nitric oxide in the hippocampus. PLoS One.
8:e572922013. View Article : Google Scholar : PubMed/NCBI
|
|
9
|
Kolluru GK, Yuan S, Shen X and Kevil CG:
H2S regulation of nitric oxide metabolism. Methods Enzymol.
554:271–297. 2015. View Article : Google Scholar : PubMed/NCBI
|
|
10
|
Hickok JR, Vasudevan D, Antholine WE and
Thomas DD: Nitric oxide modifies global histone methylation by
inhibiting Jumonji C domain-containing demethylases. J Biol Chem.
288:16004–16015. 2013. View Article : Google Scholar : PubMed/NCBI
|
|
11
|
Kirca M, Kleinbongard P, Soetkamp D, Heger
J, Csonka C, Ferdinandy P and Schulz R: Interaction between
connexin 43 and nitric oxide synthase in mice heart mitochondria. J
Cell Mol Med. 19:815–825. 2015. View Article : Google Scholar : PubMed/NCBI
|
|
12
|
Yuan S, Patel RP and Kevil CG: Working
with nitric oxide and hydrogen sulfide in biological systems. Am J
Physiol Lung Cell Mol Physiol. 308:L403–L415. 2015. View Article : Google Scholar : PubMed/NCBI
|
|
13
|
Ghebremariam YT, Huang NF, Kambhampati S,
Volz KS, Joshi GG, Anslyn EV and Cooke JP: Characterization of a
fluorescent probe for imaging nitric oxide. J Vasc Res. 51:68–79.
2014. View Article : Google Scholar : PubMed/NCBI
|
|
14
|
Lowry JL, Brovkovych V, Zhang Y and
Skidgel RA: Endothelial nitric-oxide synthase activation generates
an inducible nitric-oxide synthase-like output of nitric oxide in
inflamed endothelium. J Biol Chem. 288:4174–4193. 2013. View Article : Google Scholar : PubMed/NCBI
|
|
15
|
Chalupsky K, Kračun D, Kanchev I, Bertram
K and Görlach A: Folic acid promotes recycling of
tetrahydrobiopterin and protects against hypoxia-induced pulmonary
hypertension by recoupling endothelial nitric oxide synthase.
Antioxid Redox Signal. 23:1076–1091. 2015. View Article : Google Scholar : PubMed/NCBI
|
|
16
|
Wu A, Duan T, Tang D, Xu Y, Feng L, Zheng
Z, Zhu J, Wang R and Zhu Q: Determination of nitric oxide-derived
nitrite and nitrate in biological samples by HPLC coupled to
nitrite oxidation. Chromatographia. 76:1649–1655. 2013. View Article : Google Scholar : PubMed/NCBI
|
|
17
|
Sagi Y, Heiman M, Peterson JD, Musatov S,
Scarduzio M, Logan SM, Kaplitt MG, Surmeier DJ, Heintz N and
Greengard P: Nitric oxide regulates synaptic transmission between
spiny projection neurons. Proc Natl Acad Sci USA. 111:17636–17641.
2014. View Article : Google Scholar : PubMed/NCBI
|
|
18
|
Tamagnini F, Barker G, Warburton EC,
Burattini C, Aicardi G and Bashir ZI: Nitric oxide-dependent
long-term depression but not endocannabinoid-mediated long-term
potentiation is crucial for visual recognition memory. J Physiol.
591:3963–3979. 2013. View Article : Google Scholar : PubMed/NCBI
|
|
19
|
Förstermann U and Sessa WC: Nitric oxide
synthases: Regulation and function. Eur Heart J. 33(829–837):
837a–837d. 2012.
|
|
20
|
Sánchez-García A, Ríos-Ibarra CP,
Rincón-Sánchez AR, Ortiz-López R, Garza-Juárez A, Morlett-Chávez J,
Martínez-Rodríguez H and Rivas-Estilla AM: Use of proteomic
analysis tools to identify HCV-proteins down-regulated by
acetylsalicylic acid. Ann Hepatol. 12:725–732. 2013.PubMed/NCBI
|
|
21
|
Rivas-Estilla AM, Bryan-Marrugo OL,
Trujillo-Murillo K, Pérez-Ibave D, Charles-Niño C, Pedroza-Roldan
C, Ríos-Ibarra C, Ramírez-Valles E, Ortiz-López R, Islas-Carbajal
MC, et al: Cu/Zn superoxide dismutase (SOD1) induction is
implicated in the antioxidative and antiviral activity of
acetylsalicylic acid in HCV-expressing cells. Am J Physiol
Gastrointest Liver Physiol. 302:G1264–G1273. 2012. View Article : Google Scholar : PubMed/NCBI
|
|
22
|
Lohmann V, Körner F, Koch JO, Herian U,
Theilmann L and Bartenschlager R: Replication of subgenomic
hepatitis C virus RNAs in a hepatoma cell line. Science.
285:110–113. 1999. View Article : Google Scholar : PubMed/NCBI
|
|
23
|
Trujillo-Murillo K, Rincón-Sánchez AR,
Martínez-Rodríguez H, Bosques-Padilla F, Ramos-Jiménez J,
Barrera-Saldaña HA, Rojkind M and Rivas-Estilla AM: Acetylsalicylic
acid inhibits hepatitis C virus RNA and protein expression through
cyclooxygenase 2 signaling pathways. Hepatology. 47:1462–1472.
2008. View Article : Google Scholar : PubMed/NCBI
|
|
24
|
Glatthaar-Saalmüller B, Mair KH and
Saalmüller A: Antiviral activity of aspirin against RNA viruses of
the respiratory tract-an in vitro study. Influenza Other Respir
Viruses. 11:85–92. 2017. View Article : Google Scholar : PubMed/NCBI
|
|
25
|
Hetzel S, DeMets D, Schneider R, Borzak S,
Schneider W, Serebruany V, Schröder H and Hennekens CH: Aspirin
increases nitric oxide formation in chronic stable coronary
disease. J Cardiovasc Pharmacol Ther. 18:217–221. 2013. View Article : Google Scholar : PubMed/NCBI
|
|
26
|
Moore TC, Bush KL, Cody L, Brown DM and
Petro TM: Control of early Theiler's murine encephalomyelitis virus
replication in macrophages by interleukin-6 occurs in conjunction
with STAT1 activation and nitric oxide production. J Virol.
86:10841–10851. 2012. View Article : Google Scholar : PubMed/NCBI
|
|
27
|
Ríos-Ibarra CP, Lozano-Sepulveda S,
Muñoz-Espinosa L, Rincón-Sánchez AR, Cordova-Fletes C and
Rivas-Estilla AM: Downregulation of inducible nitric oxide synthase
(iNOS) expression is implicated in the antiviral activity of
acetylsalicylic acid in HCV-expressing cells. Arch Virol.
159:3321–3328. 2014. View Article : Google Scholar : PubMed/NCBI
|
|
28
|
Marzinzig M, Nussler AK, Stadler J,
Marzinzig E, Barthlen W, Nussler NC, Beger HG, Morris SM Jr and
Brückner UB: Improved methods to measure end products of nitric
oxide in biological fluids: Nitrite, nitrate, and S-nitrosothiols.
Nitric Oxide. 1:177–189. 1997. View Article : Google Scholar : PubMed/NCBI
|
|
29
|
Li H, Meininger CJ and Wu G: Rapid
determination of nitrite by reversed-phase high-performance liquid
chromatography with fluorescence detection. J Chromatogr B Biomed
Sci Appl. 746:199–207. 2000. View Article : Google Scholar : PubMed/NCBI
|
|
30
|
Morris SM Jr: Enzymes of arginine
metabolism. J Nutr. 134 10 Suppl:2743S–2747S, Discussion
2765S-2767S. 2004. View Article : Google Scholar : PubMed/NCBI
|
|
31
|
Griffith OW and Stuehr DJ: Nitric oxide
synthases: Properties and catalytic mechanism. Annu Rev Physiol.
57:707–736. 1995. View Article : Google Scholar : PubMed/NCBI
|
|
32
|
Haque MM, Fadlalla MA, Aulak KS, Ghosh A,
Durra D and Stuehr DJ: Control of electron transfer and catalysis
in neuronal nitric-oxide synthase (nNOS) by a hinge connecting its
FMN and FAD-NADPH domains. J Biol Chem. 287:30105–30116. 2012.
View Article : Google Scholar : PubMed/NCBI
|
|
33
|
Takhampunya R, Padmanabhan R and Ubol S:
Antiviral action of nitric oxide on dengue virus type 2
replication. J Gen Virol. 87:3003–3011. 2006. View Article : Google Scholar : PubMed/NCBI
|