Introduction
Systemic lupus erythematosus (SLE) is asystemic
autoimmune disease characterized by abnormal immune response
leading to malfunction in several organs (1–3). Lupus
nephritis (LN) occurs in ~50% of patients with SLE and is a major
cause of morbidity and mortality among the affected individuals.
Immunosuppressants are used for the treatment of LN; however, these
are effective in only 50% of the affected patients (4,5). The
therapy is usually associated with severe adverse effects,
including increased risk of infertility and sepsis (6). Despite the overall improvement in the
care of patients with LN during the past two decades, almost 20% of
patients progress to end-stage renal disease within 10 years after
the onset (7). Therefore, in
addition to exploring more effective, less toxic drugs, it is
essential to elucidate the molecular mechanisms underlying the
pathogenesis of LN.
Preliminary studies have demonstrated the important
role of autoantibodies, proinflammatory cytokines and toll-like
receptors in the pathogenesis of LN (8–11).
Previous studies also indicated that immune and inflammatory
reactions in the glomerular mesangial cells (MCs) primarily lead to
LN progression (12,13). However, the contributing mechanisms
remain unclear. An in vitro model of LN was developed in the
present study. MCs were treated with sera from patients with LN
confirmed by renal biopsy. This model (derived from LN patient sera
samples) mimics autoantibodies and other biological mediators,
including anti-double stranded DNA antibodies, interleukin (IL)-12
and IL-18 cytokines that stimulate MCs leading to an immune
response and inflammatory reactions. Previous studies focused on
specific pathogenic factors in LN progression (14–16). The
present study used a quantitative proteomic approach to elucidate
the global alterations in protein abundance in MCs simulated by
sera from patients with LN.
Several proteomics techniques have been used
previously to investigate LN (17,18).
Among these, two-dimensional gel electrophoresis, followed by mass
spectrometry (MS) analysis is the most widely used method to
analyze the expressions of different proteins; however, it exhibits
low reproducibility and is time-consuming (19). Furthermore, this assay has low
sensitivity for the detection of low abundance proteins with low
molecular weight (LMW) <20 kDa. These LMW proteins may include
important mediators which are expected to be involved in the
progression of renal disease, including chemokines, cytokines and
growth factors. By contrast, two-dimensional difference gel
electrophoresis (2D-DIGE) is an assay that separates proteins
according to their isoelectric point and molecular weight. With an
internal standard, the 2D-DIGE technologies can be used to
determine and quantify the proteins accurately, and the
reproducibility of this method reduces the required number of
biological replicates (20).
In the current study, 2D-DIGE combined with
matrix-assisted laser desorption/ionization time of flight tandem
(MALDI-TOF/TOF) MS was used to detect the differentially expressed
proteins in MCs stimulated by sera of patients with LN. These
proteins are candidate biomarkers of LN.
Patients and methods
Patients
A total of 10 patients with LN were recruited from
the Division of Nephrology, First Affiliated Hospital of Guangzhou
University of Traditional Chinese Medicine (Guangzhou, China). LN
was confirmed according to the 1999 World Health Organization
criteria (21). The classification
of LN was based on the International Society of Nephrology and the
Renal Pathology Society criteria established in 2003 and revised in
2004 (22). In addition, 5 healthy
age- and sex-matched volunteer participants were included as normal
controls. Based on the SLE disease activity index (SLEDAI) score, 5
class I LN (LN-I) patients with an SLEDAI score of 10–14 were
collected, which indicated intermediate activity. Furthermore, 5
class IV LN (LN-IV) patients with an SLEDAI score of >15
indicated high activity. Written informed consent was obtained from
each donor prior to enrollment in the study. The protocol was
approved by the Ethics Committee of The First Affiliated Hospital
of Guangzhou University of Traditional Chinese Medicine.
Serum sample collection
A total of 5 ml whole blood was collected from each
subject and centrifuged at 2,200 × g for 10 min at 4°C (Heraeus™
Fresco™ 21 Microcentrifuge; Thermo Fisher Scientific, Inc.,
Waltham, MA, USA) (23). Sera were
collected, filtered with serum filters (EMD Millipore, Billerica,
MA, USA) and preserved at −80°C.
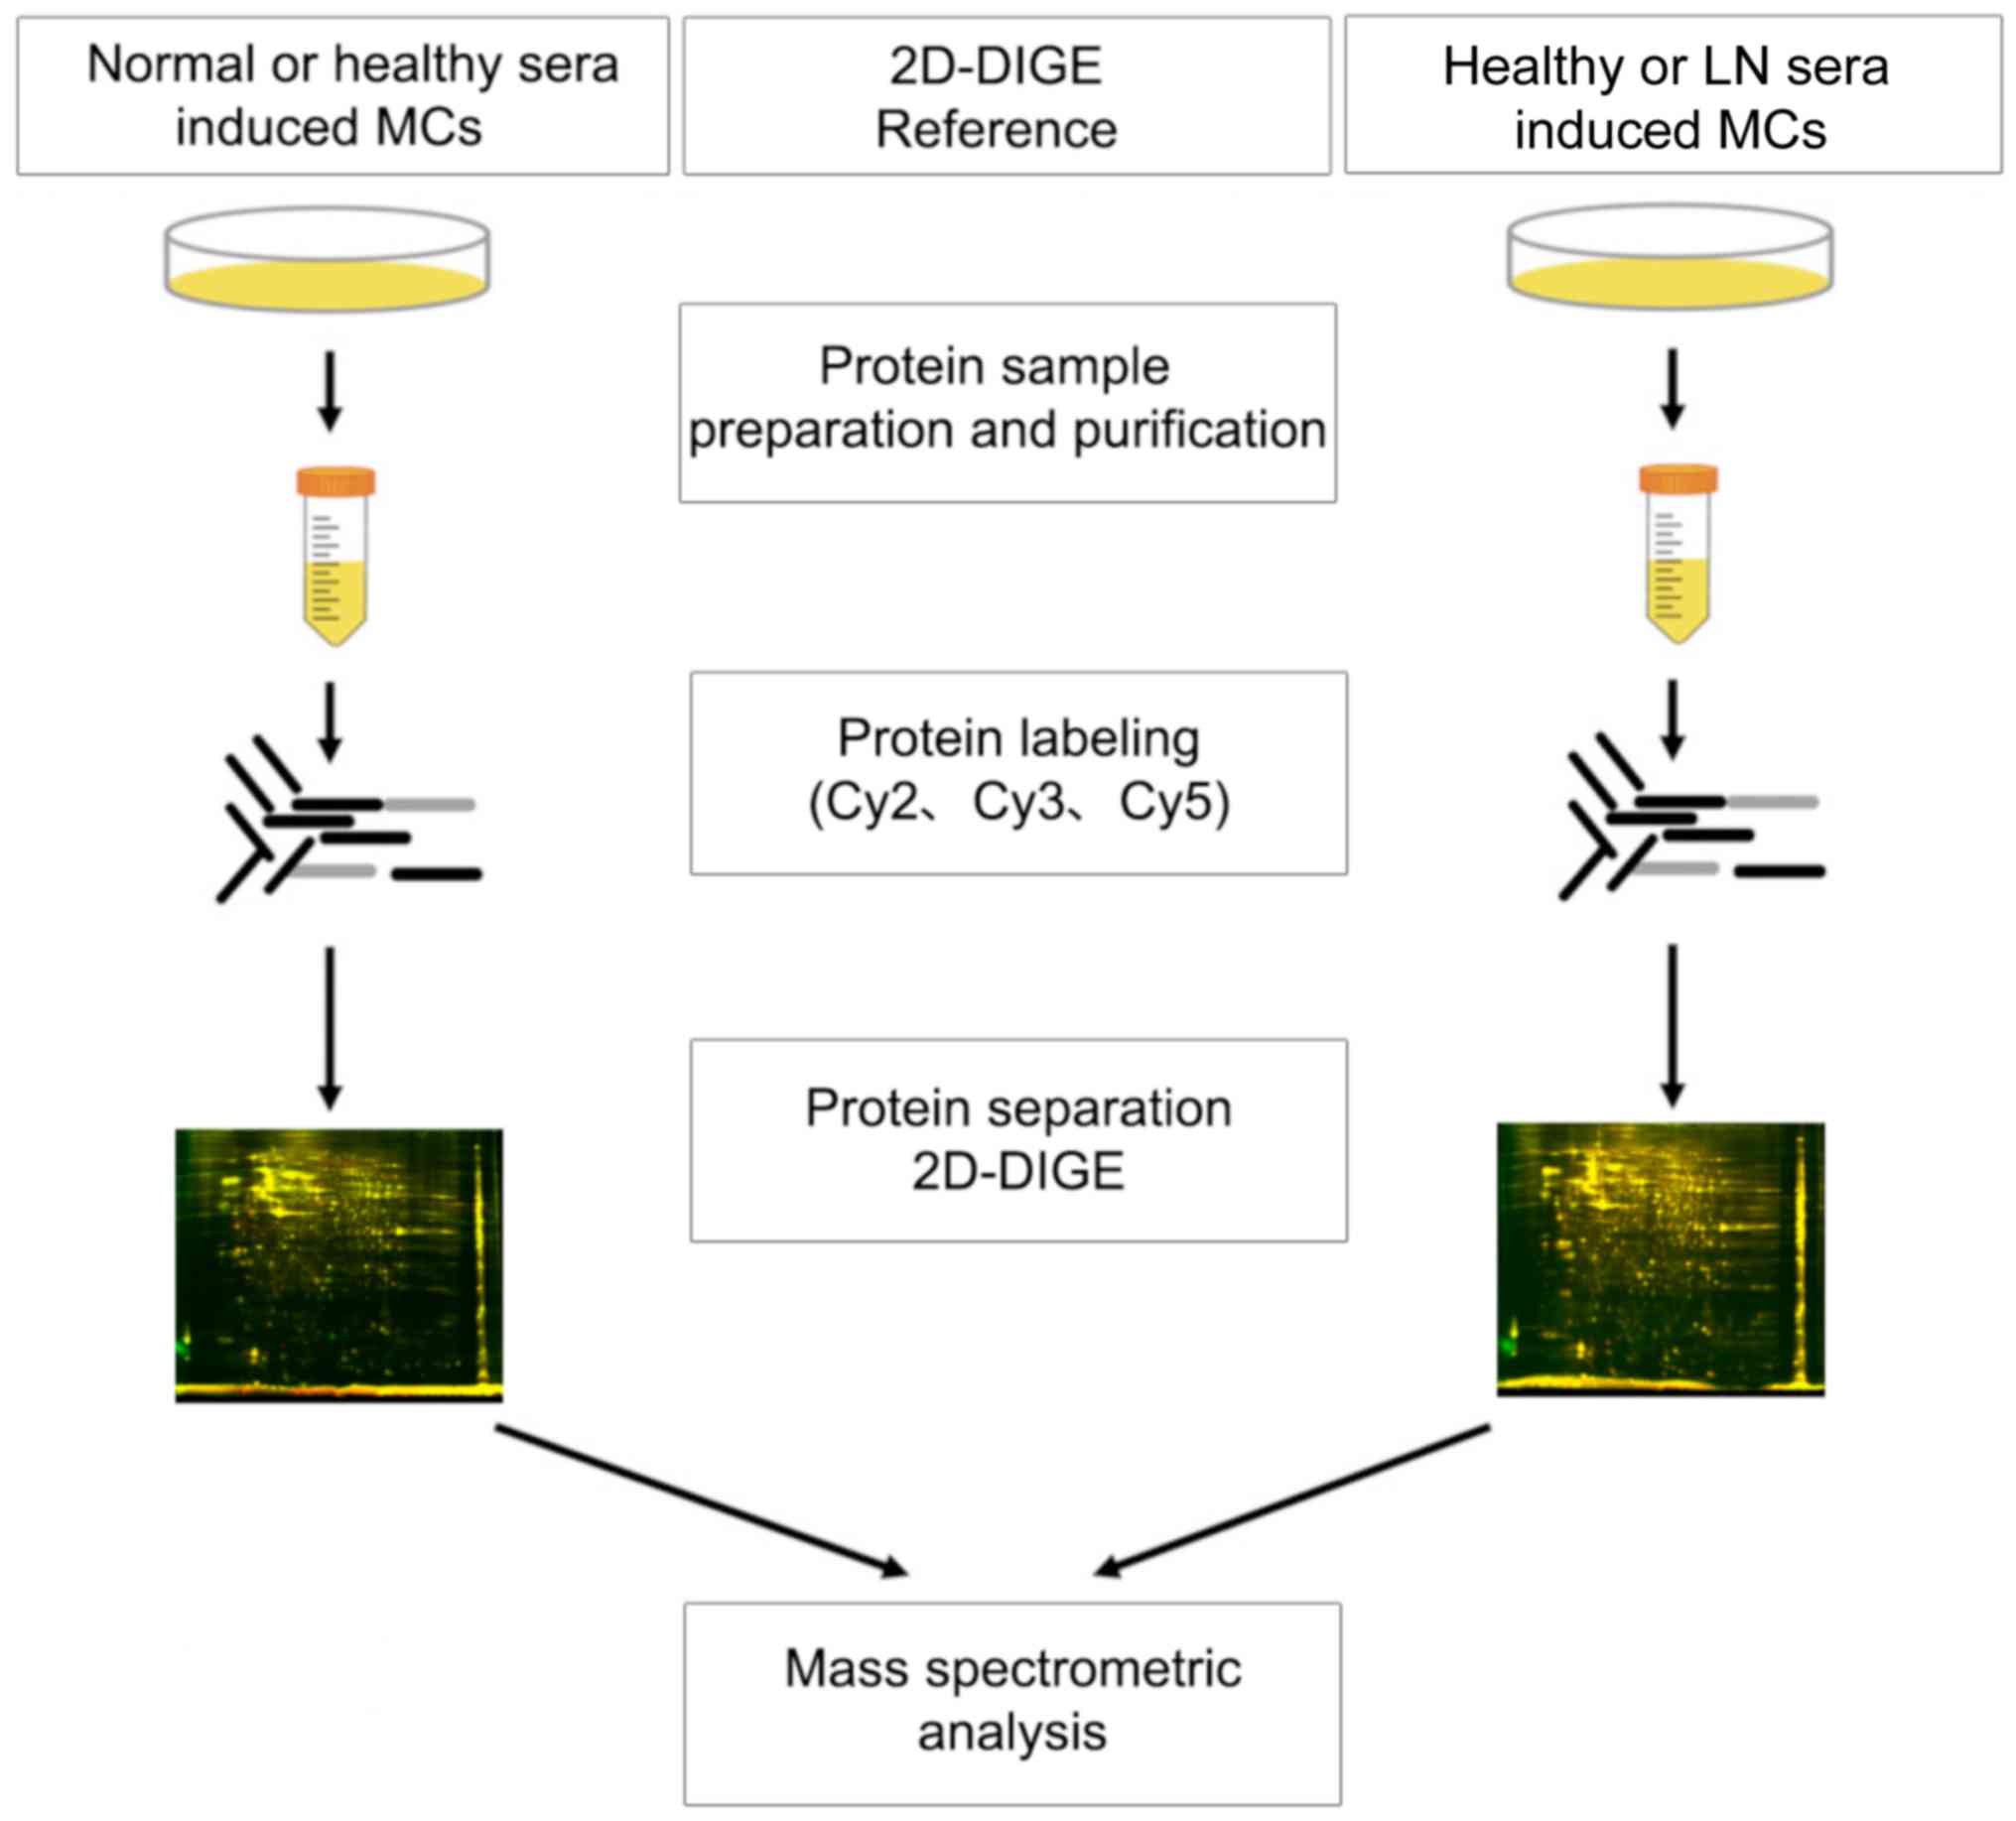
Cell culture and treatment
Human glomerular MCs were purchased from Shanghai
Enzyme Research Biotechnology Co., Ltd. (Shanghai, China; cat. no.
CC-Y1261; www.elisakits.cn/Index/productInfo/cid/153/id/1311.html).
The cell culture was maintained according to the procedures
described previously (24). Briefly,
MCs were cultured in Dulbecco's modified Eagle's medium/nutrient
mixture F12 containing 5% fetal bovine serum (both Gibco; Thermo
Fisher Scientific, Inc.). After serum starvation for 24 h, MCs were
treated with 7 ml DMEM/f12 and 3 ml sera from different
individuals, which comprised the 30% sera. MCs were then cultured
at 37°C for 24 h. Normal control MCs were treated with 7 ml
DMEM/f12 and 3 ml calf serum (Gibco; Thermo Fisher Scientific,
Inc.), which also comprised 30% serum. The subsequent experimental
design is illustrated in Fig. 1.
Protein purification and
determination
Whole-cell lysates were prepared using 2-D Clean-up
kit (GE Healthcare Life Sciences, Uppsala, Sweden) to deplete salt,
lipid and polysaccharides from the samples. The concentrations of
protein samples were determined using Ettan™ 2-D Quant kit (GE
Healthcare Life Sciences), according to the manufacturer's
protocol.
Protein labeling
Sample labeling was performed using CyDye DIGE Fluor
minimal dyes (GE Healthcare Life Sciences), according to the
manufacturer's protocol. Briefly, 50 µg protein from each sample
was mixed with 400 pmol of either CyDye DIGE Fluor Cy3 or Cy5. The
internal standard was prepared by mixing equal volumes of different
protein samples and labeling with CyDye DIGE Fluor Cy2. The
labeling reactions were carried out on ice in the dark for 30 min
and stopped by adding 1 µl of 10 mM lysine.
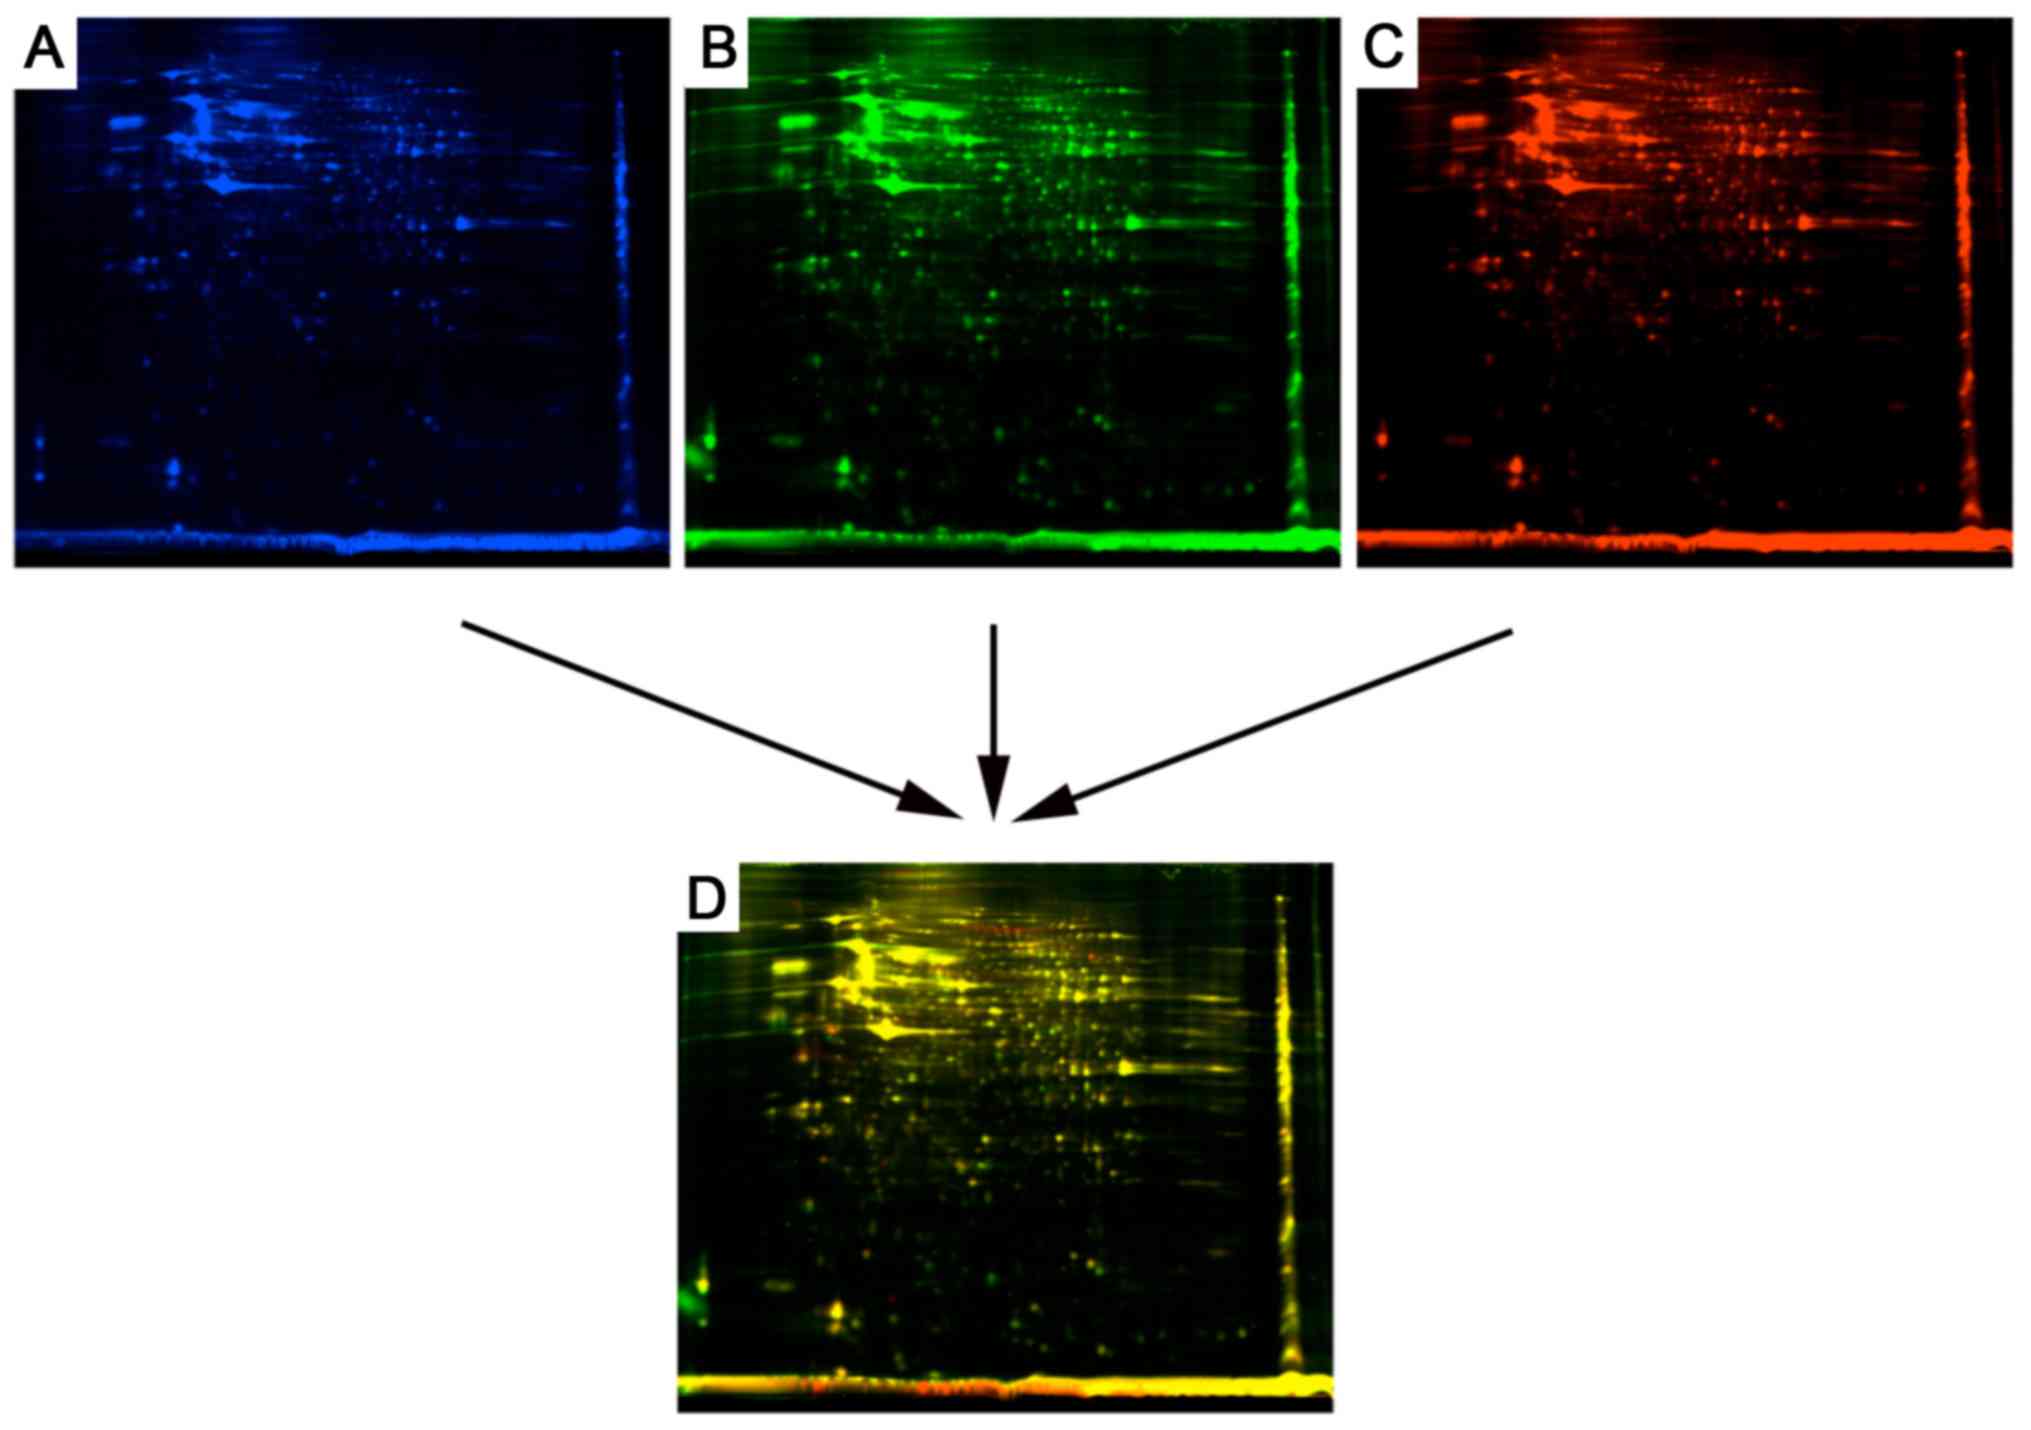
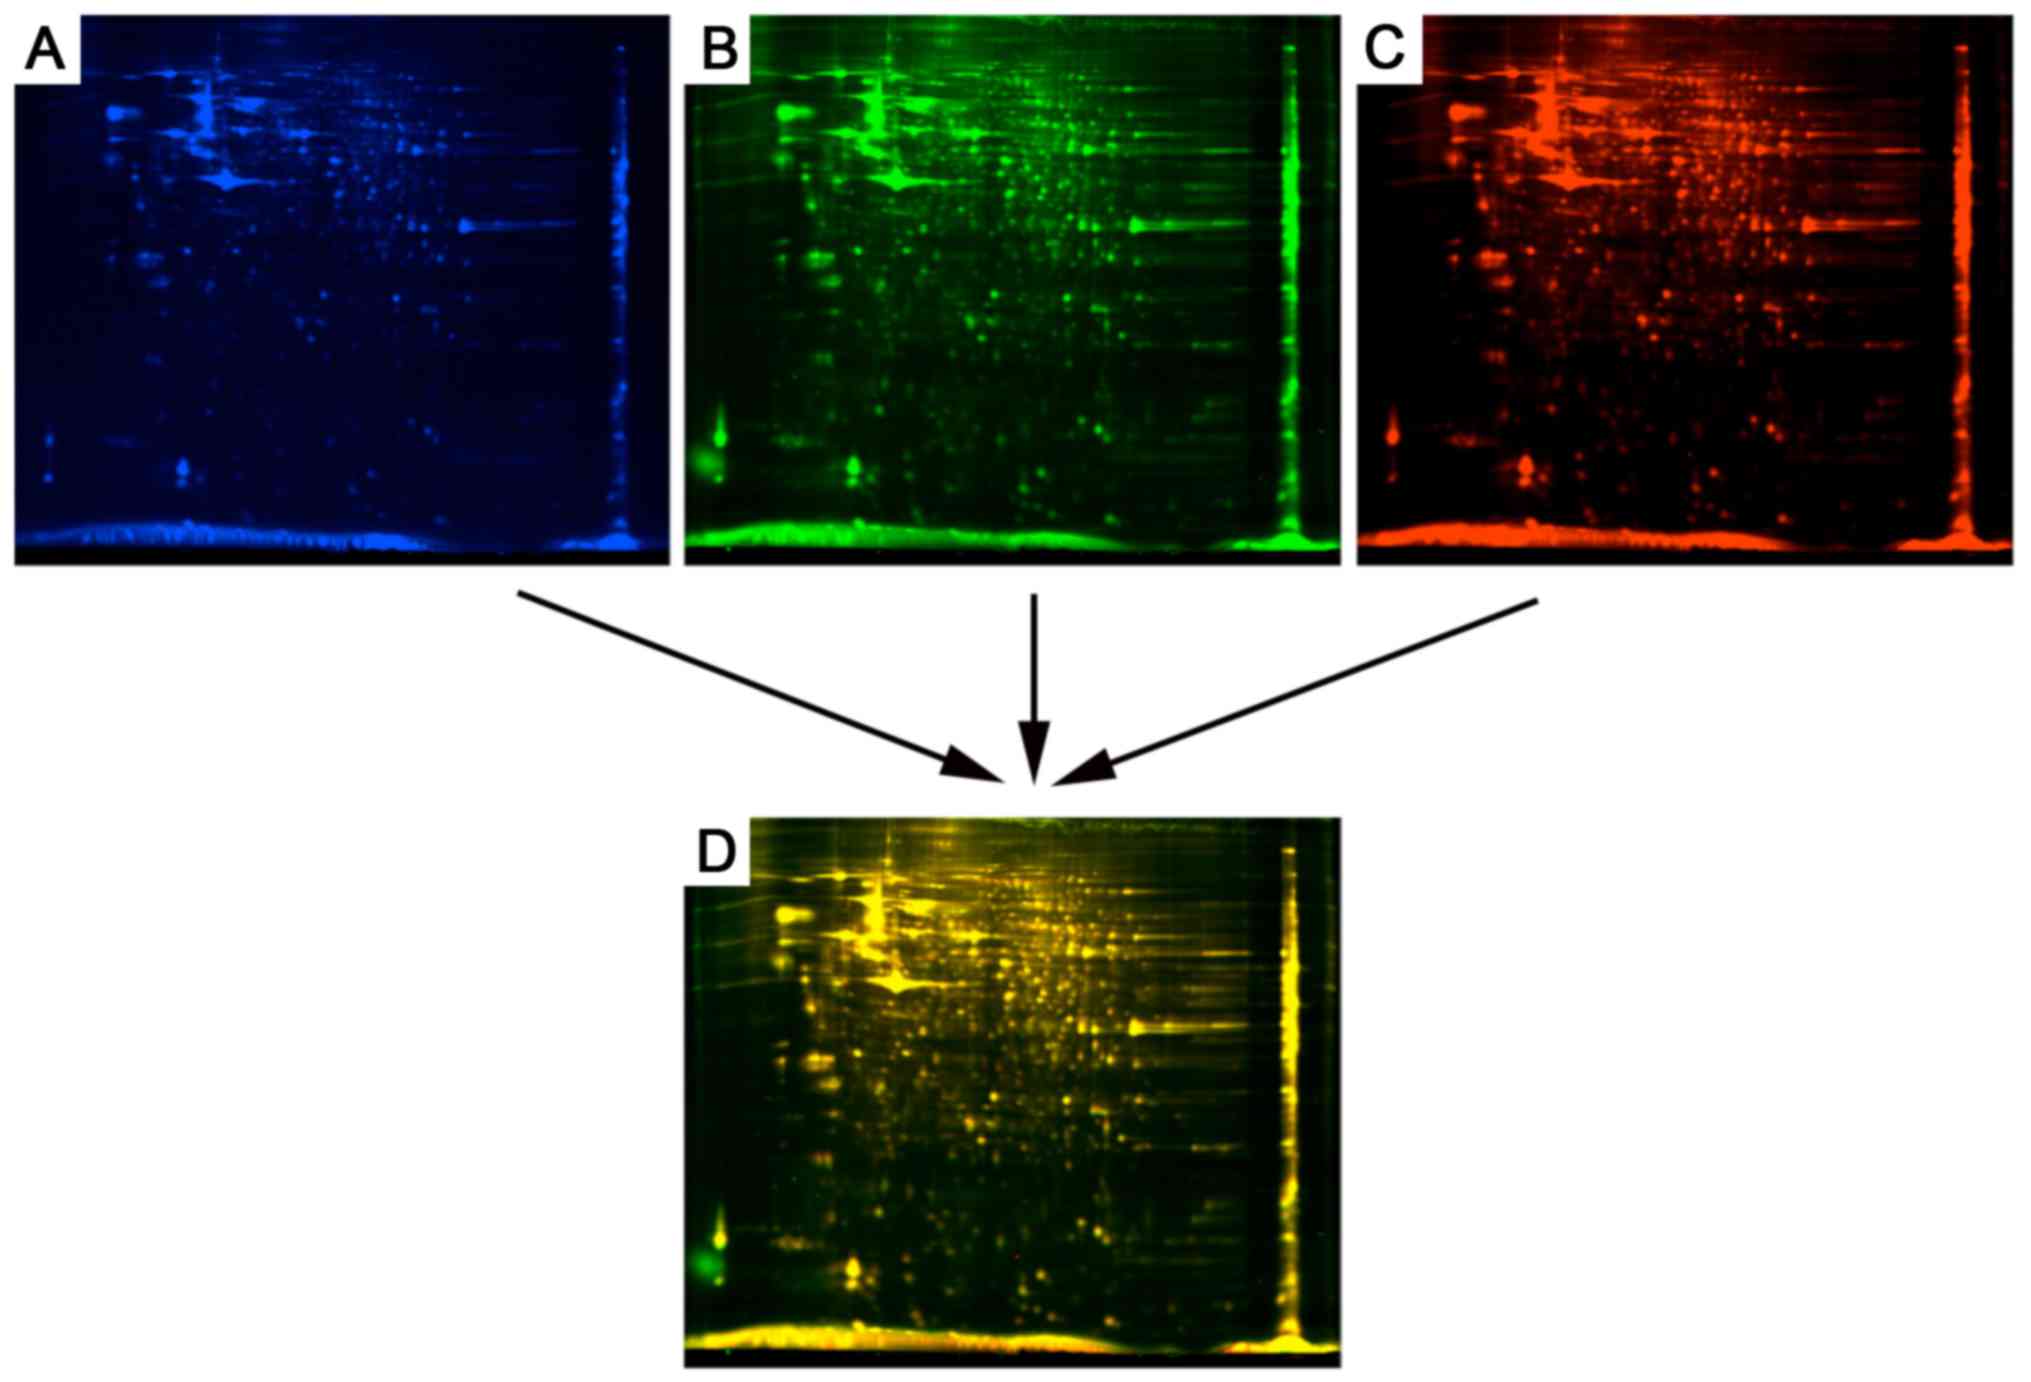
Protein separation by 2D-DIGE
Two DIGE gels were prepared including gel A and gel
B. In gel A, the samples of normal calf serum (NC) group were
labeled with Cy3 and samples of the normal human (NH) group with
Cy5. In gel B, the lupus nephritis class I (LN-I) group samples
were labeled with Cy3 and those of the lupus nephritis class IV
(LN-IV) group with Cy5. The labeled protein samples were placed in
24-cm immobilized pH gradient (IPG) gel strips with pH 3–10. Each
sample contained 50 µg Cy2-, Cy3- or Cy5-labeled proteins. The IPG
strip was hydrated at 30 V for 12 h and the subsequent program was
performed as follows: 100 V for 0.5 h, 500 V for 0.5 h, 1,000 V for
1 h and 5,000 V for 1 h, and then stabilized at 8,000 V under
isoelectric focusing for 8.5 h. Following one-dimension
electrophoresis, the IPG was stabilized in solution A (6 mmol/l
Urea, 2% SDS, 75 mmol/l Tris-HCl pH8.8, 29.3% glycerol, 1% DTT,
Bromophenol blue) for 15 min and then treated with solution B (6
mmol/l Urea, 2% SDS, 75 mmol/l Tris-HCl pH 8.8, 29.3% glycerol,
2.5% iodoacetamide) for 15 min. Following this, two-dimension
electrophoresis was performed with 12.5% SDS-PAGE.
Gel scanning and image analysis
Typhoon 9400 scanner (GE Healthcare Life Sciences)
was used to scan the gels following 2D-DIGE. The Cy2-, Cy3- and
Cy5-labelled samples were scanned at wavelengths of 488/520,
532/580 and 633/670 nm, respectively. Samples were stained 0.25%
Coomassie Brilliant Blue R-250 staining at room temperature for 2–4
h. Gels were then prefixed in 50% MeOH, 10% HoAC and 40%
H2O for 30 min to overnight. Staining was considered
complete when the gel was no longer visible in the dye solution.
Prior to complete staining, the gels appeared lighter against the
dark staining solution. Samples were de-stained at room temperature
using 5% MeOH, 7.5% HOAC, 87.5% H2O until the
backgrounds were clear for 4–24 h. Bands began to appear in 1–2 h.
This method detects as little as 0.1 µg/band. Gels were then stored
in 7% HOAC. The Photomultiplier Tube (PMT) value with maximum gray
level with respect to the whole gel or within the region of
interest was in the range of 60,000–90,000 standards. (20) DeCyder 2D software (version 7.0; GE
Healthcare Life Sciences) was used to analyze the 2D-DIGE gel
images. The differential protein spots were identified based on the
>1.5-fold difference in size (>1.5-fold upregulated or
downregulated). After 2D-DIGE, proteins were digested with trypsin.
The selected gel particles were collected using Ettan™ Spot Picker
(GE Healthcare Life Sciences) and cryopreserved in 500 µl Eppendorf
Tubes® at −20°C for subsequent MS.
MS analysis
The aforementioned gel particles were subjected to
peptide mass fingerprinting (PMF) analysis by MALDI-TOF/TOF (ABI
4800 Proteomic Analyzer; Applied Biosystems; Thermo Fisher
Scientific, Inc.). PMF was assimilated when protein content was
within a range of 800–4,000 Da. Subsequently, 10 most intense peaks
were selected to obtain tandem mass spectrometry (MS/MS) data.
Conjunction search was conducted with MS and MS/MS. Results with a
total score >64 and a match of >4 peptide fragments (best ion
score >30; P<0.05) were accepted. The bioinformatics data of
PMF by MS and MS/MS were searched by Mascot engine (Version 2.1,
Matrix Science, Ltd., London, UK) in MSDB and Swiss-Prot database
(25).
Properties of proteins
WoLF PSORT software (version of PSORT II;
Piscataway, NJ, USA) was utilized to analyze the molecular function
of proteins.
Search Tool for the Retrieval of
Interacting Genes (STRING) protein-protein analysis
The STRING protein interaction database
(version-10-5) was used to analyze associations among proteins.
STRING is a protein-protein analysis database program that
generates a network of interactions from a variety of sources,
including different interaction databases, text mining, genetic
interactions and shared pathway interactions. We used this search
Tool for the Retrieval of Interacting Genes with a confidence
cut-off of 0.6.
Western blot analysis
MC Protein expression was analyzed by western
blotting as described previously (26). The following primary antibodies were
used: Anti-Annexin A2 (cat. no. ab178677), anti-ferritin heavy
chain (FTH1; cat. no. ab75972; both Abcam, Cambridge, MA, USA) and
anti-α-tubulin (cat. no. T9026; Sigma-Aldrich; Merck KGaA,
Darmstadt, Germany).
Statistical analysis
Data are presented as the mean ± standard deviation.
Comparisons between groups were made using one-way analysis of
variance followed by Student-Newman-Kuels test. P<0.05 was
considered to indicate a statistically significant difference. The
statistical analyses were performed using SPSS software (version
16.0; SPSS, Inc., Chicago, IL, USA). In-gel difference analysis was
performed using DeCyder 2D software (version 7.0) automatically;
results were compared between gels.
Results
Clinical characteristics
Patients and normal healthy donors were well matched
for sex and age (Table I). Active
SLE patients (LN-IV) presented high levels of proteinuria, while
inactive SLE patients (LN-I) showed intermediate levels. SLE is
more prevalent among females (27)
and, therefore, there were more females than males included in the
present study.
 | Table I.Clinical characteristics and
demographic data of the study subjects. |
Table I.
Clinical characteristics and
demographic data of the study subjects.
| Characteristic | NH group | LN-I group | LN-IV group |
|---|
| Individuals
(n) | 5 | 5 | 5 |
| Age (years) | 33.32±3.07 | 34.36±3.26 | 32.12±2.81 |
| Sex (M/F) | 1/4 | 1/4 | 1/4 |
| Proteinuria (g/24
h) | 0.05±0.02 |
1.59±0.45a |
3.39±0.85b |
| Urine erythrocyte
(104/ml) | 0.2±0.1 | 34.8±14.1 |
61.4±20.2b |
| BUN (mmol/l) | 4.16±0.40 |
6.04±1.56a |
8.38±1.54b |
| Scr (μmol/l) | 43.2±11.6 |
108.7±56.3a | 123.4±76.5 |
| ANA positive
(%) | 0 | 40 | 100 |
| Anti-dsDNA positive
(%) | 0 | 40 | 100 |
| Complement C3
(g/l) | 1.10±0.15 |
0.72±0.11a |
0.47±0.13b |
| Complement C4
(g/l) | 0.50±0.05 |
0.18±0.06a |
0.13±0.04b |
| SLEDAI (score) | 0 | 10.6±2.7 |
19.8±2.6b |
| Duration of LN
(months) | 0 | 9.2±1.3 | 7.2±2.5 |
Proteomics results
The paired analyses of DIGE dye-labeled gels were
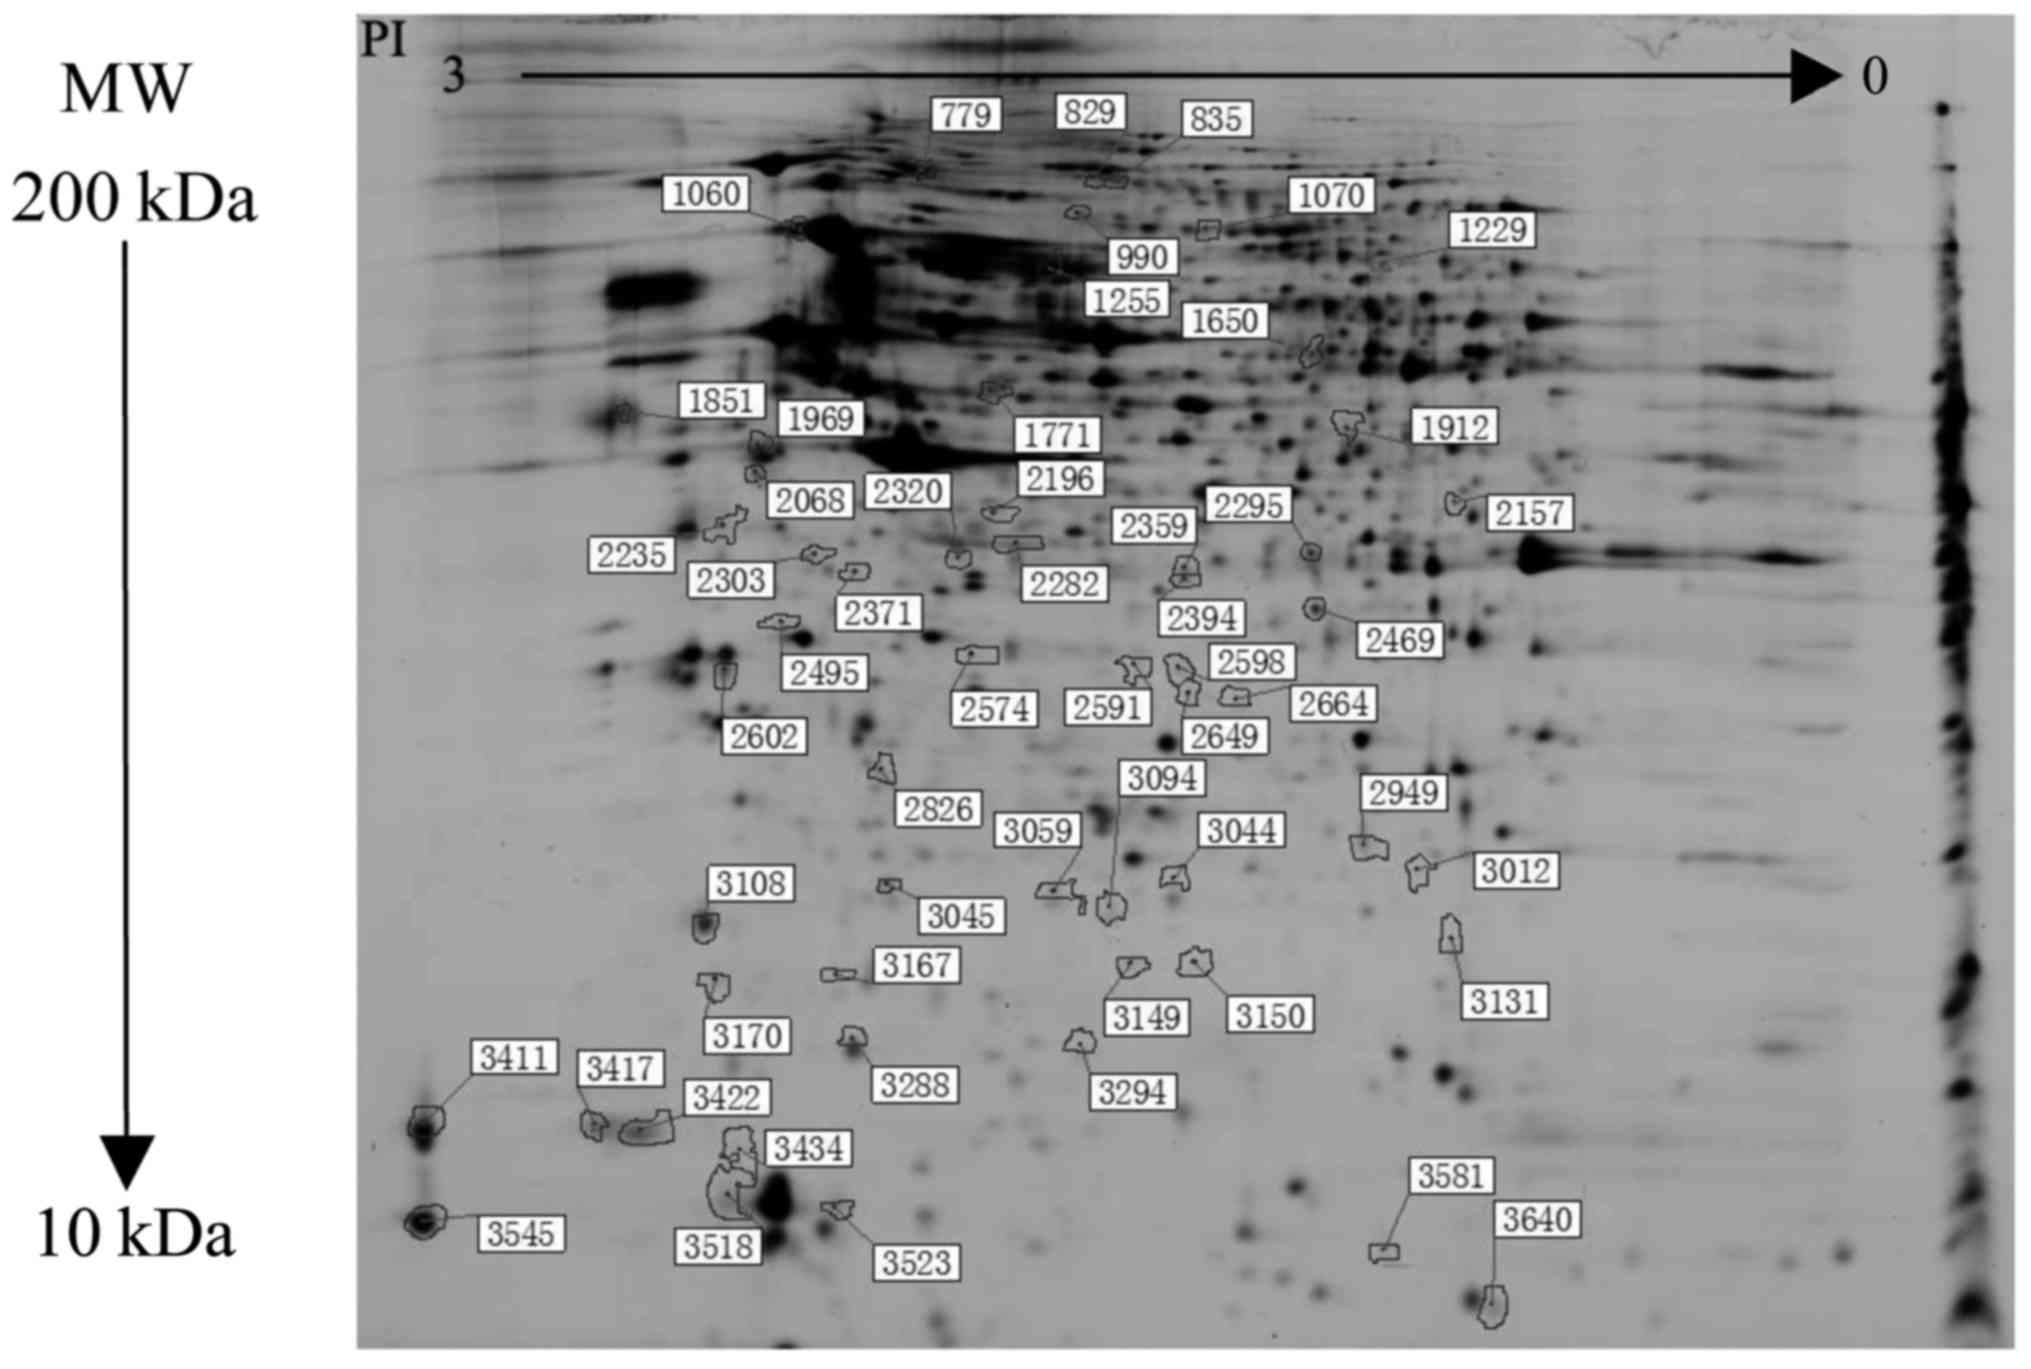
shown in Figs. 2 and 3. The proteomic analysis revealed 56
differential protein spots between all groups (Fig. 4). Compared with the NH group, there
were 17 upregulated and 9 downregulated differential protein spots
in the LN-I group, and 25 proteins were upregulated and 19
downregulated in the LN-IV group. Furthermore, 14 differential
protein spots were detected between the LN-I and IV groups.
Therefore, a total of 45 proteins were characterized by mass
spectrometry (Table II).
| Table II.Identification of differential
proteins by MALDI-TOF-TOF MSa. |
Table II.
Identification of differential
proteins by MALDI-TOF-TOF MSa.
|
|
|
|
|
|
| Average ratio |
|---|
|
|
|
|
|
|
|
|
|---|
| Spotb | Protein name | Accession no. | Protein MW | Protein PI | Score CI% | LN-I/NH | LN-IV/NH | LN-IV/LN-I |
|---|
| 799 | Nucleoporin
210kDa | Q8TEM1 | 20589.5 | 6.33 | 76.144 | 1.27 | 1.62 | 1.28 |
| 829, 1299 | Keratin, type II
cytoskeletal 1 | P04264 | 66170.1 | 8.15 | 100 | −1.16 | 1.74 | 2.02 |
| 835 | Elongation factor
G, mitochondrial | Q96RP9 | 84102.7 | 6.58 | 100 | −1.19 | 1.64 | 1.95 |
| 990 | SH2B adapter
protein 2 | O14492 | 68380.1 | 5.85 | 35.455 | 1.34 | 1.65 | 1.23 |
| 1060 | 78 kDa
glucose-regulated protein | P11021 | 72402.5 | 5.07 | 100 | 1.57 | 2.39 | 2.13 |
| 1070 |
Serotransferrin | P05186 | 79280.5 | 6.81 | 100 | 1.22 | −1.6 | 1.31 |
| 1255 | Serum albumin | P02768 | 71317.2 | 5.92 | 100 | −1.21 | −1.86 | −1.57 |
| 1650 | Serine protease
HTRA2, mitochondrial | O43464 | 48868 | 10.07 | 81.983 | −1.58 | −1.78 | −1.12 |
| 1771 | RuvB-like 2 | Q9Y230 | 51295.6 | 5.49 | 100 | 1.28 | 1.52 | 1.19 |
| 1851 | Calumenin | O43852 | 37197.2 | 4.47 | 96.522 | −1.45 | −2.02 | −1.39 |
| 1969 | Vimentin | P08670 | 53676.1 | 5.06 | 100 | −1.47 | −1.74 | −1.19 |
| 1912 |
Proliferation-associated protein 2G4 | Q9UQ80 | 44101.3 | 6.13 | 100 | −1.17 | 1.32 | 1.54 |
| 2068 | SPARC | P09486 | 35465 | 4.73 | 99.987 | 1.94 | 1.26 | −1.54 |
| 2157 | Poly(rC)-binding
protein 1 | Q15365 | 37987.1 | 6.66 | 100 | 1.53 | 1.26 | −1.21 |
| 2196, 2282 | Isocitrate
dehydrogenase subunit alpha | P50213 | 40022.2 | 6.47 | 100 | −1.37 | −1.63 | −1.19 |
| 2235 | Syntaxin-18 | Q9P2W9 | 38820.7 | 5.36 | 36.124 | 1.39 | 1.69 | 1.22 |
| 2295 | Annexin A2 | P07355 | 38807.9 | 7.57 | 99.939 | 1.52 | 1.85 | 1.51 |
| 2303 | Elongation factor
1-delta | P29692 | 31216.8 | 4.9 | 56.538 | −2.44 | −2.44 | −1 |
| 2320 | F-actin-capping
protein subunit alpha-1 | P52907 | 33073.4 | 5.45 | 100 | 1.36 | 1.65 | 1.21 |
| 2359 | 60S acidic
ribosomal protein P0 | P05388 | 34422.9 | 5.71 | 99.571 | 1.54 | 1.71 | 1.11 |
| 2371 | F-box/LRR-repeat
protein 15 | Q9H469 | 33547.7 | 7.13 | 90.54 | −1.43 | −1.56 | −1.09 |
| 2394 |
Serine/threonine-protein phosphatase
2A | Q9Y5P8 | 65760.5 | 5.01 | 73.701 | 1.35 | 1.5 | 1.11 |
| 2495 | Annexin A5 | P08758 | 35971.4 | 4.94 | 100 | −1.18 | 1.38 | 1.62 |
| 2591 | Thiosulfate
sulfurtransferase | Q16762 | 33635.9 | 6.77 | 13.19 | −1.03 | 1.8 | 1.85 |
| 2598 | CTP synthase 2 | Q9NRF8 | 66320.3 | 6.45 | 51.215 | −1 | 1.79 | 1.79 |
| 2602 | Tropomyosin beta
chain | P07951 | 32944.6 | 4.66 | 48.916 | 1.37 | 1.51 | 1.1 |
| 2649, 3581 | Histone H2A type
1-B/E | P04908 | 14127 | 11.05 | 92.252 | −1.42 | 1.18 | 1.67 |
| 2664, 3012 | Proteasome subunit
alpha type-1 | P25786 | 29822 | 6.15 | 100 | −1.82 | −1.02 | 1.79 |
| 2826 | NADH dehydrogenase
ubiquinone 2 | P19404 | 27659.1 | 8.22 | 100 | 1.66 | 1.43 | −1.17 |
| 2949 | Stromal
cell-derived factor 2-like protein 1 | Q9HCN8 | 23811.7 | 6.52 | 100 | 1.59 | 2.28 | 1.43 |
| 3044 | Cerebellar
degeneration-related protein | Q86X02 | 53377.2 | 5.7 | 80.918 | −1.78 | −1.13 | 1.57 |
| 3045 | CoA
hydroxylase-interacting protein | Q92561 | 38118.6 | 6.53 | 28.106 | 1.047 | 1.88 | 1.28 |
| 3059, 3094 | Ferritin heavy
chain | P02794 | 21383.4 | 5.3 | 99.816 | −2.02 | −2.44 | −2.02 |
| 3108, 3170 | Myosin regulatory
light chain 12B | O14950 | 19823.5 | 4.71 | 99.952 | 1.77 | 1.58 | −1.12 |
| 3131 | Trafficking protein
particle complex subunit | Q9Y5R8 | 16934.6 | 9.23 | 51.141 | −1.64 | −1.42 | 1.16 |
| 3149 | Thioredoxin
domain-containing protein 12 | O95881 | 19364.6 | 5.24 | 99.178 | 2.02 | 2.21 | 1.09 |
| 3150 |
Translocon-associated protein subunit
delta | P51571 | 19157.7 | 5.76 | 99.996 | 1.19 | 1.67 | 1.4 |
| 3167 | Protein canopy
homolog 2 | Q9Y2B0 | 20981.3 | 4.81 | 99.932 | 1.84 | 1.6 | −1.15 |
| 3288 | Eukaryotic
translation initiation factor 5A-1 | P63241 | 17291.9 | 5.76 | 95.725 | −2.26 | −2.5 | −1.1 |
| 3294 | Stathmin | P16949 | 17291.9 | 5.76 | 95.725 | −2.26 | −2.5 | −1.1 |
| 3411 | Mucin-16 | Q8WXI7 | 2359682.5 | 5.65 | 70.554 | 1.85 | 1.03 | −1.8 |
| 3417 | Myosin light
polypeptide 6 | P60660 | 17090.2 | 4.56 | 100 | 1.62 | 1.64 | 1.01 |
| 3422 | Aftiphilin | Q6ULP2 | 102935.2 | 4.4 | 33.692 | 1.67 | 1.76 | 1.06 |
| 3545 | Protocadherin Fat
4 | Q6V0I7 | 546287.2 | 4.77 | 83.754 | 3.19 | 1.41 | −2.26 |
| 3640 | Amphoterin-induced
protein 2 | Q86SJ2 | 58865.9 | 8.73 | 72.266 | −1.4 | −1.61 | −1.15 |
Properties of proteins
To elucidate the physiological roles of these
proteins in LN, a subcellular localization software WoLF PSORT was
used to analyze the molecular functions of these differentially
expressed proteins (data not shown). The majority of differential
proteins identified in the present study shuttle between the
cytoplasm and nucleus, and may serve roles in the regulation of
cellular immunity and inflammation during the process of LN.
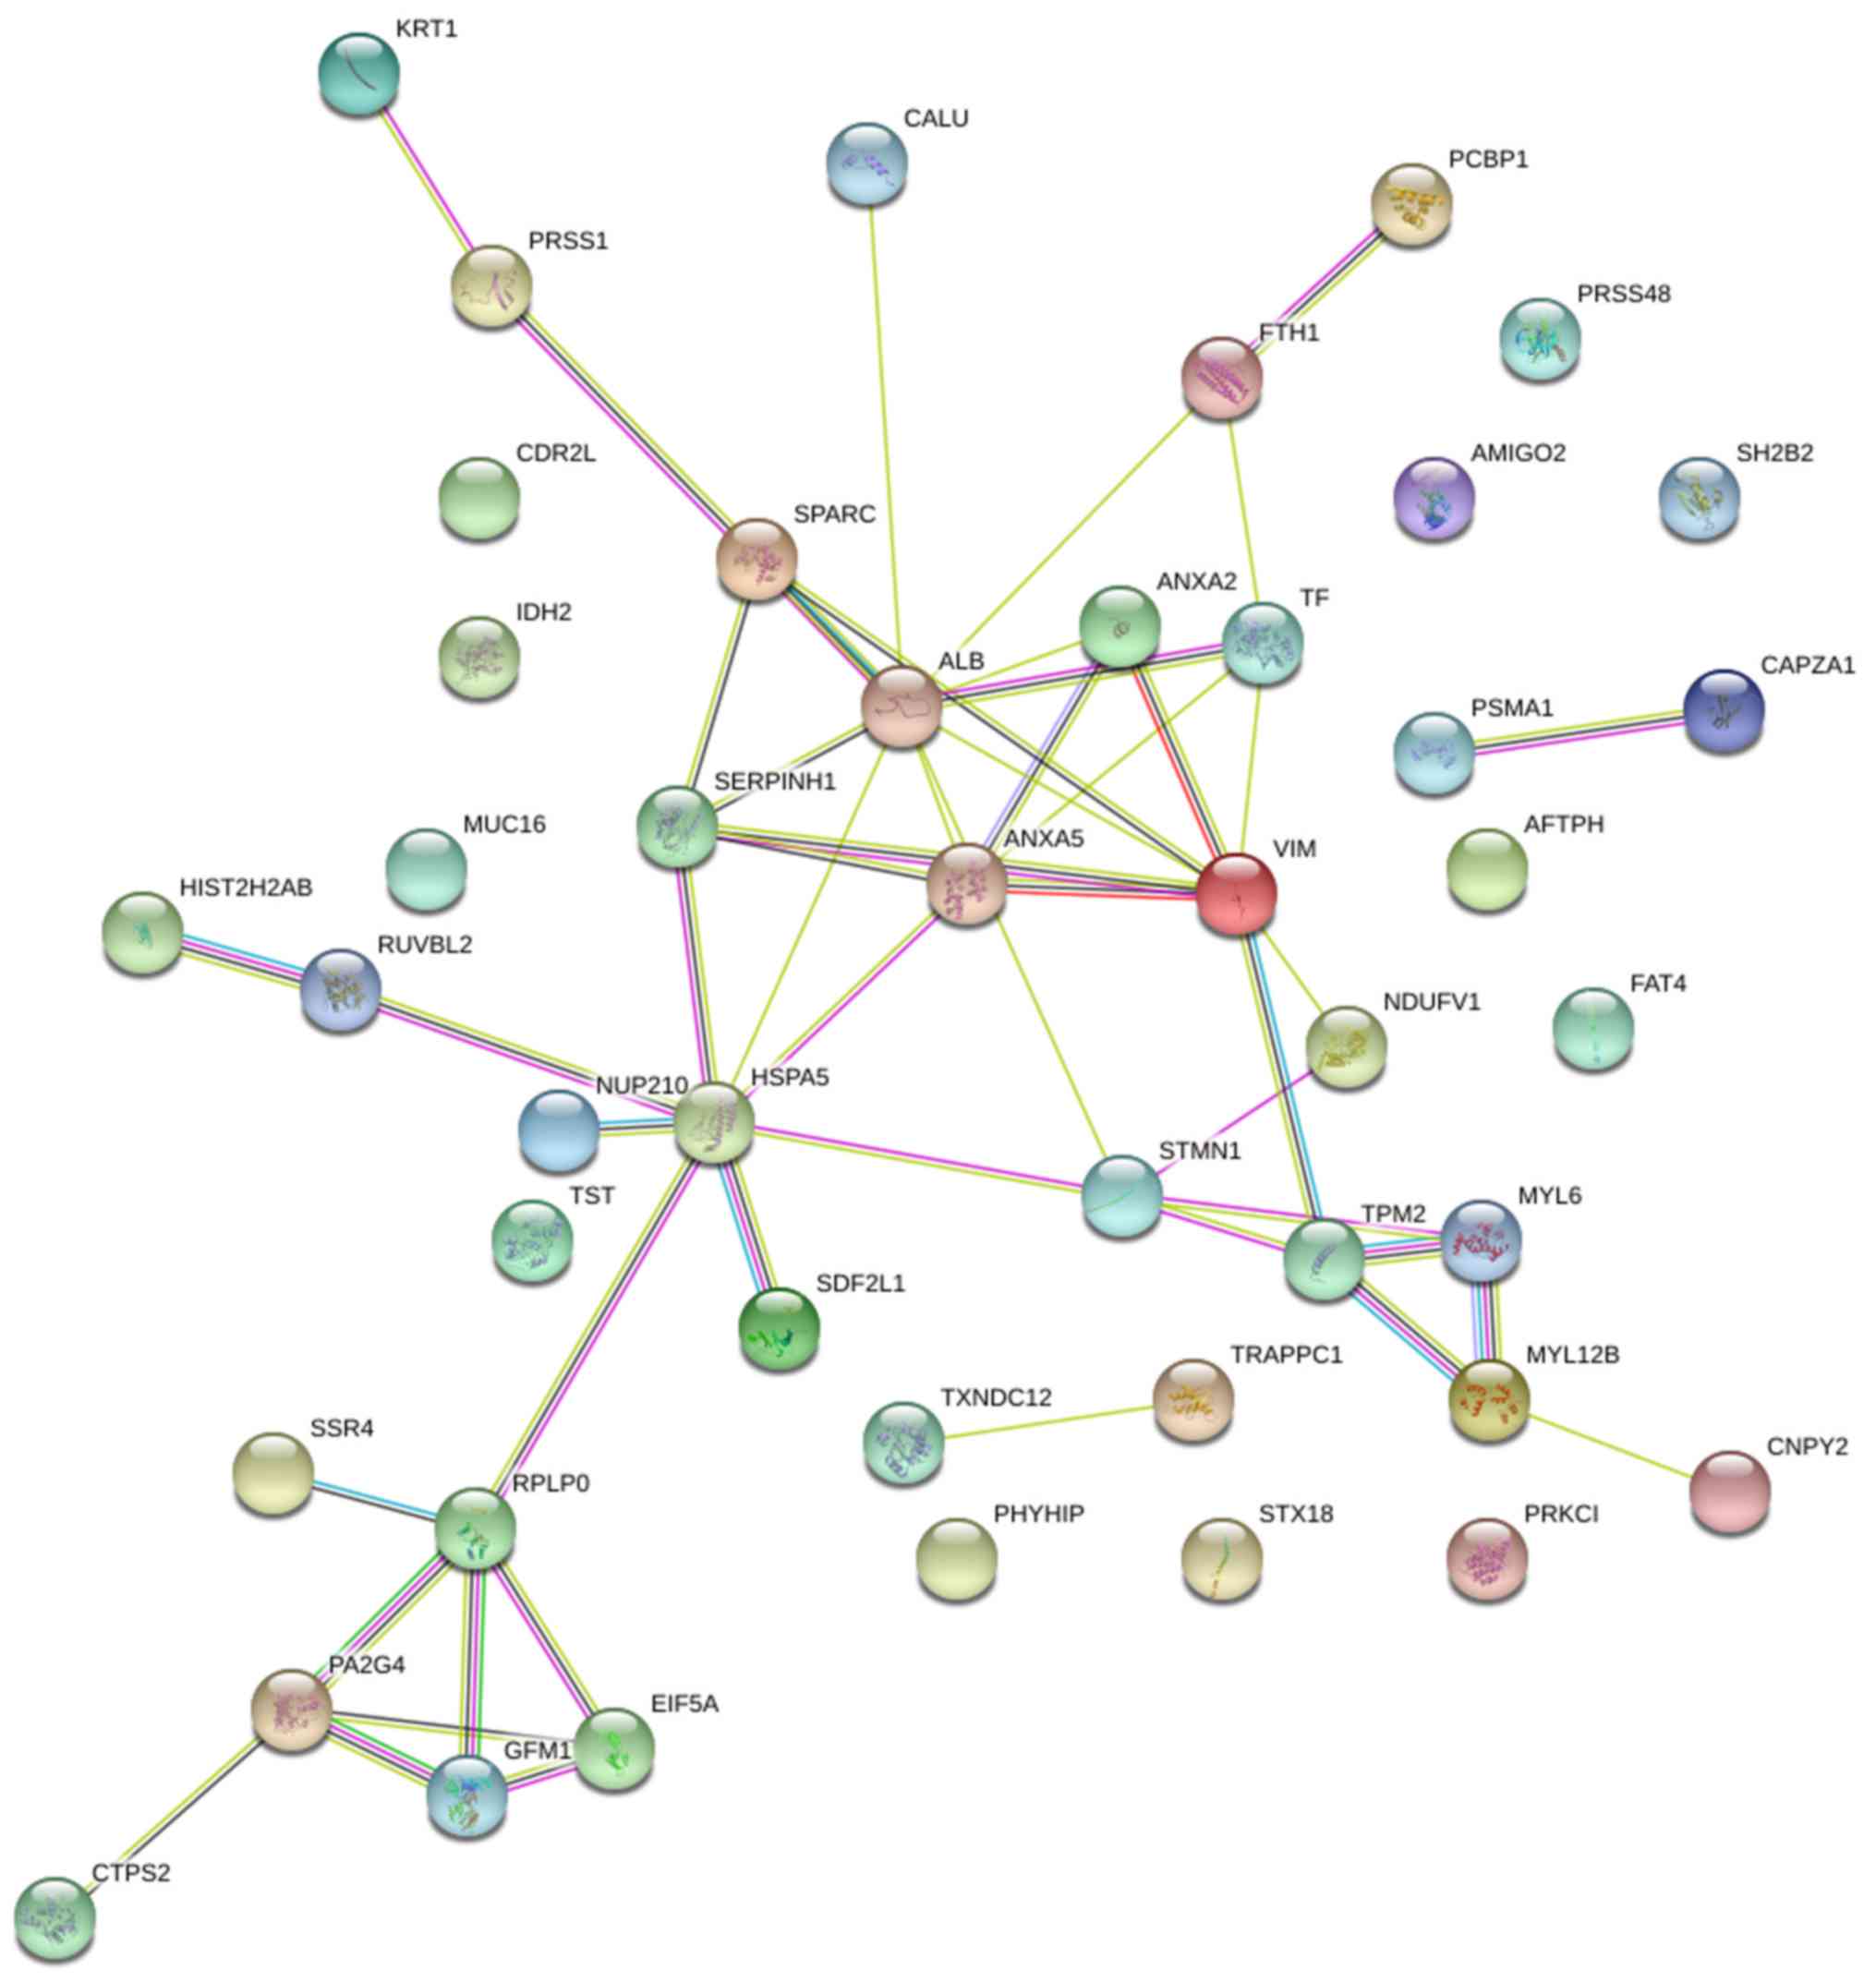
Search Tool for the Retrieval of
Interacting Genes (STRING) protein-protein analysis
STRING protein interaction database (version 10-5)
was used to analyze the associations among proteins. STRING is a
protein-protein analysis database program that generates a network
of interactions from a variety of sources, including different
interaction databases, text mining, genetic interactions, and
shared pathway interactions. This analysis aided systematic
understanding of cellular events in LN process. The networks formed
by interacting proteins provided insights into the potential
mechanisms of immunity and inflammation that may affect the
etiology of LN. The STRING analysis revealed functional connections
among 29 significantly regulated proteins in the HC and LN groups,
LN-I and LN-IV groups (Fig. 5).
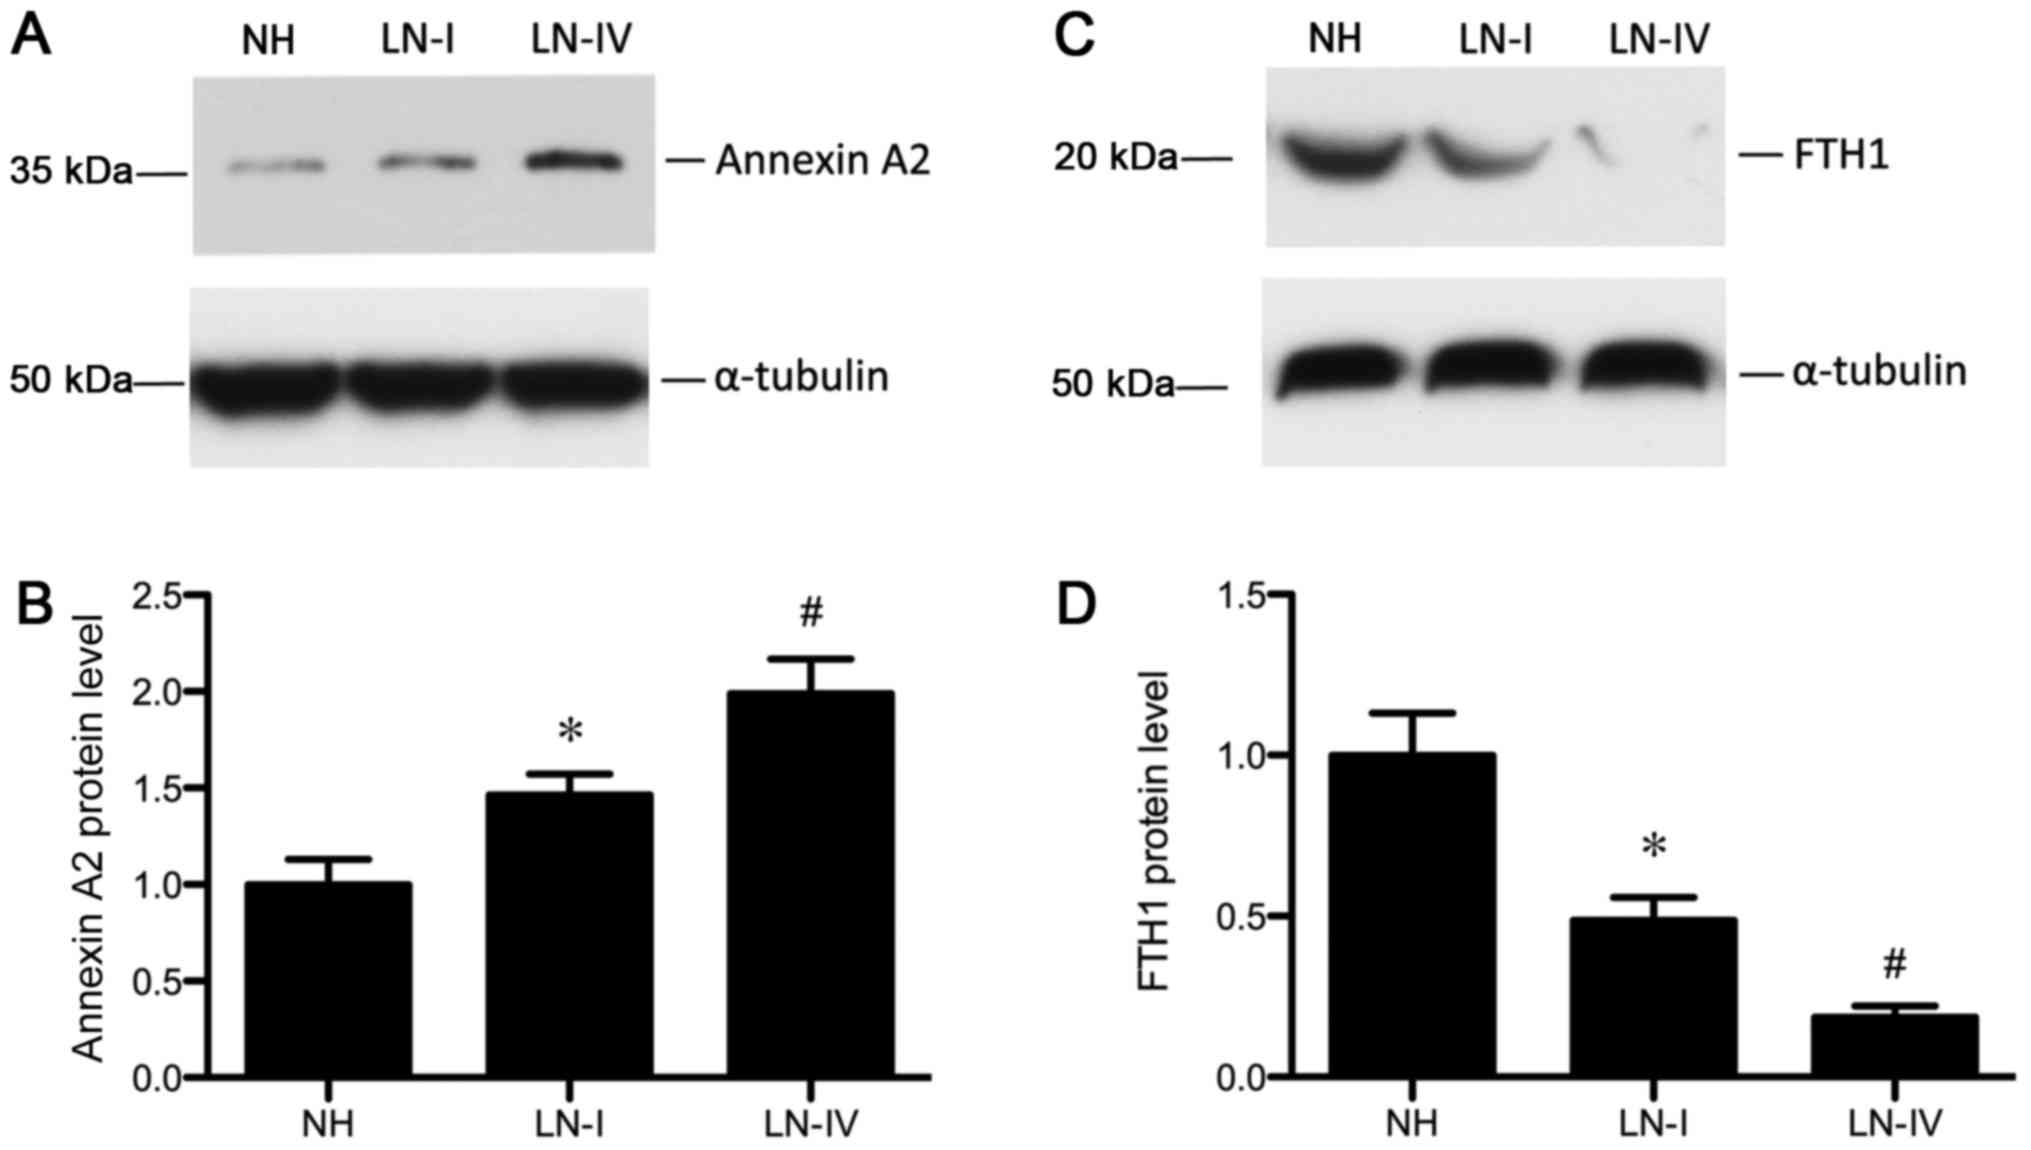
Validation of selected proteins
Since the primary aim of the present study was to
identify proteins that may contribute to the LN process, protein
expression levels of Annexin 2 and FTH1 were determined by western
blotting. Western blotting confirmed the results obtained from
DIGE. Consistent with the aforementioned proteome analysis, protein
expression of Annexin 2 and FTH1 significantly increased and
decreased, respectively in MCs treated with sera from patients with
LN compared with the NH group (Fig.
6).
Discussion
Alterations in the expression of specific proteins
in the normal physiological state or during renal disease
progression may be used to characterize the pathogenic states
occurring during each phase of LN and provide information for
diagnostic and prognostic purposes. The present study demonstrated
the feasibility of 2D-DIGE combined with MALDI-TOF/TOF-MS to screen
serial alterations in the cellular proteome of LN. A total of 56
differential protein spots were detected using 2D-DIGE, of which, 4
proteins could not be recognized in NC, NH LN-I and LN-IV groups,
so a total of 51 were identified by MALDI-TOF/TOF-MSand1 was not.
Six protein spots were identified to be the same proteins. As a
result, 45 differential proteins among normal human and LN groups
were characterized. Some of these proteins were highly abundant in
plasma and had been previously used in clinical diagnosis (28). Therefore, the present study focused
on examining the proteins with low abundance and LMW in the
cellular proteome in LN progression. In addition, the present study
indicated that Annexin A2 and FTH1 were differentially expressed
during different phases of LN.
Annexin A2 is a 36 kDa protein composed of an
N-terminal domain and has a conserved C-terminal domain with
Ca2+ binding sites. Annexin A2 belongs to a family of
calcium-dependent phospholipid-binding proteins that serve roles in
a variety of membrane-associated events including exocytosis,
endocytosis, oxidative stress, apoptosis, cellular growth, cell
proliferation and signal transduction (29–32).
Annexin A2 has been implicated in the pathogenesis of acute kidney
injury, including ischemia-reperfusion injury and folic
acid-induced acute renal failure (33). Previous studies have shown that
Annexin A2 serves a role in the development of renal inflammation
and injury in patients with LN (34,35).
Furthermore, the cellular proteome analysis of MCs induced with
sera from patients with LN also demonstrated that, compared with
the NIH group, the expression of Annexin A2 was significantly
elevated. Furthermore, the induction of Annexin A2 increased with
the progression of LN. Compared with the LN-I group, Annexin A2
exhibited a 1.63-fold increase in the LN-IV group, suggesting that
it may participate in the development and severity of LN. The above
results were further confirmed by western blotting. Western blot
analysis supported the hypothesis that Annexin A2 could serve as a
biomarker of LN.
Ferritin is an iron storage protein complex with two
distinct types of chains: Light chain (L-ferritin) and heavy chain
(H-ferritin). FTH1 is a 21 kDa subunit of the ferritin complex
(36) FTH1 exhibits ferroxidase
activity, which serves an essential role in catalyzing the
conversion of the ferrous ions (Fe2+) to the ferric form
(Fe3+) (37). FTH1 has
been shown to protect proximal tube epithelial cells and kidneys
against the activity of free iron in reactive oxygen species
generation (38). Furthermore, a
previous study also indicated that FTH1 suppressed the immune
activity in autoimmune diseases in humans (39); the immunosuppressive function was
dependent on IL-10 induction. Consistently, in the present study,
FTH1 was downregulated in MCs stimulated with sera from patients
with LN compared with the NH group. In addition, the expression of
FTH1 in the LN-IV group was lower compared with the LN-I group,
indicating that FTH1 may be associated with the progression of LN.
Contrastingly, another study found that patients with SLE exhibited
a high level of serum ferritin (40), which could be attributed to tissue
specificity and immune activity. Therefore, the LMW protein FTH1
may be a suitable biomarker for LN.
In conclusion, the characterization of the dynamic
alterations in protein expression at the cellular level provided an
in-depth insight into the molecular pathophysiology of LN. The
present study identified 45 differential proteins in MCs that were
treated with different LN sera. Of these proteins, Annexin A2 and
FTH1 may be associated with the progression of LN. However,
additional studies on these proteins are essential in order to
determine the level of sera or urine in patients with LN at
different phases.
Acknowledgements
Not applicable.
Funding
The present study was supported by a grant from the
National Science Foundation of China (grant no. 81600531), the
Fujian Provincial Science Foundation (grant no. 2017J01371) and
Fujian Provincial Health and Family Planning Program for Young and
Middle-Aged Talents Project (grant no. 2017-ZQN-92).
Availability of data and materials
The datasets used and/or analyzed during the current
study are available from the corresponding author on reasonable
request.
Authors' contributions
YZ and LX performed the experiments, participated in
data collection and drafted the manuscript. ST performed the
statistical analysis and designed the present study. All authors
read and approved the final manuscript.
Ethics approval and consent to
participate
Written informed consent was obtained from each
donor before enrollment in the study. The protocol was approved by
the Ethics Committee of The First Affiliated Hospital of Guangzhou
University of Traditional Chinese Medicine.
Patient consent for publication
Not applicable.
Competing interests
The authors declare that they have no competing
interests.
Glossary
Abbreviations
Abbreviations:
|
LN
|
lupus nephritis
|
|
SLE
|
systemic lupus erythematosus
|
|
MC
|
mesangial cell
|
|
2D-DIGE
|
two-dimensional difference gel
electrophoresis
|
|
MS
|
mass spectrometry
|
|
MALDI-TOF/TOF
|
matrix-assisted laser
desorption/ionization time of flight tandem
|
|
IPG
|
immobilized pH gradient
|
|
NH
|
normal human
|
References
|
1
|
Tsokos GC: Systemic lupus erythematosus. N
Engl J Med. 365:2110–2121. 2011. View Article : Google Scholar : PubMed/NCBI
|
|
2
|
Pons-Estel GJ, Alarcon GS, Scofield L,
Reinlib L and Cooper GS: Understanding the epidemiology and
progression of systemic lupus erythematosus. Semin Arthritis Rheum.
39:257–268. 2010. View Article : Google Scholar : PubMed/NCBI
|
|
3
|
Gregersen PK and Olsson LM: Recent
advances in the genetics of autoimmune disease. Annu Rev Immunol.
27:363–391. 2009. View Article : Google Scholar : PubMed/NCBI
|
|
4
|
Waldman M and Appel GB: Update on the
treatment of lupus nephritis. Kidney Int. 70:1403–1412. 2006.
View Article : Google Scholar : PubMed/NCBI
|
|
5
|
Sprangers B, Monahan M and Appel GB:
Diagnosis and treatment of lupus nephritis flares-an update. Nat
Rev Nephrol. 8:709–717. 2012. View Article : Google Scholar : PubMed/NCBI
|
|
6
|
Kalloo S, Aggarwal N, Mohan P and
Radhakrishnan J: Lupus nephritis: Treatment of resistant disease.
Clin J Am Soc Nephrol. 8:154–161. 2013. View Article : Google Scholar : PubMed/NCBI
|
|
7
|
Saxena R, Mahajan T and Mohan C: Lupus
nephritis: Current update. Arthritis Res Ther. 13:2402011.
View Article : Google Scholar : PubMed/NCBI
|
|
8
|
Waldman M and Madaio MP: Pathogenic
autoantibodies in lupus nephritis. Lupus. 14:19–24. 2005.
View Article : Google Scholar : PubMed/NCBI
|
|
9
|
Bhat P and Radhakrishnan J: B lymphocytes
and lupus nephritis: New insights into pathogenesis and targeted
therapies. Kidney Int. 73:261–268. 2008. View Article : Google Scholar : PubMed/NCBI
|
|
10
|
Kahlenberg JM, Thacker SG, Berthier CC,
Cohen CD, Kretzler M and Kaplan MJ: Inflammasome activation of
IL-18 results in endothelial progenitor cell dysfunction in
systemic lupus erythematosus. J Immunol. 187:6143–6156. 2011.
View Article : Google Scholar : PubMed/NCBI
|
|
11
|
Ciferska H, Horak P, Konttinen YT, Krejci
K, Tichy T, Hermanova Z and Zadrazil J: Expression of nucleic acid
binding Toll-like receptors in control, lupus and transplanted
kidneys-a preliminary pilot study. Lupus. 17:580–585. 2008.
View Article : Google Scholar : PubMed/NCBI
|
|
12
|
Zhang Y, Yang J, Jiang S, Fang C, Xiong L,
Cheng H and Xia Y: The lupus-derived anti-double-stranded DNA IgG
contributes to myofibroblast-like phenotype in mesangial cells. J
Clin Immunol. 32:1270–1278. 2012. View Article : Google Scholar : PubMed/NCBI
|
|
13
|
Seret G, Le Meur Y, Renaudineau Y and
Youinou P: Mesangial cell-specific antibodies are central to the
pathogenesis of lupus nephritis. Clin Dev Immunol. 2012:5796702012.
View Article : Google Scholar : PubMed/NCBI
|
|
14
|
Yung S, Tsang RC, Leung JK and Chan TM:
Increased mesangial cell hyaluronan expression in lupus nephritis
is mediated by anti-DNA antibody-induced IL-1beta. Kidney Int.
69:272–280. 2006. View Article : Google Scholar : PubMed/NCBI
|
|
15
|
Jeruc J, Jurcic V, Vizjak A, Hvala A,
Babic N, Kveder R, Praprotnik S and Ferluga D: Tubulo-interstitial
involvement in lupus nephritis with emphasis on pathogenesis. Wien
Klin Wochenschr. 112:702–706. 2000.PubMed/NCBI
|
|
16
|
Fiore N, Castellano G, Blasi A, Capobianco
C, Loverre A, Montinaro V, Netti S, Torres D, Manno C, Grandaliano
G, et al: Immaturemyeloid and plasmacytoid dendritic cells
infiltrate renal tubulointerstitium in patients with lupus
nephritis. Mol Immunol. 45:259–265. 2008. View Article : Google Scholar : PubMed/NCBI
|
|
17
|
Zhang X, Jin M, Wu H, Nadasdy T, Nadasdy
G, Harris N, Green-Church K, Nagaraja H, Birmingham DJ, Yu CY, et
al: Biomarkers of lupus nephritis determined by serial urine
proteomics. Kidney Int. 74:799–807. 2008. View Article : Google Scholar : PubMed/NCBI
|
|
18
|
Mosley K, Tam FW, Edwards RJ, Crozier J,
Pusey CD and Lightstone L: Urinary proteomic profiles distinguish
between active and inactive lupus nephritis. Rheumatology (Oxford).
45:1497–1504. 2006. View Article : Google Scholar : PubMed/NCBI
|
|
19
|
Perrot M1, Sagliocco F, Mini T, Monribot
C, Schneider U, Shevchenko A, Mann M, Jenö P and Boucherie H:
Two-dimensional gel protein database of Saccharomyces cerevisiae
(update 1999). Electrophoresis. 20:2280–2298. 1999. View Article : Google Scholar : PubMed/NCBI
|
|
20
|
Patton WF: Detection technologies in
proteome analysis. J Chromatogr B Analyt Technol Biomed Life Sci.
771:3–31. 2002. View Article : Google Scholar : PubMed/NCBI
|
|
21
|
Mok CC and Lau CS: Pathogenesis of
systemic lupus erythematosus. J Clin Pathol. 56:481–490. 2003.
View Article : Google Scholar : PubMed/NCBI
|
|
22
|
Weening JJ, D'Agati VD, Schwartz MM,
Seshan SV, Alpers CE, Appel GB, Balow JE, Bruijn JA, Cook T,
Ferrario F, et al: The classification of glomerulonephritis in
systemic lupus erythematosus revisited. J Am Soc Nephrol.
15:241–250. 2004. View Article : Google Scholar : PubMed/NCBI
|
|
23
|
Stainsby D: Guide to Preparation, Use and
Quality Assurance of Blood Components. Recommendation No. R (95)
15. J Clin Pathol. 51:2010.
|
|
24
|
Wei XF, Zhou QG, Hou FF, Liu BY and Liang
M: Advanced oxidation protein products induce mesangial cell
perturbation through PKC-dependent activation of NADPH oxidase. Am
J Physiol Renal Physiol. 296:F427–F437. 2009. View Article : Google Scholar : PubMed/NCBI
|
|
25
|
Bairoch A and Apweiler R: The SWISS-PROT
protein sequence database and its supplement TrEMBL in 2000.
Nucleic Acids Res. 28:45–48. 2000. View Article : Google Scholar : PubMed/NCBI
|
|
26
|
Xiao L, Zhou D, Tan RJ, Fu H, Zhou L, Hou
FF and Liu Y: Sustained activation of wnt/β-catenin signaling
drives AKI to CKD progression. J Am Soc Nephrol. 27:1727–1740.
2016. View Article : Google Scholar : PubMed/NCBI
|
|
27
|
Tedeschi SK, Bermas B and Costenbader KH:
Sexual disparities in the incidence and course of SLE and RA. Clin
Immunol. 149:211–218. 2013. View Article : Google Scholar : PubMed/NCBI
|
|
28
|
Liu YP, Hu SW, Wu ZF, Mei LX, Lang P and
Lu XH: Proteomic analysis of human serum from diabetic retinopathy.
Int J Ophthalmol. 4:616–622. 2011.PubMed/NCBI
|
|
29
|
Siever DA and Erickson HP: Extracellular
Annexin II. Int J Biochem Cell Biol. 29:1219–1223. 1997. View Article : Google Scholar : PubMed/NCBI
|
|
30
|
Kim J and Hajjar KA: Annexin II: A
plasminogen-plasminogen activator co-receptor. Front Biosci.
7:d341–d348. 2002. View
Article : Google Scholar : PubMed/NCBI
|
|
31
|
Vedeler A, Hollas H, Grindheim AK and
Raddum AM: Multiple roles of Annexin A2 in post-transcriptional
regulation of gene expression. Curr Protein Pept Sci. 13:401–412.
2012. View Article : Google Scholar : PubMed/NCBI
|
|
32
|
Bharadwaj A, Bydoun M, Holloway R and
Waisman D: Annexin A2 heterotetramer: Structure and function. Int J
Mol Sci. 14:6259–6305. 2013. View Article : Google Scholar : PubMed/NCBI
|
|
33
|
Cheng CW, Rifai A, Ka SM, Shui HA, Lin YF,
Lee WH and Chen A: Calcium-binding proteins Annexin A2 and S100A6
are sensors of tubular injury and recovery in acute renal failure.
Kidney Int. 68:2694–2703. 2005. View Article : Google Scholar : PubMed/NCBI
|
|
34
|
Ka SM, Rifai A, Chen JH, Cheng CW, Shui
HA, Lee HS, Lin YF, Hsu LF and Chen A: Glomerular crescent-related
biomarkers in a murine model of chronic graft versus host disease.
Nephrol Dial Transplant. 21:288–298. 2006. View Article : Google Scholar : PubMed/NCBI
|
|
35
|
Yung S, Cheung KF, Zhang Q and Chan TM:
Anti-dsDNA antibodies bind to mesangial Annexin II in lupus
nephritis. J Am Soc Nephrol. 21:1912–1927. 2010. View Article : Google Scholar : PubMed/NCBI
|
|
36
|
Liu NQ, De Marchi T, Timmermans Am,
Beekhof R, Trapman-Jansen AM, Foekens R, Look MP, van Deurzen CH,
Span PN, Sweep FC, et al: Ferritin heavy chain in triple negative
breast cancer: A favorable prognostic marker that relates to a
cluster of differentiation 8 positive (CD8+) effector T-cell
response. Mol Cell Proteomics. 13:1814–1827. 2014. View Article : Google Scholar : PubMed/NCBI
|
|
37
|
Wang W, Knovich MA, Coffman LG, Torti FM
and Torti SV: Serum ferritin: Past, present and future. Biochim
Biophys Acta. 1800:760–769. 2010. View Article : Google Scholar : PubMed/NCBI
|
|
38
|
Recalcati S, Invernizzi P, Arosio P and
Cairo G: New functions for an iron storage protein: The role of
ferritin in immunity and autoimmunity. J Autoimmun. 30:84–89. 2008.
View Article : Google Scholar : PubMed/NCBI
|
|
39
|
Zhang KH, Tian HY, Gao X, Lei WW, Hu Y,
Wang DM, Pan XC, Yu ML, Xu GJ, Zhao FK and Song JG: Ferritin heavy
chain-mediated iron homeostasis and subsequent increased reactive
oxygen species production are essential for epithelial-mesenchymal
transition. Cancer Res. 69:5340–5348. 2009. View Article : Google Scholar : PubMed/NCBI
|
|
40
|
Zarjou A, Bolisetty S, Joseph R, Traylor
A, Apostolov EO, Arosio P, Balla J, Verlander J, Darshan D, Kuhn LC
and Agarwal A: Proximal tubule H-ferritin mediates iron trafficking
in acute kidney injury. J Clin Invest. 123:4423–4434. 2013.
View Article : Google Scholar : PubMed/NCBI
|