Introduction
Glaucoma includes various types of open-angle,
closed-angle and normal-tension glaucoma, and results in damage to
the optic nerve and vision loss (1).
The risk factors of glaucoma include increased pressure in the eye
and family history of high blood pressure, obesity and migraines
(2). Once vision loss from glaucoma
occurs, it will be permanent (3).
Therefore, the exact pathogenesis requires research for prevention,
diagnosis and treatment of glaucoma.
Several important genes and their molecular
mechanisms have been found to be related with glaucoma. The
research of Skarie and Link revealed that WDR36 has a negative
correlation with p53 stress-response pathway in the primary
open-angle glaucoma (4). In a large
animal model, MMP-1 was confirmed to lower the intraocular pressure
of glaucoma cases induced by steroid (5). Besides, LOXL1 indicates high prevalence
of glaucoma, but with low specificity (6). Jelodari-Mamaghani et al
(7) suggested that some sequence
variations of latent transforming growth factor-β (TGF-β) binding
protein 2 could induce primary open-angle glaucoma and other
pseudoexfoliation syndromes. However, some genes are controversial
because their underlying molecular mechanisms were uncovered. Kumar
et al (8) showed that 3.59%
of Indian primary open-angle glaucoma patients had mutations in
MYOC, OPIT and CY1B1 genes. But in some primary congenital glaucoma
patients, MYOC and FOXC1 mutations did not participate (9). Though various genes and related
molecular mechanisms were investigated, targeted therapy for
glaucoma has not achieved a breakthrough. Accurate targets for
glaucoma are urgently needed.
Bioinformatics analysis was processed to screen more
accurate biomarkers and therapy targets for glaucoma. Most
importantly, two different datasets related to the disease and
treatment were downloaded. Various networks including
pathway-relationship network and gene co-expression networks were
constructed. The final intersection was identified to achieve the
goal and lay a theoretical foundation for further research.
Materials and methods
Microarray datasets
Interesting datasets for glaucoma were searched in
ArrayExpress Archive (http://www.ebi.ac.uk/arrayexpress/). Two different
datasets were obtained, including E-GEOD-7144 and E-MEXP-3427
(10). The platforms of the
databases were [HG-U133A] Affymetrix Human Genome U133A Array and
Affymetrix GeneChip Human Genome U133 Plus 2.0 [HG-U133_Plus_2],
respectively. The expression profiling of E-GEOD-7144 contains 6
trabecular meshwork samples of glaucoma patients, including 2
glaucoma samples treated with ethyl alcohol as the normal control
group and 4 glaucoma samples treated by TGF-β1 and −2. The
expression profile of E-MEXP-3427 contained 9 trabecular meshwork
samples, including 2 glaucoma samples and 7 controls.
Data pretreatment and identification
of DEGs
The downloaded raw data were corrected and
normalized by Robust Multi-chip Average (RMA) algorithm (11), and then annotated based on Affymetrix
(http://www.affymetrix.com/support/technical/annotationfilesmain.affx).
Following, normalized unscaled standard errors (NUSE) controlling
was used for quality control (12).
Compared with the normal control group, the DEGs in glaucoma
samples were screened by significance analysis of microarrays (SAM)
(13). Similarly, the DEGs in TGF-β1
and −2 treatment groups compared with the untreated control group
were also identified by this method. The threshold of DEGs in the
two groups was P<0.05 and |logFC| >2.
Gene Ontology (GO) functional
enrichment and Kyoto Encyclopedia of Genes and Genomes (KEGG)
pathway enrichment analysis
GO database was built by Gene Ontology Consortium,
which described gene and their protein functions (14). Based on this database, screened DEGs
in the two groups were functional annotated, and then significant
GO terms were selected by Fisher exact test and multiple hypothesis
test with the threshold of false discovery rate (FDR) <0.05.
Beniamini-Hochberg (BH) method was utilized for correcting P-value
to FDR (15).
Based on KEGG database, the screened DEGs in the two
groups were gathered in eight categories, including total network,
metabolic process, genetic information transfer, environmental
information transfer, intracellular biological process, biological
systems, human disease and drug development (16). The enriched pathways were calculated
by Fishers exact test with the criteria of FDR <0.05.
Construction of pathway relationship
network
KEGG database provides the relationship of genes and
pathways. In this study, the pathway relationship network was
constructed based on this database. According to the information of
signal transduction in the network, upstream and downstream signal
pathways were obtained.
Intersection of DEGs in GO terms and
pathways
DEGs in GO terms and pathways with the same symbols
were of interest, and common DEGs of the two groups were
obtained.
Gene co-expression network
construction
Gene co-expression network reflected the regulatory
relationship among DEGs, and showed the hub nodes with higher
degrees. This network was constructed with the threshold of
correlation coefficient >1.
Intersection of DEGs of disease and
treatment
DEGs of disease and treatment with the same symbols
were of interest, and the important DEGs were obtained.
Trabecular meshwork cell culture and
treatment
As described in previous studies, primary culture of
HTM-2 cells was prepared from glaucoma and normal donors. The
experiment included 3 groups: the normal control group, the disease
group and the treatment group. All cells were maintained at 37°C in
5% CO2 in low glucose Dulbeccos modified Eagles medium (DMEM) with
10% fetal bovine serum. All reagents were purchased from
Invitrogen; Thermo Fisher Scientific, Inc. (Waltham, MA, USA).
After 24 h treatment, HTM cells from glaucoma in the treatment
group were subcultured in free culture medium for 48 h, and then
treated by TGF-β1 and −2 (1 ng/ml of free culture medium) for 1 h.
The cells in the normal control and disease groups were also
processed by the above steps but treated by normal saline. The
experiment design with three replications was used.
Determination of expression levels of
important DEGs by RT-qPCR
Total RNA of cells in the three groups were reverse
transcribed by oligo(dT) primer and Superscript II Reverse
Transcriptase (Invitrogen; Thermo Fisher Scientific, Inc.). The
primers of DEGs were designed as follows: HGF (upstream)
5′-ACAGCTTTTTGCCTTCGAGCTATCGGGGTAAAGACCTACAGG-5′; (downstream)
5′-CATCAAAGCCCTTATCGGGGATA-3′; AKR1B10 (upstream)
5′-GGACCTGTTCATCGTCAGCAA-3′; (downstream)
5′-CCCCAGACTTGAATCCCTGTG-3′; AKR1B10 (upstream)
5′-GTAAAGCTTTGGAGGTCAC-3; (downstream) 5′-CACCCATCGTTTGTCTCGT-3′;
PPAP2B2B (upstream) 5′-CCTCTTCTGCCTCTTCATGG-3′; (downstream)
5′-GCCACATACGGGTTCTGAGT-3; GAPDH (upstream)
5′-AATGCATCCTGCACCACCAA-3′; (downstream)
5′-GTAGCCATATTCATTGTCATA-3′.
All amplifications were performed on the Rotor-Gene
3000 real-time cycler (Corbett Research, Sydney, Australia)
instrument. The reaction conditions were 1 cycle of 95°C for 10
min, 42 cycles of 95°C for 20 sec, and 60°C for 20 sec and 72°C for
20 sec. SYBR Premix Ex Taq™ (Takara, Otsu, Japan) was used in the
following PCR procedure. The experiment was repeated three
times.
This study has been approved by the Ethics Committee
of The Second People's Hospital of Jinan (Jinan, China) and all
patients provided informed consent.
Results
Identification of DEGs
Compared with the normal control group, a total of
1019 DEGs of glaucoma were identified, including 471 up- and 548
downregulated genes. Similarly, total 93 DEGs in TGF-β1 and 2
treatment cases compared with the untreated control group were
obtained, including 71 upregulated and 22 downregulated DEGs.
Functional and pathway enrichment
analysis
As shown in Table I,
the screened glaucoma-related DEGs were enriched in various GO
terms, including negative regulation of cell proliferation
(FDR=9.56E-11), endoplasmic reticulum unfolded protein response
(FDR=9.56E-11), activation of signaling protein activity involved
in unfolded protein response (FDR=7.04E-08) and cellular protein
metabolic process (FDR=4.22E-07). Simultaneously, these DEGs
involved in pathways, such as protein processing in endoplasmic
reticulum (FDR=4.74E-10), PI3K-Akt signaling pathway
(FDR=3.51E-07), pathways in cancer (FDR=3.51E-07) and metabolic
pathways (FDR=9.32E-05).
 | Table I.The top 5 GO and KEGG pathways
enriched by glaucoma-related DEGs. |
Table I.
The top 5 GO and KEGG pathways
enriched by glaucoma-related DEGs.
| GO ID | GO name | Diff gene counts in
GO | Enrichment score | P-value | FDR |
|---|
| GO:0008285 | Negative regulation
of cell proliferation | 32 | 5.306158859 |
5.10×10⁻¹⁴ |
9.56×10⁻¹¹ |
| GO:0030968 | Endoplasmic reticulum
unfolded protein response | 17 | 12.15861552 |
8.56×10⁻¹⁴ |
9.56×10⁻¹¹ |
| GO:0006987 | Activation of
signaling protein activity involved in unfolded protein
response | 13 | 12.05803873 |
9.46×10⁻¹¹ |
7.04×10⁻⁸ |
| GO:0044267 | Cellular protein
metabolic process | 32 | 3.688553148 |
7.55×10⁻¹⁰ |
4.22×10⁻⁷ |
| GO:0007050 | Cell cycle
arrest | 15 | 6.956560809 |
9.88×10⁻⁹ |
4.22×10⁻⁶ |
|
| Pathway
ID | Pathway
name | Diff gene counts
in pathway | Enrichment
score | P-value | FDR |
|
| 4141 | Protein processing in
endoplasmic reticulum | 21 | 7.464764652 |
2.17×10⁻¹² |
4.74×10⁻¹⁰ |
| 4151 | PI3K-Akt signaling
pathway | 25 | 4.276848144 |
3.28×10⁻⁹ |
3.51×10⁻⁷ |
| 5200 | Pathways in
cancer | 24 | 4.356891907 |
4.81×10⁻⁹ |
3.51×10⁻⁷ |
| 1100 | Metabolic
pathways | 45 | 2.246694155 |
1.70×10⁻⁶ |
9.32×10⁻⁵ |
| 5410 | Hypertrophic
cardiomyopathy (HCM) | 9 | 6.285457295 |
2.74×10⁻⁵ |
1.06×10⁻³ |
Similarly, the DEGs of TGF-β1 and −2 treatment
patients participated in different GO terms, such as daunorubicin
metabolic process (FDR=1.76E-07), doxorubicin metabolic process
(FDR=1.76E-07), cellular response to jasmonic acid stimulus
(FDR=4.62E-06). These DEGs were also enriched in various pathways
including metabolic pathways (FDR=2.34E-05), ECM-receptor
interaction (FDR=2.34E-05) and amoebiasis (FDR=3.84E-05) (Table II).
| Table II.The top 5 GO and KEGG pathways
enriched by TGF-β1 and −2 treatment-related DEGs. |
Table II.
The top 5 GO and KEGG pathways
enriched by TGF-β1 and −2 treatment-related DEGs.
| GO ID | GO name | Diff gene counts in
GO | Enrichment
score | P-value | FDR |
|---|
| GO:0044597 | Daunorubicin
metabolic process | 4 | 327.380597 |
6.92×10⁻¹⁰ |
1.77×10⁻⁷ |
| GO:0044598 | Doxorubicin
metabolic process | 4 | 327.380597 |
6.92×10⁻¹⁰ |
1.77×10⁻⁷ |
| GO:0071395 | Cellular response
to jasmonic acid stimulus | 3 | 491.0708955 |
2.72×10⁻⁸ |
4.63×10⁻⁶ |
| GO:0030198 | Extracellular
matrix organization | 7 | 21.82537313 |
7.10×10⁻⁸ |
9.06×10⁻⁶ |
| GO:0051897 | Positive regulation
of protein kinase B signaling cascade | 5 | 48.14420544 |
1.38×10⁻⁷ |
1.41×10⁻⁵ |
|
| Pathway
ID | Pathway
name | Diff gene counts
in pathway | Enrichment
score | P-value | FDR |
|
| 1100 | Metabolic
pathways | 12 | 6.608186988 |
4.52×10⁻⁷ |
2.35×10⁻⁵ |
| 4512 | ECM-receptor
interaction | 5 | 37.62995368 |
4.79×10⁻⁷ |
2.35×10⁻⁵ |
| 5146 | Amoebiasis | 5 | 30.03491716 |
1.47×10⁻⁶ |
3.84×10⁻⁵ |
| 4510 | Focal adhesion | 6 | 19.07071439 |
1.57×10⁻⁶ |
3.84×10⁻⁵ |
| 4974 | Protein digestion
and absorption | 4 | 29.76187246 |
2.10×10⁻⁵ |
4.12×10⁻⁴ |
Construction of pathway relationship
network
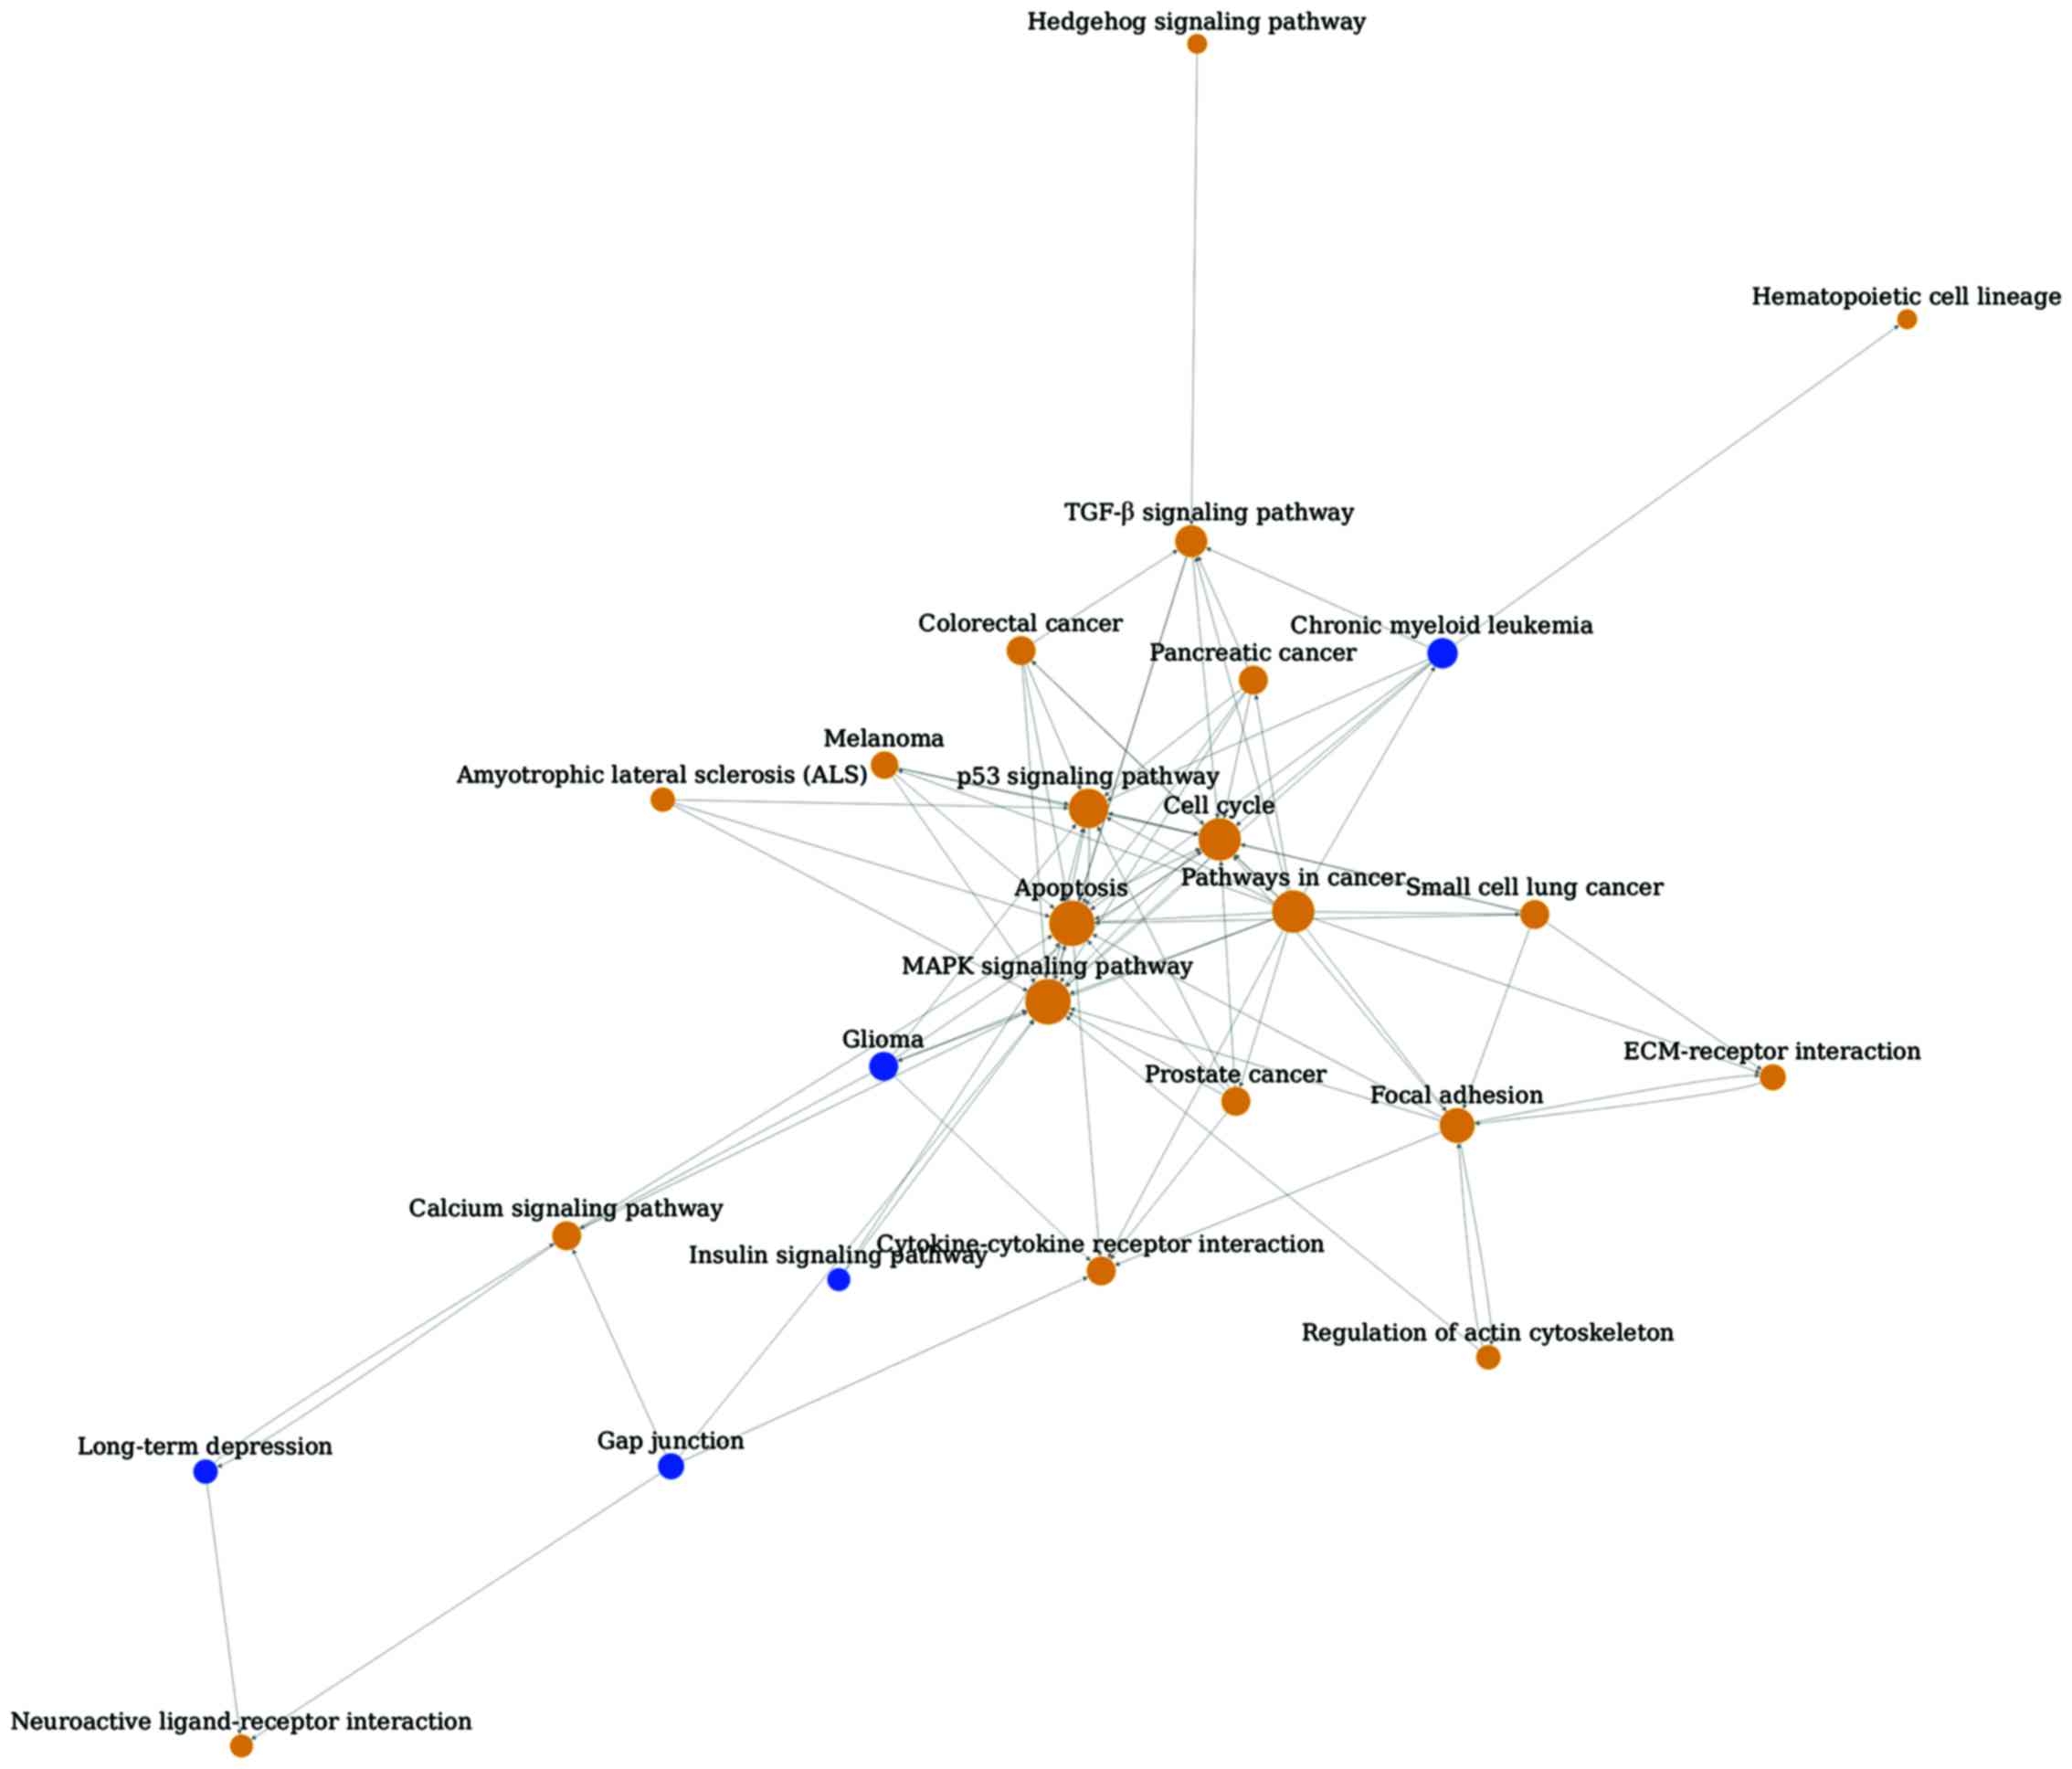
Pathway relationship network of glaucoma was
constructed with 25 nodes and 87 edges (Fig. 1). The hub nodes were MAPK signaling
pathway (degree 18), apoptosis (degree 18) and cell cycle (degree
15). In addition, several upstream pathways were identified,
including pathways in cancer and gap junction. Cytokine-cytokine
receptor interaction was shown as a downstream pathway.
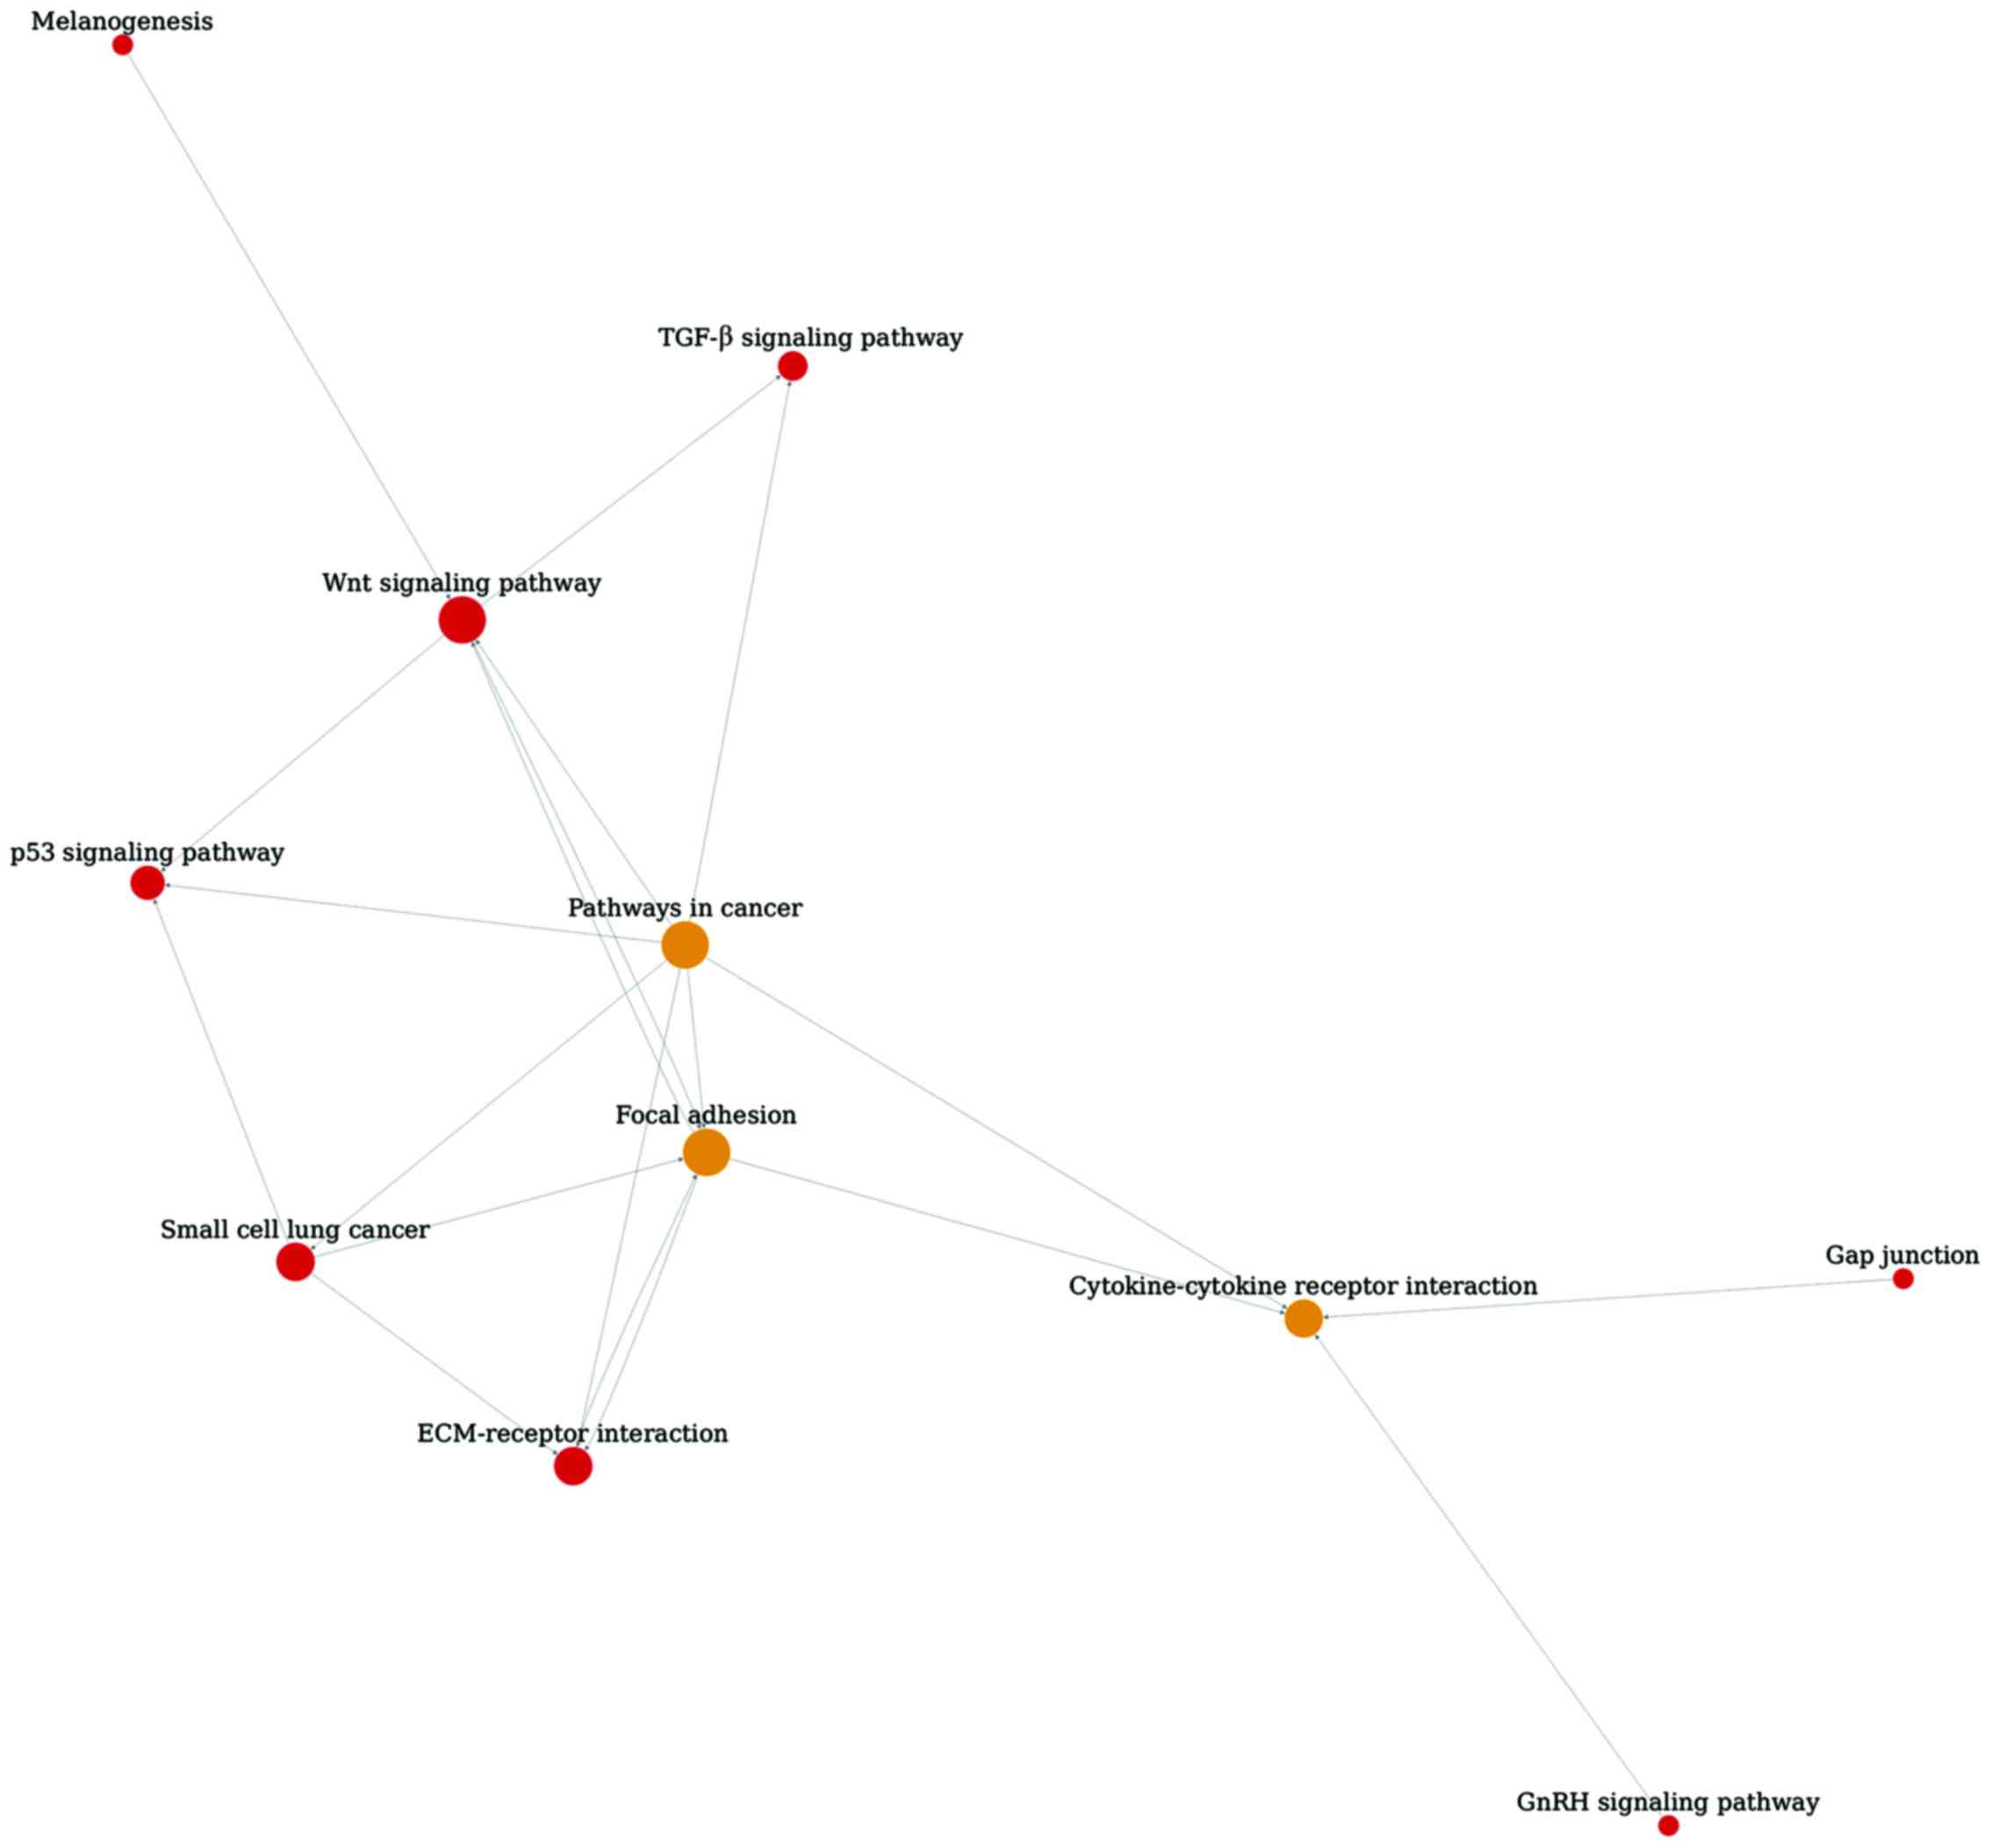
As shown in Fig. 2,
pathway relationship network of TGF-β1 and −2 treatment groups was
constructed with 11 nodes and 20 edges. Focal adhesion, pathways in
cancer and Wnt signaling pathway were the hub nodes with degree of
7.7 and 6, respectively.
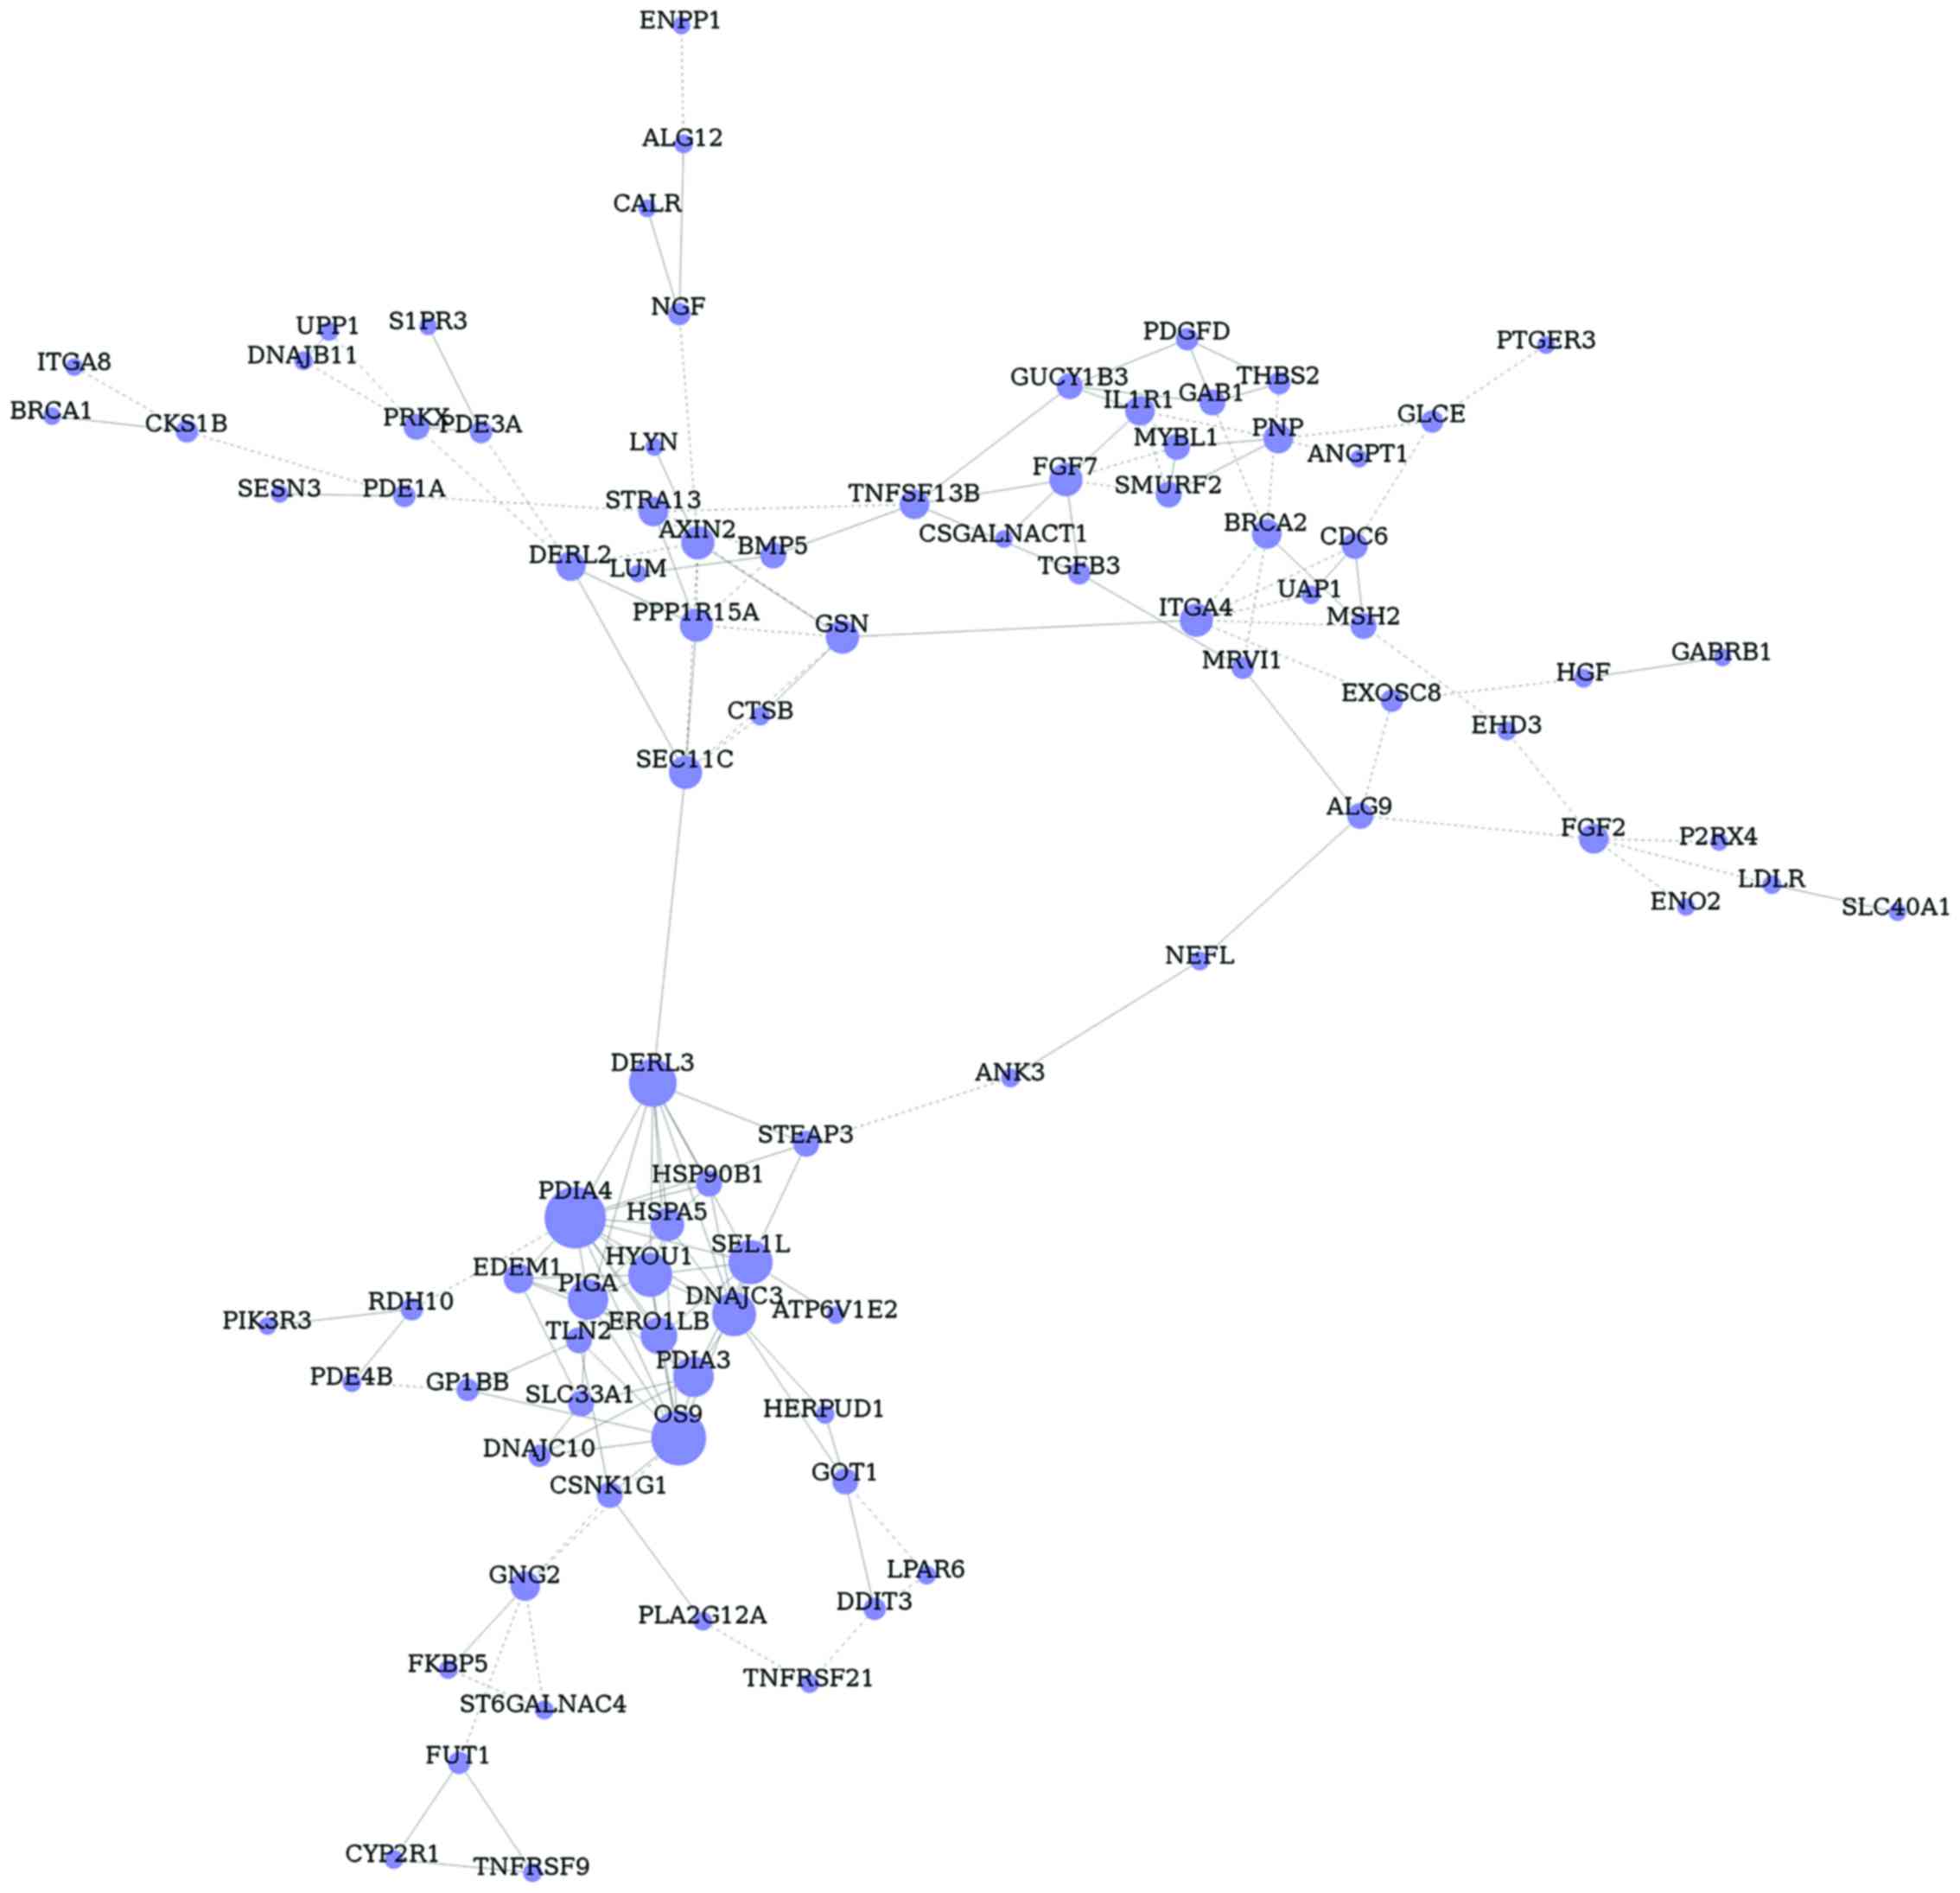
Gene co-expression network
construction of common DEGs
Based on gene symbol, glaucoma-related DEGs in GO
terms and pathways were inserted and 180 common DEGs were obtained.
Then, gene co-expression network of glaucoma-related DEGs was
constructed, including 91 nodes and 166 edges (Fig. 3). In addition, the hub nodes in this
network were protein disulfide isomerase family A, member 4 (PDIA4,
degree 13), osteosarcoma amplified 9, endoplasmic reticulum lectin
(OS9, degree 12), derlin 3 (DERL3, degree 10) and sel-1 suppressor
of lin-12-like (SEL1L, degree 9).
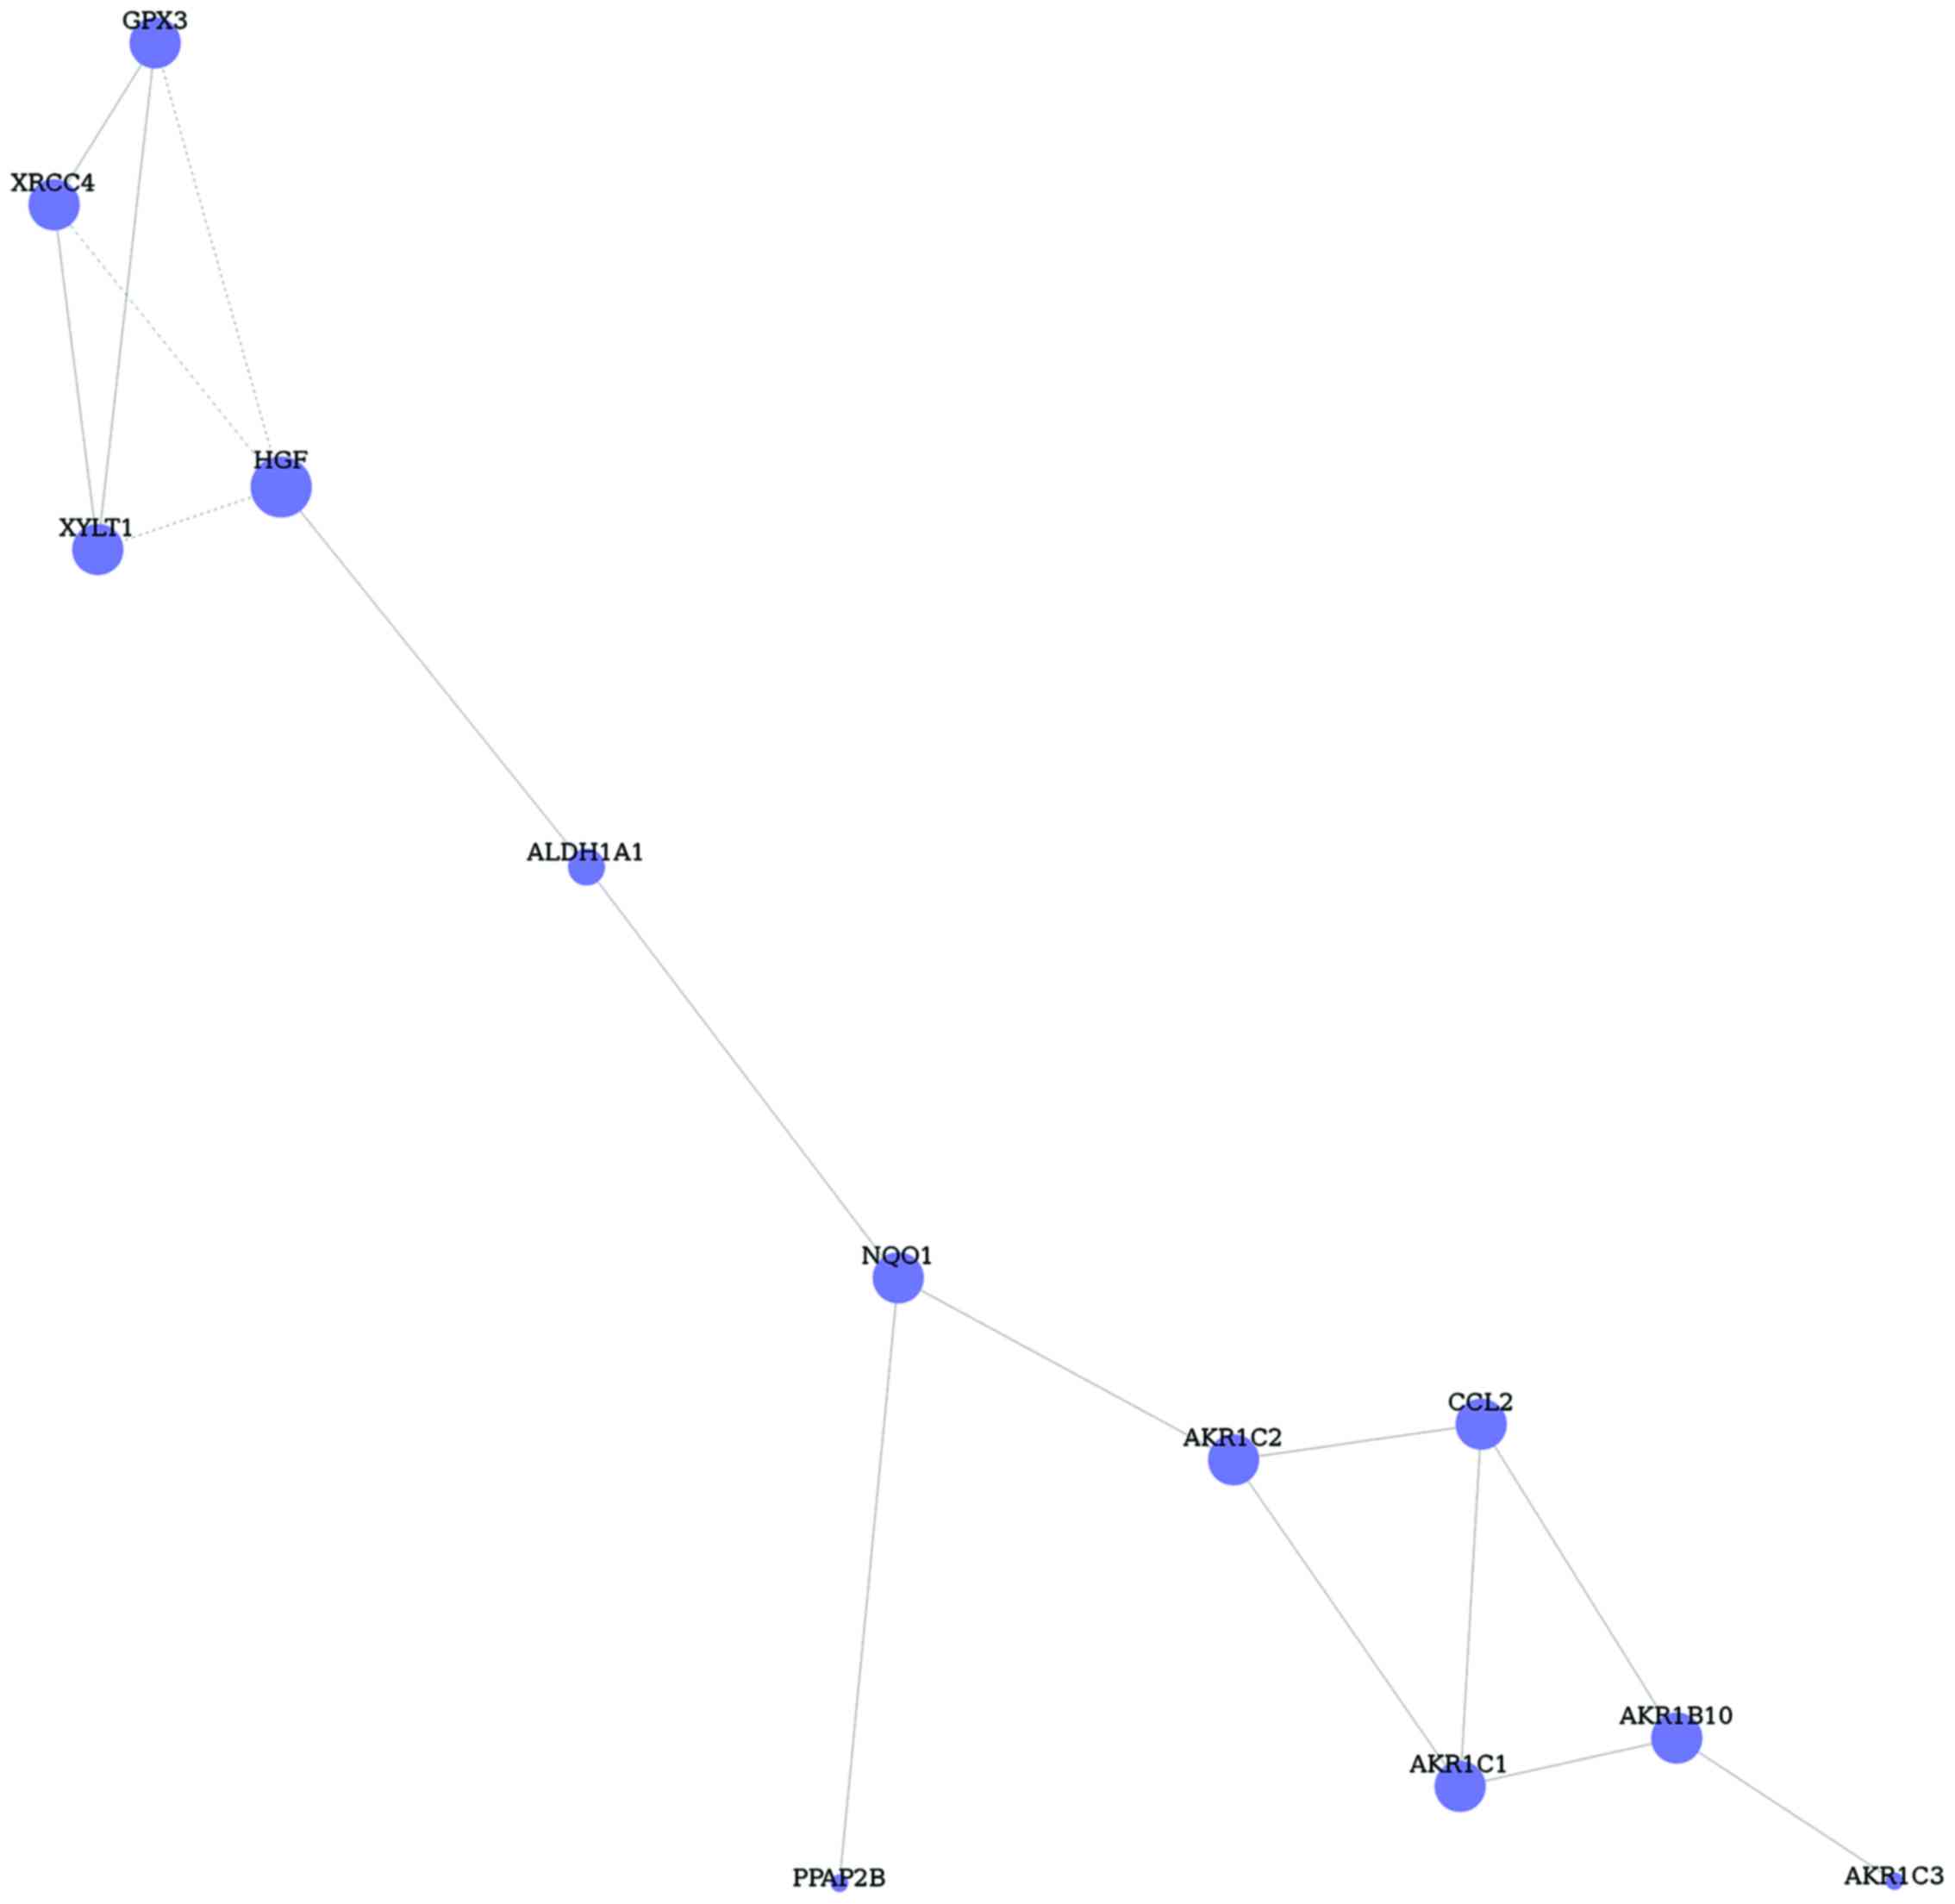
Furthermore, DEGs of TGF-β1 and −2 treated glaucoma
in GO terms and pathways were inserted, and 29 common DEGs were
identified. Based on the DEGs, gene co-expression network was
constructed with 12 nodes and 16 edges (Fig. 4). The hub node of this network was
HGF (degree 4).
Intersection of DEGs of disease and
treatment
Finally, a total of 6 important DEGs of disease and
treatment were inserted and obtained. They were hepatocyte growth
factor (HGF), aldo-ketoreductase family 1, member B10 (AKR1B10),
aldo-ketoreductase family 1, member C3 (AKR1C3), phosphatidic acid
phosphatase type 2B (PPAP2B), inhibin βA (INHBA) and branched chain
amino-acid transaminase 1, cytosolic (BCAT1). These genes may be
biomarkers and targets for glaucoma diagnosis and treatment.
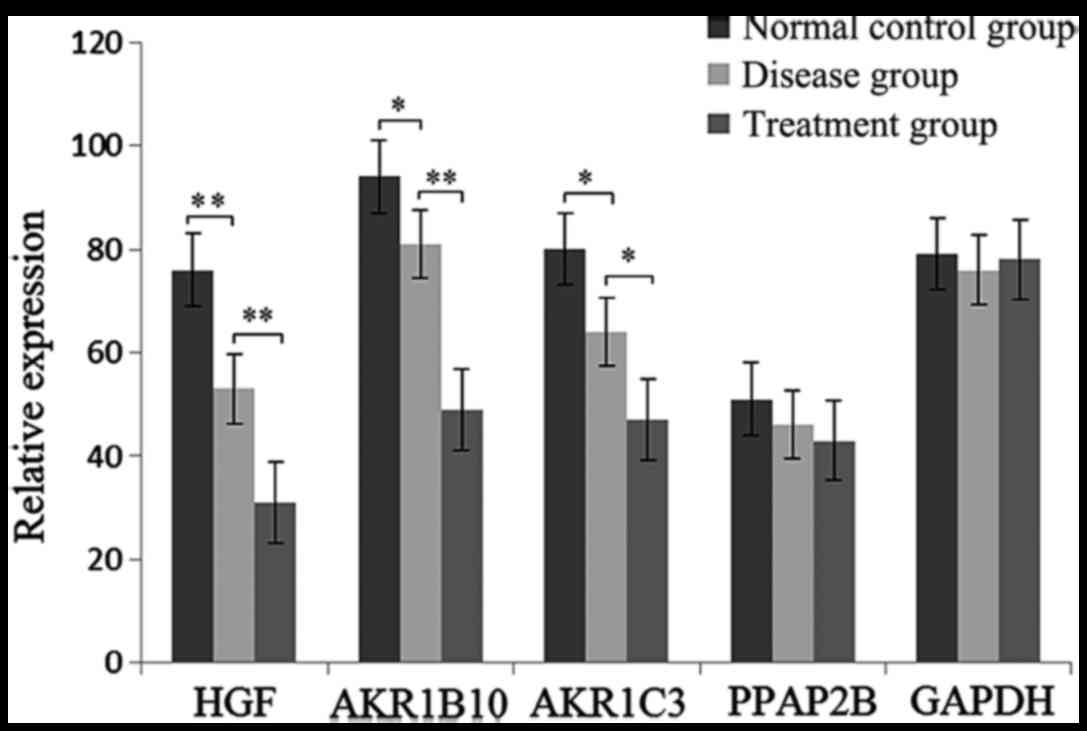
DEG expression level by RT-qPCR
The expression level of HGF, AKR1B10, AKR1C3 and
PPAP2B were determined by RT-qPCR. As shown in Fig. 5, the expression of HGF, AKR1B10 and
AKR1C3 was significantly decreased in glaucoma and treatment
samples. However, no significant difference of AKR1C3 was found in
the three groups.
Discussion
Glaucoma is treated by daily eye drop drugs, but
with unsatisfactory results (17).
Gene therapy has successfully progressed for other eye diseases,
and may be an effective method for the treatment of glaucoma in the
future (17). In this study, various
DEGs were screened and their association with glaucoma was
examined. We also examined DEGs related to treatment, including
HGF, AKR1B10, AKR1C3 and PPAP2B.
HGF encodes a protein which activates a tyrosine
kinase signaling cascade and further regulated cell growth,
motility and morphogenesis (18). In
the patients with eyes suffering from primary open-angle glaucoma,
the concentration of HGF was significantly elevated (19). In addition, in 2010, four SNPs were
found closely related with primary angle closure glaucoma,
including rs12536657, rs17427817, rs5745718 and rs12540393
(20). Moreover, the level of HGF
was confirmed to stimulate the expression of MMP-1, and further
affected the migration of human corneal epithelial cells (21). In this study, the gene was involved
in various functions and pathways, including the negative
regulation of the apoptotic process, mitosis, PI3K-Akt signaling
pathway and pathways in cancer. In addition, the expression of HGF
was significantly lower in the glaucoma and treatment groups than
in the normal control group. In a previous study, the aqueous humor
factors significantly affected mitosis in the molecular
pathogenesis of primary open-angle glaucoma (22). In various diseases, HGF has been
confirmed to be an effective target of TGF-β1 and −2 treatments.
For example, tumor-derived TGF-β1 promoted HGF-dependent invasion
of squamous carcinoma cells (23).
Furthermore, TGF-β was involved in HGF-c-Met pathway, and then
induced oligodendrocyte precursor cell chemotaxis (24). Besides, Tripathi et al
(25) found that the level of TGF-β2
was significantly increased in aqueous humor in glaucomatous eyes.
Overall, HGF is an important biomarker for glaucoma and also a key
target for glaucoma treatment.
Another key DEG, AKR1B10, was also identified in
both glaucoma and TGF-β1 and −2 treatment-related gene
co-expression network. This gene encoded a member of
aldo/ketoreductase superfamily, which could effectively reduce
aliphatic and aromatic aldehydes. As known, NADPH-dependent
aldo-ketoreductase is an important rate limiting enzyme of polyol
pathway, which accelerates glucose metabolism and also affects the
diabetic cataract and retinopathy (26). In this study, AKR1B10 was found
enriched in the daunorubicin metabolic process, doxorubicin
metabolic process, and farnesol catabolic process. As shown in
previous results, intraoperative daunorubicin could decrease the
intraocular pressure safely and effectively in high-risk surgical
cases of glaucoma (27). Moreover,
doxorubicin was also confirmed to be an effective adjunct to
glaucoma surgery (28). Thereby, we
inferred that AKR1B10 participated in the pathogenesis of glaucoma
by being involved in the daunorubicin and doxorubicin metabolic
process. Interestingly, AKR1C3 and AKR1B10 had positive
relationships in the gene co-expression network of glaucoma. AKR1C3
is also a member of the aldo-ketoreductase family 1. Besides the
daunorubicin and doxorubicin metabolic process, AKR1C3 is enriched
in immune response, G-protein coupled receptor signaling pathway
and positive regulation of protein kinase B signaling cascade.
Among these functions and pathways, immune response, especially
oxidative stress, played a key role in keeping a physiological
balance by participating in the pathogenic cellular processes of
glaucoma (29). In addition,
G-protein activation mediated by shear stress was confirmed to be a
possible step in molecular mechanism of glaucoma formation
(30). Most importantly, the
expression of AKR1B10 and AKR1C3 was significantly lower in the
glaucoma and treatment groups than in the normal control group.
According to the above information, AKR1C3 was inferred to be a key
gene for prevention and treatment of glaucoma.
Simultaneously, PPAP2B was screened with a higher
degree in this study and also involved in different functions and
pathways, including small molecule metabolic process, negative
regulation of protein phosphorylation and FcγR-mediated
phagocytosis. PPAP2B encoded a member of the phosphatidic acid
phosphatase family which participate in the formation of
diacylglycerol and glycerolipids (31). Moreover, Chiasseu et al
(32) showed that the signature
pathological features of glaucoma included altered phosphorylation
of tauopathies. Besides, various metabolic abnormalities such as
carbohydrate and uric acid metabolic abnormalities were confirmed
to play an important role in pathogenesis of glaucoma damage
(33). Thereby, PPAP2B may be a key
gene in the pathogenesis of glaucoma through its involvement in the
small molecule metabolic process. However, no significant
difference of PPAP2B was found in the three groups.
In conclusion, HGF, AKR1B10 and AKR1C3 may be key
genes for glaucoma diagnosis and treatment.
Acknowledgements
Not applicable.
Funding
No funding was received.
Availability of data and materials
The datasets used and/or analyzed during the current
study are available from the corresponding author on reasonable
request.
Authors contributions
QN constructed pathway relationship network. XZ
helped with gene co-expression network construction. QN and XZ were
also involved in the conception and design of the study. Both
authors have read and approved the final manuscript.
Ethics approval and consent to
participate
This study has been approved by the Ethics Committee
of The Second People's Hospital of Jinan (Jinan, China). All
patients in this study provided informed consent.
Patient consent for publication
Not applicable.
Competing interests
The authors declare that they have no competing
interests.
References
|
1
|
Martus P, Stroux A, Budde WM, Mardin CY,
Korth M and Jonas JB: Predictive factors for progressive optic
nerve damage in various types of chronic open-angle glaucoma. Am J
Ophthalmol. 139:999–1009. 2005. View Article : Google Scholar : PubMed/NCBI
|
|
2
|
Graham SL, Butlin M, Lee M and Avolio AP:
Central blood pressure, arterial waveform analysis, and vascular
risk factors in glaucoma. J Glaucoma. 22:98–103. 2013. View Article : Google Scholar : PubMed/NCBI
|
|
3
|
Curriero FC, Pinchoff J, van Landingham
SW, Ferrucci L, Friedman DS and Ramulu PY: Alteration of travel
patterns with vision loss from glaucoma and macular degeneration.
JAMA Ophthalmol. 131:1420–1426. 2013. View Article : Google Scholar : PubMed/NCBI
|
|
4
|
Skarie JM and Link BA: The primary
open-angle glaucoma gene WDR36 functions in ribosomal RNA
processing and interacts with the p53 stress-response pathway. Hum
Mol Genet. 17:2474–2485. 2008. View Article : Google Scholar : PubMed/NCBI
|
|
5
|
Borrás T, Buie LK and Spiga MG: Inducible
scAAV2.GRE.MMP1 lowers IOP long-term in a large animal model for
steroid-induced glaucoma gene therapy. Gene Ther. 23:438–449. 2016.
View Article : Google Scholar : PubMed/NCBI
|
|
6
|
Fan BJ and Wiggs JL: Glaucoma: Genes,
phenotypes, and new directions for therapy. J Clin Invest.
120:3064–3072. 2010. View
Article : Google Scholar : PubMed/NCBI
|
|
7
|
Jelodari-Mamaghani S, Haji-Seyed-Javadi R,
Suri F, Nilforushan N, Yazdani S, Kamyab K and Elahi E:
Contribution of the latent transforming growth factor-β binding
protein 2 gene to etiology of primary open angle glaucoma and
pseudoexfoliation syndrome. Mol Vis. 19:333–347. 2013.PubMed/NCBI
|
|
8
|
Kumar A, Basavaraj MG, Gupta SK, Qamar I,
Ali AM, Bajaj V, Ramesh TK, Prakash DR, Shetty JS and Dorairaj SK:
Role of CYP1B1, MYOC, OPTN, and OPTC genes in adult-onset primary
open-angle glaucoma: Predominance of CYP1B1 mutations in Indian
patients. Mol Vis. 13:667–676. 2007.PubMed/NCBI
|
|
9
|
Tanwar M, Kumar M, Dada T, Sihota R and
Dada R: MYOC and FOXC1 gene analysis in primary congenital
glaucoma. Mol Vis. 16:1996–2006. 2010.PubMed/NCBI
|
|
10
|
Kennedy KD, AnithaChristy SA, Buie LK and
Borrás T: Cystatin a, a potential common link for mutant myocilin
causative glaucoma. PLoS One. 7:e363012012. View Article : Google Scholar : PubMed/NCBI
|
|
11
|
Keller PJ, Arendt LM, Skibinski A,
Logvinenko T, Klebba I, Dong S, Smith AE, Prat A, Perou CM, Gilmore
H, et al: Defining the cellular precursors to human breast cancer.
Proc Natl Acad Sci USA. 109:2772–2777. 2012. View Article : Google Scholar : PubMed/NCBI
|
|
12
|
Zheng-Bradley X, Rung J, Parkinson H and
Brazma A: Large scale comparison of global gene expression patterns
in human and mouse. Genome Biol. 11:R1242010. View Article : Google Scholar : PubMed/NCBI
|
|
13
|
Grace C and Nacheva EP: Significance
analysis of microarrays (SAM) offers clues to differences between
the genomes of adult Philadelphia positive ALL and the lymphoid
blast transformation of CML. Cancer Inform. 11:173–183. 2012.
View Article : Google Scholar : PubMed/NCBI
|
|
14
|
Harris MA, Clark J, Ireland A, Lomax J,
Ashburner M, Foulger R, Eilbeck K, Lewis S, Marshall B, Mungall C,
et al: The Gene Ontology (GO) database and informatics resource.
Nucleic Acids Res. 32:D258–D261. 2004. View Article : Google Scholar : PubMed/NCBI
|
|
15
|
Kechris KJ, Biehs B and Kornberg TB:
Generalizing moving averages for tiling arrays using combined
p-value statistics. Stat Appl Genet Mol Biol. 9:Article 29. 2010.
View Article : Google Scholar : PubMed/NCBI
|
|
16
|
Tanabe M and Kanehisa M: Using the KEGG
database resource. Curr Protoc Bioinformatics. 1:122012.PubMed/NCBI
|
|
17
|
Quigley HA: Glaucoma. Lancet.
377:1367–1377. 2011. View Article : Google Scholar : PubMed/NCBI
|
|
18
|
Baykal C, Demirtas E, Al A and Ayhan A,
Yuce K, Tulunay G, Kose MF and Ayhan A: Comparison of HGF
(hepatocyte growth factor) levels of epithelial ovarian cancer cyst
fluids with benign ovarian cysts. Int J Gynecol Cancer. 13:771–775.
2003. View Article : Google Scholar : PubMed/NCBI
|
|
19
|
Engel LA, Muether PS, Fauser S and Hueber
A: The effect of previous surgery and topical eye drops for primary
open-angle glaucoma on cytokine expression in aqueous humor.
Graefes Arch Clin Exp Ophthalmol. 252:791–799. 2014. View Article : Google Scholar : PubMed/NCBI
|
|
20
|
Awadalla MS, Thapa SS, Burdon KP, Hewitt
AW and Craig JE: The association of hepatocyte growth factor (HGF)
gene with primary angle closure glaucoma in the Nepalese
population. Mol Vis. 17:2248–2254. 2011.PubMed/NCBI
|
|
21
|
Daniels JT, Limb GA, Saarialho-Kere U,
Murphy G and Khaw PT: Human corneal epithelial cells require MMP-1
for HGF-mediated migration on collagen I. Invest Ophthalmol Vis
Sci. 44:1048–1055. 2003. View Article : Google Scholar : PubMed/NCBI
|
|
22
|
Jiang YQ, Nagy RM and Spaeth GL: Effect of
aqueous humor factors on the inhibition or enhancement of mitosis:
An exploration of pathogenesis of primary open-angle glaucoma. Chin
Med J (Engl). 98:833–834. 1985.PubMed/NCBI
|
|
23
|
Lewis MP, Lygoe KA, Nystrom ML, Anderson
WP, Speight PM, Marshall JF and Thomas GJ: Tumour-derived TGF-beta1
modulates myofibroblast differentiation and promotes
HGF/SF-dependent invasion of squamous carcinoma cells. Br J Cancer.
90:822–832. 2004. View Article : Google Scholar : PubMed/NCBI
|
|
24
|
Lalive PH, Paglinawan R, Biollaz G, Kappos
EA, Leone DP, Malipiero U, Relvas JB, Moransard M, Suter T and
Fontana A: TGF-beta-treated microglia induce oligodendrocyte
precursor cell chemotaxis through the HGF-c-Met pathway. Eur J
Immunol. 35:727–737. 2005. View Article : Google Scholar : PubMed/NCBI
|
|
25
|
Tripathi RC, Li J, Chan WF and Tripathi
BJ: Aqueous humor in glaucomatous eyes contains an increased level
of TGF-beta 2. Exp Eye Res. 59:723–727. 1994. View Article : Google Scholar : PubMed/NCBI
|
|
26
|
Huang SP, Palla S, Ruzycki P, Varma RA,
Harter T, Reddy GB and Petrash JM: Aldo-keto reductases in the eye.
J Ophthalmol. 2010:5212042010. View Article : Google Scholar : PubMed/NCBI
|
|
27
|
Varma D, Sihota R and Agarwal HC:
Evaluation of efficacy and safety of daunorubicin in glaucoma
filtering surgery. Eye (Lond). 21:784–788. 2007. View Article : Google Scholar : PubMed/NCBI
|
|
28
|
Ren JM: Experimental study on doxorubicin
as an adjunct to glaucoma surgery. Zhonghua Yan Ke Za Zhi.
25:351–354. 1989.(In Chinese). PubMed/NCBI
|
|
29
|
Tezel G: The immune response in glaucoma:
A perspective on the roles of oxidative stress. Exp Eye Res.
93:178–186. 2011. View Article : Google Scholar : PubMed/NCBI
|
|
30
|
To CH, Kong CW, Chan CY, Shahidullah M and
Do CW: The mechanism of aqueous humour formation. Clin Exp Optom.
85:335–349. 2002. View Article : Google Scholar : PubMed/NCBI
|
|
31
|
Wu C, Huang RT, Kuo CH, Kumar S, Kim CW,
Lin YC, Chen YJ, Birukova A, Birukov KG, Dulin NO, et al:
Mechanosensitive PPAP2B regulates endothelial responses to
atherorelevant hemodynamic forces. Circ Res. 117:e41–e53. 2015.
View Article : Google Scholar : PubMed/NCBI
|
|
32
|
Chiasseu M, Cueva Vargas JL,
Destroismaisons L, Vande Velde C, Leclerc N and Di Polo A: Tau
accumulation, altered phosphorylation, and missorting promote
neurodegeneration in glaucoma. J Neurosci. 36:5785–5798. 2016.
View Article : Google Scholar : PubMed/NCBI
|
|
33
|
Elisaf M, Kitsos G, Bairaktari E,
Kalaitzidis R, Kalogeropoulos C and Psilas K: Metabolic
abnormalities in patients with primary open-angle glaucoma. Acta
Ophthalmol Scand. 79:129–132. 2001. View Article : Google Scholar : PubMed/NCBI
|