Introduction
Coronary heart disease (CHD), usually refers to the
heart disease caused by myocardial ischemia and hypoxia due to
insufficiency of myocardial blood supply in patients, which is
caused by stenosis and obstruction of blood vessel lumen as a
result of coronary atherosclerosis (AS) (1,2). AS is
mainly caused by the participation of lipid accumulation in the
wall of coronary artery and inflammation and immune response
(3). The data released by the
Statistical Commission of the American Heart Association in 2009
showed (4) that cardiovascular
disease has become the top ranking disease in the causes of human
death in the world. In China, CHD has become one of the two leading
causes of death after malignant tumor, for China has gradually
entered an aging society, and the number of elderly people has
gradually increased (5). Another
study finds (6) that the main risk
factors for CHD are age, sex, smoking and diabetes mellitus, and
other secondary factors are diet, family history, exercise volume
and congenital defects.
CD69 is the earliest expressed signal transduction
molecule on the surface of immune system activated T lymphocytes
(7). There is a study showing
(8) that the downregulation of the
expression of CD69 can decrease the activation of CD4+T
cells in I diabetic mouse model, thus regulating the immune
response to the disease. Early growth response (EGR) is an early
gene and its family includes four members: EGR1, EGR2, EGR3
and EGR4 (9). EGR can be
activated by a variety of extracellular signal molecules to cause
cascade amplification of cells, and all genes in the family contain
a highly conserved structure domain that binds to DNA. This domain
consists of three same zinc finger structures (Cys2
His2), which can bind specifically to the downstream
promoter region and play a regulatory and transcriptional role
(10). EGR1 gene is more
studied in EGR family and many studies have reported that EGR1 is
directly or indirectly involved in the proliferation and
differentiation of tumor cells (11). However, CD69 and EGR1 are rarely
reported in CHD. We found that EGR1 and CD69 were differentially
expressed in CHD by screening from ceo database. Therefore, in this
study, the clinical effects of EGR1 and CD69 in CHD were
investigated through the detection of the expression of EGR1 and
CD69 in the blood of patients with CHD.
Patients and methods
General data of patients
In the present study, 194 patients with CHD,
admitted to the Department of Cardiology in People's Hospital of
Hunan Province (Changsha, China) from June 2015 to September 2016,
were selected as experimental group. Another 130 normal volunteers
at the same time in the physical examination center were selected
as control group. There were 112 males and 82 females in
experimental group, aged from 39–78 years, with an average age of
66.5±11.3 years. The patients in experimental group were diagnosed
by coronary angiography and all the patients in experimental group
were patients with CHD after the examination. There were 70 males
and 60 females in control group, aged from 42–80 years, with an
average age of 64.8±10.9 years. Patients in control group were
excluded from CHD and other systemic heart diseases. Biochemical
indicators of clinical data of patients were collected, including
total cholesterol (TC), triacylglycerol (TG), high density
lipoprotein (HDL-C), low density lipoprotein (LDL-C), lipoprotein a
[Lp(a)], fasting blood glucose (FBG), glycosylated hemoglobin
(HbA1c), high sensitive C-reactive protein (hs-CRP) and serum
creatinine (Scr), and statistical analysis was performed.
This study was approved by the Medical Ethics
Committee of People's Hospital of Hunan Province (Changsha, China)
and patients and their family members were informed and signed the
informed consent.
Inclusion and exclusion criteria
Inclusion criteria were: There were ≥50% stenosis in
one or more main coronary arteries according to coronary
angiography, patient was >18 years and course of disease was
half a year. Patient had no recent drug treatment, no other
hereditary disease, no radiotherapy and chemotherapy, no autism,
memory impairment and hearing impairment. Patient cooperated
perfectly with follow-up and clinical information.
Exclusion criteria were: Malignant tumors, severe
dysfunction of important organs, acute myocarditis and
pericarditis, congenital heart disease, immune dysfunction,
connective tissue disease, chronic infection, pulmonary embolism
and cerebrovascular disease.
Main reagents and instruments
CD69 McAb (mouse anti-human-phycoerythrin labeled),
CD3 McAb (mouse anti-human-activated protein), CD4 McAb (mouse
anti-human-fluorescein isothiocyanate), PE-labeled mouse IgG1 and
CD69 isomorphic control were purchased from BD Biosciences (San
Jose, CA, USA). Erythrocyte splitting liquor was purchased from
Tiangen Biotech Co., Ltd. (Beijing, China). TRIzol was purchased
from Invitrogen; Thermo Fisher Scientific, Inc. (Waltham, MA, USA).
Reverse transcriptase and reverse transcription kit were purchased
from Takara Biotechnology Co., Ltd. (Dalian, China). 2X SYBR-Green
qPCR mix and revert aid first strand cDNA synthesis kit were
purchased from Invitrogen; Thermo Fisher Scientific Inc. ABI Prism
7900 PCR instrument was purchased from Thermo Fisher Scientific,
Inc.
CD69 detection
Sample collection and processing
Venous whole blood (5 ml) was extracted with vacuum
tubes (EDTA-Na2) on an empty stomach and mixed with
Hanks solution at 1:1. Then the mixture was superimposed on the
liquid level of 8 ml lymphocyte separating and was centrifuged at
543 × g for 15 min at 25°C. After centrifugation, lymphocytes on
the second layer (annular milky white) were collected and put into
test tube (containing 10 ml of Hanks solution). Then they were
mixed and centrifuged at 543 × g again for 15 min at 25°C. The
supernatant was discarded, the precipitation was left, and cells
were resuspended and washed. Finally, cell concentration was
adjusted to 1×10⁶/ml by 10% RPMI-1640 culture medium,
and resuspended suspension was added to a 24-orifice plate (1 ml
per orifice). A total of 100 µl/ml for penicillin, streptomycin
(100 µl/ml) and PHA (20 µg/ml) for stimulator were added and mixed.
The culture was performed (20 h at 37°C and 5% CO2
incubator), the resuspension was performed by PBS, and the cell
concentration was adjusted to 1×10⁶/ml.
Sample detection
Two cell suspensions (100 µl) were added to the
sample tube. One sample was added to each of the 10 µl of CD3, CD4
and CD69 McAbs, respectively, and the other one was added to the
same type of CD3 McAb, CD4 McAb and CD69 McAb, respectively. Cell
suspensions were incubated in greenhouse for 20 min and treated
without light. After dyeing, 2 ml of erythrocyte splitting liquor
was added for mixing. The cell suspensions were static for 10 min
and dissociated without light, and the dissociated test tube was
centrifuged at 1,006 × g for 5 min at 25°C. The supernatant was
discarded, and 2 ml of PBS was added to carry on resuspension of
the cells. After centrifugation at 543 × g for 15 min at 25°C, the
untuberculous antibody was removed, the supernatant was discarded,
and 0.5 ml of PBS was added for resuspension. Flow cytometry was
used to detect the expression level of CD69 in
CD3+CD4+T cells.
EGR1 detection
Sample collection and processing
Venous whole blood (5 ml) was extracted with vacuum
tubes (EDTA-Na2) on an empty stomach and centrifuged at
1,006 × g for 5 min at room temperature within 30 min after
extraction. Supernatant was discarded, and plasma was transferred
to EP tube and stored at −80°C in a refrigerator. Total RNA of
frozen plasma was extracted with TRIzol reagent, and extraction
procedure was carried out in accordance with the manufacturer's
protocol. UV spectrophotometer (L6S; INESA Analytical Instrument
Co. Ltd., Shanghai, China) was used to detect the concentration and
purity of RNA (the A260/A280 of total RNA solution was within the
range of 1.8–2.1), and quality of the total RNA was analyzed by 1%
denatured agarose gel electrophoresis. Reverse transcription
procedure was carried out strictly according to the instruction of
reverse transcription kit.
RT-qPCR detection
Design and synthesis of EGR1 primers were carried
out by Shanghai Bioengineering Co., Ltd., (Shanghai, China)
(Table I). PCR reaction kit (2X
SYBR-Green qPCR Mix) was used for the configuration of reaction
system: A total of 0.2 µl for up- and downstream primers
respectively, 1 µl for cDNA, 5 µl for SYBR Select Master Mix and
double distilled water added to 10 µl; ABI Prism 7900 PCR
instrument was used for amplification. PrimeScript™ RT Master Mix
(Takara Biotechnology Co., Ltd.) to reverse the total RNA collected
according to the kit instructions. Reaction conditions: 2 min after
pre-denaturation at 95°C, 15 sec for denaturation at 95°C, 60 sec
for annealing at 60°C, 15 sec for extension at 95°C, 40 cycles.
GAPDH was used as internal reference in this experiment, and was
conducted three times. Results were analyzed by 2−ΔCq
method (12).
 | Table I.Primer sequence. |
Table I.
Primer sequence.
| Genes | Upstream | Downstream |
|---|
| EGR1 |
5′-CCCTTGCTCCCTTCAATGCT-3′ |
5′-CGAAATCCATGGCACAGACAC-3′ |
| GAPDH |
5′-AGCCACATCGCTCAGACA-3′ |
5′-TGGACTCCACGACGTACT-3′ |
Statistical analysis
In the present study, SPSS 20.0 software package
(IBM Corp., Armonk, NY, USA) was used for statistical analysis of
the collected data, and GraphPad Prism 5 software (La Jolla, CA,
USA) was used to plot the resulting data graph. In the present
study, the measurement data are expressed by mean ± standard
deviation (mean ± SD) and tested by t-test. The counting data was
expressed by rate (%), and the comparison between groups was tested
by χ2. In the present study, Pearson's correlation
analysis was used to analyze the relationships among the variables,
and ROC curve was used to plot the two indicators and to evaluate
the values of the two indicators in the course of the disease of
patients with CHD.
Results
Comparison of clinical treatment in
patients
Through the comparison of the collected data of the
two groups, it was found that there was no statistically
significant difference in clinical data such as sex, age, smoking
and alcohol and in biochemical indicators of TC, TG, LDL-C, FBG and
HbA1c (P>0.05). However, there were statistically significant
differences in HDL-C, [Lp(a)], hs-CRP and Scr between patients in
experimental and control group (P<0.05), and expression level of
HDL-C of patients in experimental was significantly lower than that
in control group, while the expression level of [Lp(a)], hs-CRP and
Scr in experimental was significantly higher than that in control
group (Table II).
| Table II.Clinical information of patients
(n). |
Table II.
Clinical information of patients
(n).
|
| Groups |
|
|
|---|
|
|
|
|
|
|---|
| Variables | Experimental
(n=194) | Control (n=130) | t/χ2 | P-value |
|---|
| Sex |
|
| 0.477 | 0.49 |
| Male | 112 | 70 |
|
|
|
Female | 82 | 60 |
|
|
| Age (years) |
|
| 0.837 | 0.36 |
| ≥55 | 84 | 63 |
|
|
|
<55 | 110 | 67 |
|
|
| Smoking |
|
| 0.003 | 0.954 |
| Yes | 120 | 80 |
|
|
| No | 74 | 50 |
|
|
| Alcohol |
|
| 0.338 | 0.561 |
| Yes | 51 | 38 |
|
|
| No | 143 | 92 |
|
|
| TC (mmol/l) | 1.77±1.05 | 1.61±0.72 | 1.411 | 0.159 |
| TG (mmol/l) | 4.55±0.82 | 4.68±0.94 | 1.317 | 0.189 |
| HDL-C (mmol/l) | 1.09±0.22 | 1.42±0.28 | 11.829 | 0.001 |
| LDL-C (mmol/l) | 2.34±0.64 | 2.39±0.71 | 0.659 | 0.511 |
| [Lp(a)] (mg/l) | 283.6±66.5 | 235.8±58.3 | 8.188 | 0.001 |
| FBG (mmol/l) | 5.84±1.15 | 5.63±0.89 | 1.757 | 0.08 |
| HbA1c (%) | 6.4±1.0 | 6.2±0.9 | 1.834 | 0.068 |
| hs-CRP (mg/l) | 5.64±2.67 | 3.66±2.31 | 6.894 | 0.001 |
| Scr (µmol/l) | 83.5±26.4 | 61.3±17.6 | 8.409 | 0.001 |
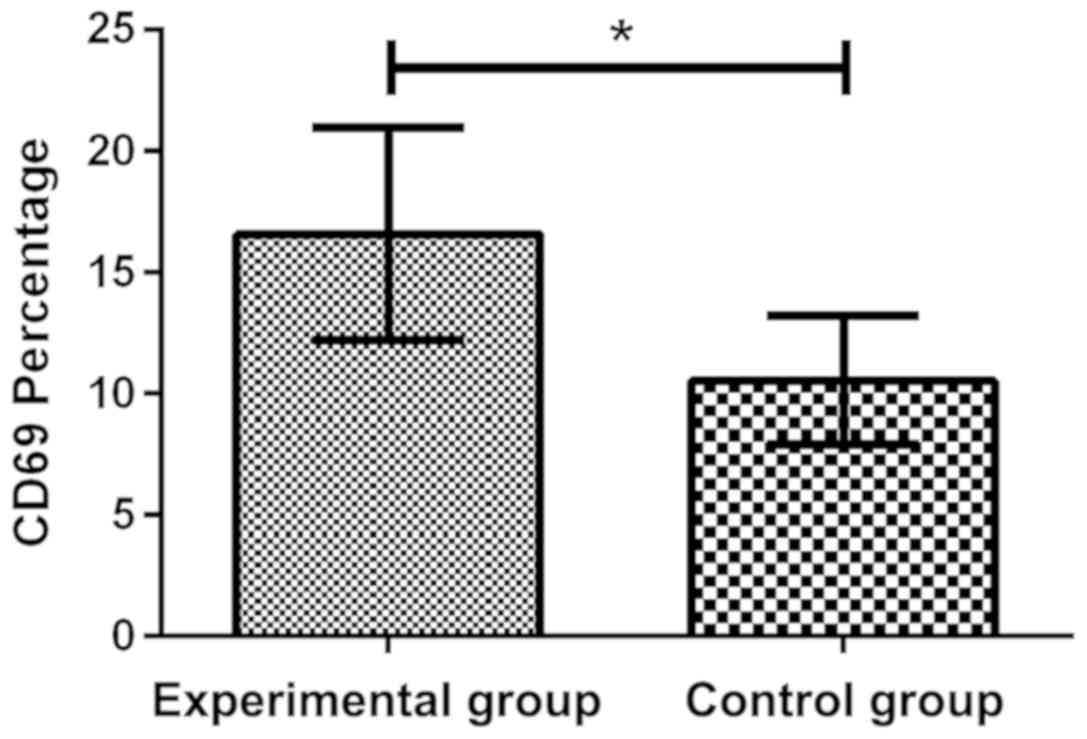
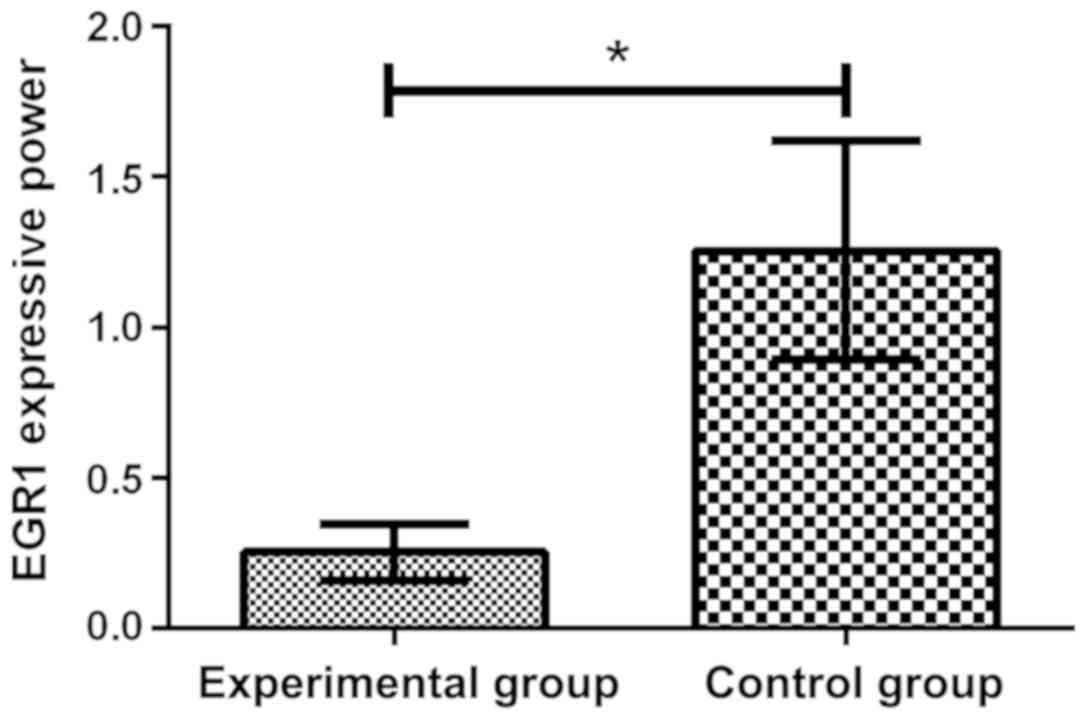
Expression of CD69 and EGR1 in both
groups of patients
By comparing the expression of CD69 in two groups by
flow cytometry, it was found that the expression of CD69 in
experimental group was 16.58±4.39%, which increased significantly,
compared with the control group 10.54±2.63%, and there was a
significant difference in the expression of CD69 between the two
groups, which was 1.57 times (P<0.05). Through the RT-qPCR
detection of the expression of EGR1 in plasma, it was found that
the expression level of EGR1 (1.255±0.362) in control group was
significantly higher than that in experimental group (0.254±0.094),
and there was a significant difference between the two groups
(P<0.05) (Figs. 1 and 2).
Correlation analysis of the expression
and clinical indicators of CD69 and EGR1 in patients with CHD
Through Pearson's correlation analysis, it was found
that the expression level of CD69 in peripheral blood of patients
with CHD was positively correlated with [Lp(a)] and hs-CRP, while
the expression level of EGR1 in patients with CHD was negatively
correlated with [Lp(a)] and hs-CRP, and the rest of the clinical
indicator tables were not included due to no correlation (Table III).
| Table III.Pearson's correlation analysis of the
expression and clinical indicators of CD69 and EGR1. |
Table III.
Pearson's correlation analysis of the
expression and clinical indicators of CD69 and EGR1.
| CD69 | r value | P-value | EGR1 | r value | P-value |
|---|
| Lp(a) | 0.352 | 0.01 | Lp(a) | −0.394 | 0.01 |
| hs-CRP | 0.402 | 0.01 | hs-CRP | −0.524 | 0.01 |
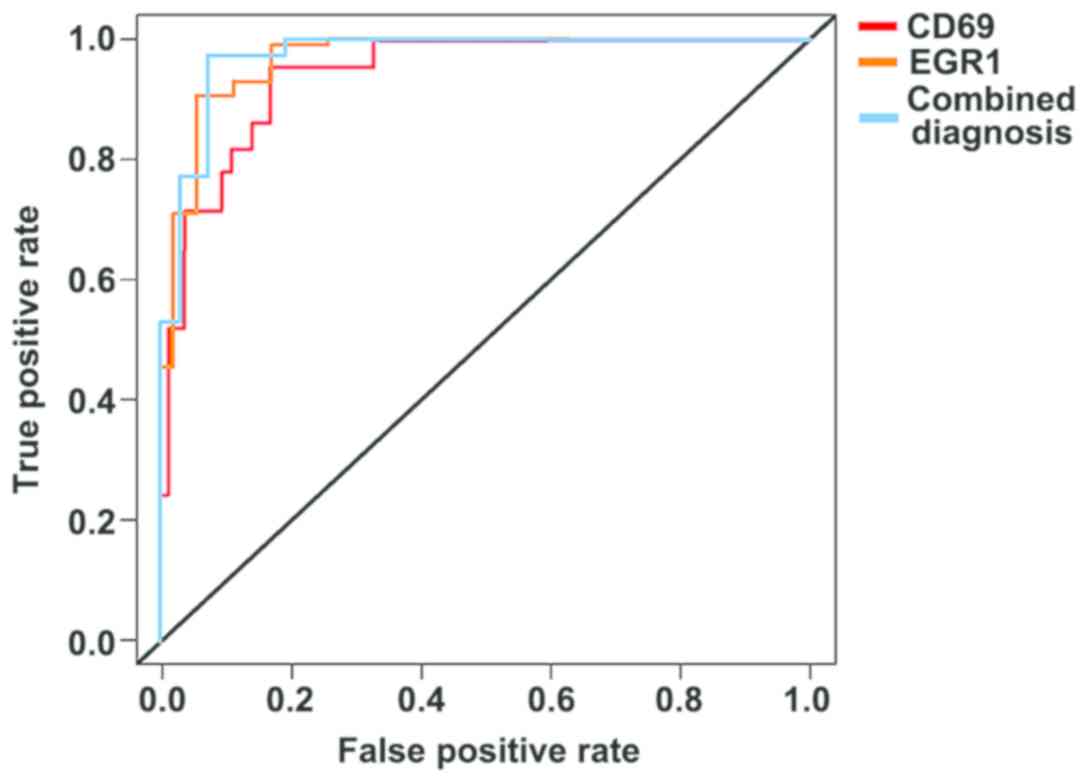
Diagnostic values of the expression
level of CD69 and EGR1 in patients with CHD
Through plotting the ROC curve of the data of the
two groups, it was found that the AUC of the expression level of
CD69 in peripheral blood was 0.889 (95% CI: 0.822–0.958), and the
sensitivity was 73.4%, and the specificity was 86.5%. The higher
the expression level of CD69 was, the higher the sensitivity and
specificity were in evaluating the progression of the patient
conditions. The AUC of the expression level of EGR1 in plasma was
0.933 (95% CI: 0.867–0.978), and the sensitivity was 89.7%, and the
specificity was 79.2%. The lower the expression level of EGR1 was,
the higher the sensitivity and specificity were in evaluating the
progression of the condition of the patients. Finally, by the
combined detection of CD69 and EGR1, it was found that AUC was
0.954 (95% CI: 0.887–0.982), and sensitivity was 90.5%, and
specificity was 86.3% (Fig. 3).
Discussion
As the most common cardiovascular system disease,
CHD is mainly caused by stenosis and obstruction of blood vessel
lumen as a result of coronary AS. It is one of the major diseases
of human health in the world, and statistics show that the
incidence of CHD is increasing year by year (13). As the most common clinical
cardiovascular disease in the elderly, the untimely treatment of
CHD will lead to disability and death, and it is also a disease
with high mortality in the elderly (14). According to statistics (15), the number of patients suffering from
cardiovascular diseases in China is as high as 290 million,
accounting for >30% of the proportion of death, and the
mortality and morbidity rate are increasing year by year. At
present, the main diagnostic methods are cardiac stress test and
coronary angiography. Cardiac stress test requires higher physical
condition of patients, and coronary angiography is one of the most
accurate diagnostic methods, but its high price increases the
economic burden of many patients (16). Therefore, we need to find new
diagnostic indicators to better diagnose the patient's disease and
alleviate the patient's suffering by timely treatment to improve
the patient's quality of life. In recent years, gene diagnosis of
various diseases has become a popular method, and we found that
there were differences in the expression level of CD69 and EGR1 in
patients with CHD by screening from ceo database.
As a member of type II C plant hemagglutinin-like
receptor family, CD69 can be activated by early leukocyte receptor
induction, which is less expressed in the resting lymphocytes.
After the activation of cells, its expression is induced rapidly,
which can be detected on the surface of different activated
leukocyte subsets (17). In addition
to the immune response, the receptor has many other effects, such
as synthesis and differentiation of cells, and regulation of
inflammatory response (18). In the
present study, through the detection of CD69 in peripheral blood of
patients with CHD by flow cytometry, it was found that the
expression level of lymphocyte subsets CD69 in
CD3+CD4+T in peripheral blood of patients
with CHD in experimental group was significantly higher than that
in control group, which supported the result of gene chip
screening. Moreover, in the study of Lei et al (19), it was found that the expression of
CD69 could be an independent prognostic factor in patients with
type 2 diabetes mellitus and CHD, which also supported the results
of this experiment.
EGR1 has been named for existing widely in human
cells and its ability to express rapidly. EGR1 belongs to one of
the members of the immediate early family, and >30 members of
the family all have zinc finger structure coding region and have
high homology (20). There is a
study showing that EGR1 has a complex signal pathway, which plays
an important role in cell growth, differentiation, proliferation
and inflammatory response (21). As
a pathological reaction caused by vascular stenosis and hemodynamic
obstruction, CHD is composed of many factors such as inflammation,
secondary thrombus and plaque rupture (22). In this study, by detecting the
expression of EGR1 in plasma of patients, it was found that the
relative expression level of EGR1 in plasma of patients in the
experimental group decreased significantly, compared with the
control group. Besides, in the study of Toutouzas et al
(23), it was found that through
RT-qPCR detection, the expression of EGR1 of patients with CHD in
the blood stasis group and the non-blood stasis group was
significantly lower than that in normal group, which also showed
that there was a difference in the expression of EGR1 in patients
with CHD. We speculated that the decrease of the expression of EGR1
might be due to the change of the patient's condition, which
inhibited the binding of zinc finger structure coding region of
EGR1 to downstream related genes, leading to the difference of
expression of many biochemical factors, so as to result in the
occurrence of CHD in patients. As a cholesterol macromolecule
lipoprotein, [Lp(a)] plays an important role in the occurrence of
CHD and it has been shown to be an independent risk factor for CHD
(24). hs-CRP is a new independent
prognostic indicator for the diagnosis of CHD in recent years, and
its expression level is positively correlated with the pathological
changes of CHD (25). In the present
study, through Pearson's correlation analysis, it was found that
CD69 and EGR1 were correlated with the expression of [Lp(a)] and
hs-CRP of patients, which suggested that the expression level of
CD69 and EGR1 was related to the severity of patients with CHD.
At the end of the study, the results of ROC curve
analysis showed that the AUC of the expression level of CD69 in
peripheral blood in the course of the disease of patients was 0.889
(95% CI: 0.822–0.958), sensitivity was 73.4%, and specificity was
86.5%. AUC of the expression level of EGR1 in plasma in the course
of the disease of patients was 0.933 (95% CI: 0.867–0.978),
sensitivity was 89.7% and the specificity was 79.2%, which also
showed that the expression level of the two indicators was expected
to be a new indicator for evaluating the progression of the
conditions of patients with CHD.
However, the number of patients is small and the
patients are all local. Whether there are regional differences in
the results needs to be verified by a large number of samples.
Therefore, we hope to increase our sample size and regional samples
in future studies to prove and perfect the correctness and
objectivity of this study.
In conclusion, the expression level of EGR1 in
plasma of patients with CHD decreased, while the expression level
of CD69 in peripheral blood increased, and both of them were
related to the severity of the disease of patients, which could be
used as an indicator to evaluate the progression of the condition
of the patients.
Acknowledgements
Not applicable.
Funding
No funding was received.
Availability of data and materials
The datasets used and/or analyzed during the present
study are available from the corresponding author on reasonable
request.
Authors' contributions
JP designed the study and wrote the manuscript. JP
and YX were responsible for sample collection and PCR. Both authors
read and approved the final study.
Ethics approval and consent to
participate
The study was approved by the Ethics Committee of
People's Hospital of Hunan Province (Changsha, China). Signed
informed consents were obtained from the patients or the
guardians.
Patient consent for publication
Not applicable.
Competing interests
The authors declare that they have no competing
interests.
References
|
1
|
García de Tena J: Inflammation,
atherosclerosis, and coronary artery disease. N Engl J Med.
353:429–430; author reply 429–430. 2005. View Article : Google Scholar
|
|
2
|
Anderson L, Oldridge N, Thompson DR,
Zwisler AD, Rees K, Martin N and Taylor RS: Exercise-based cardiac
rehabilitation for coronary heart disease: Cochrane systematic
review and meta-analysis. J Am Coll Cardiol. 67:1–12. 2016.
View Article : Google Scholar : PubMed/NCBI
|
|
3
|
Catapano AL, Chapman J, Wiklund O and
Taskinen MR: The new joint EAS/ESC guidelines for the management of
dyslipidaemias. Atherosclerosis. 217:1–44. 2011. View Article : Google Scholar : PubMed/NCBI
|
|
4
|
Lloyd-Jones D, Adams R, Carnethon M, De
Simone G, Ferguson TB, Flegal K, Ford E, Furie K, Go A, Greenlund
K, et al American Heart Association Statistics Committee and Stroke
Statistics Subcommittee, : Heart disease and stroke statistics -
2009 update: A report from the American Heart Association
Statistics Committee and Stroke Statistics Subcommittee.
Circulation. 119:e21–e181. 2009.PubMed/NCBI
|
|
5
|
Chen BJ, Pan ZQ and Su XX: Study on
changes of TCM syndrome in patients with coronary heart disease
before and after intervention treatment. Zhongguo Zhong Xi Yi Jie
He Za Zhi. 27:689–691. 2007.(In Chinese). PubMed/NCBI
|
|
6
|
Pogosova N, Kotseva K, De Bacquer D, von
Känel R, De Smedt D, Bruthans J and Dolzhenko M: EUROASPIRE
Investigators: Psychosocial risk factors in relation to other
cardiovascular risk factors in coronary heart disease: Results from
the EUROASPIRE IV survey. A registry from the European Society of
Cardiology. Eur J Prev Cardiol. 24:1371–1380. 2017. View Article : Google Scholar : PubMed/NCBI
|
|
7
|
Mackay LK, Rahimpour A, Ma JZ, Collins N,
Stock AT, Hafon ML, Vega-Ramos J, Lauzurica P, Mueller SN,
Stefanovic T, et al: The developmental pathway for
CD103+CD8+ tissue-resident memory T cells of
skin. Nat Immunol. 14:1294–1301. 2013. View
Article : Google Scholar : PubMed/NCBI
|
|
8
|
Marsolais D, Yagi S and Rosen H:
Activation of sphingosine-1-phosphate receptor 1 inhibits
CD4+ T cell response in a murine model of allergic
airway inflammation. Am J Respir Crit Care Med. 179:A43042009.
|
|
9
|
Kumar SS, Tomita Y, Wrin J, Bruhn M,
Swalling A, Mohammed M, Price TJ and Hardingham JE: High early
growth response 1 (EGR1) expression correlates with resistance to
anti-EGFR treatment in vitro and with poorer outcome in metastatic
colorectal cancer patients treated with cetuximab. Clin Transl
Oncol. 19:718–726. 2017. View Article : Google Scholar : PubMed/NCBI
|
|
10
|
Bhattacharyya S, Wu M, Fang F,
Tourtellotte W, Feghali-Bostwick C and Varga J: Early growth
response transcription factors: Key mediators of fibrosis and novel
targets for anti-fibrotic therapy. Matrix Biol. 30:235–242. 2011.
View Article : Google Scholar : PubMed/NCBI
|
|
11
|
Sun M, Nie FQ, Zang C, Wang Y, Hou J, Wei
C, Li W, He X and Lu KH: The pseudogene DUXAP8 promotes
non-small-cell lung cancer cell proliferation and invasion by
epigenetically silencing EGR1 and RHOB. Mol Ther. 25:739–751. 2017.
View Article : Google Scholar : PubMed/NCBI
|
|
12
|
Dang Y, Luo D and Rong M: Underexpression
of miR-34a in hepatocellular carcinoma and its contribution towards
enhancement of proliferating inhibitory effects of agents targeting
c-MET. PloS one. 8:e610542013. View Article : Google Scholar : PubMed/NCBI
|
|
13
|
Satija A, Bhupathiraju SN, Spiegelman D,
Chiuve SE, Manson JE, Willett W, Rexrode KM, Rimm EB and Hu FB:
Healthful and unhealthful plant-based diets and the risk of
coronary heart disease in U.S. adults. J Am Coll Cardiol.
70:411–422. 2017. View Article : Google Scholar : PubMed/NCBI
|
|
14
|
Blechacz B: Cholangiocarcinoma: Current
knowledge and new developments. Gut Liver. 11:13–26. 2017.
View Article : Google Scholar : PubMed/NCBI
|
|
15
|
Zhou M, Wang H, Zhu J, Chen W, Wang L, Liu
S, Li Y, Wang L, Liu Y, Yin P, et al: Cause-specific mortality for
240 causes in China during 1990–2013: A systematic subnational
analysis for the Global Burden of Disease Study 2013. Lancet.
387:251–272. 2016. View Article : Google Scholar : PubMed/NCBI
|
|
16
|
Danad I, Szymonifka J, Twisk JWR, Norgaard
BL, Zarins CK, Knaapen P and Min JK: Diagnostic performance of
cardiac imaging methods to diagnose ischaemia-causing coronary
artery disease when directly compared with fractional flow reserve
as a reference standard: A meta-analysis. Eur Heart J. 38:991–998.
2017.PubMed/NCBI
|
|
17
|
Kimura MY, Hayashizaki K, Tokoyoda K,
Takamura S, Motohashi S and Nakayama T: Crucial role for CD69 in
allergic inflammatory responses: CD69-Myl9 system in the
pathogenesis of airway inflammation. Immunol Rev. 278:87–100. 2017.
View Article : Google Scholar : PubMed/NCBI
|
|
18
|
Hayashi Y, Okutani M, Ogawa S, Tsukahara T
and Inoue R: Generation of anti-porcine CD69 monoclonal antibodies
and their usefulness to evaluate early activation of cellular
immunity by flow cytometric analysis. Anim Sci J 2018. Anim Sci J.
89:825–832. 2018. View Article : Google Scholar : PubMed/NCBI
|
|
19
|
Lei L, Cui L, Mao Y, Zhang X, Jiang Q,
Dong S and Wang Y: Augmented CD25 and CD69 expression on
circulating CD8+ T cells in type 2 diabetes mellitus
with albuminuria. Diabetes Metab. 43:382–384. 2017. View Article : Google Scholar : PubMed/NCBI
|
|
20
|
Ghatak S, Markwald RR, Hascall VC, Dowling
W, Lottes RG, Baatz JE, Beeson G, Beeson CC, Perrella MA,
Thannickal VJ, et al: Transforming growth factor β1 (TGFβ1)
regulates CD44V6 expression and activity through extracellular
signal-regulated kinase (ERK)-induced EGR1 in pulmonary fibrogenic
fibroblasts. J Biol Chem. 292:10465–10489. 2017. View Article : Google Scholar : PubMed/NCBI
|
|
21
|
Shajahan-Haq AN, Boca SM, Jin L,
Bhuvaneshwar K, Gusev Y, Cheema AK, Demas DD, Raghavan KS, Michalek
R, Madhavan S, et al: EGR1 regulates cellular metabolism and
survival in endocrine resistant breast cancer. Oncotarget.
8:96865–96884. 2017. View Article : Google Scholar : PubMed/NCBI
|
|
22
|
Xu S, Bendeck M and Gotlieb AI: Vascular
pathobiology: Atherosclerosis and large vessel disease.
Cardiovascular Pathology. Butany J and Buja M: 4th. Academic Press;
MA: pp. 85–124. 2016, View Article : Google Scholar
|
|
23
|
Toutouzas K, Colombo A and Stefanadis C:
Inflammation and restenosis after percutaneous coronary
interventions. Europ Heart J. 25:1679–1687. 2004. View Article : Google Scholar
|
|
24
|
Vogt A: Hyperlipoproteinaemia(a) -
apheresis and emerging therapies. Clin Res Cardiol Suppl. 12 Suppl
1:12–17. 2017. View Article : Google Scholar : PubMed/NCBI
|
|
25
|
Tayefi M, Tajfard M, Saffar S, Hanachi P,
Amirabadizadeh AR, Esmaeily H, Taghipour A, Ferns GA, Moohebati M
and Ghayour-Mobarhan M: hs-CRP is strongly associated with coronary
heart disease (CHD): A data mining approach using decision tree
algorithm. Comput Methods Programs Biomed. 141:105–109. 2017.
View Article : Google Scholar : PubMed/NCBI
|