Introduction
Preeclampsia (PE) is a pregnancy-induced
hypertension affecting 3–5% of nulliparous pregnancies (1). The risk of renal dysfunction, red blood
cell breakdown, and impaired liver function is increased due to the
occurrence of PE (2). For pregnant
woman, PE is considered to be the major causes of morbidity and
mortality worldwide, and it is reported that approximately 70,000
pregnant women and 500,000 infant die of it every year (3). However, the pathological mechanism
underlying PE is imperfect and inconsistent. There are two
authoritative theories, one is the vascular aspects of
pathophysiology, such as placental hypoxia, endothelial dysfunction
and enhancement of platelet aggregation (4); and the other is immune dysfunction that
participates in the onset and duration of the clinical
manifestations in fetal tissue (5,6). PE is
likely to be involved in genetic, immune and biological
combinations that make it a heterogeneous disease. This property
increases the difficulty in designing efficient therapies and
identifying specific biomarkers as targets for PE patients.
Numerous researchers have made great efforts to
uncover prominent biomarkers for targeted treatment of PE samples
and reveal pathological mechanism for this disease (7,8). Yong
et al revealed that various susceptibility genes, such as
angiotensinogen (AGT), interleukin-6 (IL6), and
transforming growth factor β1 (TGFβ1), played an important
role in the occurrence and development of PE by affecting the
apoptotic ability and transmission of cellular signals (7). However, the results from various
studies are usually inconsistent due to the difference of
experimental samples, analyzing methods and batch parameters
(9). Besides, from a biological
perspective, genes function in complex disease through interacting
with each other rather than as an independent entity (10). Due to the genes usually functioning
in the form of pathways to perform certain biological functions, it
is necessary to identify pathways by extracting potential biology
from a co-operated large gene list (11). This also provides a novel insight to
investigate potential biomarkers for PE.
Similar to a protein-protein interaction (PPI)
network where nodes stand for genes and edges are PPIs, pathways
and pathway-pathway interaction (crosstalk) between any two
pathways could build a pathway crosstalk network (PCN) which
integrate the data of pathway and PPI. Examination of pathway
alterations or identification of abnormal pathways from a PCN
contribute to form a biological information characterization that
occurs in a specific dataset, which may help the formation of new
possibilities and identification of genetic characteristics for
understanding, diagnosis and treatment of disease (12,13).
Therefore, in the present work, we aimed to identify a dysregulated
pathway set (DPS) between PE patients and normal controls based on
PCN. The findings might make a contribution to potential biomarkers
for PE and reveal the pathological mechanism underlying PE.
Materials and methods
There were four steps in the inference of DPS:
firstly, gene expression data, pathway and PPI were obtained;
secondly, collected datasets and Pearson's correlation coefficient
(PCC) were integrated to construct a PCN; thirdly, on the basis of
the principal component analysis (PCA) method, a seed pathway of
PCN was chosen through calculating pathway activity of each
pathway; finally, DPS from PCN was extracted by analyzing the area
under the receiver operating characteristics curve (AUC) index and
the seed pathway.
Datasets
Gene expression data
Gene expression datasets (E-GEOD-6573 (14) and E-GEOD-48424 (15) for PE patients and normal controls
were downloaded from the ArrayExpress database. Specifically,
E-GEOD-6573 consisted of 3 PE samples (Decidua Preeclampsia,
Placenta Preeclampsia and Fat Preeclampsia) and 3 normal controls
(Decidua Control, Placenta Control and Fat Control), deposited on
the GPL570 platform of Affymetrix Human Genome U133 Plus 2.0 Array
(Affymetrix; Thermo Fisher Scientific, Inc., Waltham, MA, USA).
Additionally, microarray data (E-GEOD-48424) with 19 PE specimens,
including 6 women with non-severe PE and 13 with severe PE, and 19
normal healthy specimens (no history of medical illness or
medication, and received routing prenatal care) were acquired on
the basis of the GPL6480 platform (Agilent Technologies, Santa
Clara, CA, USA). Finally, 22 PE specimens and 22 healthy controls
were employed in this study.
To eliminate batch effects caused by the use of
different experimentation plans and methodologies between
E-GEOD-6573 and E-GEOD-48424, the data were merged using COMBAT
method in inSilicoMerging package (16). Subsequently, in order to control the
quality of the merged data on probe level, a standard approach was
applied, in which a Robust Multi-array Average (RMA) approach was
employed to calculate the background correction (17), normalization was performed with
quantiles algorithm (18), perfectly
matched and imperfectly matched revisions were conducted using
Micro Array Suite (MAS) method (19), and summary of expression values was
performed with median polish method (17). Probes without invalid and duplicates
were converted into gene symbols through annotation packages
(20). Ultimately, 11,269 genes were
acquired for further study from gene expression data.
Pathway data
Reactome pathway database, an open resource for
manually-planned pathways, provided an infrastructure for
calculation across the biological response networks which was
chosen to obtain human-predefined biological pathways (21). In consequence, a total of 1,675
pathways were gained. In order to reinforce the associations of
these pathways with PE, we only chose the pathways containing the
intersections with the gene expression data. In addition, there was
not enough biological information for gene-less pathways, but too
generic for pathways with too many genes (22). Hence, only pathways of the number of
intersecting genes from 5 to 100 were selected for further study. A
total of 1,134 pathways were retained eventually, regarded as
pathway data for subsequent analysis. Here, for the convenience of
description, every pathway in pathway data was assigned to an ID
according to its alphabetical order.
PPI data
In this study, PPI data were extracted from Search
Tool for the Retrieval of Interacting Genes/Proteins (STRING)
database, which gave a crucial evaluation and integration
associated with physics and function of PPIs (23). There were 16,730 genes and 787,896
interactions in the STRING database, but a certain number of them
were non-effective interactions or weak relationships with others;
thus, we abandoned the interactions of inherent score <0.2.
Interactions that were reserved were intersection with gene
expression data to enhance the correlations and confidence with PE,
namely, PPI data. Notably, approximately 293,155 interactions among
proteins were involved in the PPI dataset in 9,986 distinctive
human genes.
PCN construction
As described above, a PCN was built using each node
that represented a pathway, in which one edge was placed in two
pathways that had a crosstalk (24).
The goal of the crosstalk was to meet the interaction for one of
the two conditions, it required that at least one gene was shared
for the two pathways of a crosstalk. Furthermore, there should be a
common gene that was a differentially expressed gene (DEG) between
PE specimen and control groups. Particularly, DEGs were identified
for confirming whether there are significant or non-significant
differences between two group means by Student's t-test (25). On the basis of unpaired two-tailed
t-statistics in PE and control conditions, gene with P-value
<0.05 was considered as a DEG.
On the other hand, two genes encoding a pair of
interacting genes applied in generation of crosstalk between two
pathways were highly co-expressed across the PE and normal groups
(weight ≥0.8). Otherwise, the crosstalk would be discarded. Note
that for an interaction of a pair of pathways, we first calculated
the PCC value in two groups separately, and then computed the
difference of the two PCC values, at last defined the absolute
difference of PCC value as the weight for this interaction. PCC is
a common measure for the correlation strength of a pair of
variables, values between −1 and +1 were chosen (26). The PCC between gene x and
y was calculated as:
PCC(x,y)=1n-1∑i=1n(g(x,y)-g¯(x)σ(x))·(g(y,i)-g¯(y)σ(y))
Where n represented the number of specimens in the
gene expression dataset; g(x, i) or g(y, i)
represented the expression value of gene x or y in
the specimen i under a specific group; g¯(x)org¯(y) was the mean expression value of
gene x or y.
Seed pathway selection
In order to investigate biological functions for
each pathway in PCN, the PCA approach was applied in the summary of
the activity score that was considered as the level of all genes
belonging to a pathway (27).
Through retaining the variance in the data and converting the data
into a low-dimensional level, internal structure in the
high-dimensional data set was efficiently represented using the PCA
algorithm (24). Briefly, the data
were collected in a matrix X with j samples (j
= 1, 2, …, J) and k pathways (k = 1, 2, …,
K). Therefore, a single variable of X was expressed
by xk and was a vector in the
J-dimensional space, abbreviated as xjk.
Activity score Skj of pathway k in sample
j was confirmed by computing the linear combination
expression of all the genes in a pathway:
Skj=w1jkx1jk+w2jkx2jk⋯+wijkxijk
Where xijk was the standardized
expression value of gene i from pathway k in sample
j, and wijk was weight of
xijk. In particular, the first major composition
of corresponding PCA was used to evaluate activity score of
pathways. Notably, there was a difference in the activity score of
one pathway between the disease and healthy control groups, and a
correlation to disease might be shown by the difference, a closer
correlation between the pathway and disease could be revealed from
the bigger difference. Hence, in this work, the maximally altered
activity scoring pathway between PE specimens and normal controls
was denoted as PE patient's seed pathway.
DPS identification
The difficulty of understanding was increased
because of the existence of numerous genes and interactions in a
network, the identification of sub-networks from the global network
was a good approach for studying one disease. Therefore, we
explored a DPS from the PCN to obtain informative biomarkers for
PE. The identification of DPS was regarded as a charateristic
selectivity question in a machine study frame after the activity
score of pathways in PCN was defined, in which the minimal abnormal
pathways effectively distinguished the disease from control were
deemed more likely to be dysregulated pathways. Support vector
machine (SVMs) model, a kernel-based approach used in the samples
with high-dimensional variables, was applied to conduct the feature
selection in our study (28). From
the seed pathway as a starting point, the second pathway integrated
with the seed pathway that had better classification results was
found in the pathway of PCN interaction with the seed pathway. New
pathways were added to confirm biomarkers of pathway by repeating
this procedure until no more pathways were selected to increase the
accuracy of the classification. AUC index was used to evaluate the
prediction accuracy or classification capacity (29), and five-fold cross validation was
applied to test the performance ability (30). In the five-fold cross validation,
five equal-size parts were randomly syncopated from all specimens,
four of which were used as training sets and the last one was
selected as test set to examine the classification property. AUC
was repeatedly calculated 100 times as the addition of new pathways
and the average was applied as the ultimate data.
Results
PCN
As mentioned above, there were 11,269 genes, 1,134
pathways and 293,155 PPIs in the data of gene expression, pathway
and PPI, respectively. Using the Student's t-test, 1,593 DEGs were
detected between PE patients and normal controls from the gene
expression data. A crosstalk between two pathways that met one of
the same genes of the two pathways was defined as DEG, or
co-expression in the two pathways was upregulated, it would be
reserved to prepare for the construction of PCN. As a result,
122,946 crosstalks were obtained. To decrease the complexity of
large-scale networks, the top 5% of all crosstalks in descending
order of their weight was chosen. Consequently, 6,032 crosstalks
among 420 pathways were retained to form the PCN, as illustrated in
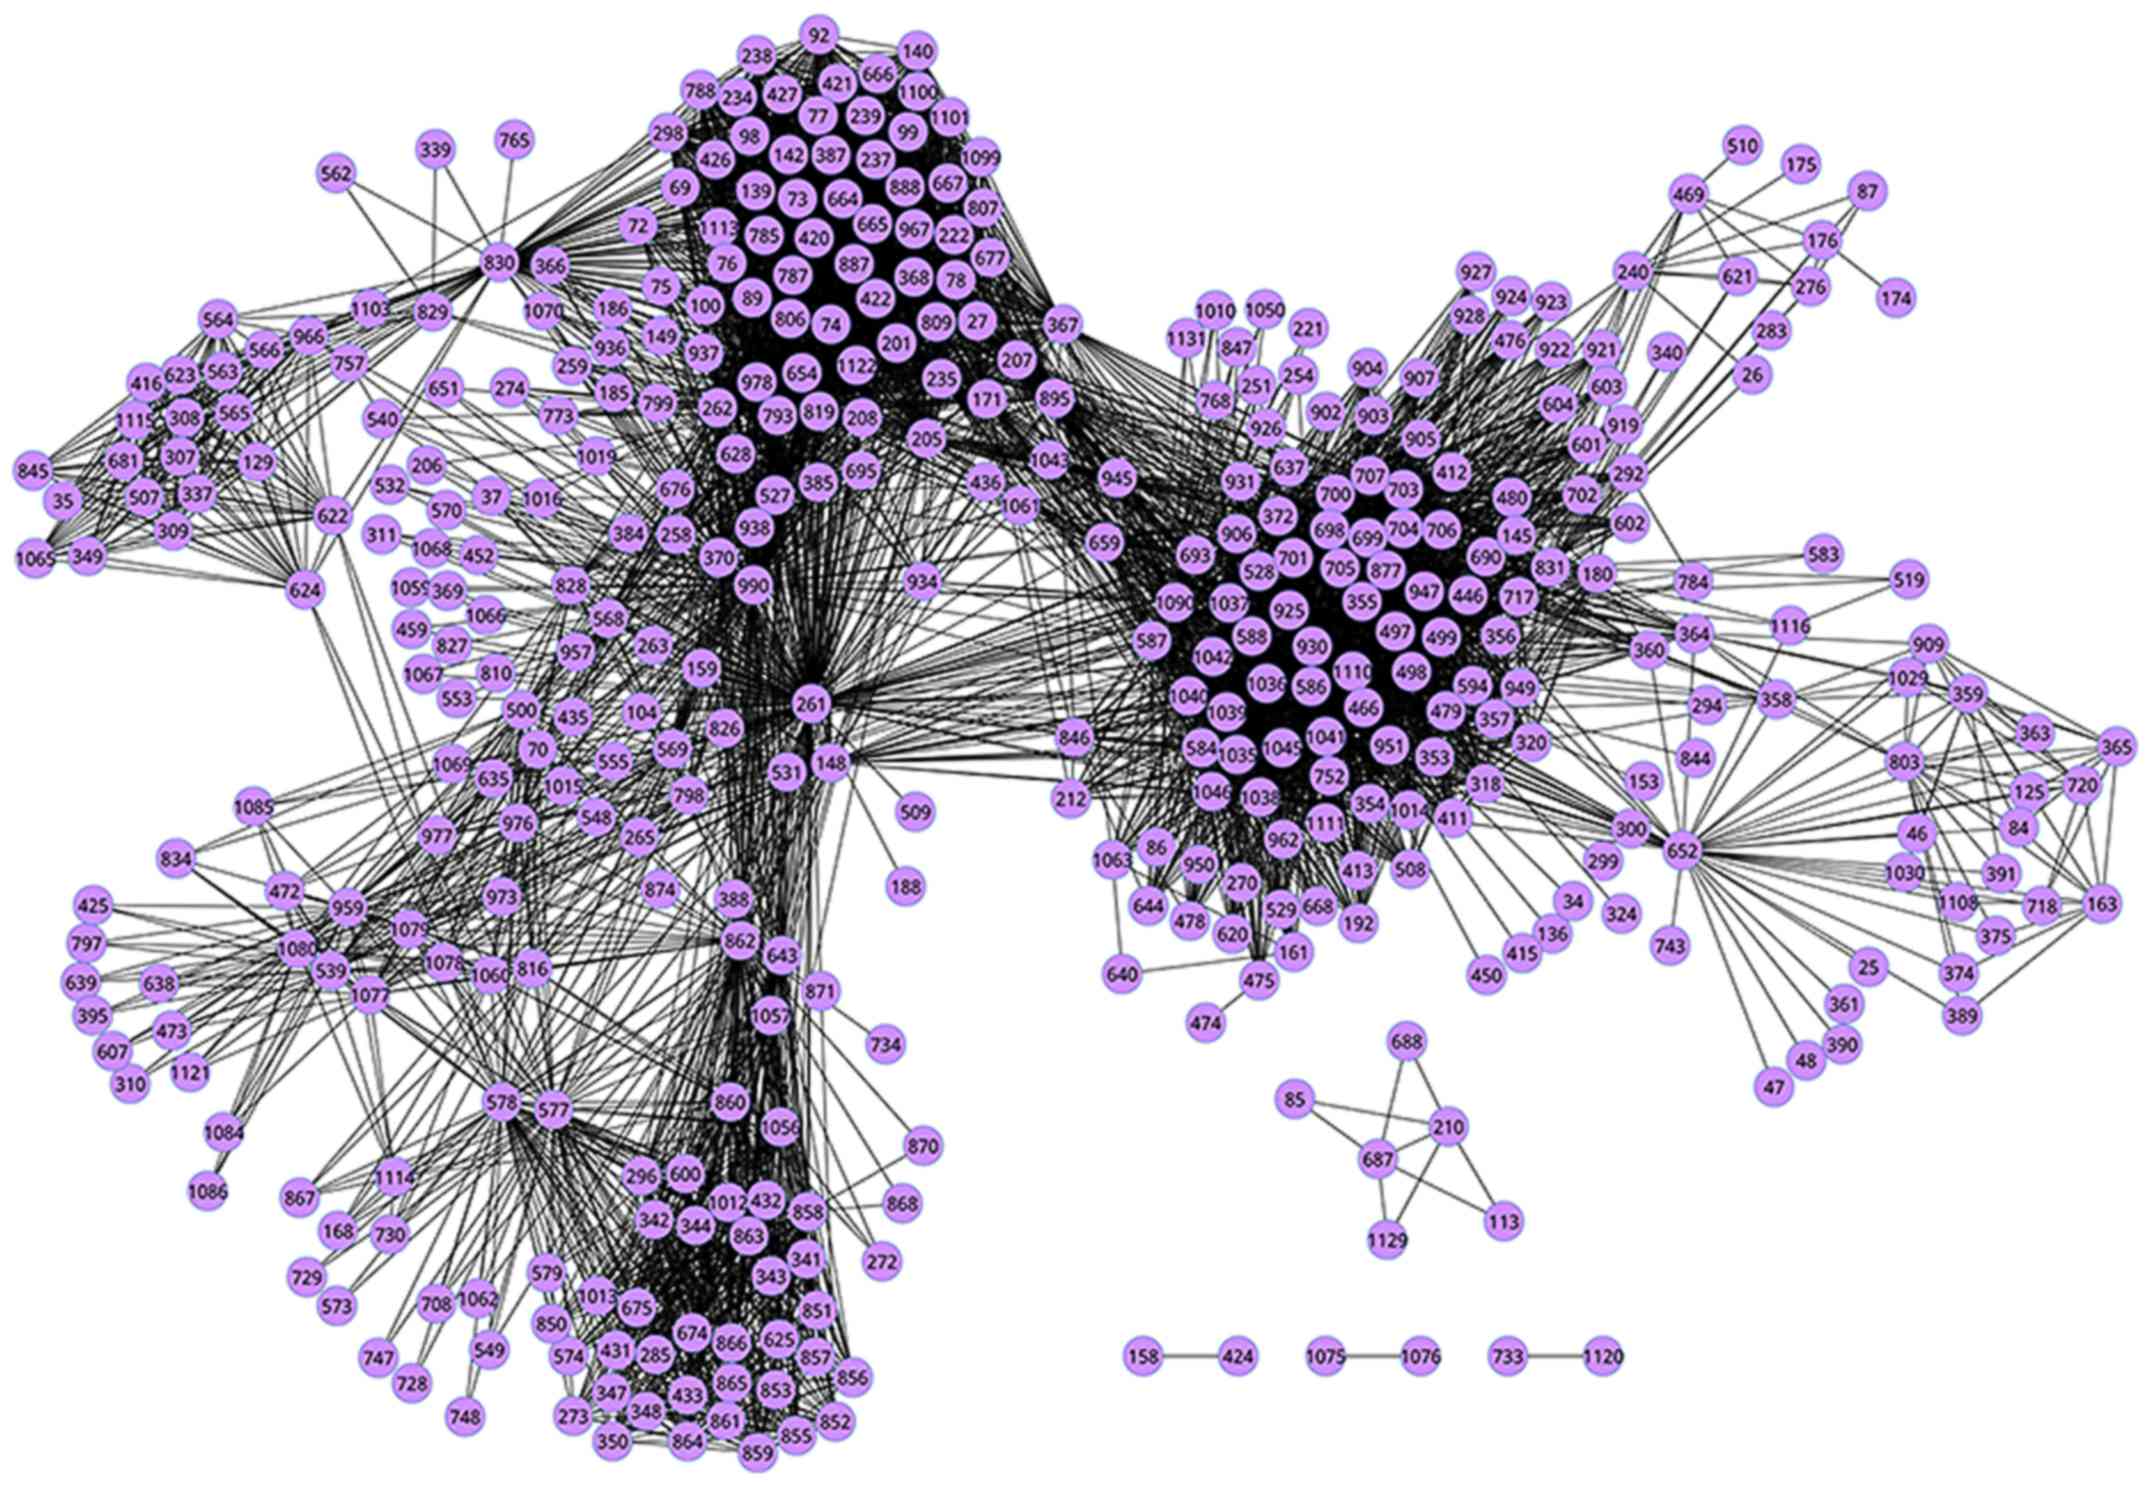
Fig. 1. Specifically, we listed the
top 10 crosstalks in PCN with higher weights than others in
Table I. Consequently, we obtained 7
pathways that were enriched in 10 crosstalks, interestingly, DNA
replication actively participated in 5 of 10 crosstalks. It showed
that the crosstalk between APC/C-induced alteration of cell cycle
proteins (ID: 74) and DNA Replication (ID: 261) was the most
significant one with the highest weight = 261.89.
 | Table I.Top 10 crosstalks in pathway
crosstalk network (PCN). |
Table I.
Top 10 crosstalks in pathway
crosstalk network (PCN).
|
| Crosstalk |
|
|---|
|
|
|
|
|---|
| Rank | Pathway (ID) | Pathway (ID) | Weight |
|---|
| 1 | 74 | 261 | 261.89 |
| 2 | 261 | 806 | 260.09 |
| 3 | 261 | 787 | 244.15 |
| 4 | 74 | 990 | 243.86 |
| 5 | 806 | 990 | 233.54 |
| 6 | 76 | 261 | 229.18 |
| 7 | 787 | 990 | 227.53 |
| 8 | 74 | 793 | 227.00 |
| 9 | 793 | 806 | 226.36 |
| 10 | 261 | 990 | 225.53 |
Seed pathway
On the basis of PCA method, the activity score of
each pathway was computed to examine the key pathways in PCN. A
significant difference was found in the activity scores between PE
specimens and normal controls. Consequently, it is a huge challenge
how to conquer inconsonant results and establish criteria to
evaluate the significance of pathways. After careful consideration,
the absolute alteration in activity scores between PE patients and
normal controls was expressed as its ultimate activity score. In
addition, the activity score of pathway with the largest alteration
was regarded as the seed pathway. The result showed that the number
of pathways was reduced with the increase of the absolute
alteration. Importantly, the induction of IFN-α/β pathways mediated
by RIG-I/MDA5 was the seed pathway for PE with the absolute
alteration of activity score equal to 4.49.
DPS
Based on the seed pathway, pathways were selected to
extract DPS from the PCN for improving its AUC, and the process
stopped when AUC started to drop. Eventually, DPS (AUC=0.928) was
acquired for PE, indicating that DPS had better prediction accuracy
and classification property between PE specimens and normal
controls. The dysregulated pathways of PE patients were the
pathways in the DPS, including the seed pathway RIG-I/MDA5 mediated
induction of IFN-α/β pathways. Besides, network diagram for DPS is
shown in Fig. 2, and 15 pathways and
46 crosstalks were deposited. Furthermore, we computed the
topological degree for each node by summing up the number of its
adjacent pathways, and the result is described in Table II. We found that the degree for
CLEC7A (Dectin-1) signaling (ID: 171) was the highest among the 15
dysregulated pathways. When studying the gene compositions, the
seed pathway was composed of 62 genes that contained 12 DEGs
between PE patients and normal controls (Table II). Among the 15 dysregulated
pathways, CLEC7A (Dectin-1) signaling (ID: 171) had the largest
gene size of 89, while Toll Like Receptor TLR1:TLR2 Cascade (ID:
1041) had the most number of DEGs of 21.
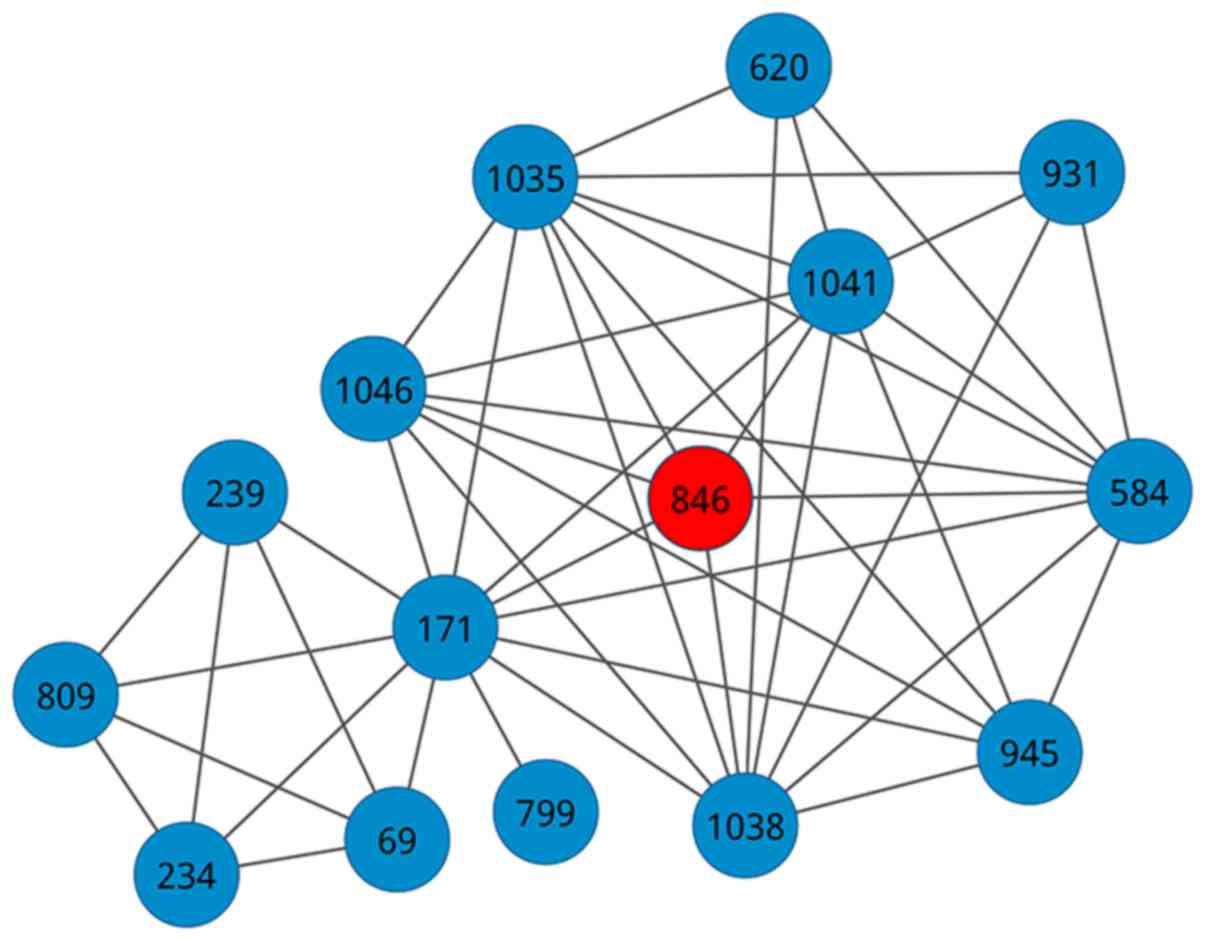 | Figure 2.Network diagram for the dysregulated
pathway set (DPS) for preeclampsia (PE). Each circle represents a
pathway, and the line between any two circles indicate that a
crosstalk exists between a pair of pathways. The red node is the
seed pathway. The ID verse dysregulated pathway: 69, Antigen
processing-Cross presentation; 171, CLEC7A (Dectin-1) signaling;
234, degradation of AXIN; 239, Degradation of GLI2 by the
proteasome; 584, MyD88 cascade initiated on plasma membrane; 620,
NOD1/2 Signaling Pathway; 799, Regulation of hypoxia-inducible
factor (HIF) by oxygen; 809, Regulation of ornithine decarboxylase
(ODC); 846, RIG-I/MDA5 mediated induction of IFN-α/β pathways; 931,
Signaling by Leptin; 945, Signaling by TGF-β Receptor Complex;
1035, Toll Like Receptor 10 (TLR10) Cascade; 1038, Toll Like
Receptor 5 (TLR5) Cascade; 1041, Toll Like Receptor TLR1:TLR2
Cascade; and 1046, TRAF6 Mediated Induction of proinflammatory
cytokines. |
| Table II.Properties of dysregulated pathways
in dysregulated pathway set (DPS). |
Table II.
Properties of dysregulated pathways
in dysregulated pathway set (DPS).
| ID | Dysregulated
pathway | Number of
genes | Number of DEGs | Degree |
|---|
|
846 | RIG-I/MDA5 mediated
induction of IFN-α/β pathways | 62 | 12 | 6 |
| 1041 | Toll Like Receptor
TLR1:TLR2 Cascade | 85 | 21 | 9 |
| 1046 | TRAF6 Mediated
Induction of proinflammatory cytokines | 68 | 16 | 7 |
|
584 | MyD88 cascade
initiated on plasma membrane | 75 | 17 | 9 |
| 1035 | Toll Like Receptor
10 (TLR10) Cascade | 75 | 17 | 9 |
| 1038 | Toll Like Receptor
5 (TLR5) Cascade | 75 | 17 | 9 |
|
171 | CLEC7A (Dectin-1)
signaling | 89 | 13 | 12 |
|
945 | Signaling by TGF-β
Receptor Complex | 68 | 12 | 6 |
|
234 | Degradation of
AXIN | 50 | 11 | 4 |
|
809 | Regulation of
ornithine decarboxylase (ODC) | 45 | 7 | 4 |
|
931 | Signaling by
Leptin | 23 | 6 | 4 |
|
239 | Degradation of GLI2
by the proteasome | 54 | 8 | 4 |
|
620 | NOD1/2 Signaling
Pathway | 26 | 6 | 4 |
|
799 | Regulation of
Hypoxia-inducible Factor (HIF) by oxygen | 24 | 3 | 1 |
|
69 | Antigen
processing-Cross presentation | 73 | 12 | 4 |
Discussion
Pathway analysis decreases the complexity, enhances
the explanatory power and it is a good choice for in-depth
underlying biology of genes and proteins (31). Nevertheless, previous studies mainly
focused on discovering disrupted pathways between normal and
disease samples or the common genes between two altered pathways
(32), ignoring the fact that
pathways can influence each other via a crosstalk instead of
independent actions (33). Pathway
crosstalk can promote the prevention and therapy of certain
diseases through inhibiting the interaction between pathways that
play an important role in the invasive and proliferative capacities
of diseased cells (34). A
network-based method can extract information and important genes
that are relied on, in the bio-molecular network, not a single gene
(35). In addition, it has been
utilized to analyze PPI data and deeply understand the mechanisms
of biological system operation (36). Herein, PPIs provide valuable
information on how genes can fulfil their biological functions, and
develop a global interaction network that clarifies the overall
organization and interaction among functions that are vital to the
survival and growth of cells (11).
To the best of our knowledge, genetic screening is
an effective biological method that identifies the interaction of a
pathway, in which the synthetic lethality of both mutations usually
shows that the two mutations exist with the interaction between the
two pathways, respectively (37).
This genetic interaction can also be employed to connect
closely-packed proteomes in protein networks (38). In the present study, the data of gene
expression, pathway and PPI were systematically integrated to
construct the PCN of PE using a computational approach. PCA method
was used to identify the seed pathway by calculating the activity
score of the pathway in PCN. Starting from the seed pathway, the
DPS was extracted from PCN based on AUC, and pathways in DPS were
defined as dysregulated. Pathways in DPS that were delineated as
distinguishing features between PE specimens and normal controls
were reasonable and biologically interpretable. Briefly, the first
pathway biomarker was the seed pathway that was able to greatly
distinguish the disease group and normal group, and through
identifying the pathways that interacted with the seed pathways in
PCN, the integration of second pathway and the first pathway was
performed to obtain better classification results.
A total of 420 pathways and 6,032 crosstalks were
mapped to the PCN, in which induction of IFN-α/β pathways mediated
by RIG-I/MDA5 was identified as seed pathway. Functionally, the
interferon (IFN) genes were upregulated by RIG-I and MDA5 in a
similar manner, but they respond differently to different virus
species (39). RIG-I and MDA5
signaling caused the activation and phosphorylation of two
serine/threonine kinases for p-IRF3 and p-IRF7, and IRF3 and IRF7
after phosphorylation translocated to the nucleus and then mediate
transcription of IFNA and IFNB genes (40). The association between the pathway
and PE was reported by Chatterjee et al (41).
The DPS was composed of 15 dysregulated pathways and
46 crosstalks, in which CLEC7A (Dectin-1) signaling (ID: 171)
possessed the highest degree of 12, which indicated its important
role in the DPS. Coincidentally, this pathway comprised of 89 genes
which was the largest size among the 15 dysregulated pathways.
Obviously, different pathways might affect each other, especially
when the DEGs with significant alterations in expression levels
overlap (42). Hence, we detected
the number of DEGs enriched in the dysregulated pathways of DPS,
and the result uncovered that Toll Like Receptor TLR1:TLR2 Cascade
(ID: 1041) consisted of the most number of DEGs of 21.
There are several limitations in this study. Due to
the limited number of samples in E-GEOD-6573 and E-GEOD-48424, we
did not divide the PE patients according to the severity of PE.
Further studies are required on various aspects including, more
clinical samples, placental mesenchymal trophoblasts from patients
with normal late pregnancy and PE patients, and key protein
expression in CLEC7A (dectin-1), signaling in function of these
cells need exploring. A more molecular mechanism will be
investigated.
In conclusion, a DPS with 15 dysregulated pathways
and 46 crosstalks from the PCN were identified through integrating
the data of gene expression, pathway and PPI. Although we analyzed
the crosstalk of the pathways and identified the major pathway, a
further examination on whether the pathway interactions are
worthwhile needs clarification. With high-throughput genomic
technology becoming more economical and accurate, the application
may become more common for identifying potential target genes.
Acknowledgements
Not applicable.
Funding
No funding was received.
Availability of data and materials
The datasets used and/or analyzed during the current
study are available from the corresponding author on reasonable
request.
Authors' contributions
TW performed the experiments and analyzed the data,
and was also a major contributor in writing the manuscript. XZS
made a substantial contribution to the study conception and design.
TW and XZS performed the statistical analysis. WHW was involved in
the conception and design of the manuscript and gave the final
approval for publication. All authors read and approved the
manuscript.
Ethics approval and consent to
participate
Not applicable.
Patient consent for publication
Not applicable.
Competing interests
The authors declare that they have no competing
interests.
References
|
1
|
Villar J, Say L, Gülmezoglu A, Merialdi M,
Lindheimer MD, Betran AP and Piaggio G: Eclampsia and
Pre-Eclampsia: A worldwide health problem for 2000 years.
Pre-Eclampsia. Critchley H, Maclean A, Poston L and Walker J: RCOG
Press; London: pp. 189–207. 2003
|
|
2
|
Al-Jameil N, Aziz Khan F, Fareed Khan M
and Tabassum H: A brief overview of preeclampsia. J Clin Med Res.
6:1–7. 2014.PubMed/NCBI
|
|
3
|
Kenny LC, Black MA, Poston L, Taylor R,
Myers JE, Baker PN, McCowan LM, Simpson NAB, Dekker GA, Roberts CT,
et al: Early pregnancy prediction of preeclampsia in nulliparous
women, combining clinical risk and biomarkers: The Screening for
Pregnancy Endpoints (SCOPE) international cohort study.
Hypertension. 64:644–652. 2014. View Article : Google Scholar : PubMed/NCBI
|
|
4
|
Myatt L, Redman CW, Staff AC, Hansson S,
Wilson ML, Laivuori H, Poston L, Roberts JM and Colaboratory GP;
Global Pregnancy CoLaboratory, : Strategy for standardization of
preeclampsia research study design. Hypertension. 63:1293–1301.
2014. View Article : Google Scholar : PubMed/NCBI
|
|
5
|
Redman CWG and Sargent IL: Immunology of
pre-eclampsia. Am J Reprod Immunol. 63:534–543. 2010. View Article : Google Scholar : PubMed/NCBI
|
|
6
|
Eiland E, Nzerue C and Faulkner M:
Preeclampsia 2012. J Pregnancy. 2012:5865782012. View Article : Google Scholar : PubMed/NCBI
|
|
7
|
Yong HE, Melton PE, Johnson MP, Freed KA,
Kalionis B, Murthi P, Brennecke SP, Keogh RJ and Moses EK:
Genome-wide transcriptome directed pathway analysis of maternal
preeclampsia susceptibility genes. PLoS One. 10:e01282302015.
View Article : Google Scholar : PubMed/NCBI
|
|
8
|
Long W, Shi Z, Fan S, Liu L, Lu Y, Guo X,
Rong C, Cui X and Ding H: Association of maternal KIR and fetal
HLA-C genes with the risk of preeclampsia in the Chinese Han
population. Placenta. 36:433–437. 2015. View Article : Google Scholar : PubMed/NCBI
|
|
9
|
Grill S, Rusterholz C, Zanetti-Dällenbach
R, Tercanli S, Holzgreve W, Hahn S and Lapaire O: Potential markers
of preeclampsia - A review. Reprod Biol Endocrinol. 7:702009.
View Article : Google Scholar : PubMed/NCBI
|
|
10
|
Bi D, Ning H, Liu S, Que X and Ding K:
Gene expression patterns combined with network analysis identify
hub genes associated with bladder cancer. Comput Biol Chem.
56:71–83. 2015. View Article : Google Scholar : PubMed/NCBI
|
|
11
|
Li Y, Agarwal P and Rajagopalan D: A
global pathway crosstalk network. Bioinformatics. 24:1442–1447.
2008. View Article : Google Scholar : PubMed/NCBI
|
|
12
|
Doniger SW, Salomonis N, Dahlquist KD,
Vranizan K, Lawlor SC and Conklin BR: MAPPFinder: Using Gene
Ontology and GenMAPP to create a global gene-expression profile
from microarray data. Genome Biol. 4:R72003. View Article : Google Scholar : PubMed/NCBI
|
|
13
|
Dawson JA and Kendziorski C: An empirical
Bayesian approach for identifying differential coexpression in
high-throughput experiments. Biometrics. 68:455–465. 2012.
View Article : Google Scholar : PubMed/NCBI
|
|
14
|
Herse F, Dechend R, Harsem NK, Wallukat G,
Janke J, Qadri F, Hering L, Muller DN, Luft FC and Staff AC:
Dysregulation of the circulating and tissue-based renin-angiotensin
system in preeclampsia. Hypertension. 49:604–611. 2007. View Article : Google Scholar : PubMed/NCBI
|
|
15
|
Textoris J, Ivorra D, Ben Amara A,
Sabatier F, Ménard JP, Heckenroth H, Bretelle F and Mege JL:
Evaluation of current and new biomarkers in severe preeclampsia: A
microarray approach reveals the VSIG4 gene as a potential blood
biomarker. PLoS One. 8:e82638. 2013. View Article : Google Scholar : PubMed/NCBI
|
|
16
|
Taminau J, Meganck S and Lazar C: Using
the inSilicoMerging package. https://bioc.ism.ac.jp/packages/2.11/bioc/vignettes/inSilicoMerging/inst/doc/inSilicoMerging.pdf
|
|
17
|
Irizarry RA, Bolstad BM, Collin F, Cope
LM, Hobbs B and Speed TP: Summaries of Affymetrix GeneChip probe
level data. Nucleic Acids Res. 31:e15. 2003. View Article : Google Scholar : PubMed/NCBI
|
|
18
|
Bolstad BM, Irizarry RA, Astrand M and
Speed TP: A comparison of normalization methods for high density
oligonucleotide array data based on variance and bias.
Bioinformatics. 19:185–193. 2003. View Article : Google Scholar : PubMed/NCBI
|
|
19
|
Bolstad B: Affy: Built-in processing
methods. 2003.https://users.soe.ucsc.edu/~leslie/MOUSE/chucktest/src/affy/doc/builtinMethods.pdf
|
|
20
|
Allen JD, Wang S, Chen M, Girard L, Minna
JD, Xie Y and Xiao G: Probe mapping across multiple microarray
platforms. Brief Bioinform. 13:547–54. 2012. View Article : Google Scholar : PubMed/NCBI
|
|
21
|
Croft D, Mundo AF, Haw R, Milacic M,
Weiser J, Wu G, Caudy M, Garapati P, Gillespie M, Kamdar MR, et al:
The Reactome pathway knowledgebase. Nucleic Acids Res.
42:D472–D477. 2014. View Article : Google Scholar : PubMed/NCBI
|
|
22
|
Ahn T, Lee E, Huh N and Park T:
Personalized identification of altered pathways in cancer using
accumulated normal tissue data. Bioinformatics. 30:i422–i429. 2014.
View Article : Google Scholar : PubMed/NCBI
|
|
23
|
Szklarczyk D, Franceschini A, Wyder S,
Forslund K, Heller D, Huerta-Cepas J, Simonovic M, Roth A, Santos A
and Tsafou KP: STRING v10: Protein-protein interaction networks,
integrated over the tree of life. Nucleic Acids Res. 43:D447–D452.
2015. View Article : Google Scholar : PubMed/NCBI
|
|
24
|
Liu KQ, Liu ZP, Hao JK, Chen L and Zhao
XM: Identifying dysregulated pathways in cancers from pathway
interaction networks. BMC Bioinformatics. 13:1262012. View Article : Google Scholar : PubMed/NCBI
|
|
25
|
Haynes W: Student's t-test. Encyclopedia
of Systems Biology. Dubitzky W, Wolkenhauer O, Cho KH and Yokota H:
Springer; New York, NY: 2013, View Article : Google Scholar
|
|
26
|
Nahler G: Pearson correlation coefficient.
Dictionary of Pharmaceutical Medicine. Springer; Vienna: pp.
1322009, View Article : Google Scholar
|
|
27
|
Bro R and Smilde AK: Principal component
analysis. Anal Methods. 6:2812–2831. 2014. View Article : Google Scholar
|
|
28
|
Chang C-C and Lin C-J: Libsvm: A library
for support vector machines. ACM Trans Intell Syst Technol.
2:272011. View Article : Google Scholar
|
|
29
|
Huang J and Ling CX: Using auc and
accuracy in evaluating learning algorithms, knowledge and data
engineering. IEEE T Knowl Data En. 17:299–310. 2005. View Article : Google Scholar
|
|
30
|
Rojatkar DV, Chinchkhede KD and Sarate GG:
Handwritten Devnagari consonants recognition using MLPNN with five
fold cross validation. International Conference on Circuits, Power
and Computing Technologies. IEEE; Nagercoil, India: pp. 1222–1226.
2013
|
|
31
|
Glazko GV and Emmert-Streib F: Unite and
conquer: Univariate and multivariate approaches for finding
differentially expressed gene sets. Bioinformatics. 25:2348–2354.
2009. View Article : Google Scholar : PubMed/NCBI
|
|
32
|
Khatri P, Sirota M and Butte AJ: Ten years
of pathway analysis: Current approaches and outstanding challenges.
PLOS Comput Biol. 8:e10023752012. View Article : Google Scholar : PubMed/NCBI
|
|
33
|
Donato M, Xu Z, Tomoiaga A, Granneman JG,
Mackenzie RG, Bao R, Than NG, Westfall PH, Romero R and Draghici S:
Analysis and correction of crosstalk effects in pathway analysis.
Genome Res. 23:1885–1893. 2013. View Article : Google Scholar : PubMed/NCBI
|
|
34
|
Bradley EW, Ruan MM, Vrable A and Oursler
MJ: Pathway crosstalk between Ras/Raf and PI3K in promotion of
M-CSF-induced MEK/ERK-mediated osteoclast survival. J Cell Biochem.
104:1439–1451. 2008. View Article : Google Scholar : PubMed/NCBI
|
|
35
|
Liu Z-P, Wang Y, Zhang X-S and Chen L:
Network-based analysis of complex diseases. IET Systems Biology.
6:22–33. 2012. View Article : Google Scholar : PubMed/NCBI
|
|
36
|
Barabási AL and Oltvai ZN: Network
biology: Understanding the cell's functional organization. Nat Rev
Genet. 5:101–113. 2004. View Article : Google Scholar : PubMed/NCBI
|
|
37
|
Tong AHY, Lesage G, Bader GD, Ding H, Xu
H, Xin X, Young J, Berriz GF, Brost RL, Chang M, et al: Global
mapping of the yeast genetic interaction network. Science.
303:808–813. 2004. View Article : Google Scholar : PubMed/NCBI
|
|
38
|
Kelley R and Ideker T: Systematic
interpretation of genetic interactions using protein networks. Nat
Biotechnol. 23:561–566. 2005. View Article : Google Scholar : PubMed/NCBI
|
|
39
|
Nasirudeen AM, Wong HH, Thien P, Xu S, Lam
KP and Liu DX: RIG-I, MDA5 and TLR3 synergistically play an
important role in restriction of dengue virus infection. PLoS Negl
Trop Dis. 5:e9262011. View Article : Google Scholar : PubMed/NCBI
|
|
40
|
Broquet AH, Hirata Y, McAllister CS and
Kagnoff MF: RIG-I/MDA5/MAVS are required to signal a protective IFN
response in rotavirus-infected intestinal epithelium. J Immunol.
186:1618–1626. 2011. View Article : Google Scholar : PubMed/NCBI
|
|
41
|
Chatterjee P, Weaver LE, Chiasson VL,
Young KJ and Mitchell BM: Do double-stranded RNA receptors play a
role in preeclampsia? Placenta. 32:201–205. 2011. View Article : Google Scholar : PubMed/NCBI
|
|
42
|
Wang D, Xia D and Dubois RN: The crosstalk
of PTGS2 and EGF signaling pathways in colorectal cancer. Cancers
(Basel). 3:3894–3908. 2011. View Article : Google Scholar : PubMed/NCBI
|