Introduction
Pregnancy-induced hypertension syndrome is one of
the common clinical gestational complications, it appears after 20
weeks of pregnancy, and the morbidity is high (1). Pregnancy-induced hypertension syndrome
is a major threat to maternal and child health (2). Patient with serious conditions will die
due to the massive haemorrhage appearing in enterocoelia (3). As the pathogenesis of pregnancy-induced
hypertension syndrome is complex, its specific pathogenesis is
still unclear in clinic, thus the treatment is difficult (4). Studies have pointed out that currently
the preferred drug for the prevention and treatment of
pregnancy-induced hypertension syndrome is magnesium sulfate
(5).
Magnesium sulfate is an anticonvulsant drug, it
inhibits vascular and neural muscles in patients with
pregnancy-induced hypertension syndrome by central inhibition and
indirectly reduces the blood pressure of patients by dilating blood
vessels (6). Although magnesium
sulfate has a good clinical effect on the treatment of
pregnancy-induced hypertension syndrome, related studies have
demonstrated that its marked effect is relatively slow, the dose of
magnesium sulfate for the treatment of pregnancy-induced
hypertension syndrome is similar to the concentration of poisoning,
which facilitates the occurrence of hypermagnesemia, the
therapeutic dose has a great influence on the drug concentration in
patients' blood (5,7). Phentolamine is a blocker that is widely
used to treat peripheral vascular diseases (8). It can also increase the contractility
of the myocardium and effectively reduce the related resistance of
peripheral blood vessels by blocking norepinephrine, as a result,
the blood vessels are effectively relaxed (9). This study investigated the effect of
the drug combination of magnesium sulfate and phentolamine on Hcy
and CRP in the serum of patients with pregnancy-induced
hypertension syndrome.
Patients and methods
General data
A total of 96 patients with pregnancy-induced
hypertension syndrome who were diagnosed and treated in Jining No.
1 People's Hospital (Jining, China) from February 2016 to January
2018 were retrospectively analyzed. The patients were grouped
according to the dosage regimen. A total of 48 patients who
received the combination treatment of magnesium sulfate and
phentolamine on the basis of magnesium sulfate were included in the
observation group, and 48 patients who were treated with the
intravenous infusion of magnesium sulfate alone were included in
the control group. The age range of the observation group was from
21 to 38 years, and the average age was 27.45±11.09 years. The age
range of the control group was from 22 to 36 years, and the average
age was 27.13±11.58 years. Inclusion criteria: i) Patients who were
included conformed to the diagnostic criteria of moderate and
severe gestational hypertension. Exclusion criteria: i) Patients
who were intolerant or allergic to magnesium sulfate or
phentolamine; ii) patients who had mental illnesses and serious
medical diseases; and iii) pregnant women who had multiplets.
Patients and their families were informed in advance of the study
and they signed an informed consent form.
This study was approved by the Ethics Committee of
Jining No. 1 People's Hospital. Patients who participated in this
research had complete clinical data. The signed informed consents
were obtained from the patients or the guardians. The differences
in general data, age, sex, body mass index and the condition of
obesity between the two groups were not significant (P>0.05),
and were comparable (Table I).
 | Table I.The general clinical baseline data of
the study and the experiment groups [n (%)]/(mean ± standard
deviation). |
Table I.
The general clinical baseline data of
the study and the experiment groups [n (%)]/(mean ± standard
deviation).
| Group | Study group
(n=48) | Control group
(n=48) | t | P-value |
|---|
| Age (year) |
27.45±11.09 |
27.13±11.58 |
0.138 |
0.890 |
| BMI
(kg/m2) | 18.46±3.37 | 19.03±2.82 |
0.899 |
0.371 |
| Blood routine |
| Hb
(gm/dl) | 11.45±1.74 | 11.68±2.45 |
0.530 |
0.597 |
| RBC
(×1012/l) |
4.24±0.36 |
4.20±0.45 |
0.481 |
0.632 |
| PLT
(×109/l) | 146.59±22.40 | 150.43±24.34 |
0.804 |
0.423 |
| Liver function |
| ALT
(U/l) |
22.53±10.52 | 20.49±8.63 |
1.039 |
0.302 |
| AST
(U/l) | 19.62±8.75 | 17.48±7.52 |
1.285 |
0.202 |
| Renal function |
| TP
(g/l) | 126.36±16.46 |
79.37±12.50 | 15.750 | <0.001 |
| UREA
(mmoI/l) |
8.16±1.43 |
4.47±1.89 | 10.790 | <0.001 |
| CRE
(µmoI/l) | 177.33±30.72 | 101.25±20.37 | 14.300 | <0.001 |
| UA
(µmoI/l) | 602.55±41.26 | 386.70±47.20 | 23.850 | <0.001 |
Methods
Patients in the control group were given an
intravenous infusion of 25 ml of magnesium sulfate (H20033861;
Hebei Tiancheng Pharmaceutical Co., Ltd., Guoyao Zhunzi, Hebei,
China) and 100 ml of glucose solution with a concentration of 5%
(H41022731; Xinxiang Jiushi Pingan Injection Co., Ltd. Guoyao
Zhunzi, Xinxiang, China), the infusion was finished in 30 min. The
patients were then given an intravenous infusion of 60 ml of
magnesium sulfate with a concentration of 25%. Finally, the
patients were intravenously instilled with 10 ml of magnesium
sulfate. The patients in the observation group were treated with
phentolamine on the basis of the single use of the intravenous
infusion of magnesium sulfate, and 20 mg of phentolamine
(H31020589; Shanghai Xudong Haipu Pharmaceutical Co., Ltd.
(domestic), Guoyao Zhunzi, Shanghai, China) was added to the
glucose solution with a concentration of 5%, and the patients were
intravenously instilled with this mixed solution. During the
treatment, the changes of the patients' vital signs were constantly
monitored, and the dose was appropriately adjusted according to the
changing condition of their vital signs.
Observation indicators and the
evaluation criteria of clinical efficacy
Fasting venous blood (5 ml) of the pregnant women in
the two groups was collected after fasting for 8 h in 3 days before
and after the treatment, the serum was centrifuged at 3,000 × g for
15 min at 4°C, and the changes of systolic blood pressure (SBP) and
diastolic blood pressure (DBP) of the patients in the two groups
before and after the treatment were observed. Serum Hcy (enzymatic
method was used to detect serum Hcy, normal value was less than 10
µmol/l) and CRP (immunoprecipitation and immunoturbidimetry were
used, normal reference value was less than 8 mg/l) of the patients
in the two groups were observed before and after the treatment. The
mean arterial pressure (MAP) and the content of 24 h urine protein
of the patients in the two groups were observed in 3 days before
and after the treatment. The clinical efficacy of the patients in
the two groups after the treatment was compared. The evaluation
criteria of clinical efficacy: i) Effective: The falling range of
DBP was <10 mmHg when DBP after the treatment was compared with
that before the treatment, DBP decreased to the normal level; or
the falling range of DBP was from 10 to 20 mmHg when DBP after the
treatment was compared with that before the treatment; or the
falling range of SBP was >30 mmHg; ii) markedly effective: The
falling range of DBP after the treatment was >20 mmHg, DBP
basically returned to the normal level; and iii) ineffective: The
changes of DBP and SBP of the patients did not meet the criteria of
‘effective’ or ‘markedly effective’ after the treatment (10). Total effective rate = (markedly
effective + effective)/the total number of cases.
Statistical analysis
SPSS 17.0 (SPSS, Inc., Chicago, IL, USA) software
system was used to carry out the statistical analysis. The
enumeration data were expressed in the form of [n (%)], the
measurement data were expressed as the mean ± standard deviation,
χ2 test was used in the comparison between the two
groups, t-test was used in the comparison of the data between the
two groups, the paired t-test was used in the comparison of the
data between the groups before and after the treatment. P<0.05
was considered to indicate a statistically significant
difference.
Results
Changes of MAP and the content of 24 h
urine protein in the patients in observation and control groups and
comparison of the content of MAP in patients in two groups before
and after treatment
The content of MAP in the patients in the
observation group before and after the treatment was 183.24±27.06
and 139.69±15.76 mmHg, respectively, the content of MAP in the
patients in the control group before and after the treatment was
184.03±26.54 and 155.02±16.88 mmHg, respectively. MAP after the
treatment was significantly lower, and the differences were
statistically significant (P<0.001). The differences of MAP in
the two groups before treatment were not statistically significant
(P>0.05). After the treatment, MAP of patients in the
observation group was significantly lower than that in the control
group, the differences were statistically significant (P<0.001;
Table II).
| Table II.The comparison of the content of MAP
(mmHg) in the patients in the two groups before and after the
treatment. |
Table II.
The comparison of the content of MAP
(mmHg) in the patients in the two groups before and after the
treatment.
| Groups | Observation group
(n=48) | Control group
(n=48) | t | P-value |
|---|
| Before treatment | 183.24±27.06 | 184.03±26.54 | 0.144 |
0.886 |
| After treatment | 139.69±15.76 | 155.02±16.88 | 4.599 | <0.001 |
| t |
9.635 |
6.390 |
|
|
| P-value | <0.001 | <0.001 |
|
|
Changes of the content of 24 h urine
protein in patients in two groups before and after treatment
The content of 24 h urine protein in patients in
observation group before and after treatment was 2.35±0.36 and
0.67±0.15 g, respectively. The content of 24 h urine protein in
patients in control group before and after treatment was 2.40±0.31
g and 0.93±0.17 g, respectively. Comparing the content of 24 h
urine protein of patients in two groups after treatment with that
before treatment, the content of 24 h urine protein after treatment
was significantly lower, and the differences were statistically
significant (P<0.001). Τhe differences of the content of 24 h
urine protein in the two groups before treatment were not
statistically significant (P>0.05). After treatment, the content
of 24 h urine protein in patients in observation group was
significantly lower than that of patients in control group, the
differences were statistically significant (P<0.001; Table III).
| Table III.The changes of the content of 24 h
urine protein in the patients in the two groups before and after
the treatment. |
Table III.
The changes of the content of 24 h
urine protein in the patients in the two groups before and after
the treatment.
| Groups | Observation group
(n=48) | Control group
(n=48) | t | P-value |
|---|
| Before treatment | 2.35±0.36 | 2.40±0.31 | 0.729 |
0.468 |
| After treatment | 0.67±0.15 | 0.93±0.17 | 7.945 | <0.001 |
| t | 29.840 | 28.810 |
|
|
| P-value | <0.001 | <0.001 |
|
|
Changes of SBP and DBP in the patients
in the observation and the control groups before and after
treatment
The content of SBP of patients in observation group
before and after the treatment was 155.76±4.58 and 118.66±3.04mmHg,
respectively. Content of SBP in patients in the control group
before and after treatment was 155.01±5.67 and 133.71±3.5 mmHg,
respectively. Comparing SBP of patients in the two groups after the
treatment with that before the treatment, SBP after the treatment
was significantly lower, and differences were statistically
significant (P<0.001). When two groups were compared with each
other, the differences of SBP before the treatment were not
statistically significant (P>0.05). After the treatment, SBP of
patients in the observation group was significantly lower than that
of patients in the control group, the differences were
statistically significant (P<0.001; Table IV).
| Table IV.Changes of SBP (mmHg) in patients in
the two groups before and after the treatment. |
Table IV.
Changes of SBP (mmHg) in patients in
the two groups before and after the treatment.
| Groups | Observation group
(n=48) | Control group
(n=48) | t | P-value |
|---|
| Before
treatment | 155.76±4.58 | 155.01±5.67 |
0.713 |
0.478 |
| After
treatment | 118.66±3.04 | 133.71±3.53 | 22.389 | <0.001 |
| t |
46.760 | 22.090 |
|
|
| P-value | <0.001 | <0.001 |
|
|
Changes of DBP in the patients in the
two groups before and after treatment
The content of DBP in patients in the observation
group before and after treatment was 90.63±4.28 and 75.80±3.11
mmHg, respectively. The content of DBP in patients in the control
group before and after treatment was 91.02±4.31 and 85.26±4.09
mmHg, respectively. DBP after the treatment was significantly
lower, and differences were statistically significant (P<0.001).
Differences of DBP in the two groups before treatment were not
statistically significant (P>0.05). After treatment, DBP of
patients in observation group was significantly lower than that of
patients in control group and differences were statistically
significant (P<0.001; Table
V).
| Table V.Comparison of DBP (mmHg) in patients
in the two groups before and after the treatment. |
Table V.
Comparison of DBP (mmHg) in patients
in the two groups before and after the treatment.
| Groups | Observation group
(n=48) | Control group
(n=48) | t | P-value |
|---|
| Before
treatment | 90.63±4.28 | 91.02±4.31 |
0.445 |
0.658 |
| After
treatment | 75.80±3.11 | 85.26±4.09 | 12.760 | <0.001 |
| t | 19.420 |
6.716 |
|
|
| P-value | <0.001 | <0.001 |
|
|
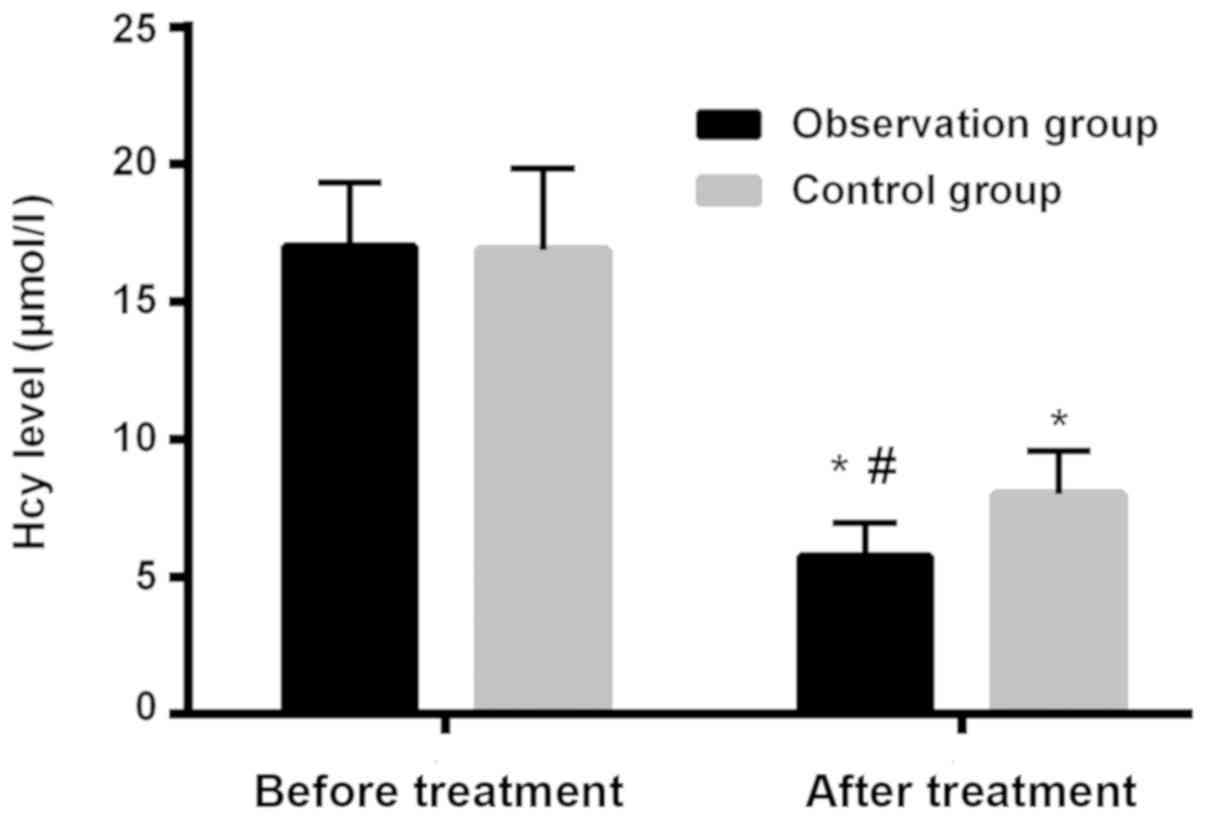
Changes of the level of Hcy and CRP in
patients in observation and control groups and comparison of level
of Hcy in patients before and after treatment
Level of Hcy in patients in observation group before
and after treatment was 17.01±2.34 and 5.7 ±1.24 µmol/l,
respectively. Level of Hcy in patients in control group before and
after treatment was 16.89±2.97 and 8.02±1.56 µmol/l, respectively.
Hcy after treatment was significantly lower, and differences were
statistically significant (P<0.001). Differences of Hcy in the
two groups before treatment were not statistically significant
(P>0.05). After treatment, Hcy of patients in observation group
was significantly lower than that of patients in control group and
differences were statistically significant (P<0.001; Table VI and Fig. 1).
| Table VI.Comparison of the level of Hcy
(µmol/l) in the patients in the two groups before and after the
treatment. |
Table VI.
Comparison of the level of Hcy
(µmol/l) in the patients in the two groups before and after the
treatment.
| Groups | Observation group
(n=48) | Control group
(n=48) | t | P-value |
|---|
| Before the
treatment | 17.01±2.34 | 16.89±2.97 | 0.220 |
0.826 |
| After the
treatment |
5.73±1.24 |
8.02±1.56 | 7.962 | <0.001 |
| t | 29.510 | 18.320 |
|
|
| P-value | <0.001 | <0.001 |
|
|
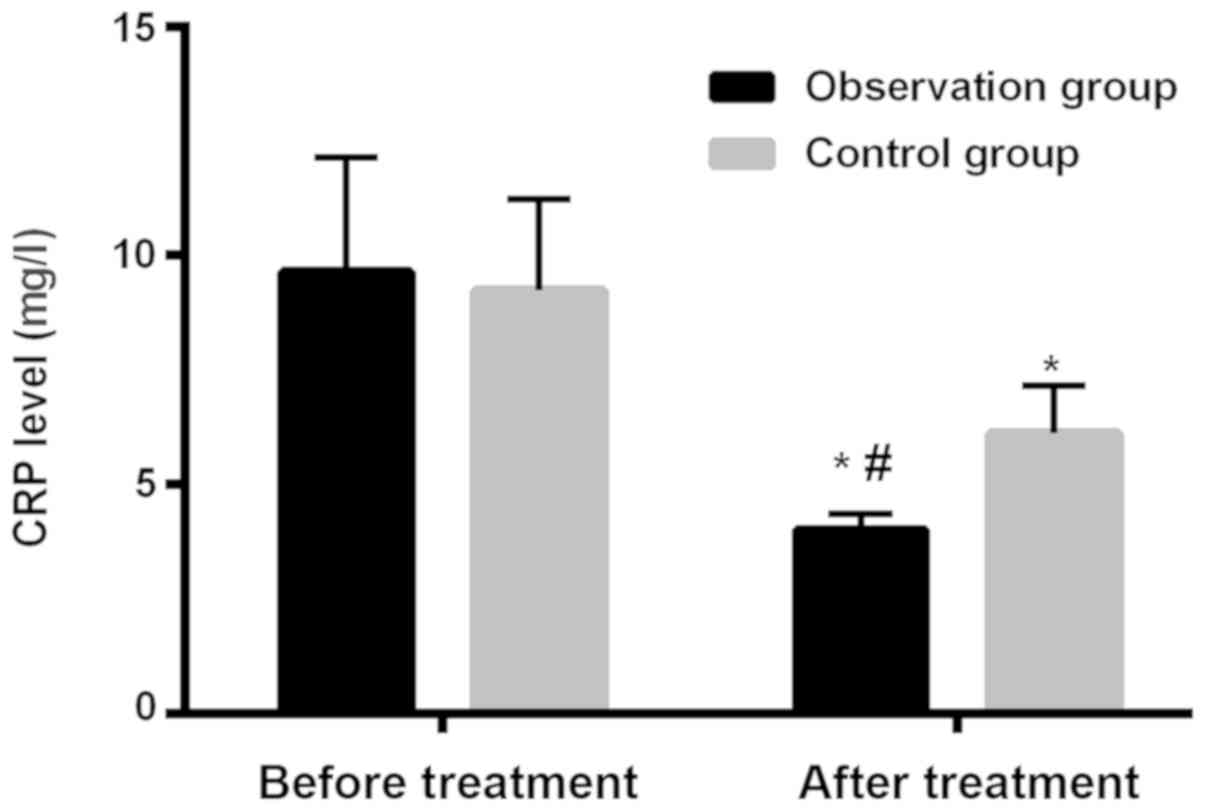
Comparison of level of CRP in patients
in two groups before and after treatment
Level of CRP in patients in observation group before
and after treatment was 9.65±2.49 and 4.01±0.35 mg/l, respectively.
Level of CRP in patients in control group before and after
treatment was 9.23±2.01 and 6.12±1.05 mg/l, respectively. Level of
CRP after treatment was significantly lower, and the differences
were statistically significant (P<0.001). Differences of level
of CRP in the two groups before treatment were not statistically
significant (P>0.05). After treatment, level of CRP in patients
in observation group was significantly lower than that of patients
in control group and differences were statistically significant
(P<0.001; Table VII and
Fig. 2).
| Table VII.Comparison of the level of CRP (mg/l)
in the patients in the two groups before and after the
treatment. |
Table VII.
Comparison of the level of CRP (mg/l)
in the patients in the two groups before and after the
treatment.
| Groups | Observation group
(n=48) | Control group
(n=48) | t | P-value |
|---|
| Before the
treatment | 9.65±2.49 | 9.23±2.01 |
0.909 |
0.366 |
| After the
treatment | 4.01±0.35 | 6.12±1.05 | 13.210 | <0.001 |
| t | 15.540 |
9.501 |
|
|
| P-value | <0.001 | <0.001 |
|
|
Comparison of the therapeutic efficacy
of the patients in the observation and the control groups
The number of the total effective population in the
observation group and the control groups was 44 and 34,
respectively. The total effective rate of the patients in the
observation group was significantly higher than that of the
patients in the control group, the differences were statistically
significant (P<0.05; Table
VIII).
| Table VIII.Comparison of the therapeutic
efficacy of the patients in the two groups. |
Table VIII.
Comparison of the therapeutic
efficacy of the patients in the two groups.
| Groups | n | Markedly
effective | Effective | Ineffective | The total effective
rate |
|---|
| Observation | 48 | 28 (58.33) | 16 (33.33) | 4 (8.33) | 44 (91.67) |
| Control | 48 | 20 (41.67) | 14 (29.17) | 14 (29.17) | 34 (70.83) |
| χ2 |
| – | – | – | 6.838 |
| P-value |
| – | – | – | 0.009 |
Discussion
Pregnancy-induced hypertension syndrome is a disease
that is mainly prevented and controlled by obstetrics and
gynecology department, it is one of the major causes of death of
pregnant women in gestation period (11). Due to the characteristics of
pregnancy-induced hypertension syndrome, such as the
rapidly-developing conditions and many complications (12), once patients' condition is not
properly controlled pregnancy-induced hypertension syndrome is
unceasingly aggravated, this will seriously threaten the life and
safety of patients (13). A large
number of clinical studies have shown that apart from the changes
of indicators of blood pressure levels such as SBP and DBP, the
levels of Hcy, CRP, MAP and 24 h urine protein in the peripheral
blood serum of patients are closely related to the development of
patients' condition (14–16). Studies have confirmed that CRP is a
sensitive indicator of inflammation and it can indicate
inflammatory responses in the body (17). In recent years, many clinical studies
have demonstrated that the increase of the level of Hcy and CRP may
be a risk factor that leads to the occurrence of hypertension
during pregnancy (17). When the
expression of Hcy in the serum of pregnant women is high, it will
destroy the vascular endothelial cells, lead to vasospasm and thus
result in pregnancy-induced hypertension syndrome (18). However, there are few studies on the
specific effects of the changes of the level of Hcy and CRP on the
condition of patients with pregnancy-induced hypertension syndrome.
The relationship between the changes of the level of Hcy and CRP
and the clinical efficacy of related patients is still unclear.
Therefore, this study investigated the effect of the combination
use of magnesium sulfate and phentolamine on Hcy and CRP in the
serum of patients with pregnancy-induced hypertension syndrome.
In this study, we first analyzed the changes of MAP
and the content of 24 h urine protein in the patients in the
observation and the control groups. We found that MAP and the
content of 24 h urine protein of patients in the two groups after
the treatment were significantly lower than those before the
treatment. After the treatment, MAP and the content of 24 h urine
protein of patients in the observation group were significantly
lower than those of patients in the control group, the differences
were statistically significant. A large number of clinical studies
have shown that MAP and the content of 24 h urine protein are
common monitoring indicators for patients with pregnancy-induced
hypertension syndrome, the obvious increase of the two monitoring
indicators is closely related to the development of the condition
of pregnancy-induced hypertension syndrome (19). Studies related to pregnancy-induced
hypertension syndrome have confirmed that the abnormal increase of
MAP and the content of 24 h urine protein may aggravate the
condition of patients with pregnancy-induced hypertension syndrome
(20). Therefore, we believed that
the combination use of magnesium sulfate and phentolamine has a
better effect on the regulation of MAP and the content of 24 h
urine protein in patients with pregnancy-induced hypertension
syndrome. Next, we compared the changes in SBP and DBP in the
patients between the observation and the control group, we found
that SBP and DBP in the patients in the two groups after the
treatment were significantly lower than those of patients in the
two groups before the treatment. SBP and DBP in the patients in the
observation group after the treatment were significantly lower than
those of patients in the control group after the treatment, and the
differences were statistically significant. Therefore, we believed
that the combination use of magnesium sulfate and phentolamine was
more effective in the down-regulation of the blood pressure level
in patients with pregnancy-induced hypertension syndrome. In a
previous study on the effect of magnesium sulfate combined with
other drugs and the effect of the single use of magnesium sulfate
on the clinical efficacy of patients with pregnancy-induced
hypertension syndrome, Nzelu et al (21) found that magnesium sulfate combined
with phentolamine had a better effect on the blood pressure in
pregnant women in the treatment of patients with pregnancy-induc ed
hypertension syndrome, which is similar to the results of our
study. Then, we monitored the changes of the level of Hcy and CRP
in the patients in the observation group and the control group, and
found that Hcy of patients in the two groups after the treatment
was significantly lower than that before the treatment, thereinto,
Hcy in the patients in the observation group after the treatment
was significantly lower than that of patients in the control group
after the treatment, and the differences were statistically
significant. Vitamin B12 is an important cofactor for the
metabolism of Hcy. For those pregnant women in the middle and
advanced gestation period, the amount of vitamin B12 synthesized in
the body is affected by metabolism and the amount of synthesis is
reduced, thus this causes the accumulation of Hcy in the body and
results in the imbalance of vasomotor factors, eventually
pregnancy-induced hypertension syndrome appears in pregnant women
(22). CRP is an important indicator
of the occurrence of inflammation, the changes of the level of CRP
in the serum are closely related to the vascular endothelial injury
in the body, the severity of diseases and the prognosis (23). Therefore, we speculated that the
reduction range of the level of Hcy and CRP in patients with
pregnancy-induced hypertension syndrome, who are treated with
magnesium sulfate combined with phentolamine, is higher than that
of the single use of intravenous infusion treatment of magnesium
sulfate, and the clinical improvement effect is better. Finally, we
compared the clinical efficacy of the patients in the two groups
after the treatment, we found that the total effective rate of
magnesium sulfate combined with phentolamine in the treatment of
the patients with pregnancy-induced hypertension syndrome was
significantly higher than that of the patients who were treated
with the intravenous infusion of magnesium sulfate alone. A large
number of studies on the treatment of pregnancy-induced
hypertension syndrome, have verified that the efficacy of magnesium
sulfate combined with phentolamine is better than that of the
single use of magnesium sulfate in the treatment of patients with
pregnancy-induced hypertension syndrome (24).
In this study, there are still some shortcomings,
for example, the study data can only indicate the improvement of
the condition of the patients with pregnancy-induced hypertension
syndrome within 3 days after the treatment, the results of the
later stage still need to be clarified. This may have some impact
on the results of the study; therefore, we will follow up the
patients from time to time according to the relevant data of the
patients in the later stage.
In summary, the meliorative effect of magnesium
sulphate combined with phentolamine on the level of MAP, the
content of 24 h urine protein, SBP, DBP, Hcy and CRP in pregnant
woman is far more impactful than that of the single use of the
intravenous infusion of magnesium sulfate in the treatment of
pregnancy-induced hypertension syndrome, and the clinical efficacy
of magnesium sulphate combined with phentolamine is better, thus,
it is worthwhile to promote it widely in clinic.
Acknowledgements
Not applicable.
Funding
No funding was received.
Availability of data and materials
The datasets used and/or analyzed during the present
study are available from the corresponding author on reasonable
request.
Authors' contributions
LM wrote the manuscript. LM and LL recorded and
analyzed observation indicators. CJ and HZ were responsible for the
general data of patients. FM and PH contributed to evaluation of
clinical efficacy. The final version was read and adopted by all
the authors.
Ethics approval and consent to
participate
This study was approved by the Ethics Committee of
Jining No. 1 People's Hospital (Jining, China). Patients who
participated in this research had complete clinical data. The
signed informed consents were obtained from the patients or the
guardians.
Patient consent for publication
Not applicable.
Competing interests
The authors declare that they have no competing
interests.
References
|
1
|
Zhou A, Xiong C, Hu R, Zhang Y, Bassig BA,
Triche E, Yang S, Qiu L, Zhang Y, Yao C, et al: Pre-pregnancy BMI,
gestational weight gain, and the risk of hypertensive disorders of
pregnancy: a cohort study in Wuhan, China. PLoS One.
10:e01362912015. View Article : Google Scholar : PubMed/NCBI
|
|
2
|
Zeng L, Yang K and Ge J: Uncovering the
pharmacological mechanism of astragalus salvia compound on
pregnancy-induced hypertension syndrome by a network pharmacology
approach. Sci Rep. 7:168492017. View Article : Google Scholar : PubMed/NCBI
|
|
3
|
Ankichetty SP, Chin KJ, Chan VW,
Sahajanandan R, Tan H, Grewal A and Perlas A: Regional anesthesia
in patients with pregnancy induced hypertension. J Anaesthesiol
Clin Pharmacol. 29:435–444. 2013. View Article : Google Scholar : PubMed/NCBI
|
|
4
|
Sato T and Takeuchi M: Pregnancy-induced
hypertension-related chorioretinitis resembling uveal effusion
syndrome: a case report. Medicine (Baltimore). 97:e115722018.
View Article : Google Scholar : PubMed/NCBI
|
|
5
|
Jia JP, Wu YX and Xie GH: Clinical
observation on treatment of albuminuria in patients with
pregnancy-induced hypertension syndrome in puerperium by Xiaobai
Decoction. Zhongguo Zhong Xi Yi Jie He Za Zhi. 27:644–646. 2007.(In
Chinese). PubMed/NCBI
|
|
6
|
Fang MR and Li JC: Evaluation of the
efficacy of ligustrazine collaborated with magnesium sulfate in the
treatment of pregnancy-induced hypertension in rats. Shi Yan Sheng
Wu Xue Bao. 38:45–53. 2005.(In Chinese). PubMed/NCBI
|
|
7
|
Wang L, Liu ZQ, Huo YQ, Yao LJ, Wei XG and
Wang YF: Change of hs-CRP, sVCAM-1, NT-proBNP levels in patients
with pregnancy-induced hypertension after therapy with magnesium
sulfate and nifedipine. Asian Pac J Trop Med. 6:897–901. 2013.
View Article : Google Scholar : PubMed/NCBI
|
|
8
|
Pan L, Liu C, Kong Y, Piao Z and Cheng B:
Phentolamine inhibits angiogenesis in vitro: suppression of
proliferation migration and differentiation of human endothelial
cells. Clin Hemorheol Microcirc. 65:31–41. 2017. View Article : Google Scholar : PubMed/NCBI
|
|
9
|
Burton TJ and Wilkinson IB: The dangers of
immediate-release nifedipine in the emergency treatment of
hypertension. J Hum Hypertens. 22:301–302. 2008. View Article : Google Scholar : PubMed/NCBI
|
|
10
|
Folic MM, Jankovic SM, Varjacic MR and
Folic MD: Effects of methyldopa and nifedipine on uteroplacental
and fetal hemodynamics in gestational hypertension. Hypertens
Pregnancy. 31:31–39. 2012. View Article : Google Scholar : PubMed/NCBI
|
|
11
|
Lungeanu-Juravle L, Patrascu N, Deleanu OC
and Cinteza M: The role of obstructive sleep apnea in developing
gestational hypertension and preeclampsia. Maedica (Buchar).
11:330–333. 2016.PubMed/NCBI
|
|
12
|
Uguz F: Is there any association between
use of antidepressants and preeclampsia or gestational
hypertension?: a systematic review of current studies. J Clin
Psychopharmacol. 37:72–77. 2017. View Article : Google Scholar : PubMed/NCBI
|
|
13
|
Tsai HM and Kuo E: From gestational
hypertension and preeclampsia to atypical hemolytic uremic
syndrome. Obstet Gynecol. 127:907–910. 2016. View Article : Google Scholar : PubMed/NCBI
|
|
14
|
Tinsley JH, Chiasson VL, South S, Mahajan
A and Mitchell BM: Immunosuppression improves blood pressure and
endothelial function in a rat model of pregnancy-induced
hypertension. Am J Hypertens. 22:1107–1114. 2009. View Article : Google Scholar : PubMed/NCBI
|
|
15
|
Tuuri AL, Jauhiainen MS, Tikkanen MJ and
Kaaja RJ: Systolic blood pressure and fatty acid-binding protein 4
predict pregnancy-induced hypertension in overweight nulliparous
women. Placenta. 35:797–801. 2014. View Article : Google Scholar : PubMed/NCBI
|
|
16
|
van Middendorp D, ten Asbroek A, Bio FY,
Edusei A, Meijjer L, Newton S and Agyemang C: Rural and urban
differences in blood pressure and pregnancy-induced hypertension
among pregnant women in Ghana. Global Health. 9:592013. View Article : Google Scholar : PubMed/NCBI
|
|
17
|
Pan A, Wang Y, Yuan JM and Koh WP:
High-sensitive C-reactive protein and risk of incident type 2
diabetes: A case-control study nested within the Singapore Chinese
Health Study. BMC Endocr Disord. 17:82017. View Article : Google Scholar : PubMed/NCBI
|
|
18
|
Li S, Tang X, Peng L, Luo Y, Zhao Y, Chen
L, Dong R, Zhu J, Chen Y and Liu J: A head-to-head comparison of
homocysteine and cystatin C as pre-procedure predictors for
contrast-induced nephropathy in patients undergoing coronary
computed tomography angiography. Clin Chim Acta. 444:86–91. 2015.
View Article : Google Scholar : PubMed/NCBI
|
|
19
|
Liu F, Yang H, Li G, Zou K and Chen Y:
Effect of a small dose of aspirin on quantitative test of 24-h
urinary protein in patients with hypertension in pregnancy. Exp
Ther Med. 13:37–40. 2017. View Article : Google Scholar : PubMed/NCBI
|
|
20
|
Gangaram R, Ojwang PJ, Moodley J and
Maharaj D: The accuracy of urine dipsticks as a screening test for
proteinuria in hypertensive disorders of pregnancy. Hypertens
Pregnancy. 24:117–123. 2005. View Article : Google Scholar : PubMed/NCBI
|
|
21
|
Nzelu D, Yeung F, Couderq D, Shennan A and
Kametas NA: An inaccurate automated device negatively impacts the
diagnosis and treatment of gestational hypertension. Pregnancy
Hypertens. 10:28–33. 2017. View Article : Google Scholar : PubMed/NCBI
|
|
22
|
Shekelle P: Lowering homocysteine with
folic acid and B vitamins did not prevent vascular events after
myocardial infarction. Evid Based Med. 11:1052006. View Article : Google Scholar : PubMed/NCBI
|
|
23
|
Mitaki S, Nagai A, Oguro H and Yamaguchi
S: C-reactive protein levels are associated with cerebral small
vessel-related lesions. Acta Neurol Scand. 133:68–74. 2016.
View Article : Google Scholar : PubMed/NCBI
|
|
24
|
Bánhidy F, Acs N, Puhó EH and Czeizel AE:
The efficacy of antihypertensive treatment in pregnant women with
chronic and gestational hypertension: a population-based study.
Hypertens Res. 33:460–466. 2010. View Article : Google Scholar : PubMed/NCBI
|