Introduction
With the development of high throughput technology
and gene data analysis over the past decade, rapid progress has
been made in discovering genetic associations of diseases (1,2).
Generally, genes do not work individually, but co-operate with each
other and actively participate in biological processes
systemically. To the best of our knowledge, pathway analysis is the
first choice for shedding light on underlying biology of genes in
many diseases (3).
In the present study, using pathway annotations and
gene expression data, we proposed to predict optimal pathways for
PE patients by integrating the guilt by association (GBA) algorithm
and network approach, termed with network-based GBA inference
method. Co-expression network (CEN) of differentially expressed
genes (DEGs) was constructed by the Spearman's correlation
coefficient (SCC) method. Pathway data for PE were collected
dependent on the Kyoto Encyclopedia of Genes and Genomes (KEGG)
database and DEGs. Ultimately, the network-based GBA inference
method was implemented to predict optimal pathways, of which the
area under the receiver operating characteristics curve (AUROC) was
obtained for each pathway. The results might provide new insights
on uncovering molecular mechanism underlying PE.
Materials and methods
Preparing gene expression data and
DEGs
To control the quality gene array E-GEOD-25906 from
ArrayExpress database was used. This dataset includes larger number
of subjects relatively less affected by other factors. The
diagnostic standard with preeclampsia (PE) clinical inclusion
criteria of the subjects: women were diagnosed with PE if their
systolic blood pressure was at least 140 mmHg, their diastolic
blood pressure was at least 90 mmHg and they had proteinuria with
an estimated 300 mg of protein or greater excreted in 24 h measured
directly or indirectly by protein creatinine ratio. Standard
pretreatments were conducted, containing background correction
(4), normalization (5), probe match (6) and summarization of expressed values
(4). After converting the
preprocessed data on probe level into gene symbol measure and
removing the duplicated ones, we obtained a total of 19,027 genes
in gene expression data.
The lmFit function implemented in Limma was utilized
to perform empirical Bayes statistics and false discovery rate
(FDR) calibration of the P-values on the data (7–9). Only
genes which met to the thresholds of P<0.01 and
|log2FoldChange| >2 were defined as DEGs across PE
patients and normal controls.
Constructing CEN
In order to illustrate the relationships among DEGs
of PE samples, the SCC method was utilized (10). Besides, for an interaction between
gene x and y, the SCC was computed as follows:
SCC=1n−1∑m=1n(g(x,m)−g¯(x)σ(x))·(g(y,m)−g¯(y)σ(y))
Note that the absolute SCC value across PE samples
and normal controls was denoted as its weight value. The larger of
the weight value, the closer of the interaction between two genes
was. Next, DEGs and weight values were input into the Cytoscape
software to visualize the CEN. Consequently, a CEN with weights was
obtained for subsequent analysis.
Recruiting pathway annotation
data
Metabolism pathways were recruited from the KEGG
pathway database (11). There are
287 pathways covering 6,894 genes in the KEGG pathway database.
Subsequently, with an attempt to make these pathways more closely
correlated with PE patients, all DEGs were mapped to 287 pathways,
and only pathways that had intersections with DEGs were left to the
remaining analyses, named as pathway annotation data.
Network-based GBA inference
method
All DEGs were mapped to 287 pathways, and the
pathways that had intersections with DEGs were left for pathway
annotation data. In this work, the network-based GBA inference
method was employed to predict pathway functions in the development
of PE patients, which combined CEN with the GBA algorithm (12). Taking pathway as our source of
functional annotations, a multi-functionality score (MFS) was
assigned to each gene i in the CEN (13), Where Numink was the
number of genes within pathway group k, whose weighting had
the effect of giving contribution to a pathway group.
MFS(i)=∑k|i∈Pathwayk1Numink*Numoutk
Where Numink was the number of
genes within pathway group k, weighting exerted the action
of giving contribution to a pathway group; and
Numoutk was the number of genes outside pathway
group in the CEN. Where Numink was the number of
genes within pathway group k, whose weighting had the effect
of giving contribution to a pathway group. In subsequent analysis,
we computed the AUROC values for assessing the classification
performances between PE samples and normal controls (14). Consequently, the AUROC for each
pathway was obtained, and we selected these pathways of AUROC
>0.5 as optimal pathways of PE patients.
Results
DEGs and pathway data
As described above, a total of 19,027 genes were
identified in E-GEOD-25906 after standard pretreatments. Using the
Limma package, we determined 351 DEGs between PE patients and
normal controls which satisfied the thresholds of P<0.01 and
|log2FoldChange| >2. Significantly, the top five
genes in descending order of their P-values were SIAE (P=4.59E-10),
TRIM24 (P=7.48E-10), PPP1R12C (P=2.90E-09), TUBA1B (P=3.96E-09),
and ENG (P=4.23E-09).
The total 287 pathways (involving 6,894 genes)
belonging to metabolism category were collected from the KEGG
pathway database. In addition, 351 DEGs of PE patients were mapped
to 287 pathways to make these pathways more correlated to PE
patients, and we only took the intersections. As a result, 81
pathways including 300 DEGs were reserved as pathway annotation
data for subsequent study (Table I),
such as Protein processing in endoplasmic reticulum (ID: hsa04141),
Ribosome (ID: hsa03010), and Purine metabolism (ID: hsa00230).
 | Table I.KEGG pathway annotation data for
PE. |
Table I.
KEGG pathway annotation data for
PE.
| Pathway ID | Pathway name | DEGs |
|---|
| hsa00010 |
Glycolysis/Gluconeogenesis | PGAM1; HK2 |
| hsa00230 | Purine
metabolism | POLR2H; RRM1; DCK;
PDE8B; HPRT1 |
| hsa00240 | Pyrimidine
metabolism | POLR2H; RRM1;
DCK |
| hsa00270 | Cysteine and
methionine metabolism | MAT2B; GOT1 |
| hsa00350 | Tyrosine
metabolism | MIF; GOT1 |
| hsa00360 | Phenylalanine
metabolism | MIF; GOT1 |
| hsa00480 | Glutathione
metabolism | GCLM; TXNDC12;
RRM1 |
| hsa00520 | Amino sugar and
nucleotide sugar metabolism | HEXB; GNPDA1;
HK2 |
| hsa00531 | Glycosaminoglycan
degradation | HEXB; GNS |
| hsa00564 | Glycerophospholipid
metabolism | PLA2G16; MBOAT1 |
| hsa00650 | Butanoate
metabolism | L2HGDH; HMGCS1 |
| hsa00900 | Terpenoid backbone
biosynthesis | HMGCS1; PDSS2 |
| hsa01200 | Carbon
metabolism | PGAM1; GPT2; GOT1;
HK2 |
| hsa01210 | 2-Oxocarboxylic acid
metabolism | GPT2; GOT1 |
| hsa01230 | Biosynthesis of amino
acids | PGAM1; MAT2B; GPT2;
GOT1 |
| hsa02010 | ABC transporters | ABCA7; ABCB6 |
| hsa03008 | Ribosome biogenesis
in eukaryotes | WDR75; MPHOSPH10;
NVL |
| hsa03010 | Ribosome | RPL7A; MRPS5;
RPL18A; RPS2; MRPL14 |
| hsa03013 | RNA transport | TPR; ALYREF; UPF3B;
SUMO3 |
| hsa03015 | mRNA surveillance
pathway | ALYREF; UPF3B |
| hsa03018 | RNA
degradation | BTG1; HSPD1;
LSM7 |
| hsa03040 | Spliceosome | SYF2; ALYREF;
LSM7 |
| hsa04010 | MAPK signaling
pathway | MAP4K3; RRAS2;
GNG12 |
| hsa04014 | Ras signaling
pathway | RGL2; GNG2; RRAS2;
GNG12; PLA2G16 |
| hsa04020 | Calcium signaling
pathway | SLC25A5; PHKA2 |
| hsa04062 | Chemokine signaling
pathway | GNG2; GNG12 |
| hsa04068 | FoxO signaling
pathway | CSNK1E; GABARAPL2;
PRKAB2 |
| hsa04141 | Protein processing
in endoplasmic reticulum | DNAJC3; OS9;
HSP90B1; SSR1; DNAJB11; UGGT2; DNAJB2; SSR4 |
| hsa04142 | Lysosome | GNPTG; CTSC; HEXB;
CTSA; GNS |
| hsa04145 | Phagosome | TUBA1B; ACTG1;
TUBA1A |
| hsa04151 | PI3K-Akt signaling
pathway | JAK1; COL27A1;
HSP90B1; GNG2; GNG12 |
| hsa04152 | AMPK signaling
pathway | LEP; STRADB; ACACB;
PRKAB2 |
| hsa04310 | Wnt signaling
pathway | CSNK1E; FZD7 |
| hsa04360 | Axon guidance | SEMA4C; SEMA3B |
| hsa04390 | Hippo signaling
pathway | SNAI2; ACTG1;
CSNK1E; BMP6; FZD7 |
| hsa04510 | Focal adhesion | PPP1R12C; COL27A1;
ACTG1 |
| hsa04520 | Adherens
junction | SNAI2; ACTG1;
PTPRB |
| hsa04530 | Tight junction | ACTG1; YBX3;
RRAS2 |
| hsa04540 | Gap junction | TUBA1B; TUBA1A |
| hsa04550 | Signaling pathways
regulating pluripotency of stem cells | JAK1; FZD7 |
| hsa04610 | Complement and
coagulation cascades | F13A1; CFB;
TFPI |
| hsa04611 | Platelet
activation | COL27A1; ACTG1 |
| hsa04614 | Renin-angiotensin
system | MME; CTSA;
ACE2 |
| hsa04630 | Jak-STAT signaling
pathway | JAK1; LEP |
| hsa04640 | Hematopoietic cell
lineage | MME; CD24 |
| hsa04710 | Circadian
rhythm | CSNK1E; CLOCK;
PRKAB2 |
| hsa04713 | Circadian
entrainment | GNG2; GNG12 |
| hsa04723 | Retrograde
endocannabinoid signaling | GNG2; GNG12 |
| hsa04724 | Glutamatergic
synapse | GNG2; GNG12 |
| hsa04725 | Cholinergic
synapse | GNG2; GNG12 |
| hsa04726 | Serotonergic
synapse | GNG2; GNG12 |
| hsa04727 | GABAergic
synapse | GABARAPL2; GNG2;
GNG12 |
| hsa04728 | Dopaminergic
synapse | GNG2; CLOCK;
GNG12 |
| hsa04810 | Regulation of actin
cytoskeleton | PPP1R12C; ACTG1;
RRAS2; GNG12 |
| hsa04910 | Insulin signaling
pathway | PHKA2; ACACB; HK2;
PRKAB2 |
| hsa04913 | Ovarian
steroidogenesis | BMP6; HSD17B2 |
| hsa04919 | Thyroid hormone
signaling pathway | ACTG1; NCOA2;
MED27; RCAN1 |
| hsa04920 | Adipocytokine
signaling pathway | LEP; ACACB;
PRKAB2 |
| hsa04921 | Oxytocin signaling
pathway | PPP1R12C; ACTG1;
RCAN1; PRKAB2 |
| hsa04922 | Glucagon signaling
pathway | PGAM1; PHKA2;
ACACB; PRKAB2 |
| hsa04932 | Non-alcoholic fatty
liver disease (NAFLD) | CEBPA; NDUFA12;
LEP; PRKAB2 |
| hsa04974 | Protein digestion
and absorption | COL27A1; MME; ACE2;
KCNN4; COL15A1 |
| hsa05010 | Alzheimer's
disease | NDUFA12; MME |
| hsa05012 | Parkinson's
disease | NDUFA12; SLC25A5;
UBB |
| hsa05016 | Huntington's
disease | NDUFA12; SLC25A5;
POLR2H |
| hsa05032 | Morphine
addiction | GNG2; GNG12;
PDE8B |
| hsa05034 | Alcoholism | H2AFY; HIST2H2AC;
GNG2; GNG12 |
| hsa05130 | Pathogenic
Escherichia coli infection | TUBA1B; ACTG1;
TUBA1A |
| hsa05152 | Tuberculosis | JAK1; HSPD1;
BCL10 |
| hsa05161 | Hepatitis B | JAK1; LAMTOR5 |
| hsa05164 | Influenza A | DNAJC3; JAK1;
ACTG1; KPNA2 |
| hsa05166 | HTLV–I
infection | JAK1; SLC25A5;
RANBP1; RRAS2; FZD7 |
| hsa05168 | Herpes simplex
infection | JAK1; ALYREF;
CLOCK |
| hsa05169 | Epstein-Barr virus
infection | JAK1; VIM; POLR2H;
AKAP8L |
| hsa05200 | Pathways in
cancer | CEBPA; TPR; JAK1;
HSP90B1; GNG2; GNG12; FZD7 |
| hsa05203 | Viral
carcinogenesis | JAK1; RANBP1 |
| hsa05205 | Proteoglycans in
cancer | PPP1R12C; ACTG1;
RRAS2; FZD7 |
| hsa05206 | MicroRNAs in
cancer | FSCN1; VIM |
| hsa05230 | Central carbon
metabolism in cancer | PGAM1; HK2 |
| hsa05322 | Systemic lupus
erythematosus | H2AFY;
HIST2H2AC |
| hsa05410 | Hypertrophic
cardiomyopathy (HCM) | ACTG1; PRKAB2 |
CEN
To describe relationships among DEGs clearly, the
SCC method was implemented to weight the strength between a pair of
genes, and those weighted interactions were input into Cytoscape
and visualized as the CEN for PE patients. A total of 351 nodes and
61,425 edges were deposited on the CEN, which suggested that all
DEGs were mapped to the network. The edge between KPNA2 and MAT2B
(weight=0.9986), FSTL3 and SKIDA1 (weight=0.9984), SSNA1 and PFDN6
(weight=0.9984) had higher weights than the other interactions.
Noteworthy, a good liner correlation was uncovered among weights.
Additionally, topological centrality analysis on nodes in the CEN
of PE was conducted by summing up the nodes it connected directly.
We found that the degree distribution for six nodes was not
<200, including RDH13 (degree=202), SELENOS (degree=201), PAPPA2
(degree=201), RASSF7 (degree=201), DNAJC3 (degree=200) and PPP1R12C
(degree=200).
Optimal pathways
Utilizing pathway annotation data, we identified
optimal pathways through gene function inference dependent on the
network-based GBA method. During this process, an MFS was produced
for each pathway. Importantly, we carried out 3-fold
cross-validation on MFS to calculate AUROC for pathways. The AUROC
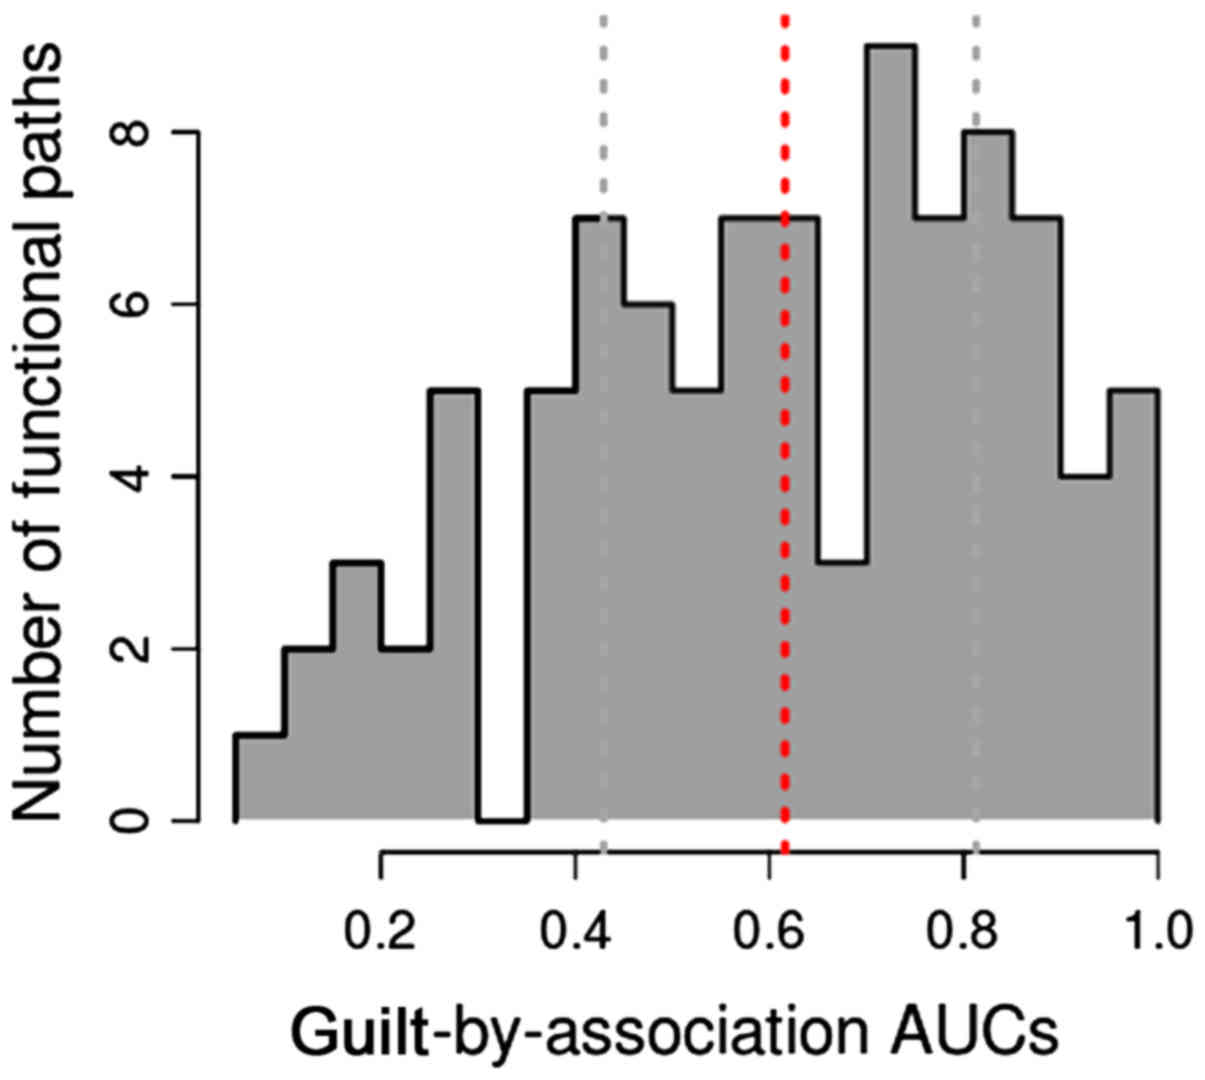
distribution among GO terms is illustrated in Fig. 1. We found that the AUROC for large
amount of pathways distributed to the section of 0.4–0.6 and
0.75–0.9. Accordingly, 53 pathways had AUROC >0.5. Furthermore,
9 of 53 pathways with AUROC >0.9 were denoted as optimal
pathways, specifically microRNAs in cancer (AUROC=0.9966), gap
junction (AUROC=0.9922), pathogenic Escherichia coli
infection (AUROC=0.9888), phagosome (AUROC=0.9881), ovarian
steroidogenesis (AUROC=0.9821), viral carcinogenesis
(AUROC=0.9642), MAPK signaling pathway (AUROC=0.9473), tuberculosis
(AUROC=0.9428), and tight junction (AUROC=0.9136).
Discussion
Our results showed that 53 pathways were provided
with a good classification performance with AUROC >0.5, 9 of
AUROC with >0.9 were defined as optimal pathways, which included
microRNAs in cancer, gap junction, pathogenic Escherichia
coli infection, phagosome, ovarian steroidogenesis, viral
carcinogenesis, MAPK signaling pathway, tuberculosis, and tight
junction.
We confirmed that the optimal pathway microRNAs in
cancer play a significant role in tumor issues, but the functions
for this pathway in PE patients has been reported (15). Furthermore, Bird et al focused
on pregnancy endothelial adaptive failure in PE (16). Gap junction implicated modulatory
intercellular communication during gestation in accordance with
regulation of vascular tone (17).
Hence gap junction was closely related to PE patients. Our results
showed that 53 pathways had a good classification performance with
AUROC >0.5, 9 of AUROC were >0.9 and defined as optimal
pathways, which included microRNAs in cancer, gap junction,
pathogenic Escherichia coli infection, phagosome, ovarian
steroidogenesis, viral carcinogenesis, MAPK signaling pathway,
tuberculosis, and tight junction.
BMP6 and HSD17B2 were enriched in ovarian
steroidogenesis pathway as one of optimal pathways. From previous
studies, hydroxysteroid (17-β) dehydrogenase 1, encoded by HSD17B1,
was found to be significantly decreased in PE patients and was
identified to be an independent risk factor for PE (18,19),
thus, it will be proposed as a potential prognostic factor for PE.
Additionally, MAPK signaling pathway has been paid increasing
attention by demonstrating it to participate in PE progression as a
crucial pathogenesis of PE (20–22).
In conclusion, 9 optimal pathways were disclosed for
PE patients by network-based GBA algorithm, which might shed new
lights on unraveling the molecular and pathological mechanism of
PE. However, validations of these pathways are still not covered,
and future studies should be focused on this aspect.
Acknowledgements
Not applicable.
Funding
No funding was received.
Availability of data and materials
The datasets used and/or analyzed during the current
study are available from the corresponding author on reasonable
request.
Authors' contributions
YR, YL and YPL conceived the study, analyzed the
data and drafted the manuscript. JZ, XW and WZ performed the
experiments, analyzed the data and revised the manuscript. All
authors read and approved the final manuscript.
Ethics approval and consent to
participate
Not applicable.
Patient consent for publication
Not applicable.
Competing interests
The authors declare that they have no competing
interests.
References
|
1
|
Maynard SE and Karumanchi SA: Angiogenic
factors and preeclampsia. Semin Nephrol. 31:33–46. 2011. View Article : Google Scholar : PubMed/NCBI
|
|
2
|
Steegers EA, von Dadelszen P, Duvekot JJ
and Pijnenborg R: Pre-eclampsia. Lancet. 376:631–644. 2010.
View Article : Google Scholar : PubMed/NCBI
|
|
3
|
Glazko GV and Emmert-Streib F: Unite and
conquer: Univariate and multivariate approaches for finding
differentially expressed gene sets. Bioinformatics. 25:2348–2354.
2009. View Article : Google Scholar : PubMed/NCBI
|
|
4
|
Irizarry RA, Bolstad BM, Collin F, Cope
LM, Hobbs B and Speed TP: Summaries of Affymetrix GeneChip probe
level data. Nucleic Acids Res. 31:e15. 2003. View Article : Google Scholar : PubMed/NCBI
|
|
5
|
Bolstad BM, Irizarry RA, Astrand M and
Speed TP: A comparison of normalization methods for high density
oligonucleotide array data based on variance and bias.
Bioinformatics. 19:185–193. 2003. View Article : Google Scholar : PubMed/NCBI
|
|
6
|
Miller JA, Menon V, Goldy J, Kaykas A, Lee
CK, Smith KA, Shen EH, Phillips JW, Lein ES and Hawrylycz MJ:
Improving reliability and absolute quantification of human brain
microarray data by filtering and scaling probes using RNA-Seq. BMC
Genomics. 15:1542014. View Article : Google Scholar : PubMed/NCBI
|
|
7
|
Ritchie ME, Phipson B, Wu D, Hu Y, Law CW,
Shi W and Smyth GK: Limma powers differential expression analyses
for RNA-sequencing and microarray studies. Nucleic Acids Res.
43:e472015. View Article : Google Scholar : PubMed/NCBI
|
|
8
|
Datta S, Satten GA, Benos DJ, Xia J,
Heslin MJ and Datta S: An empirical bayes adjustment to increase
the sensitivity of detecting differentially expressed genes in
microarray experiments. Bioinformatics. 20:235–242. 2004.
View Article : Google Scholar : PubMed/NCBI
|
|
9
|
Reiner A, Yekutieli D and Benjamini Y:
Identifying differentially expressed genes using false discovery
rate controlling procedures. Bioinformatics. 19:368–375. 2003.
View Article : Google Scholar : PubMed/NCBI
|
|
10
|
Szmidt E and Kacprzyk J: The Spearman rank
correlation coefficient between intuitionistic fuzzy sets. IEEE
International Conference on Intelligent Systems, Is 2010, 7–9 July
2010. University of Westminster. (London, UK). 276–280. 2010.
|
|
11
|
Qiu Y-Q: KEGG Pathway Database.
Encyclopedia of Systems Biology. Dubitzky W, Wolkenhauer O, Cho K-H
and Yokota H: Springer New York; New York, NY: pp. 1068–1069. 2013,
View Article : Google Scholar
|
|
12
|
Mostafavi S and Morris Q: Fast integration
of heterogeneous data sources for predicting gene function with
limited annotation. Bioinformatics. 26:1759–1765. 2010. View Article : Google Scholar : PubMed/NCBI
|
|
13
|
Gillis J and Pavlidis P: The impact of
multifunctional genes on ‘guilt by association’ analysis. PLoS One.
6:e172582011. View Article : Google Scholar : PubMed/NCBI
|
|
14
|
Huang J and Ling CX: Using AUC and
accuracy in evaluating learning algorithms. IEEE Trans Knowl Data
Eng. 17:299–310. 2005. View Article : Google Scholar
|
|
15
|
Laird DW: The gap junction proteome and
its relationship to disease. Trends Cell Biol. 20:92–101. 2010.
View Article : Google Scholar : PubMed/NCBI
|
|
16
|
Bird IM, Boeldt DS, Krupp J, Grummer MA,
Yi FX and Magness RR: Pregnancy, programming and preeclampsia: Gap
junctions at the nexus of pregnancy-induced adaptation of
endothelial function and endothelial adaptive failure in PE. Curr
Vasc Pharmacol. 11:712–729. 2013. View Article : Google Scholar : PubMed/NCBI
|
|
17
|
Ampey BC, Morschauser TJ, Lampe PD and
Magness RR: Gap junction regulation of vascular tone: Implications
of modulatory intercellular communication during gestation. Adv Exp
Med Biol. 814:117–132. 2014. View Article : Google Scholar : PubMed/NCBI
|
|
18
|
Ishibashi O, Ohkuchi A, Ali MM, Kurashina
R, Luo SS, Ishikawa T, Takizawa T, Hirashima C, Takahashi K, Migita
M, et al: Hydroxysteroid (17-β) dehydrogenase 1 is dysregulated by
miR-210 and miR-518c that are aberrantly expressed in preeclamptic
placentas: A novel marker for predicting preeclampsia.
Hypertension. 59:265–273. 2012. View Article : Google Scholar : PubMed/NCBI
|
|
19
|
Ohkuchi A, Ishibashi O, Hirashima C,
Takahashi K, Matsubara S, Takizawa T and Suzuki M: Plasma level of
hydroxysteroid (17-β) dehydrogenase 1 in the second trimester is an
independent risk factor for predicting preeclampsia after adjusting
for the effects of mean blood pressure, bilateral notching and
plasma level of soluble fms-like tyrosine kinase 1/placental growth
factor ratio. Hypertens Res. 35:1152–1158. 2012. View Article : Google Scholar : PubMed/NCBI
|
|
20
|
Li FH, Han N, Wang Y and Xu Q: Gadd45a
knockdown alleviates oxidative stress through suppressing the p38
MAPK signaling pathway in the pathogenesis of preeclampsia.
Placenta. 65:20–28. 2018. View Article : Google Scholar : PubMed/NCBI
|
|
21
|
Jiang J and Zhao ZM: LncRNA HOXD-AS1
promotes preeclampsia progression via MAPK pathway. Eur Rev Med
Pharmacol Sci. 22:8561–8568. 2018.PubMed/NCBI
|
|
22
|
D'Oria R, Laviola L, Giorgino F, Unfer V,
Bettocchi S and Scioscia M: PKB/Akt and MAPK/ERK phosphorylation is
highly induced by inositols: Novel potential insights in
endothelial dysfunction in preeclampsia. Pregnancy Hypertens.
10:107–112. 2017. View Article : Google Scholar : PubMed/NCBI
|