Introduction
Tuberculosis (TB) is a global infectious disease
caused by infection with the pathogen Mycobacterium
tuberculosis (MTB) and poses a serious risk to human health. It
is a contagious disease that spreads by inhalation of bacteria
contained in the breath of an infected individual. China ranks
second out of the countries with a high TB burden. According to the
2017 World Health Organization (WHO) global TB report (1), TB is the ninth most lethal disease in
the world and ranks first among infectious diseases, with a
mortality rate much higher than that of acquired immune deficiency
syndrome. Latent TB infection (LTBI) is defined as a state of
persistent immune response to stimulation by MTB antigens with no
evidence of any clinical manifestations of active TB (2). Within the population of individuals
with LTBI, most cases remain asymptomatic and are not contagious;
however, 5–10% of those who are infected progress to active TB
disease and become contagious (2,3). LTBI is
a continuum between self-healed and asymptomatic (4). At present, there are no unified
diagnostic criteria for LTBI. The current method used is the
tuberculin skin test (TST) and interferon-γ release assay (IGRA),
however both have certain limitations, which include poor
specificity and high cost of diagnosis, as well as being complex
techniques (5–8). At present, the WHO recommends the use
of the IGRA to detect LTBI in middle- and high-income countries
with greater resources (9), while
the TST is recommended in countries with limited resources.
Therefore, it is necessary to develop a rapid, low-cost,
non-invasive and efficient diagnostic method for the prevention and
control of TB.
MicroRNAs (miRs) are a class of non-coding RNAs
composed of 21–23 nucleotides, which are not translated into
proteins. They are cut from precursor miRs with 6,070 nucleotides
and a hairpin structure. The major function of miRs is to regulate
gene expression at the post-transcriptional level, primarily by
binding to the 3′-untranslated region of the mRNAs of their target
genes to degrade the mRNA or inhibit its translation, thus
inhibiting the expression of the target genes (10). When disease occurs, the specific miRs
of the lesion organs may be released into the blood. In numerous
diseases, the miR content in the blood is significantly different
from that of healthy individuals (11). To date, miRs as molecular diagnostic
markers have been studied and applied in cancer, diabetes,
psychiatric disorders, heart disease and various infectious
diseases (12–16). More recent evidence suggests the use
of miRs as biomarkers for LTBI. However, compared with the
well-known role of certain miRs in cancer, the biological functions
and diagnostic utility of miRs in LTBI remain largely elusive. Wu
et al (17) identified that
the expression of Homo sapiens (hsa)-miR-142-3p and
hsa-miR-21-5p was enhanced in the peripheral blood samples from
patients with LTBI compared with patients with TB. Meng et
al (18) indicated that
miR-93-3p is a potential diagnostic marker for distinguishing LTBI
from active TB. Using bioinformatics to further analyze gene
expression data, the present study unveiled certain characteristics
and mechanisms involved in TB latency, which may provide a
theoretical basis for the early diagnosis and treatment of, and
experimental research into TB (19),
and may serve as a reference for further investigation of molecular
events indicative of LTBI.
In previous decades, microarray analysis has been
frequently used to identify candidate biomarkers and therapeutic
targets by studying changes in non-coding RNA and gene expression
profiles at a genome-wide scale (20). A previous study on diagnosing latent
TB infection identified dysregulated miRs and associated pathways
of LTBI (21). However, only a small
number of miRs have been identified to be significantly
differentially expressed between patients with and without LTBI.
Due to these discordant results, the reliability of these data for
further development into useful clinical diagnostic biomarkers and
therapeutic targets for TB is limited. It has been well recognized
that small sample sizes, different microarray platforms and
different statistical methods are among the limiting factors
contributing to the discordant results. To overcome this
limitation, meta-analysis represents a powerful approach to combine
datasets from different studies to improve the reliability and
generalizability of the results by increasing the statistical
power. Meta-analysis of gene expression data or non-coding RNA
profiles has yielded novel biological insight, and has identified
more robust and reliable candidate biomarkers and therapeutic
targets.
In the present study, to increase the understanding
of latent TB infection, the GSE25435 and GSE29190 datasets were
downloaded from the GEO database and analyzed using R tools for
differentially expressed miRs (DEMs). The regulatory network of
these DEMs and their target genes was constructed to explore the
potential regulatory interactions involved in LTBI. Enrichment
analysis of these target genes in Gene Ontology (GO) terms in the
category biological process (BP), molecular function (MF), cellular
component (CC) and Kyoto Encyclopedia of Genes and Genomes (KEGG)
pathways was performed for further identification of
LTBI-associated pathways and molecular mechanisms.
Materials and methods
Selection of microarray datasets
To retrieve suitable LTBI-associated miR profiling
data for the meta-analysis, a web-based search in the Gene
Expression Omnibus database (GEO; http://www.ncbi.nlm.nih.gov/geo) and ArrayExpress
(http://www.ebi.ac.uk/arrayexpress)
database was performed using the key words ‘latent TB infection’
and ‘microRNA’. In total, 5 array datasets were identified in the
GEO and ArrayExpress databases. The datasets were manually reviewed
and only those fulfilling the following criteria were included for
further analysis: i) miR expression profiling by array; and ii)
paired samples from patients with and without LTBI. Finally, a
total of 2 datasets, GSE25435 and GSE29190, were selected for
analysis. miR expression data of peripheral blood mononuclear cells
(PBMCs) from 6 donors with LTBI and 3 healthy controls are included
in GSE29190. GSE25435 contains miR expression data from PBMCs of 3
donors with LTBI and 3 healthy controls.
Screening of DEMs
The 2 datasets were analyzed individually by using
the Bioconductor package to screen the DEMs with specific cut-off
criteria [P<0.01 and |log fold change (FC)|≥1] (22). Paired samples t-tests and the FC
method were used to obtain DEMs. The DEMs of the 2 datasets were
then uploaded to the online VENN tool (http://bioinformatics.psb.ugent.be/webtools/Venn/) to
identify the overlapping miRs (23).
Target gene prediction and network
construction
The prediction of target genes of different miRs was
performed by using TargetScan (http://www.targetscan.org/vert_71) (24). A cumulative weighted context++ score
online >-0.5 was set as the standard for screening target genes,
as previously described (24). The
target genes were then uploaded to the online database Search Tool
for the Retrieval of Interacting Genes and Proteins (STRING;
string-db.org) (25) to obtain the interaction information
for these target genes. The miR targeting data and target gene
interaction data were imported to Cytoscape, which was used to
visualize and merge networks. The key factors were finally selected
based on their DC (26,27).
GO and KEGG pathway analysis
Pathway enrichment analysis was performed using
KEGG, a collection of databases on genomes, biological pathways,
diseases, drugs and chemical substances (28). Target genes identified in the
abovementioned analysis were uploaded to GENCLIP (ci.smu.edu.cn/GenCLiP2/analysis.php) to
perform the GO enrichment analysis in the categories BP, CC and MF,
and P<0.01 was set as the cut-off criterion (29).
Results
Individual microarray data analysis of
DEMs
To identify DEMs in patients with LTBI vs. healthy
individuals, P<0.01 and |logFC|≥1 were set as cut-off criteria
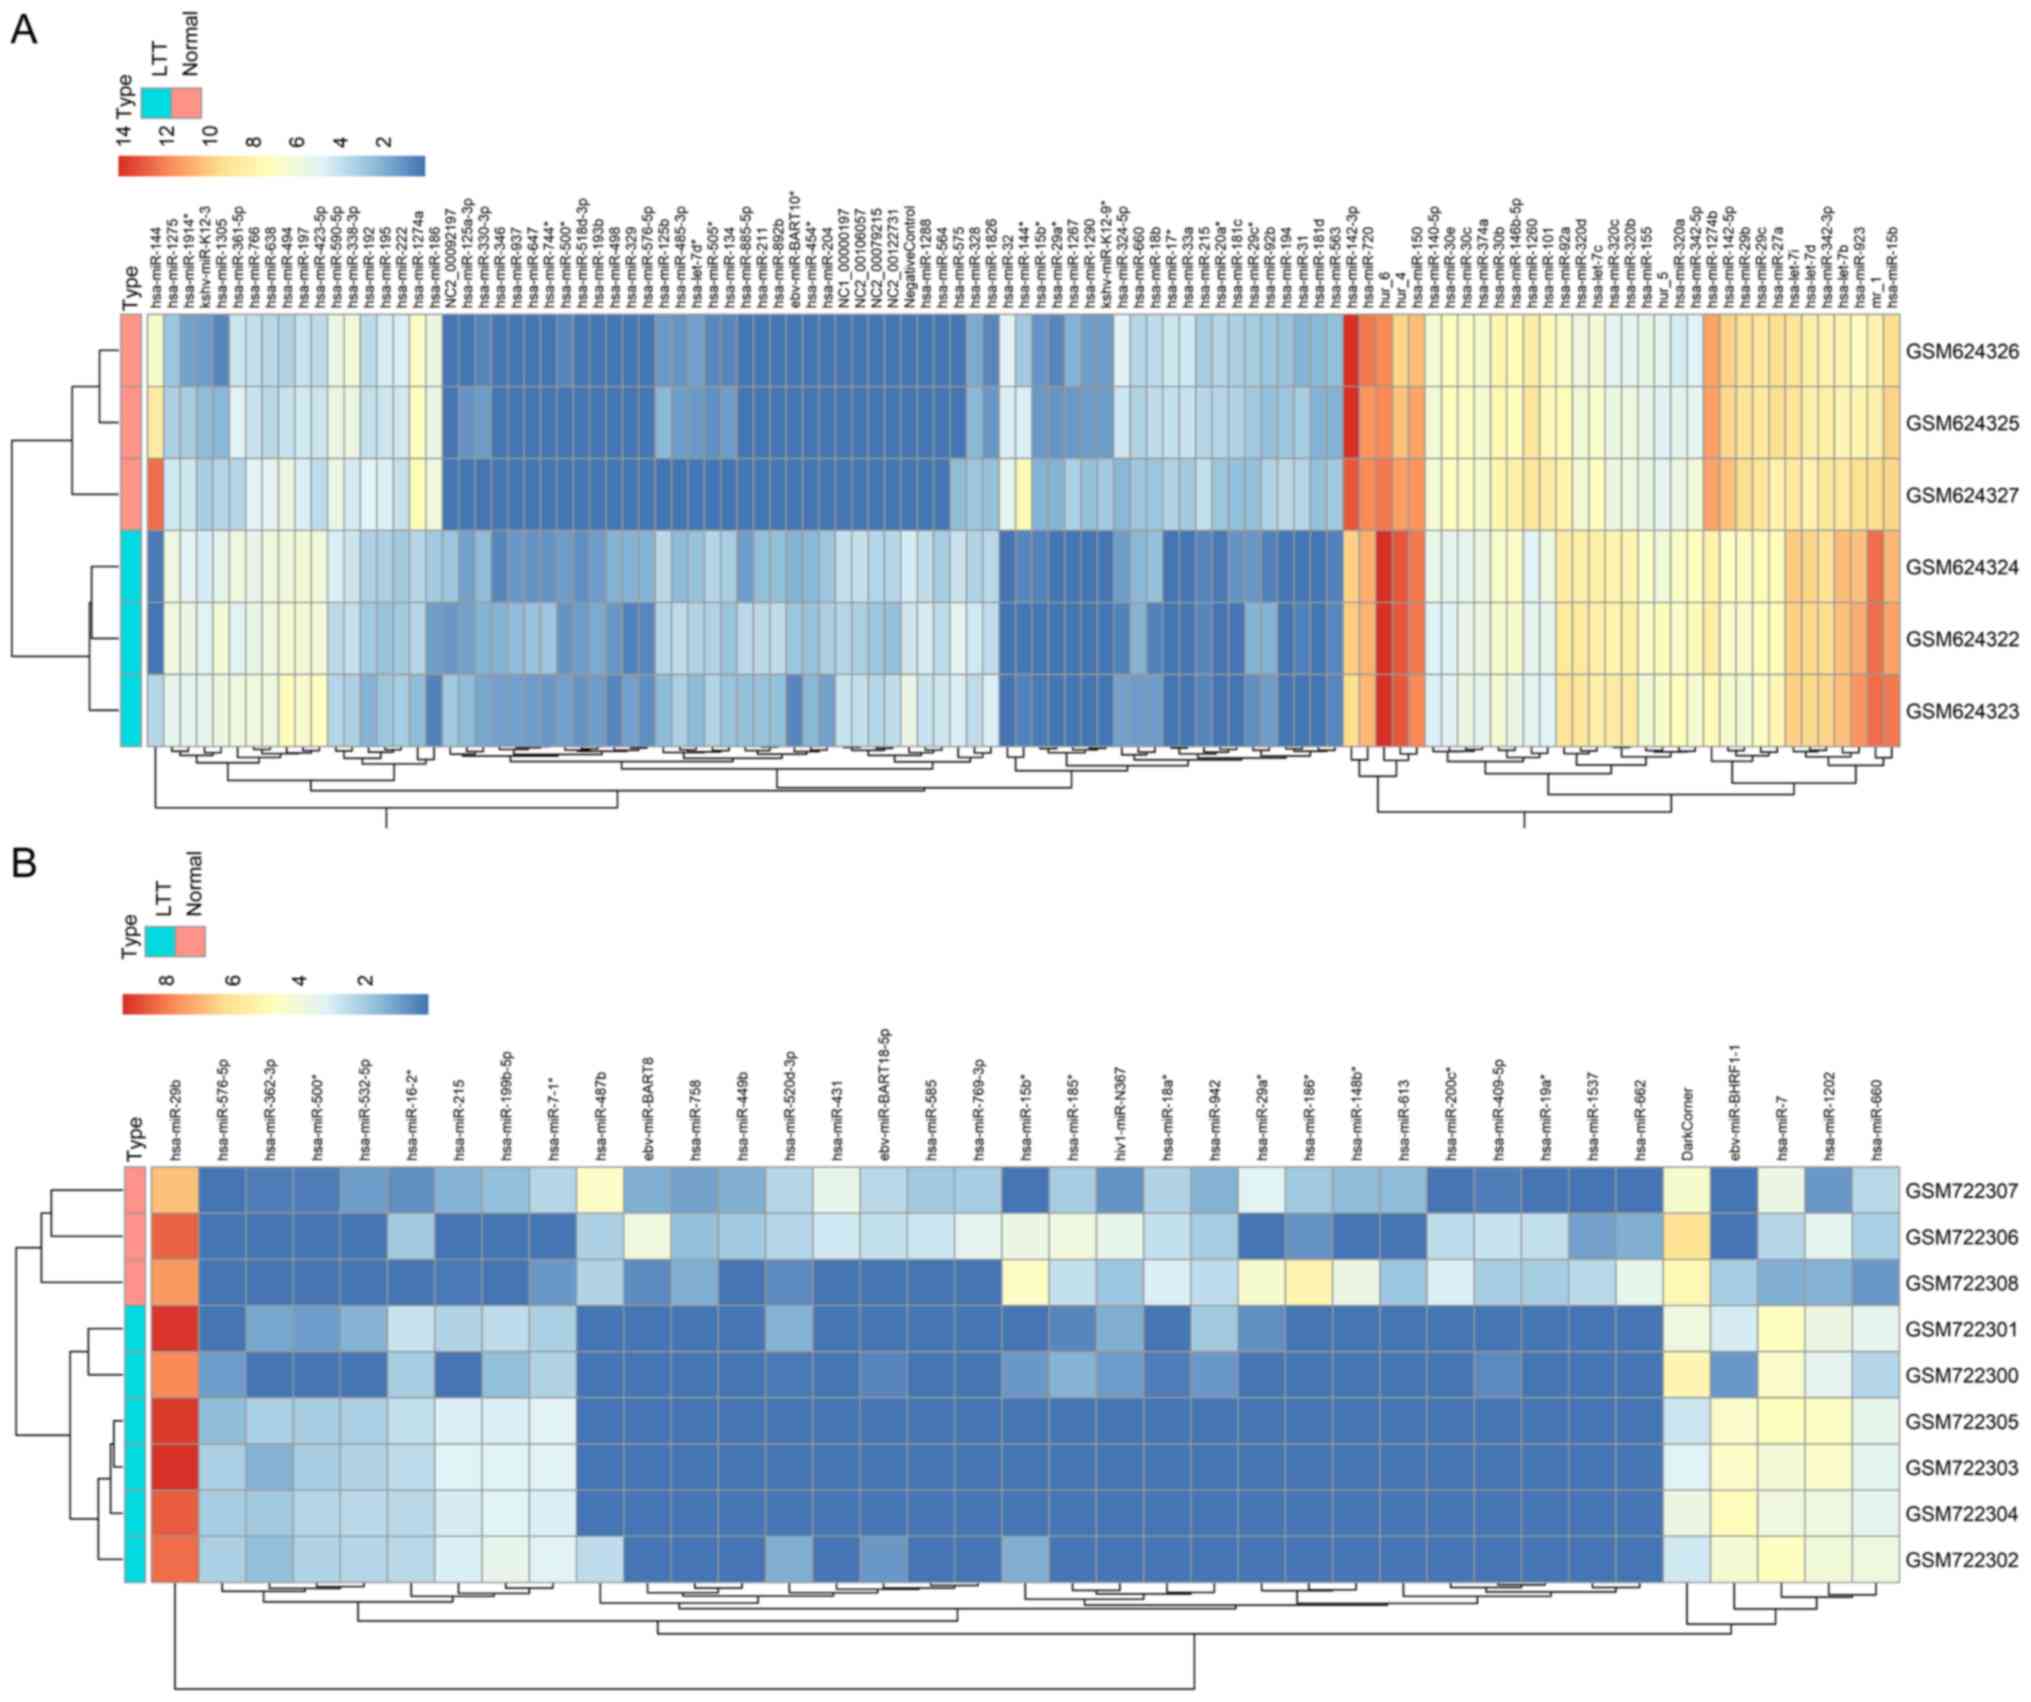
when screening the miR array profiles. A total of 107 miRs,
including 44 downregulated and 63 upregulated miRs, were identified
to be dysregulated in the GSE25435 dataset (Table I). The GSE29190 dataset was also
analyzed, revealing only 37 DEMs, including 24 downregulated and 13
upregulated miRs (Table II). The
clustering heatmap analysis of these two datasets indicated a
highly significant difference between LTBI and normal patients,
meriting further analysis (Fig.
1).
 | Table I.Differentially expressed miRs in the
GSE25435 dataset. |
Table I.
Differentially expressed miRs in the
GSE25435 dataset.
| miR | logFC | AveExpr | t | P-value |
|---|
| hsa-miR-32 | −4.83703 | 2.490441 | −32.8327 | 2.86
×10−6 |
| hsa-let-7d | 1.605658 | 8.870986 | 25.95471 | 7.72
×10−6 |
| hsa-miR-1260 | −3.67093 | 6.940923 | −21.9504 | 1.56
×10−5 |
| hsa-miR-181d | −2.24959 | 1.176625 | −21.3805 | 1.75
×10−5 |
| NC1_00000197 | 3.79419 | 1.948923 | 21.37752 | 1.75
×10−5 |
| hsa-miR-1288 | 4.12176 | 2.112708 | 20.71065 | 2.00
×10−5 |
| hur_6 | 2.153942 | 13.10695 | 19.77886 | 2.43
×10−5 |
| NC2_00079215 | 3.222861 | 1.663258 | 15.16582 | 7.39
×10−5 |
| hsa-miR-17* | −3.75792 | 1.930786 | −14.9806 | 7.78
×10−5 |
| NC2_00106057 | 3.685307 | 1.894481 | 14.56989 | 8.74
×10−5 |
| hsa-miR-142-5p | −3.15876 | 8.353603 | −14.0788 | 0.000101 |
| hsa-let-7i | 1.002891 | 9.400425 | 13.92367 | 0.000106 |
| hsa-miR-30e | −2.12857 | 6.050006 | −13.8563 | 0.000108 |
| hsa-miR-30b | −1.24457 | 7.124084 | −13.295 | 0.000128 |
| hsa-miR-454* | 2.311672 | 1.207664 | 12.96173 | 0.000142 |
| hsa-miR-1274b | −3.22595 | 9.539236 | −12.8303 | 0.000148 |
| hsa-miR-20a* | −3.09852 | 1.688503 | −12.5566 | 0.000162 |
| hsa-miR-564 | 3.682902 | 1.893279 | 11.84041 | 0.000207 |
| hsa-miR-30c | −1.47533 | 6.141081 | −11.4563 | 0.000237 |
|
hsa-miR-518d-3p | 1.098449 | 0.601052 | 11.36622 | 0.000245 |
| hsa-miR-142-3p | −4.08985 | 11.79739 | −11.1118 | 0.000269 |
| hsa-miR-215 | −2.79467 | 2.085103 | −10.6335 | 0.000323 |
| hsa-miR-320c | 2.710049 | 6.808952 | 10.40018 | 0.000353 |
| hsa-miR-29b | −2.6684 | 7.916884 | −10.2334 | 0.000378 |
| hsa-miR-193b | 1.481897 | 0.792776 | 10.23095 | 0.000378 |
| hsa-miR-505* | 2.825782 | 2.002488 | 10.08595 | 0.000401 |
| hsa-miR-1274a | −3.96165 | 5.117785 | −10.0041 | 0.000415 |
| hsa-miR-320d | 2.530531 | 7.386848 | 9.966743 | 0.000421 |
| hsa-miR-194 | −2.9415 | 1.573092 | −9.87762 | 0.000437 |
| mr_1 | 4.009616 | 10.57346 | 9.598379 | 0.000491 |
| hsa-miR-197 | 1.865861 | 5.328528 | 9.377518 | 0.00054 |
| hsa-miR-33a | −3.71272 | 1.90819 | −8.53538 | 0.000792 |
| hsa-miR-374a | −1.05367 | 5.99272 | −8.48323 | 0.000812 |
| hsa-miR-320b | 2.595755 | 6.879281 | 8.346227 | 0.000867 |
| hsa-miR-211 | 2.928911 | 1.516283 | 8.276387 | 0.000897 |
| NC2_00122731 | 3.230483 | 1.667069 | 8.074902 | 0.000990 |
| hsa-miR-29c | −1.60822 | 8.001147 | −7.87047 | 0.001098 |
| hsa-miR-195 | −1.58473 | 3.691033 | −7.80122 | 0.001138 |
| hsa-let-7b | 2.253171 | 9.216569 | 7.57616 | 0.001279 |
| hsa-miR-563 | −1.93468 | 1.56909 | −7.14915 | 0.001612 |
| hsa-miR-140-5p | −1.35331 | 5.635543 | −7.11292 | 0.001645 |
| hsa-miR-423-5p | 2.546925 | 5.162408 | 7.075481 | 0.001679 |
| hsa-miR-892b | 2.908221 | 1.505938 | 6.779481 | 0.001988 |
| hsa-let-7c | 1.591322 | 7.493733 | 6.714825 | 0.002065 |
| hsa-miR-181c | −2.61189 | 1.740467 | −6.71423 | 0.002066 |
| hsa-miR-31 | −2.69031 | 1.538948 | −6.55738 | 0.002267 |
| hur_4 | 2.724996 | 11.79659 | 6.333833 | 0.002596 |
| hsa-miR-155 | 1.135612 | 6.034357 | 6.210813 | 0.002802 |
| hsa-miR-720 | −1.17258 | 11.34608 | −5.89947 | 0.003420 |
| hsa-miR-222 | −1.33272 | 3.65274 | −5.83189 | 0.003575 |
| hsa-miR-186 | −4.09024 | 3.67533 | −5.76641 | 0.003734 |
| hsa-miR-101 | −2.5019 | 6.584804 | −5.69109 | 0.003927 |
| hsa-miR-204 | 2.505782 | 1.304719 | 5.150187 | 0.005734 |
| hsa-miR-134 | 2.026807 | 1.755041 | 4.931725 | 0.006741 |
| hsa-miR-1290 | −1.70206 | 0.902855 | −4.8857 | 0.006979 |
| hsa-miR-575 | 3.799179 | 2.716106 | 4.762392 | 0.007670 |
| hsa-miR-937 | 1.689168 | 0.896412 | 4.735594 | 0.007830 |
| hsa-miR-320a | 1.789151 | 6.023945 | 4.670974 | 0.008235 |
| hsa-miR-590-5p | −1.58344 | 4.687364 | −4.6666 | 0.008263 |
| hsa-miR-1275 | 2.152322 | 4.508394 | 4.391423 | 0.010302 |
| NC2_00092197 | 2.244662 | 1.174159 | 4.37517 | 0.010440 |
| hsa-miR-500* | 1.085714 | 0.806853 | 4.324164 | 0.010888 |
| hur_5 | 1.581846 | 5.898678 | 4.300761 | 0.011102 |
| hsa-miR-766 | 1.2936 | 4.933253 | 4.282655 | 0.011270 |
| hsa-miR-1305 | 3.51088 | 3.923818 | 4.184017 | 0.012244 |
| hsa-miR-485-3p | 2.264246 | 1.974846 | 4.137144 | 0.012742 |
| hsa-miR-29c* | −1.41527 | 2.134653 | −4.08565 | 0.013317 |
| hsa-miR-328 | 1.533516 | 3.063469 | 4.035669 | 0.013904 |
| hsa-miR-1826 | 2.542979 | 2.772236 | 4.009905 | 0.014219 |
| hsa-miR-923 | 2.864446 | 9.516405 | 3.979143 | 0.014606 |
| hsa-miR-92a | 1.491981 | 8.018584 | 3.940985 | 0.015104 |
| hsa-miR-1267 | −2.09638 | 1.132907 | −3.91896 | 0.015401 |
| hsa-miR-885-5p | 2.463596 | 1.283626 | 3.881055 | 0.015927 |
| hsa-miR-144 | −7.93309 | 5.22873 | −3.85587 | 0.016289 |
| hsa-miR-660 | −1.32829 | 2.555425 | −3.75816 | 0.017787 |
| hsa-let-7d* | 1.904947 | 1.863162 | 3.758015 | 0.017790 |
| hsa-miR-647 | 1.663436 | 0.883546 | 3.748012 | 0.017952 |
| hsa-miR-342-3p | 1.119628 | 8.920874 | 3.645006 | 0.019731 |
| hsa-miR-15b* | −1.18389 | 0.868758 | −3.5706 | 0.021146 |
| hsa-miR-144* | −4.64489 | 2.712225 | −3.53154 | 0.021937 |
|
kshv-miR-K12-9* | −1.76769 | 1.026389 | −3.48719 | 0.022877 |
| hsa-miR-15b | 1.65062 | 10.49454 | 3.437951 | 0.023976 |
| hsa-miR-638 | 1.600023 | 4.980986 | 3.434029 | 0.024066 |
| hsa-miR-744* | 1.677503 | 0.890579 | 3.371348 | 0.025564 |
| hsa-miR-346 | 1.392836 | 0.748246 | 3.330718 | 0.026593 |
| hsa-miR-324-5p | −2.61219 | 2.446374 | −3.28872 | 0.027707 |
| hsa-miR-498 | 1.277597 | 0.690626 | 3.285391 | 0.027798 |
| hsa-miR-329 | 1.335942 | 0.719799 | 3.261694 | 0.028454 |
|
hsa-miR-125a-3p | 1.424537 | 1.12041 | 3.210039 | 0.029946 |
| hsa-miR-192 | −1.44406 | 3.520292 | −3.20944 | 0.029964 |
| hsa-miR-18b | −1.96872 | 2.472096 | −3.1976 | 0.030319 |
| hsa-miR-27a | −1.44475 | 8.246285 | −3.19705 | 0.030335 |
| hsa-miR-92b | −1.58151 | 2.150902 | −3.18198 | 0.030795 |
| hsa-miR-150 | 1.084065 | 11.60013 | 3.12891 | 0.032478 |
| hsa-miR-342-5p | 1.584302 | 6.234256 | 3.120644 | 0.032750 |
| hsa-miR-29a* | −1.22069 | 0.662175 | −3.08183 | 0.034061 |
| hsa-miR-576-5p | 1.233511 | 0.668583 | 3.056434 | 0.034952 |
|
ebv-miR-BART10* | 1.833523 | 0.968589 | 3.013552 | 0.036519 |
| hsa-miR-1914* | 2.359262 | 4.149506 | 2.986318 | 0.037556 |
| hsa-miR-330-3p | 1.331046 | 1.394026 | 2.970476 | 0.038175 |
| hsa-miR-494 | 2.245492 | 5.43426 | 2.961052 | 0.038548 |
| hsa-miR-361-5p | 1.350614 | 4.881747 | 2.92993 | 0.039813 |
| hsa-miR-125b | 2.025984 | 2.170862 | 2.884837 | 0.041731 |
| hsa-miR-338-3p | −1.63845 | 4.620754 | −2.78552 | 0.046342 |
|
hsa-miR-146b-5p | −1.29146 | 6.920841 | −2.75528 | 0.047860 |
| Table II.Differentially expressed miRs in the
dataset GSE29190. |
Table II.
Differentially expressed miRs in the
dataset GSE29190.
| miR | logFC | AveExpr | t | P-value |
|---|
| hsa-miR-18a* | −2.51535 | 0.9441 | −15.4559 |
6.85×10⁻⁷ |
| hsa-miR-758 | −1.24903 | 0.487935 | −10.0342 |
1.46×10⁻⁵ |
| hsa-miR-185* | −2.498 | 1.185303 | −5.30749 | 0.000938 |
|
hsa-miR-199b-5p | 2.216376 | 2.08776 | 4.343231 | 0.002984 |
| hsa-miR-16-2* | 1.558178 | 1.935857 | 4.180525 | 0.003676 |
| hsa-miR-1202 | 2.150841 | 3.293889 | 4.041271 | 0.004408 |
| hsa-miR-7 | 1.917814 | 3.758687 | 3.950336 | 0.004971 |
| hsa-miR-660 | 1.536002 | 2.837873 | 3.529016 | 0.008814 |
| hsa-miR-7-1* | 1.79193 | 2.285376 | 3.46859 | 0.009588 |
| hsa-miR-487b | −2.48633 | 1.308742 | −3.28236 | 0.012470 |
| hsa-miR-409-5p | −1.5458 | 0.669419 | −3.22662 | 0.013503 |
| hsa-miR-200c* | −1.80803 | 0.674268 | −3.12735 | 0.015573 |
| hsa-miR-613 | −1.11381 | 0.442862 | −3.11342 | 0.015889 |
| hsa-miR-431 | −2.10028 | 0.771685 | −3.09273 | 0.016372 |
| hsa-miR-19a* | −1.48092 | 0.565233 | −3.06806 | 0.016968 |
| hsa-miR-186* | −2.5773 | 0.930693 | −3.04035 | 0.017664 |
| ebv-miR-BART8 | −1.86635 | 0.693708 | −2.98042 | 0.019276 |
| hsa-miR-585 | −1.52776 | 0.594644 | −2.97825 | 0.019337 |
|
ebv-miR-BHRF1-1 | 2.864032 | 2.647555 | 2.977097 | 0.019370 |
| hsa-miR-576-5p | 1.428135 | 1.023683 | 2.942374 | 0.020379 |
| hsa-miR-942 | −1.45888 | 1.013753 | −2.92631 | 0.020864 |
| hsa-miR-449b | −1.03809 | 0.422371 | −2.90996 | 0.021370 |
| hsa-miR-29a* | −2.36068 | 0.96128 | −2.89317 | 0.021904 |
| hsa-miR-769-3p | −1.81466 | 0.676479 | −2.87074 | 0.022639 |
| hsa-miR-362-3p | 1.258509 | 0.984151 | 2.859353 | 0.023021 |
| hsa-miR-500* | 1.483617 | 1.126051 | 2.787552 | 0.025596 |
| hiv1-miR-N367 | −1.63534 | 0.967286 | −2.70054 | 0.029123 |
|
ebv-miR-BART18-5p | −1.43074 | 0.748889 | −2.57279 | 0.035240 |
| hsa-miR-148b* | −1.72537 | 0.646717 | −2.55501 | 0.036190 |
| hsa-miR-532-5p | 1.417317 | 1.319251 | 2.552325 | 0.036336 |
| hsa-miR-15b* | −2.3785 | 1.211755 | −2.54192 | 0.036907 |
| hsa-miR-1537 | −1.0943 | 0.436358 | −2.5317 | 0.037477 |
| hsa-miR-215 | 1.887456 | 1.812279 | 2.514436 | 0.038460 |
| hsa-miR-662 | −1.57886 | 0.59788 | −2.4756 | 0.040769 |
| hsa-miR-29b | 1.103322 | 8.302687 | 2.406804 | 0.045214 |
|
hsa-miR-520d-3p | −1.23035 | 0.943423 | −2.34466 | 0.049651 |
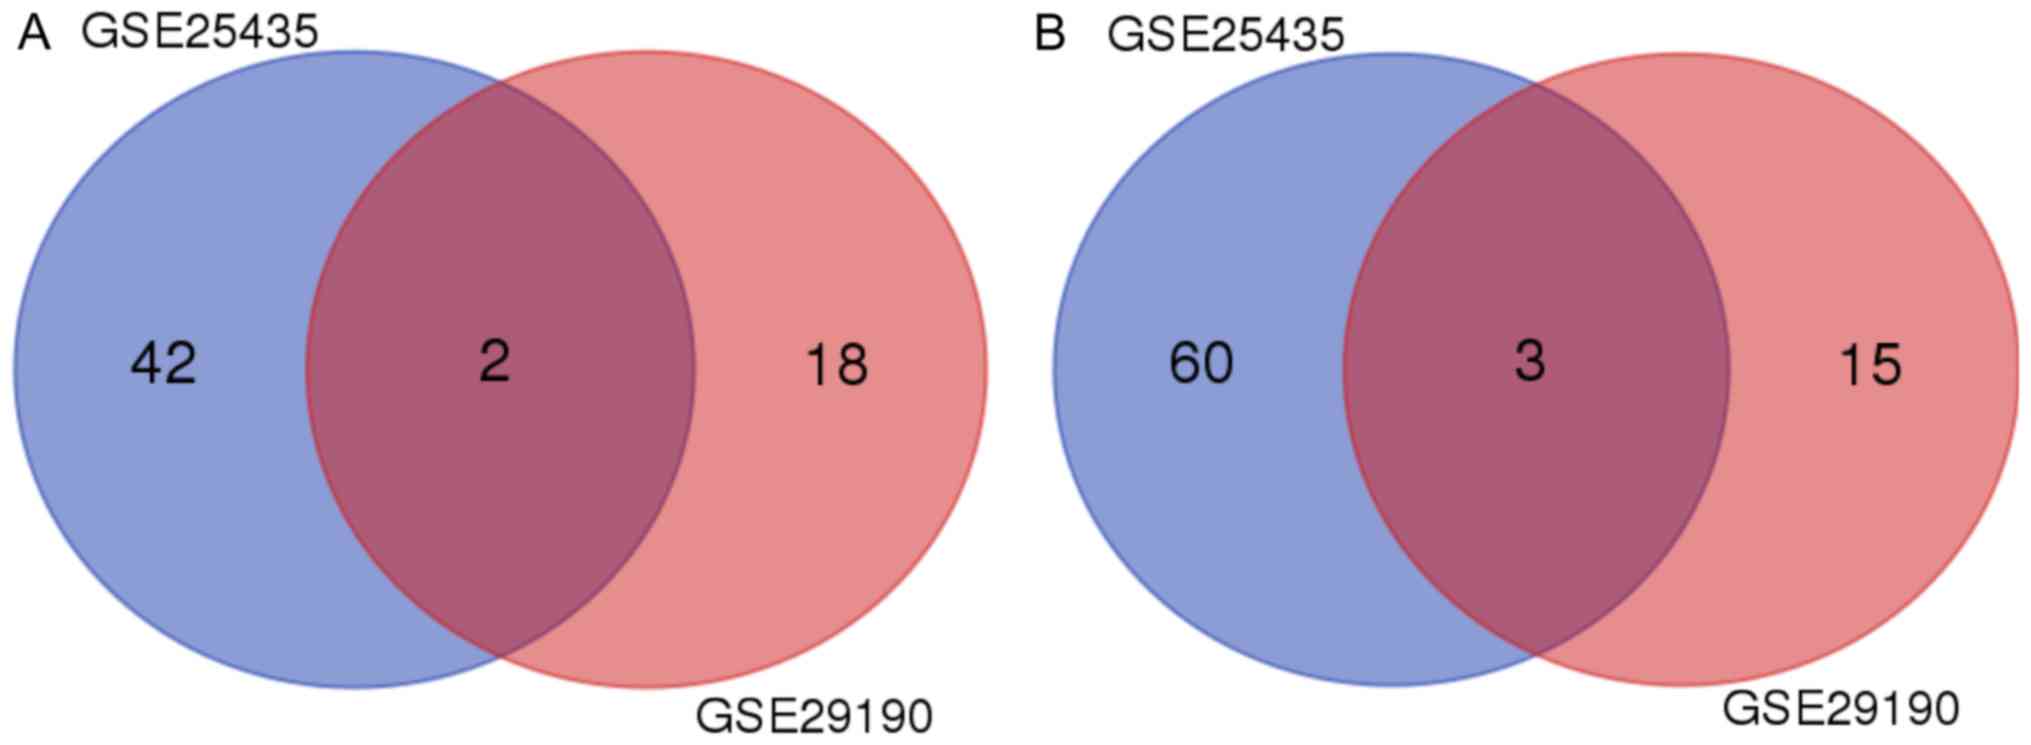
Meta-analysis of the dysregulated miRs
provides 5 hub miRs
Due to the limitations of the analyses of the
individual datasets, the overlapping miRs between the two datasets
were selected for the analysis of hub miRs. By Venn diagram
analysis, hsa-miR-29a and hsa-miR-15b were identified as being
downregulated in the two datasets (Fig.
2A), while hsa-miR-576-5p, hsa-miR-500 and hsa-miR-155 were
identified as being upregulated (Fig.
2B).
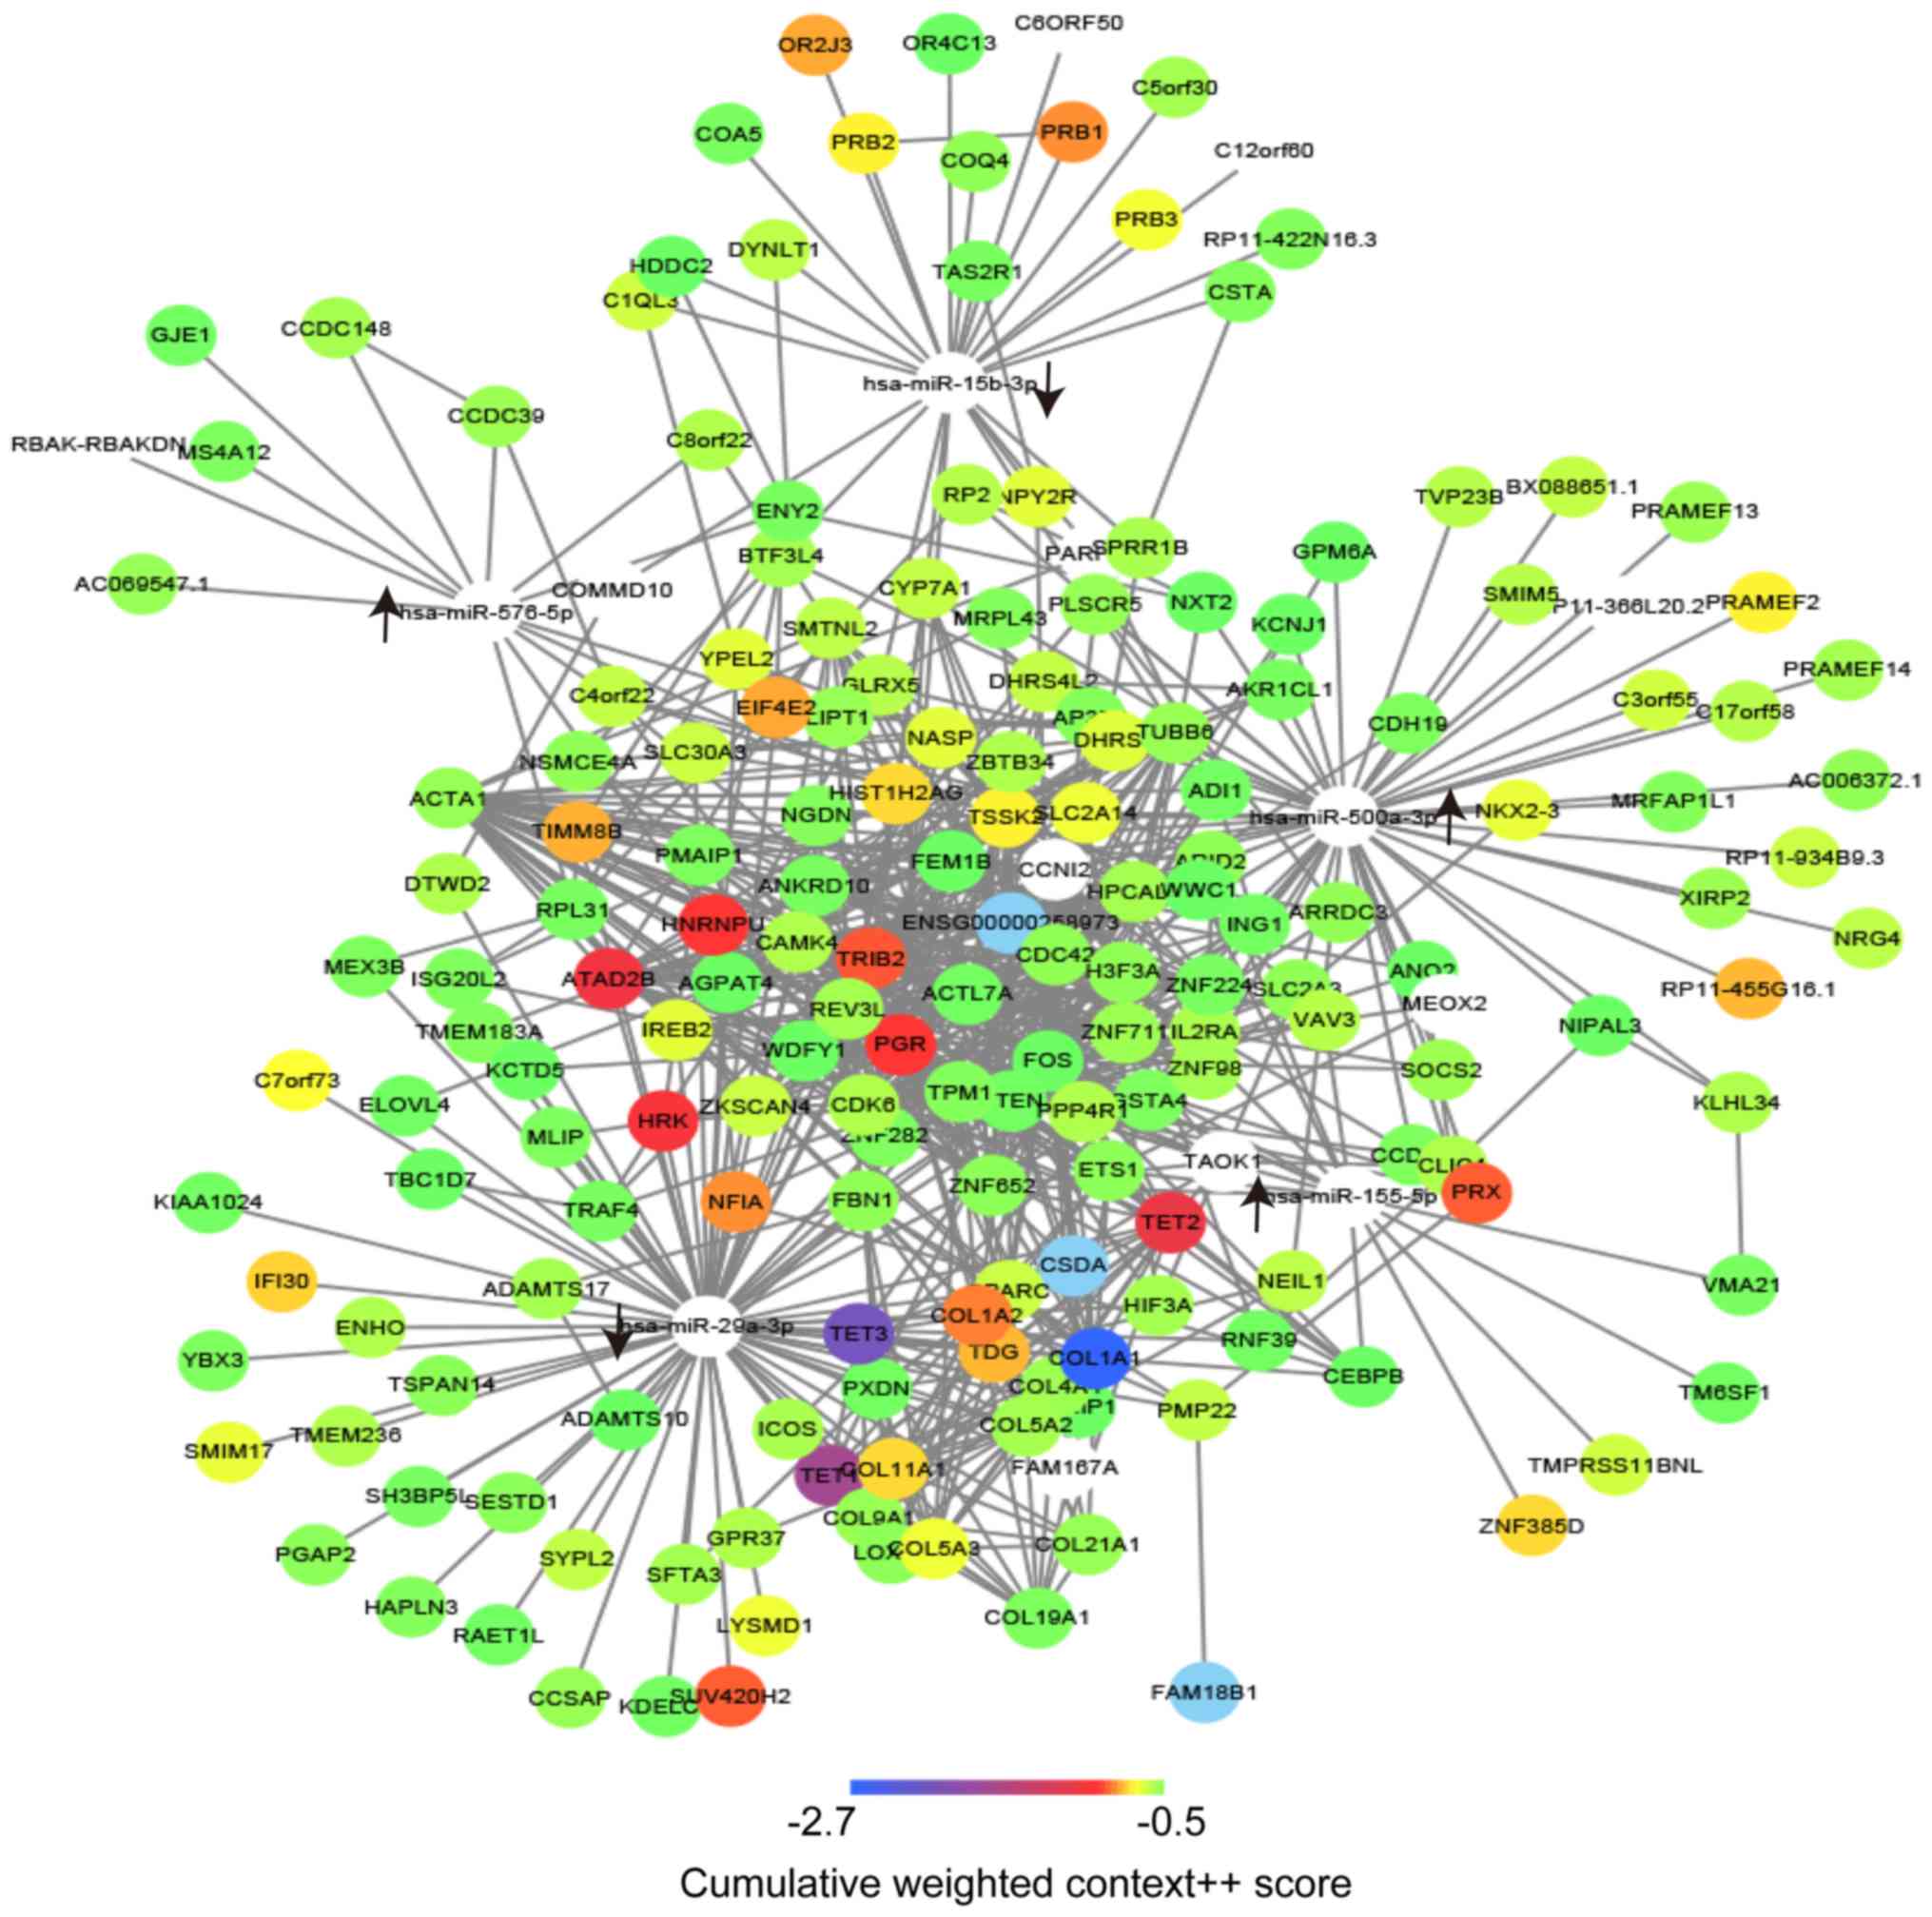
Construction of the molecular network
provides complex regulatory interactions
The target genes of the abovementioned miRs were
assessed using the online tool Targetscan with a pre-defined
standard. A total of 216 potential target genes were identified in
the present analysis and they are listed in Table III. To illustrated the direct
regulatory associations between the hub miRs and their target
genes, as well as interactions of these target genes, the network
of these factors was constructed using Cytoscape. A complex
regulatory network was obtained, suggesting that dysregulation of
miRs during LTBI may cause a widespread dysregulation in gene
expression. In addition, dysregulation of miRs during LTBI may lead
to functional disorders via signaling pathways or BPs. By exploring
the regulatory network, the key miRs and genes may be selected
based on the DC in the network. A total of 2 miRs, namely
hsa-miR-500a-3p (degree, 54) and hsa-miR-29a-3p (degree, 77), as
well as 4 genes, namely cell division cycle (CDC)42 (degree, 21),
actin α1, skeletal muscle (ACTA1; degree, 21), phosphatase and
tensin homolog (PTEN; degree, 21) and FOS (degree, 21), were
selected as the core factors that may have principal roles in LTBI
(Fig. 3).
| Table III.Target gene prediction of miRs by
TargetScan. |
Table III.
Target gene prediction of miRs by
TargetScan.
| miR/gene
symbol | Cumulative weighted
context++ score |
|---|
| hsa-miR-29a-3p |
|
|
COL1A1 | −2.72 |
|
TET3 | −2.16 |
|
TET1 | −1.78 |
|
TET2 | −1.17 |
|
ATAD2B | −1.12 |
|
HRK | −1.07 |
|
TRIB2 | −0.96 |
|
SUV420H2 | −0.95 |
|
COL1A2 | −0.91 |
|
NFIA | −0.89 |
|
EIF4E2 | −0.86 |
|
TIMM8B | −0.85 |
|
TDG | −0.84 |
|
IFI30 | −0.81 |
|
COL11A1 | −0.80 |
|
C7orf73 | −0.75 |
|
LYSMD1 | −0.73 |
|
COL5A3 | −0.73 |
|
SMIM17 | −0.72 |
|
IREB2 | −0.71 |
|
YPEL2 | −0.71 |
|
NASP | −0.71 |
|
SPARC | −0.67 |
|
ZKSCAN4 | −0.67 |
|
SLC30A3 | −0.67 |
|
PMP22 | −0.66 |
|
SYPL2 | −0.66 |
|
SMTNL2 | −0.65 |
|
DTWD2 | −0.63 |
|
TMEM236 | −0.63 |
|
TMEM236 | −0.63 |
|
ZBTB34 | −0.63 |
|
GPR37 | −0.63 |
|
ENHO | −0.63 |
|
ICOS | −0.62 |
|
HIF3A | −0.61 |
|
ADAMTS17 | −0.61 |
|
SFTA3 | −0.61 |
|
REV3L | −0.61 |
|
COL5A2 | −0.61 |
|
COL4A4 | −0.60 |
|
COL21A1 | −0.59 |
|
COL9A1 | −0.59 |
|
CCSAP | −0.59 |
|
ARRDC3 | −0.58 |
|
FBN1 | −0.58 |
|
CDC42 | −0.58 |
|
PGAP2 | −0.57 |
|
TSPAN14 | −0.57 |
|
SESTD1 | −0.57 |
|
LOXL2 | −0.57 |
|
TMEM183A | −0.56 |
|
TPM1 | −0.56 |
|
HAPLN3 | −0.56 |
|
MLIP | −0.55 |
|
GSTA4 | −0.55 |
|
MEX3B | −0.55 |
|
ZNF282 | −0.55 |
|
COL19A1 | −0.55 |
|
YBX3 | −0.55 |
|
ISG20L2 | −0.55 |
|
TRAF4 | −0.54 |
|
SH3BP5L | −0.54 |
|
PTEN | −0.53 |
|
RNF39 | −0.53 |
|
KDELC1 | −0.53 |
|
KIAA1024 | −0.53 |
|
ELOVL4 | −0.53 |
|
RAET1L | −0.53 |
|
PXDN | −0.53 |
|
GRIP1 | −0.52 |
|
FEM1B | −0.52 |
|
WDFY1 | −0.52 |
|
TBC1D7 | −0.52 |
|
AGPAT4 | −0.52 |
|
KCTD5 | −0.52 |
|
ADAMTS10 | −0.52 |
|
FAM167A | −0.51 |
| hsa-miR-15b-3p |
|
|
PGR | −1 |
|
PRB1 | −0.89 |
|
OR2J3 | −0.86 |
|
PRB2 | −0.77 |
|
PRB3 | −0.74 |
|
NPY2R | −0.71 |
|
C1QL3 | −0.68 |
|
CYP7A1 | −0.66 |
|
DYNLT1 | −0.65 |
|
GLRX5 | −0.64 |
|
SPRR1B | −0.62 |
|
C5orf30 | −0.61 |
|
TUBB6 | −0.59 |
|
NSMCE4A | −0.58 |
|
COQ4 | −0.58 |
|
RP11-422N16.3 | −0.56 |
|
CSTA | −0.56 |
|
TAS2R1 | −0.54 |
|
COA5 | −0.54 |
|
OR4C13 | −0.52 |
|
HDDC2 | −0.52 |
|
C12orf60 | −0.51 |
|
C6ORF50 | −0.51 |
|
PARPBP | −0.51 |
|
COMMD10 | −0.51 |
| hsa-miR-576-5p |
|
|
HNRNPU | −1 |
|
HIST1H2AG | −0.80 |
|
C4orf22 | −0.66 |
|
C8orf22 | −0.63 |
|
CCDC148 | −0.61 |
|
CCDC39 | −0.60 |
|
AC069547.1 | −0.59 |
|
LIPT1 | −0.59 |
|
MS4A12 | −0.55 |
|
RPL31 | −0.54 |
|
ENY2 | −0.54 |
|
GJE1 | −0.53 |
|
RBAK-RBAKDN | −0.51 |
|
hsa-miR-500a-3p |
|
|
PRX | −0.95 |
|
RP11-455G16.1 | −0.84 |
|
PRAMEF2 | −0.77 |
|
TSSK2 | −0.77 |
|
SLC2A14 | −0.73 |
|
NKX2-3 | −0.72 |
|
DHRS4 | −0.70 |
|
C3orf55 | −0.68 |
|
RP11-934B9.3 | −0.67 |
|
DHRS4L2 | −0.66 |
|
BX088651.1 | −0.66 |
|
NRG4 | −0.65 |
|
NEIL1 | −0.65 |
|
SMIM5 | −0.64 |
|
TVP23B | −0.64 |
|
RP2 | −0.64 |
|
C17orf58 | −0.64 |
|
PPP4R1 | −0.63 |
|
KLHL34 | −0.63 |
|
CAMK4 | −0.63 |
|
CLIC4 | −0.63 |
|
CDK6 | −0.63 |
|
IL2RA | −0.62 |
|
BTF3L4 | −0.61 |
|
PRAMEF14 | −0.61 |
|
HPCAL4 | −0.61 |
|
ZNF98 | −0.61 |
|
SOCS2 | −0.60 |
|
PRAMEF13 | −0.60 |
|
XIRP2 | −0.60 |
|
ZNF711 | −0.60 |
|
PLSCR5 | −0.59 |
|
SLC2A3 | −0.58 |
|
AC006372.1 | −0.58 |
|
AP3B2 | −0.56 |
|
MRPL43 | −0.56 |
|
NGDN | −0.56 |
|
MRFAP1L1 | −0.56 |
|
CCDC6 | −0.55 |
|
CDH19 | −0.55 |
|
PMAIP1 | −0.55 |
|
ZNF224 | −0.54 |
|
ANKRD10 | −0.54 |
|
AKR1CL1 | −0.54 |
|
ADI1 | −0.53 |
|
ING1 | −0.53 |
|
NIPAL3 | −0.52 |
|
KCNJ1 | −0.52 |
|
GPM6A | −0.52 |
|
NXT2 | −0.52 |
|
ANO2 | −0.52 |
|
RP11-366L20.2 | −0.51 |
|
MEOX2 | −0.51 |
|
CCNI2 | −0.51 |
| hsa-miR-155-5p |
|
|
ZNF385D | −0.80 |
|
TMPRSS11BNL | −0.68 |
|
VAV3 | −0.64 |
|
ACTA1 | −0.59 |
|
ARID2 | −0.58 |
|
H3F3A | −0.58 |
|
ETS1 | −0.57 |
|
ZNF652 | −0.57 |
|
VMA21 | −0.54 |
|
ACTL7A | −0.53 |
|
TM6SF1 | −0.53 |
|
CEBPB | −0.52 |
|
FOS | −0.52 |
|
WWC1 | −0.52 |
|
TAOK1 | −0.51 |
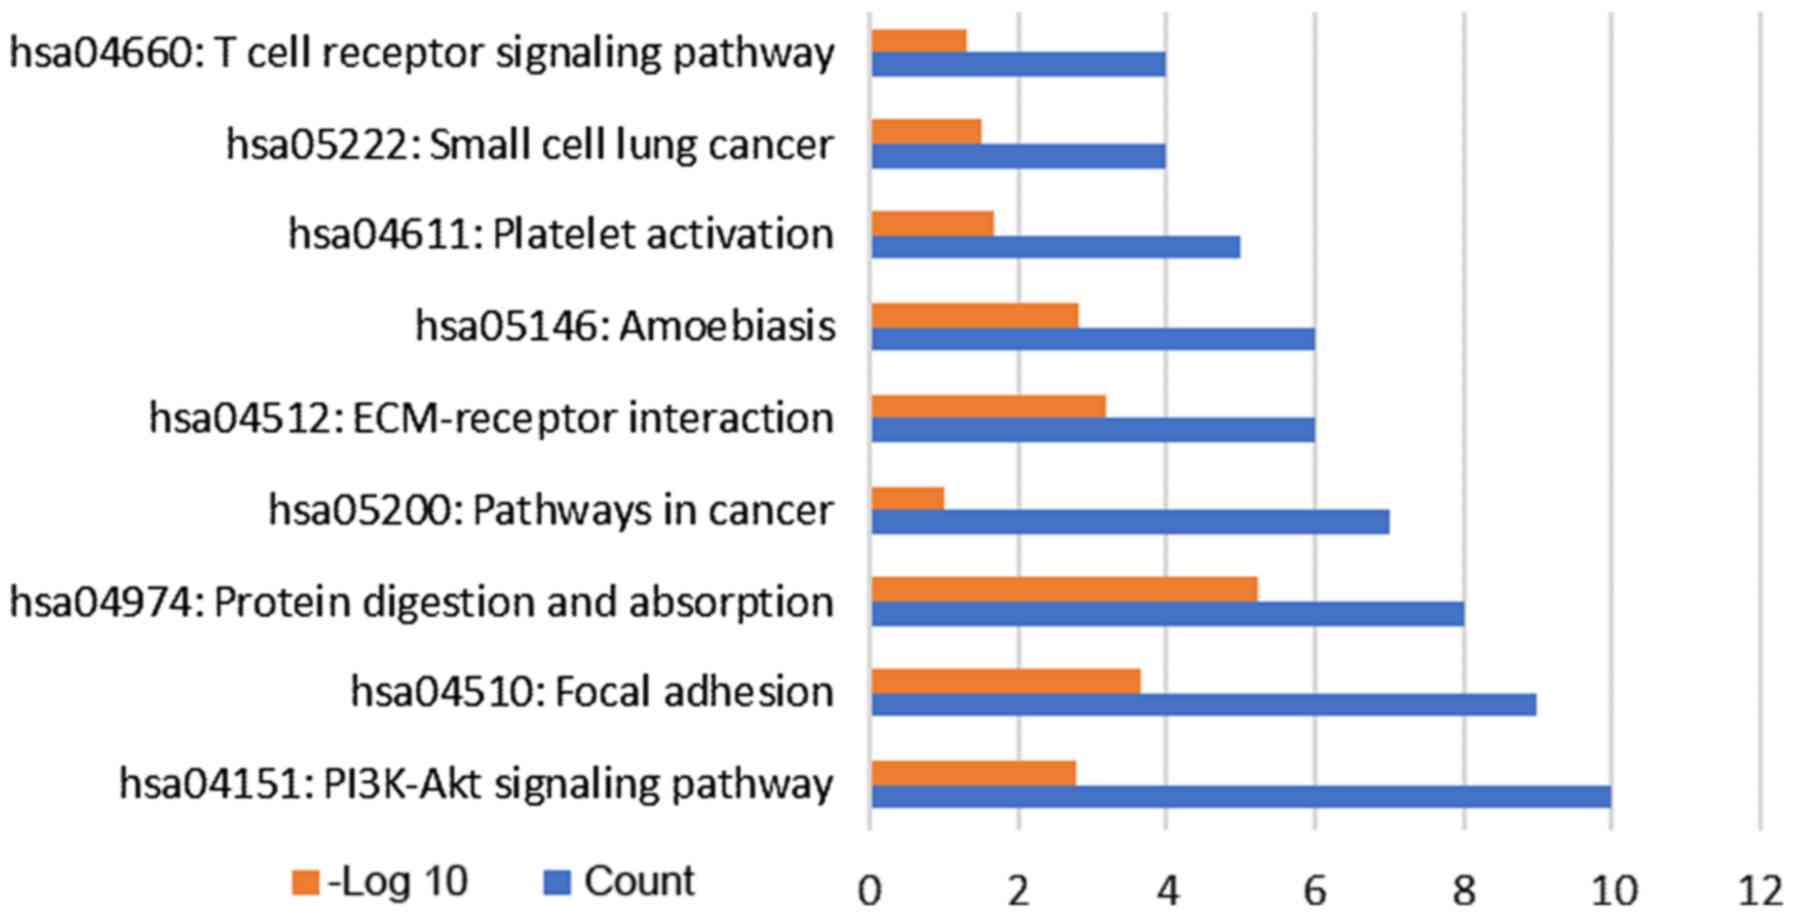
Functional and pathway analysis
To investigate the signaling pathways that are
potential associated with LTBI, the target genes were subjected to
KEGG pathway enrichment analysis. A total of 9 pathways were
enriched by the target genes (Fig.
4), including ‘protein digestion and absorption’,
‘extracellular matrix-receptor interaction’ and ‘phosphoinositide-3
kinase (PI3K)/AKT signaling pathway’. In addition, inclusion of
small cell lung cancer pathways in the present analysis indicated
that LTBI may be associated with the development of small cell lung
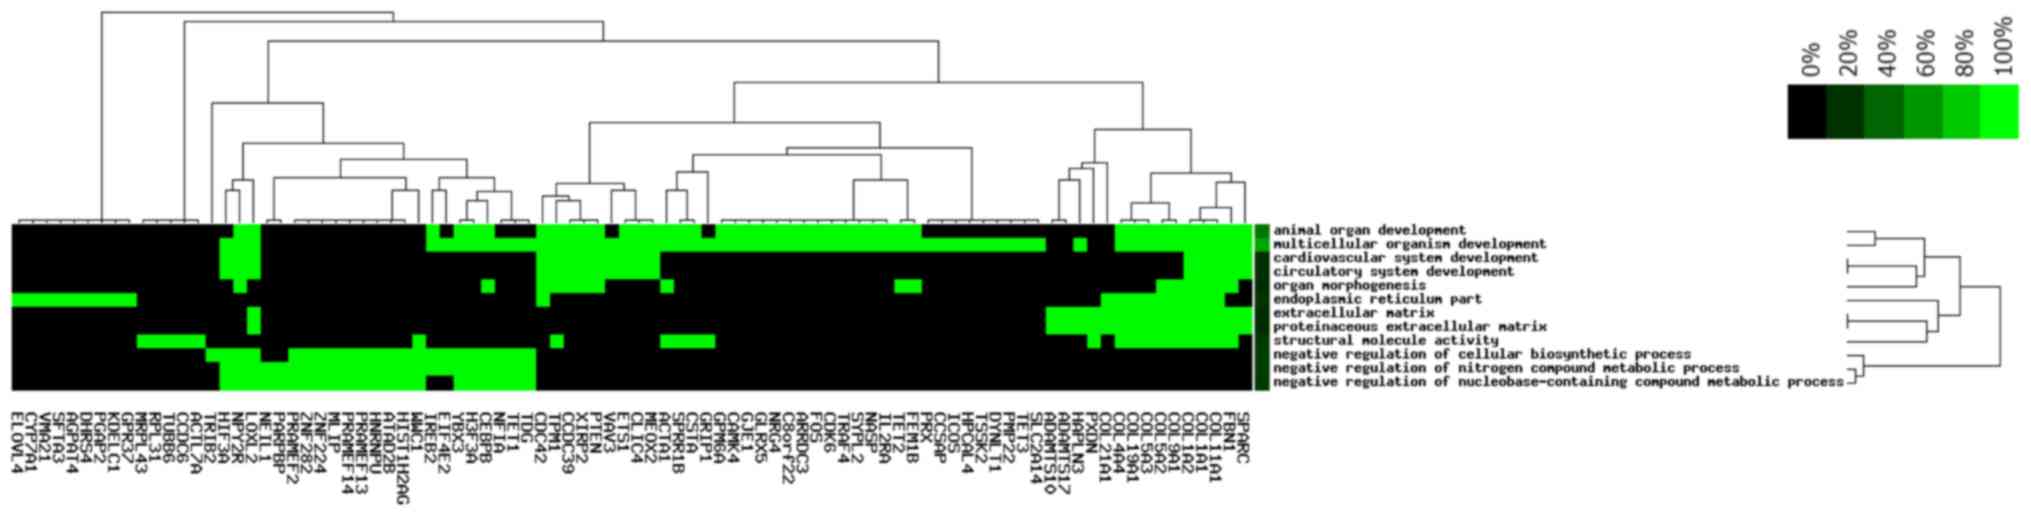
cancer. The 185 target genes were subsequently subjected to GO term
enrichment analysis which revealed that 90 target genes were
enriched in the following pathways: ‘Structural molecule activity’,
‘cardiovascular system development’, ‘organ morphogenesis’,
‘negative regulation of nitrogen compound metabolic process’ with
≥15 target genes enriched in several of these functional pathways,
the most relevant of which were the ‘cardiovascular system
development’ and ‘circulatory system development’ (Fig. 5).
Discussion
The incomplete understanding of the underlying
mechanisms and deficiencies in the diagnosis and treatment make it
difficult to prevent and cure LTBI. Various host factors are
included in this complex process. In the present study, miRs, a
type of non-coding RNAs, were the focus, as they have been applied
in multiple fields of life science and medicine. Microarray
analysis has been widely used to investigate DEMs, dysregulated
genes and pathways associated with LTBI (21,30,31). In
previous decades, a large amount of research investigating this
matter has emerged (18,32–34);
however, identifying novel miRs can be used to investigate further
the underlying mechanism of LTBI. Thus, in the present study,
expression data obtained from patients with and without LTBI were
subjected to a bioinformatics analysis to provide more reliable
data.
In the analysis of the present study, 2 datasets
were included. A total of 144 DEMs were identified from these 2
datasets. By exploring the overlapping miRs in the two datasets,
hsa-miR-29a and hsa-miR-15b were identified as being decreased,
while hsa-miR-576-5p, hsa-miR-500 and hsa-miR-155 were identified
to be upregulated. Of note, miR-29a was previously reported to be
significantly decreased in patients with LTBI (35,36).
miRs encoded by the miR-15b/16–2 cluster may act as tumor
suppressors. Aberrant regulation of miR-15b in human cancers
reportedly has an important role in cancer development,
contributing to reduced proliferation, cell death, angiogenesis and
metabolic reprogramming and metastasis resistance, as well as
tumor-associated inflammation and genomic instability (37). miR-576 is directly targeted by
hepatitis B virus-encoded X protein (38). miR-155 and miR-500 were reported as
potential markers of aflatoxin exposure (39), which suggests that miRs may be used
as potential biomarkers for the diagnosis of LTBI. However, the
possible association of hsa-miR-15b, hsa-miR-576-5p, hsa-miR-500
and hsa-miR-155 with LTBI identified in the present analysis
remains to be verified.
To gain a broad understanding of the effects of miRs
in LTBI, the target genes of the 5 abovementioned DEMs were
predicted. By merging the miR regulatory network and
protein-protein interaction network, a degree of crosstalk among
these miRs via cancer-associated genes, including FOS, ACTA1, CDC42
and PTEN, was identified (40–43). In
the current study, pathways associated with small cell lung cancer
also appeared in the KEGG pathway analysis, which suggests that
LTBI may participate in the development of small cell lung cancer.
By exploring the topological structure of the interaction network,
it was revealed that hsa-miR-500a-3p and hsa-miR-29a-3p, as well as
the 4 genes CDC42, ACTA1, PTEN and FOS, have essential roles in
this regulatory network. These miRs and genes may be core factors
in the diagnosis of LTBI.
To determine the molecular mechanisms underlying the
LTBI process, GO term and KEGG pathway analysis were included in
the present study to perform a comprehensive analysis of the roles
of the key miRs and genes. In the KEGG pathway enrichment analysis,
‘PI3K/AKT signaling pathway’ appeared to be the most enriched
pathway with the largest number of enriched genes. The PI3K/AKT
signaling pathway, including its downstream pathway, mammalian
target of rapamycin (mTOR), is well known to be involved in a
variety of BPs, and it has been reported that hyperactivation of
mTOR has a pathogenetic role in human immunodeficiency virus
infection (44–46). Due to the important role of the AKT
pathway in cellular metabolism, growth and division, apoptosis
suppression and angiogenesis, the regulation of the AKT signaling
may represent a valuable therapeutic strategy. For this reason, AKT
inhibitors have become the hotspots of research in a number of
clinical diseases (47), and dual
PI3K/mTOR inhibitors, including PF-04691502 and NVP-BEZ235, may
have important therapeutic applications in cancer (48,49).
Anti-retroviral protease inhibitors have been re-purposed as
inhibitors of the PI3K/AKT/mTOR pathway, and such drugs that are
also available as a generic and cheap formulation may be
immediately available for testing in patients with LTBI (50). Studies have also indicated on
upregulated activation of the PI3K/AKT/mTOR pathway in autoimmune
diseases, including multiple sclerosis and liver fibrosis (51,52). It
has been demonstrated that the PI3K/AKT signaling pathway is
inhibited in patients with active TB (53,54).
However, there is no direct evidence indicating PI3K/AKT signaling
pathway alterations in patients with LTBI. ‘Protein digestion and
absorption’ was the most significant pathway. These signaling
pathways constitute important potential mechanisms underlying the
processes of LTBI and merit further validation.
In conclusion, the present analysis identified
hsa-miR-500a-3p and hsa-miR-29a-3p, as well as 4 target genes
CDC42, ACTA1, PTEN and FOS, which may be used as potential
biomarkers of LTBI. The PI3K/AKT signaling pathway is the key
genetic event implicated in LTBI, and an in-depth investigation of
the efficiency of PI3K/AKT signaling inhibitors in the prevention
of LTBI is warranted. The novel key factors and molecular pathways
provided in the present study may contribute to the current
understanding of LTBI and may facilitate the development of a
molecular diagnostic platform for its detection.
Acknowledgements
Not applicable.
Funding
The present study was supported by the National
Natural Science Foundation of China (grant no. 81660330).
Availability of data and materials
All datasets used and/or analyzed during the present
study are available from the corresponding author on reasonable
request.
Authors' contributions
YL, HD, XiaW, PY, LH, YW, ZZ and WZ analyzed the
data. YL, XinW, HD and LZ designed the study and prepared the
manuscript.
Ethical approval and consent to
participate
Not applicable.
Patient consent for publication
Not applicable.
Competing interests
The authors declare that they have no competing
interest.
References
|
1
|
WHO: Global tuberculosis report 2017.
http://wwwwhoint/tb/publications/global_report/en/2017
|
|
2
|
WHO: Latent tuberculosis infection Updated
and consolidated guidelines for programmatic management. http://appswhoint/iris/bitstream/10665/260233/1/9789241550239-engpdf?ua=12018
|
|
3
|
Palomino JC, Martin A, Von Groll A and
Portaels F: Rapid culture-based methods for drug-resistance
detection in Mycobacterium tuberculosis. J Microbiol
Methods. 75:161–166. 2008. View Article : Google Scholar : PubMed/NCBI
|
|
4
|
Tang P and Johnston J: Treatment of latent
tuberculosis infection. Curr Treat Options Infect Dis. 9:371–379.
2017. View Article : Google Scholar : PubMed/NCBI
|
|
5
|
Alvarez-León EE, Espinosa-Vega E,
Santana-Rodriguez E, Molina-Cabrillana JM, Pérez-Arellano JL,
Caminero JA and Serrano-Aguilar P: Screening for tuberculosis
infection in spanish healthcare workers: Comparison of the
QuantiFERON-TB gold in-tube test with the tuberculin skin test.
Infect Control Hosp Epidemiol. 30:876–883. 2009. View Article : Google Scholar : PubMed/NCBI
|
|
6
|
Menzies D, Pai M and Comstock G:
Meta-analysis: New tests for the diagnosis of latent tuberculosis
infection: areas of uncertainty and recommendations for research.
Ann Intern Med. 146:340–354. 2007. View Article : Google Scholar : PubMed/NCBI
|
|
7
|
Jiang W, Shao L, Zhang Y, Zhang S, Meng C,
Xu Y, Huang L, Wang Y, Wang Y, Weng X and Zhang W: High-sensitive
and rapid detection of Mycobacterium tuberculosis infection
by IFN-gamma release assay among HIV-infected individuals in
BCG-vaccinated area. BMC Immunol. 10:312009. View Article : Google Scholar : PubMed/NCBI
|
|
8
|
Matulis G, Juni P, Villiger PM and Gadola
SD: Detection of latent tuberculosis in immunosuppressed patients
with autoimmune diseases: Performance of a Mycobacterium
tuberculosis antigen-specific interferon gamma assay. Ann Rheum
Dis. 67:84–90. 2008. View Article : Google Scholar : PubMed/NCBI
|
|
9
|
WHO: Guidelines on the management of
latent tuberculosis infection. http://wwwwhoint/tb/publications/latent-tuberculosis-infection/en/2014.
|
|
10
|
Bartel DP: MicroRNAs: Genomics,
biogenesis, mechanism, and function. Cell. 116:281–297. 2004.
View Article : Google Scholar : PubMed/NCBI
|
|
11
|
Lukiw WJ: Micro-RNA speciation in fetal,
adult and Alzheimer's disease hippocampus. Neuroreport. 18:297–300.
2007. View Article : Google Scholar : PubMed/NCBI
|
|
12
|
Hayes J, Peruzzi PP and Lawler S:
MicroRNAs in cancer: Biomarkers, functions and therapy. Trends Mol
Med. 20:460–469. 2014. View Article : Google Scholar : PubMed/NCBI
|
|
13
|
Chen H, Lan HY, Roukos DH and Cho WC:
Application of microRNAs in diabetes mellitus. J Endocrinol.
222:R1–R10. 2014. View Article : Google Scholar : PubMed/NCBI
|
|
14
|
Kumarswamy R and Thum T: Non-coding RNAs
in cardiac remodeling and heart failure. Circ Res. 113:676–689.
2013. View Article : Google Scholar : PubMed/NCBI
|
|
15
|
Jin BX, Zhang YH, Jin WJ, Sun XY, Qiao GF,
Wei YY, Sun LB, Zhang WH and Li N: MicroRNA panels as disease
biomarkers distinguishing hepatitis B virus infection caused
hepatitis and liver cirrhosis. Sci Rep. 5:150262015. View Article : Google Scholar : PubMed/NCBI
|
|
16
|
Staedel C and Darfeuille F: MicroRNAs and
bacterial infection. Cellular microbiology. 15:1496–1507. 2013.
View Article : Google Scholar : PubMed/NCBI
|
|
17
|
Wu LS, Lee SW, Huang KY, Lee TY, Hsu PW
and Weng JT: Systematic expression profiling analysis identifies
specific microRNA-gene interactions that may differentiate between
active and latent tuberculosis infection. Biomed Res Int.
2014:8951792014. View Article : Google Scholar : PubMed/NCBI
|
|
18
|
Meng QL, Liu F, Yang XY, Liu XM, Zhang X,
Zhang C1 and Zhang ZD: Identification of latent tuberculosis
infection-related microRNAs in human U937 macrophages expressing
Mycobacterium tuberculosis Hsp16.3. BMC Microbiol.
14:372014. View Article : Google Scholar : PubMed/NCBI
|
|
19
|
Rai G, Rai R, Saeidian AH and Rai M:
Microarray to deep sequencing: Transcriptome and miRNA profiling to
elucidate molecular pathways in systemic lupus erythematosus.
Immunol Res. 64:14–24. 2016. View Article : Google Scholar : PubMed/NCBI
|
|
20
|
Zheng Y, Qing T, Song Y, Zhu J, Yu Y, Shi
W, Pusztai L and Shi L: Standardization efforts enabling
next-generation sequencing and microarray based biomarkers for
precision medicine. Biomark Med. 9:1265–1272. 2015. View Article : Google Scholar : PubMed/NCBI
|
|
21
|
Zheng L, Leung E, Lee N, Lui G, To KF,
Chan RC and Ip M: Differential microRNA expression in human
macrophages with Mycobacterium tuberculosis infection of
Beijing/W and NON-Beijing/W strain types. PLoS One.
10:e01260182015. View Article : Google Scholar : PubMed/NCBI
|
|
22
|
Gentleman RC, Carey VJ, Bates DM, Bolstad
B, Dettling M, Dudoit S, Ellis B, Gautier L, Ge Y, Gentry J, et al:
Bioconductor: Open software development for computational biology
and bioinformatics. Genome Biol. 5:R802004. View Article : Google Scholar : PubMed/NCBI
|
|
23
|
Mizrachi E, Verbeke L, Christie N, Fierro
AC, Mansfield SD, Davis MF, Gjersing E, Tuskan GA, Van Montagu M,
Van de Peer Y, et al: Network-based integration of systems genetics
data reveals pathways associated with lignocellulosic biomass
accumulation and processing. Proc Natl Acad Sci USA. 114:1195–1200.
2017. View Article : Google Scholar : PubMed/NCBI
|
|
24
|
Agarwal V, Bell GW, Nam JW and Bartel DP:
Predicting effective microRNA target sites in mammalian mRNAs.
Elife. 4:2015. View Article : Google Scholar
|
|
25
|
Szklarczyk D, Franceschini A, Wyder S,
Forslund K, Heller D, Huerta-Cepas J, Simonovic M, Roth A, Santos
A, Tsafou KP, et al: STRING v10: Protein-protein interaction
networks, integrated over the tree of life. Nucleic Acids Res.
43:(Database Issue). D447–D452. 2015. View Article : Google Scholar : PubMed/NCBI
|
|
26
|
Muetze T, Goenawan IH, Wiencko HL,
Bernal-Llinares M, Bryan K and Lynn DJ: contextual hub analysis
tool (CHAT): A Cytoscape app for identifying contextually relevant
hubs in biological networks. F1000 Res. 5:17452016. View Article : Google Scholar
|
|
27
|
Su G, Morris JH, Demchak B and Bader GD:
Biological network exploration with Cytoscape 3. Curr Protoc
Bioinformatics. 47:8.13.1–24. 2014. View Article : Google Scholar
|
|
28
|
Du J, Yuan Z, Ma Z, Song J, Xie X and Chen
Y: KEGG-PATH: Kyoto encyclopedia of genes and genomes-based pathway
analysis using a path analysis model. Mol Biosyst. 10:2441–2447.
2014. View Article : Google Scholar : PubMed/NCBI
|
|
29
|
Wang JH, Zhao LF, Lin P, Su XR, Chen SJ,
Huang LQ, Wang HF, Zhang H, Hu ZF, Yao KT and Huang ZX: GenCLiP
2.0: A web server for functional clustering of genes and
construction of molecular networks based on free terms.
Bioinformatics. 30:2534–2536. 2014. View Article : Google Scholar : PubMed/NCBI
|
|
30
|
Xin H, Yang Y, Liu J, Li X, Li M, Feng B,
Li Z, Zhang H, Li H, Shen F, et al: Association between
tuberculosis and circulating microRNA hsa-let-7b and hsa-miR-30b: A
pilot study in a Chinese population. Tuberculosis (Edinb).
99:63–69. 2016. View Article : Google Scholar : PubMed/NCBI
|
|
31
|
Fu Y, Yi Z, Li J and Li R: Deregulated
microRNAs in CD4+ T cells from individuals with latent tuberculosis
versus active tuberculosis. J Cell Mol Med. 18:503–513. 2014.
View Article : Google Scholar : PubMed/NCBI
|
|
32
|
Wang C, Yang S, Sun G, Tang X, Lu S,
Neyrolles O and Gao Q: Comparative miRNA expression profiles in
individuals with latent and active tuberculosis. PLoS One.
6:e258322011. View Article : Google Scholar : PubMed/NCBI
|
|
33
|
Ndzi EN, Nkenfou CN, Mekue LM, Zentilin L,
Tamgue O, Pefura EWY, Kuiaté JR, Giacca M and Ndjolo A: MicroRNA
hsa-miR-29a-3p is a plasma biomarker for the differential diagnosis
and monitoring of tuberculosis. Tuberculosis (Edinb). 114:69–76.
2019. View Article : Google Scholar : PubMed/NCBI
|
|
34
|
Sabir N, Hussain T, Shah SZA, Peramo A,
Zhao D and Zhou X: miRNAs in tuberculosis: new avenues for
diagnosis and host-directed therapy. Front Microbiol. 9:6022018.
View Article : Google Scholar : PubMed/NCBI
|
|
35
|
Kleinsteuber K, Heesch K, Schattling S,
Kohns M, Sander-Jülch C, Walzl G, Hesseling A, Mayatepek E,
Fleischer B, Marx FM and Jacobsen M: Decreased expression of
miR-21, miR-26a, miR-29a, and miR-142-3p in CD4+ T cells
and peripheral blood from tuberculosis patients. PLoS One.
8:e616092013. View Article : Google Scholar : PubMed/NCBI
|
|
36
|
Pan D, Pan M and Xu YM: Mir-29a
expressions in peripheral blood mononuclear cell and cerebrospinal
fluid: Diagnostic value in patients with pediatric tuberculous
meningitis. Brain Res Bull. 130:231–235. 2017. View Article : Google Scholar : PubMed/NCBI
|
|
37
|
Zhao C, Wang G, Zhu Y, Li X, Yan F, Zhang
C, Huang X and Zhang Y: Aberrant regulation of miR-15b in human
malignant tumors and its effects on the hallmarks of cancer. Tumour
Biol. 37:177–183. 2016. View Article : Google Scholar : PubMed/NCBI
|
|
38
|
Guerrieri F, Belloni L, D'Andrea D,
Pediconi N, Le Pera L, Testoni B, Scisciani C, Floriot O, Zoulim F,
Tramontano A and Levrero M: Genome-wide identification of direct
HBx genomic targets. BMC Genomics. 18:1842017. View Article : Google Scholar : PubMed/NCBI
|
|
39
|
Valencia-Quintana R, Sánchez-Alarcón J,
Tenorio-Arvide MG, Deng Y, Montiel-González JM, Gómez-Arroyo S,
Villalobos-Pietrini R, Cortés-Eslava J, Flores-Márquez AR and
Arenas-Huertero F: The microRNAs as potential biomarkers for
predicting the onset of aflatoxin exposure in human beings: A
review. Front Microbiol. 5:1022014. View Article : Google Scholar : PubMed/NCBI
|
|
40
|
Aguilar BJ, Zhou H and Lu Q: Cdc42
signaling pathway inhibition as a therapeutic target in ras-
related cancers. Curr Med Chem. 24:3485–3507. 2017. View Article : Google Scholar : PubMed/NCBI
|
|
41
|
Chang H, Sung JH, Moon SU, Kim HS, Kim JW
and Lee JS: EGF Induced RET inhibitor resistance in CCDC6-RET lung
cancer cells. Yonsei Med J. 58:9–18. 2017. View Article : Google Scholar : PubMed/NCBI
|
|
42
|
Kato F, Fiorentino FP, Alibés A, Perucho
M, Sánchez-Céspedes M, Kohno T and Yokota J: MYCL is a target of a
BET bromodomain inhibitor, JQ1, on growth suppression efficacy in
small cell lung cancer cells. Oncotarget. 7:77378–77388. 2016.
View Article : Google Scholar : PubMed/NCBI
|
|
43
|
Cui M, Augert A, Rongione M, Conkrite K,
Parazzoli S, Nikitin AY, Ingolia N and MacPherson D: PTEN is a
potent suppressor of small cell lung cancer. Mol Cancer Res.
12:654–659. 2014. View Article : Google Scholar : PubMed/NCBI
|
|
44
|
Nicoletti F, Fagone P, Meroni P, McCubrey
J and Bendtzen K: mTOR as a multifunctional therapeutic target in
HIV infection. Drug Discov Today. 16:715–721. 2011. View Article : Google Scholar : PubMed/NCBI
|
|
45
|
Nicoletti F, Lapenta C, Donati S, Spada M,
Ranazzi A, Cacopardo B, Mangano K, Belardelli F, Perno C and Aquaro
S: Inhibition of human immunodeficiency virus (HIV-1) infection in
human peripheral blood leucocytes-SCID reconstituted mice by
rapamycin. Clin Exp Immunol. 155:28–34. 2009. View Article : Google Scholar : PubMed/NCBI
|
|
46
|
Donia M, McCubrey JA, Bendtzen K and
Nicoletti F: Potential use of rapamycin in HIV infection. Br J Clin
Pharmacol. 70:784–793. 2010. View Article : Google Scholar : PubMed/NCBI
|
|
47
|
Nitulescu GM, Van De Venter M, Nitulescu
G, Ungurianu A, Juzenas P, Peng Q, Olaru OT, Grădinaru D, Tsatsakis
A, Tsoukalas D, et al: The Akt pathway in oncology therapy and
beyond (Review). Int J Oncol. 53:2319–2331. 2018.PubMed/NCBI
|
|
48
|
Chen D, Mao C, Zhou Y, Su Y, Liu S and Qi
WQ: PF-04691502, a dual PI3K/mTOR inhibitor has potent pre-clinical
activity by inducing apoptosis and G1 cell cycle arrest in
aggressive B-cell non-Hodgkin lymphomas. Int J Oncol. 48:253–260.
2016. View Article : Google Scholar : PubMed/NCBI
|
|
49
|
Moon du G, Lee SE, Oh MM, Lee SC, Jeong
SJ, Hong SK, Yoon CY, Byun SS, Park HS and Cheon J: NVP-BEZ235, a
dual PI3K/mTOR inhibitor synergistically potentiates the antitumor
effects of cisplatin in bladder cancer cells. Int J Oncol.
45:1027–1035. 2014. View Article : Google Scholar : PubMed/NCBI
|
|
50
|
Maksimovic-Ivanic D, Fagone P, McCubrey J,
Bendtzen K, Mijatovic S and Nicoletti F: HIV-protease inhibitors
for the treatment of cancer: Repositioning HIV protease inhibitors
while developing more potent NO-hybridized derivatives? Int J
Cancer. 140:1713–1726. 2017. View Article : Google Scholar : PubMed/NCBI
|
|
51
|
Mammana S, Bramanti P, Mazzon E, Cavalli
E, Basile MS, Fagone P, Petralia MC, McCubrey JA, Nicoletti F and
Mangano K: Preclinical evaluation of the PI3K/Akt/mTOR pathway in
animal models of multiple sclerosis. Oncotarget. 9:8263–8277. 2018.
View Article : Google Scholar : PubMed/NCBI
|
|
52
|
Fagone P, Mangano K, Pesce A, Portale TR,
Puleo S and Nicoletti F: Emerging therapeutic targets for the
treatment of hepatic fibrosis. Drug Discov Today. 21:369–375. 2016.
View Article : Google Scholar : PubMed/NCBI
|
|
53
|
Wang FY, Wang XM, Wang C, Wang XF, Zhang
YQ, Wu JD, Wu F, Zhang WJ and Zhang L: Suppression of Mcl-1 induces
apoptosis in mouse peritoneal macrophages infected with
Mycobacterium tuberculosis. Microbiol Immunol. 60:215–227.
2016. View Article : Google Scholar : PubMed/NCBI
|
|
54
|
Kim KH, Yang CS, Shin AR, Jeon SR, Park
JK, Kim HJ and Jo EK: Mycobacterial heparin-binding hemagglutinin
antigen activates inflammatory responses through PI3-K/Akt, NF-κB,
and MAPK pathways. Immune Netw. 11:123–133. 2011. View Article : Google Scholar : PubMed/NCBI
|