Introduction
Diabetic neuropathy (DN) is the most common and
troublesome complication of diabetes, characterized by the gradual
loss of peripheral axons, resulting in diminished sensation, pain,
and eventual complete loss of sensation (1). Pathologically, it is the culprit of a
series of interrelated metabolic abnormalities with insulin
deficiency and hyperglycemia (2).
Importantly, DN affects up to 60–70% of diabetics, leading to the
highest morbidity and mortality rates and to a huge economic burden
of diabetes care (3,4). However, in addition to controlling
blood glucose levels, no effective treatment options have been
found to prevent, slow or reverse the progression of DN and are not
always achievable even in alert patients (5). Besides, a good understanding of
pathological and molecular mechanism underlying DN might give help
to explore effective therapy of this complicated disease.
The difference of gene expression levels could
reflect the propensity of many diseases, and thus identifying gene
functions has been an effective way to reveal the pathological
mechanism of a disease at molecular level (6). ELAVL3, as a member of the Elavl family,
is known as a neuronal Elavl because it is expressed in peripheral
and central neurons throughout development (7). Ogawa et al hold the view that
ELAVL3 is essential for maintaining Purkinje neuron axons (8). It has been reported that ELAVL3
regulates neuronal polarity via alternative splicing of
embryo-specific exon in AnkyrinG (9). There is some evidence to suggest that
Molecule Interacting with CasL-Like1 (MICALL1), involved in
pre-cytokinetic events, acts as a membrane hub on tubular recycling
endosomes (10). According to recent
reports, tubular recirculating endosome biogenesis was regulated
through p53-MICALL1 pathway (11).
HEY2, as a member of hairy-related basic helix-loop-helix
transcription factor subfamily, is involved in boundary formation
and cell fate determination (12).
Recent research has indicated that miR-98 activated the Notch
signaling pathway by binding to HEY2 in Alzheimer's disease mice to
improve mitochondrial dysfunction and oxidative stress (13). Our research results agree with
previous studies, suggesting that ELAVL3, MICALL1, HEY2 genes have
effects on neurological diseases. It has been demonstrated that by
using variants based on the guilty susceptibility (GBA) algorithm,
gene function prediction can be performed with very high
statistical confidence assuming that the associations in the
genetic data is necessary to establish culpability (14). Although various of techniques have
been proposed for purpose of extending the GBA to indirect
connections, only slight effectiveness has been discovered
(15–18).
In the present study, a new method was proposed to
predict seed gene functions for progressive DN (PDN) patients, by
integrating the GBA algorithm and network-based method. To achieve
this goal, gene expression data and gene ontology (GO) annotations
were collected from the public databases. Differentially expressed
genes (DEGs) were identified as gene lists and background GO terms
were extracted as gene sets. The co-expression matrix (CEM) was
constructed on gene lists by Spearman correlation coefficient (SCC)
method.
Materials and methods
Preparing gene expression data
Gene expression data [GSE24290 (19)] for human DN were recruited from the
public-free Gene Expression Omnibus (GEO). In brief, based on the
density of myelinated fibers, GSE24290 divided the DN patient
samples into two groups, progressors and non-progressors. In short,
the patients in the progressive group lost ≥500
fibres/mm2, and the patients in the non-progressive
group lost ≤100 fibres/mm2 over 52 weeks (20). By mapping these preprocessed probes
to gene structures, a total of 10,570 genes were identified for PDN
for subsequent analysis.
Collecting gene sets
All human GO annotations were prepared from the Gene
Ontology Consortium (21,22). For purpose of making these retained
GO terms more correlated to progressors, we took the intersections
between DEGs and GO terms. If the number of DEGs for a GO term was
smaller than 20, it was removed. Only GO terms including equal or
more than 20 DEGs were reserved.
Identifying DEGs
DEGs between progressors and non-progressors were
detected (23). The lmFit function
implemented in Limma was utilized to perform linear fitting,
empirical Bayes statistics and false discovery rate (FDR)
calibration of the P-values on the data (24,25). The
thresholds for DEGs were set as P<0.05 and |log2
fold-change| >2.
Constructing CEM
To further investigate the correlations or
interactions among DEGs, a CEM for them was constructed based on
the SCC algorithm (26). If the SCC
for a pair of genes was positive, it would indicate a positive
linear correlation between the two genes. Similarly, a negative SCC
refers to a negative relationship of the gene pair. In addition,
the absolute SCC value of an interaction was denoted as its weight
value. Furthermore, the higher the weight value across two genes,
the stronger the interaction was, especially for 1. Otherwise, the
0 meant that there was no interaction between two genes. As a
result, a CEN was constructed according to weight.
Network-based GBA algorithm
The GBA algorithm was combined with network to
predict significant gene functions for progressors. Specifically,
for a DEG in the CEM, we chose its adjacent genes to enrich to a GO
term. Based on these GO functional annotations, a
multi-functionality (MF) score was assigned to each gene i
in the CEM (14)
S(i)=∑k∨i∈GOk1Numink*Numoutk
of which Numink represented the
number of genes within GO group k, whose weighting had the
effect of giving contribution to a GO group; and
Numoutk was the number of genes outside GO group
k in the CEM, whose weighting provided a corresponding
weighting to genes not within the GO group. Note that we computed
the AUC for evaluating classification performances between
progressors and non-progressors. Here, for assessing the predictive
power of machine learners in the support vector machine (SVM)
model, AUC is an assessment of the accuracy of clinical
classification performance (27).
Most importantly, an AUC of 0.5 represents classification at chance
levels, while an AUC of 1.0 represents a perfect classification.
Thus we defined GO terms of AUC >0.6 as seed gene functions for
PDN patients in the present report.
Results
Gene lists
In this report, based on 10,570 genes in GSE24290,
we identified 79 DEGs between progressors and non-progressors by
Limma package when setting the thresholds as P<0.05 and
|log2 fold-change| >2. All DEGs were ranked in
ascending order of their P-values (Table
I). We found that the most significant DEGs were ELAVL3
(P=1.87E-02), MICALL1 (P=2.51E-02), HEY2
(P=3.42E-02), PCDHB1 (P=3.69E-02) and OR2S2
(P=4.81E-02). Importantly, the 79 DEGs were regarded as gene lists
for further exploitation.
 | Table I.Gene list for progressive diabetic
neuropathy (PDN). |
Table I.
Gene list for progressive diabetic
neuropathy (PDN).
| Rank | DEG | P-value | Rank | DEG | P-value |
|---|
| 1 | ELAVL3 | 0.018730149 | 41 | FER1L4 | 0.237218317 |
| 2 | MICALL1 | 0.025064168 | 42 | TAS2R13 | 0.254492341 |
| 3 | HEY2 | 0.034183011 | 43 | SYN1 | 0.254519864 |
| 4 | PCDHB1 | 0.036938421 | 44 | KCNMB4 | 0.257387331 |
| 5 | OR2S2 | 0.048112652 | 45 | SLC35E1 | 0.258472445 |
| 6 | CNTD2 | 0.055977842 | 46 | PRX | 0.267184163 |
| 7 | DNAJB12 | 0.059213903 | 47 | GIPC2 | 0.276805505 |
| 8 | GPR21 | 0.061091712 | 48 | RBM12B | 0.298659702 |
| 9 | PFN1 | 0.068351436 | 49 | HACD1 | 0.302339336 |
| 10 | ZMIZ2 | 0.073944462 | 50 | NAALAD2 | 0.309726354 |
| 11 | HSPA6 | 0.080467794 | 51 | KLHL21 | 0.310864132 |
| 12 | TRIM36 | 0.082922925 | 52 | TMX2 | 0.316649651 |
| 13 | MTHFD1 | 0.08313726 | 53 | HEBP2 | 0.319262815 |
| 14 | RPA4 | 0.091277628 | 54 | RFC2 | 0.319345713 |
| 15 | NIPAL2 | 0.101024558 | 55 | CCDC134 | 0.327623954 |
| 16 | HDDC2 | 0.106181304 | 56 | MEPE | 0.343481838 |
| 17 | LIME1 | 0.107101383 | 57 | TRAPPC9 | 0.374991751 |
| 18 | MAPKAPK5-AS1 | 0.108867691 | 58 | TXNRD1 | 0.384530053 |
| 19 | CCDC186 | 0.116573636 | 59 | CTDNEP1 | 0.386873156 |
| 20 | FCF1 | 0.117569875 | 60 | SH2D4A | 0.39096557 |
| 21 | PSMD5 | 0.118641952 | 61 | ZNF512B | 0.390996512 |
| 22 | YTHDF3 | 0.130853807 | 62 | TAGLN2 | 0.400497742 |
| 23 | CDHR5 | 0.135952991 | 63 | C10orf76 | 0.401347031 |
| 24 | C6orf120 | 0.1416115 | 64 | PIK3IP1 | 0.409666004 |
| 25 | VWA7 | 0.144178178 | 65 | C5orf30 | 0.420802441 |
| 26 | ASF1A | 0.147208457 | 66 | PKNOX1 | 0.449555958 |
| 27 | NELL2 | 0.162233252 | 67 | DNAJB2 | 0.465398033 |
| 28 | SRM | 0.167545586 | 68 | NCR2 | 0.474076273 |
| 29 | SH3KBP1 | 0.176459493 | 69 | GALNT8 | 0.475841943 |
| 30 | USE1 | 0.178993287 | 70 | IKZF3 | 0.480703371 |
| 31 | INSIG1 | 0.179397171 | 71 | SENP5 | 0.492341515 |
| 32 | SSH3 | 0.18328187 | 72 | POMGNT2 | 0.510089318 |
| 33 | FAM66D | 0.185333874 | 73 | CALHM2 | 0.515258516 |
| 34 | PGAP3 | 0.190879424 | 74 | ATP8B4 | 0.5305693 |
| 35 | PER2 | 0.192655455 | 75 | GALNT10 | 0.543825962 |
| 36 | CCS | 0.193106321 | 76 | WIZ | 0.550465591 |
| 37 | E2F8 | 0.200074614 | 77 | FER | 0.594006462 |
| 38 | HTR1F | 0.221840324 | 78 | PITPNA | 0.597706177 |
| 39 | ZNF142 | 0.232301069 | 79 | MYO3A | 0.599378182 |
| 40 | PPP1R3B | 0.236879137 |
|
|
|
Gene sets
In the Gene Ontology Consortium database, there are
19,003 gene sets involved in 18,402 genes. To make these sets with
a stable performance and more correlated to progressors, we chose
GO terms from 20 to 1,000 in size and then took intersections
between the reserved terms with the gene lists. Only gene sets
containing intersected DEGs >20 were left in the subsequent
analysis. Hereinafter, we defined the amount of intersected DEGs as
the count value of this term. As a result, a total of 40 GO terms
were determined (Table II), termed
with background GO terms. There were three terms with Count >60,
cellular component (GO:0005575, Count = 71), biological process
(GO:0008150, Count = 67), and molecular function (GO:0003674, Count
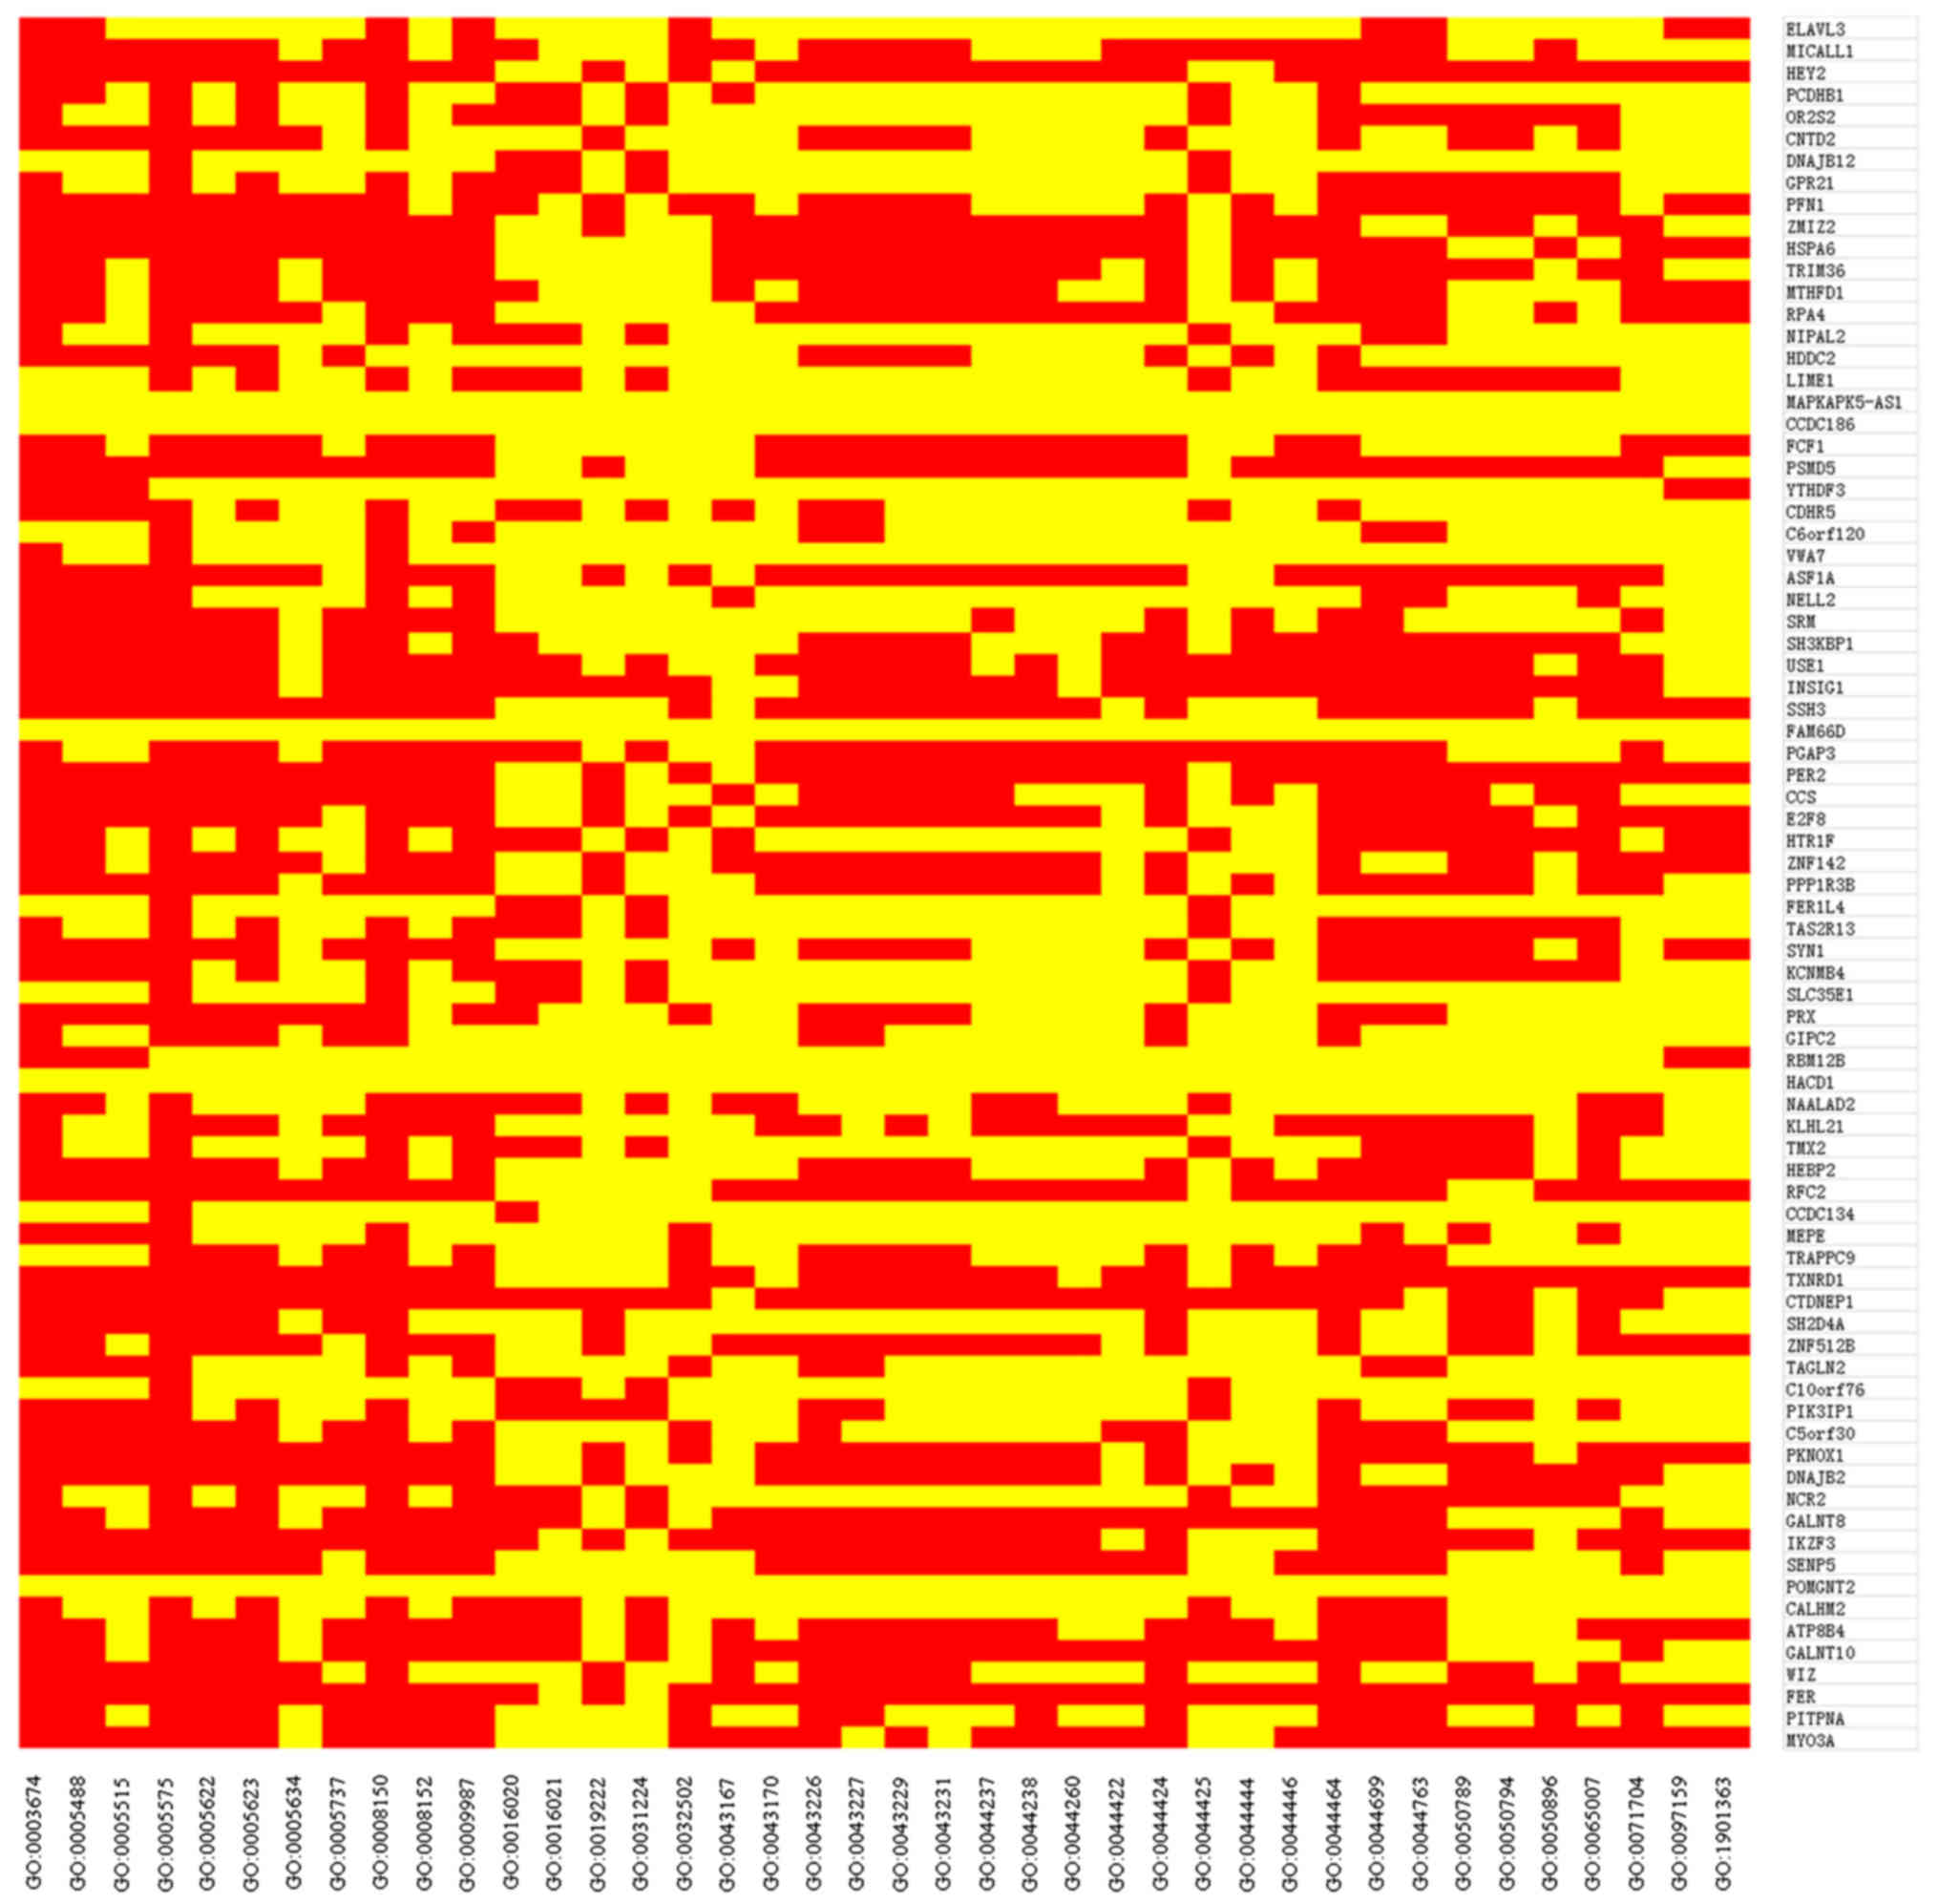
= 66). Furthermore, we calculated the DEGs by expressing the
spectral data. According to the GO enrichment analysis, the
enrichment of 79 DEGs in background GO terms was obtained (28). DEG annotated to a GO term, and if the
gene is present in the GO term, the value is 1 (red), otherwise 0
(yellow). Finally, the heatmap was obtained from the heatmap
package in the R language to analyze the above enrichment situation
(Fig. 1). The result of this heatmap
was in accordance with Table II.
Ultimately, the background GO terms were the gene sets used.
| Table II.Gene sets for progressive diabetic
neuropathy (PDN). |
Table II.
Gene sets for progressive diabetic
neuropathy (PDN).
| GO ID | GO term | Counts | GO ID | GO term | Counts |
|---|
| GO:0005575 | Cellular
component | 71 | GO:0008152 | Metabolic
process | 36 |
| GO:0008150 | Biological
process | 67 | GO:0071704 | Organic substance
metabolic process | 34 |
| GO:0003674 | Molecular
function | 66 | GO:0016020 | Membrane | 33 |
| GO:0005623 | Cell | 58 | GO:0044237 | Cellular metabolic
process | 33 |
| GO:0044464 | Cell part | 58 | GO:0044238 | Primary metabolic
process | 33 |
| GO:0009987 | Cellular
process | 57 | GO:0043170 | Macromolecule
metabolic process | 28 |
| GO:0005488 | Binding | 55 | GO:0044425 | Membrane part | 27 |
| GO:0044699 | Single-organism
process | 52 | GO:0044444 | Cytoplasmic
part | 27 |
| GO:0043226 | Organelle | 49 | GO:0044260 | Cellular
macromolecule metabolic process | 26 |
| GO:0044763 | Single-organism
cellular process | 49 | GO:0005634 | Nucleus | 25 |
| GO:0005622 | Intracellular | 47 | GO:0016021 | Integral component
of membrane | 25 |
| GO:0044424 | Intracellular
part | 47 | GO:0031224 | Intrinsic component
of membrane | 25 |
| GO:0043227 | Membrane-bounded
organelle | 46 | GO:0043167 | Ion binding | 24 |
| GO:0065007 | Biological
regulation | 43 | GO:0050896 | Response to
stimulus | 24 |
| GO:0043229 | Intracellular
organelle | 42 | GO:0044422 | Organelle part | 23 |
| GO:0005515 | Protein
binding | 41 | GO:0097159 | Organic cyclic
compound binding | 23 |
| GO:0043231 | Intracellular
membrane-bounded organelle | 40 | GO:1901363 | Heterocyclic
compound binding | 23 |
| GO:0050789 | Regulation of
biological process | 39 | GO:0044446 | Intracellular
organelle part | 22 |
| GO:0005737 | Cytoplasm | 38 | GO:0019222 | Regulation of
metabolic process | 21 |
| GO:0050794 | Regulation of
cellular process | 37 | GO:0032502 | Developmental
process | 21 |
CEM
With an attempt to investigate biological
correlations among DEGs, a CEM with 79 nodes and 3,081 interactions
were constructed based on the SCC, of which each interaction
possessed a weight value to reveal the interacted strength between
two genes. The weight distribution for interactions in this CEM
showed the characteristic of good adjacent matrix that weights on
its diagonal nearly equaled to 1, which suggested that the CEM had
a good network scale property. In particular, an edge between
C6orf120 and PGAP3 had the highest weight of 0.994.
Moreover, to further evaluate the activities of genes in
interactions of high weights, topological degree centrality
analysis was conducted on all nodes in the CEM. The results showed
that C6orf120 connected with 56 adjacent genes and thus had
the highest degree. Subsequently, an assortativity coefficient was
calculated to assess degree assortative mixing pattern extent.
Consequently, the assortativity coefficient for the CEM was 0.829,
indicating that the network had perfect assortative mixing
patterns.
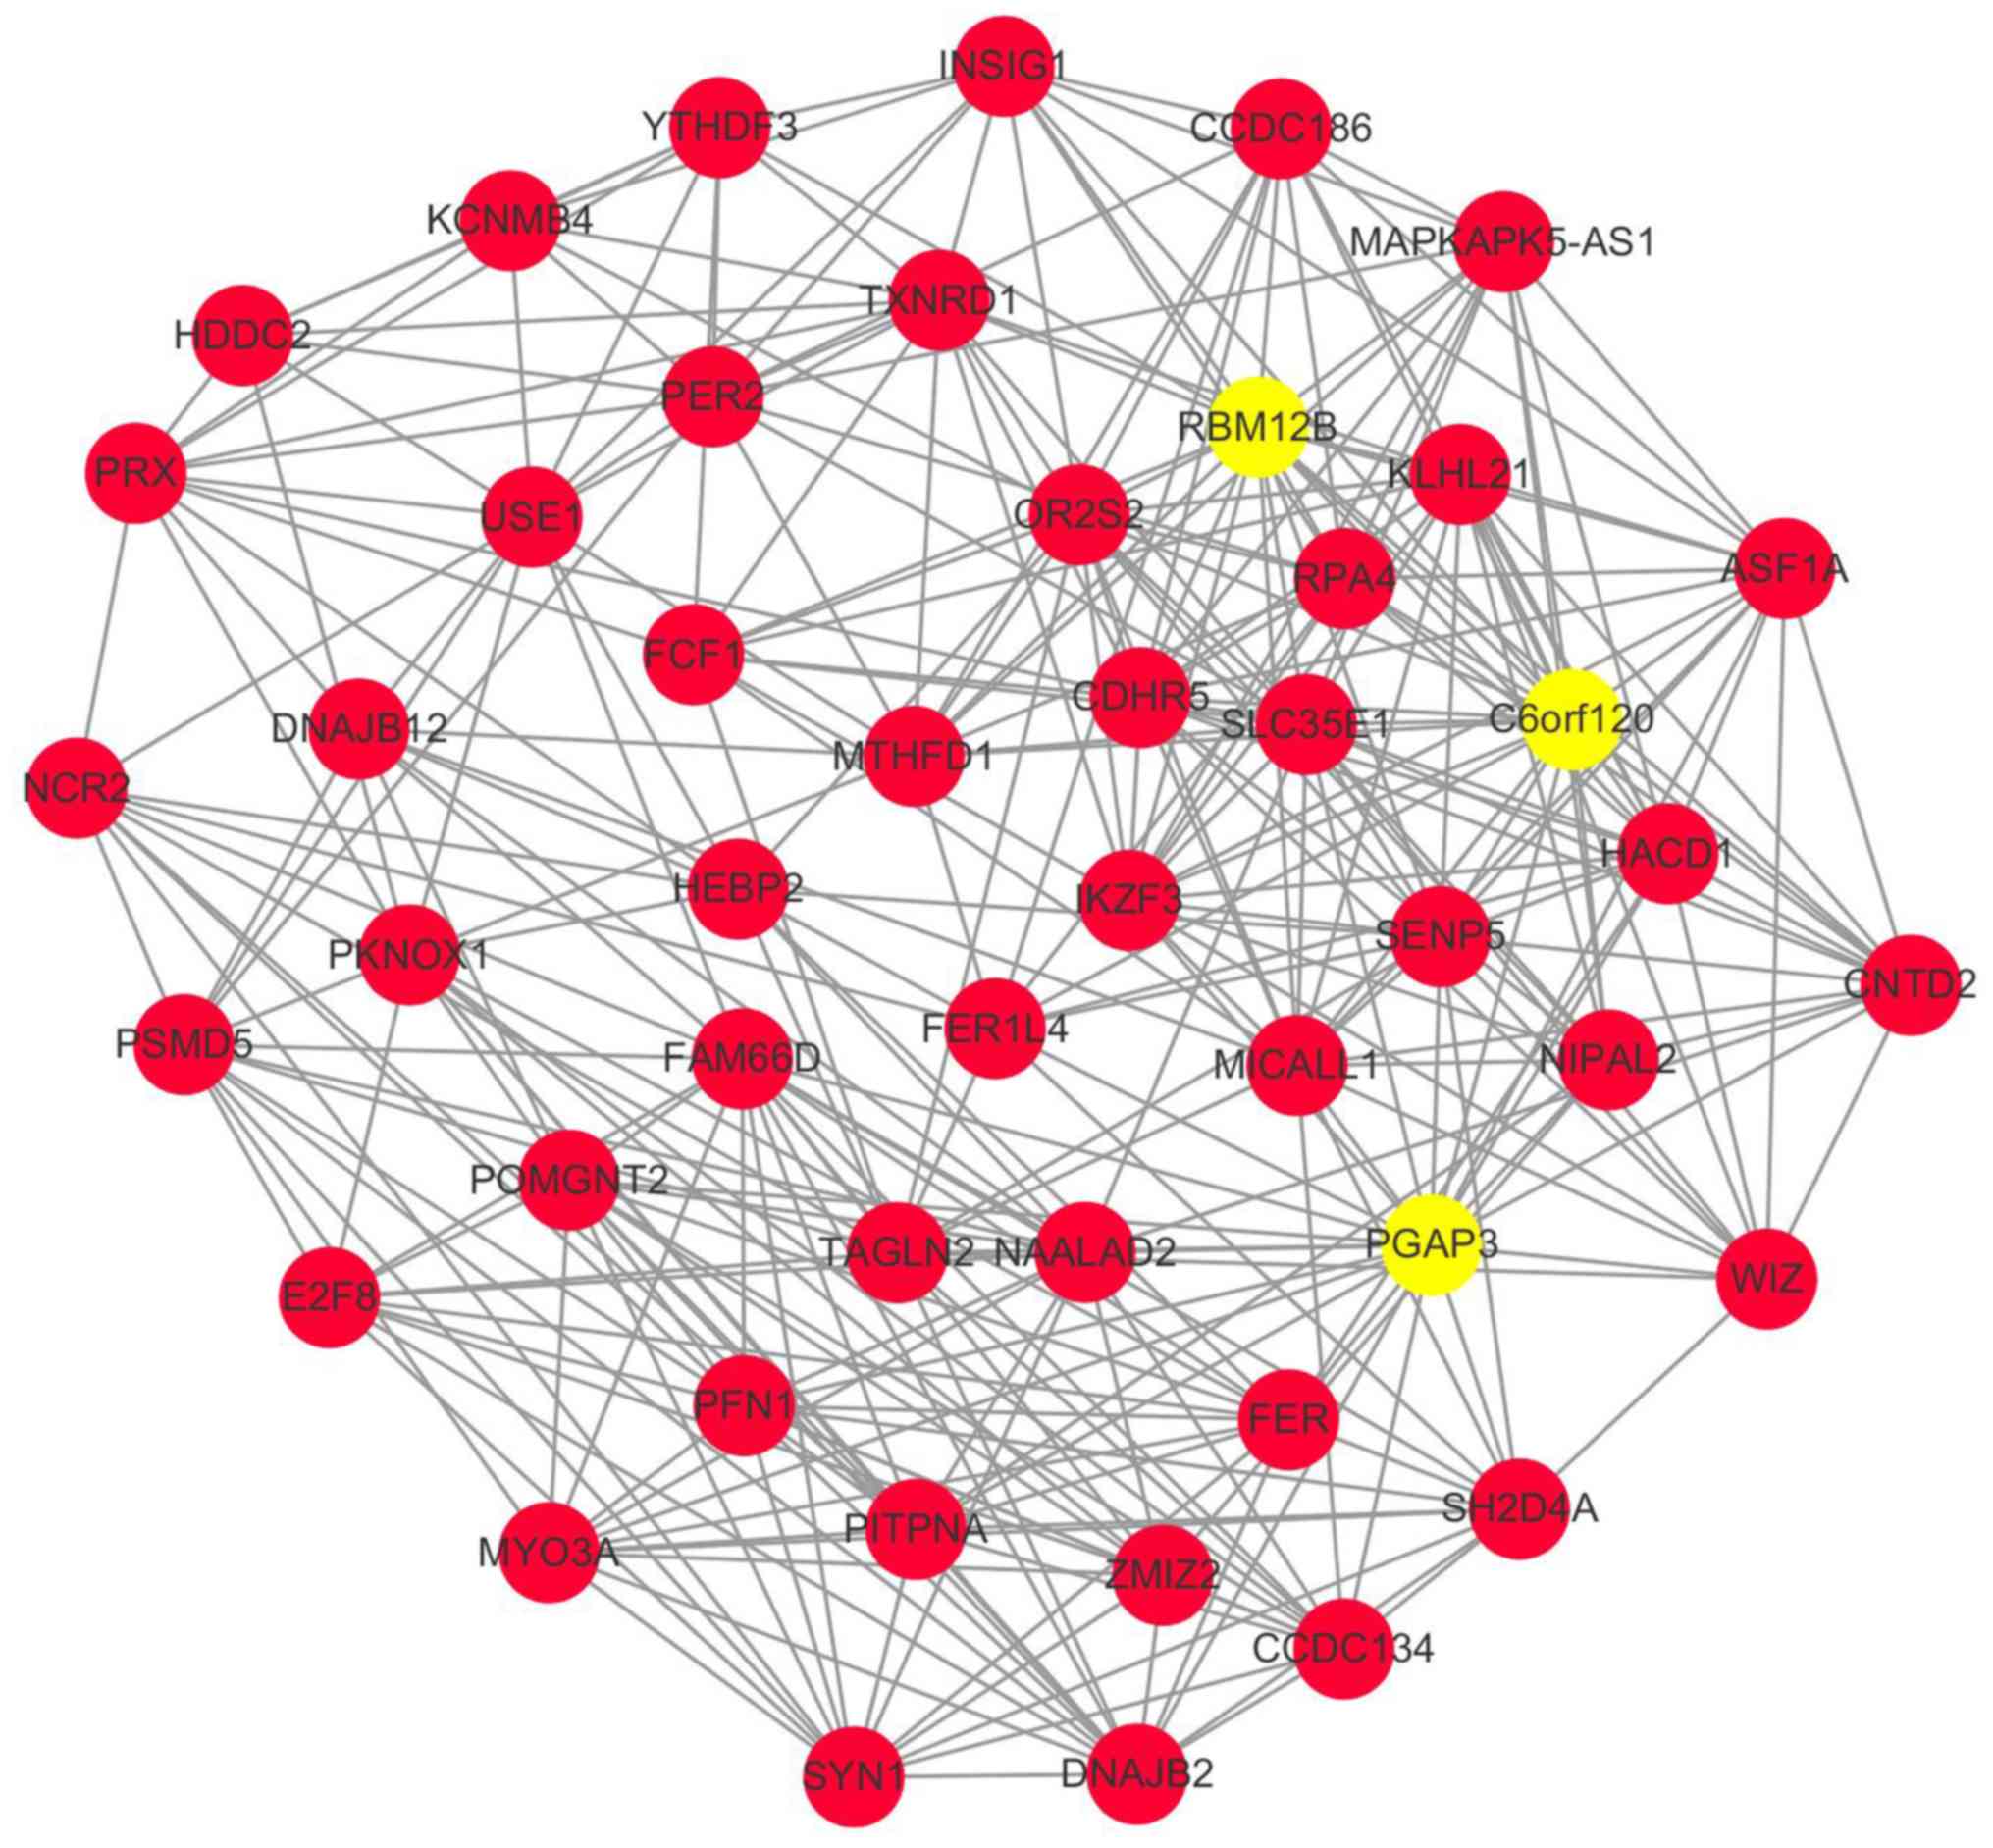
A sub-network was extracted from the CEM by
selecting those interactions with weight >0.8 and visualized it
by Cytoscape software (Fig. 2).
There were 48 nodes and 330 edges in the sub-network. Among these
nodes, PGAP3, C6orf120 and RBM12B had higher degree
than the others, which suggested their key roles in the PCN
patients and inferred that gene functions participated by them
might act as critical processes in progressors.
Seed gene functions
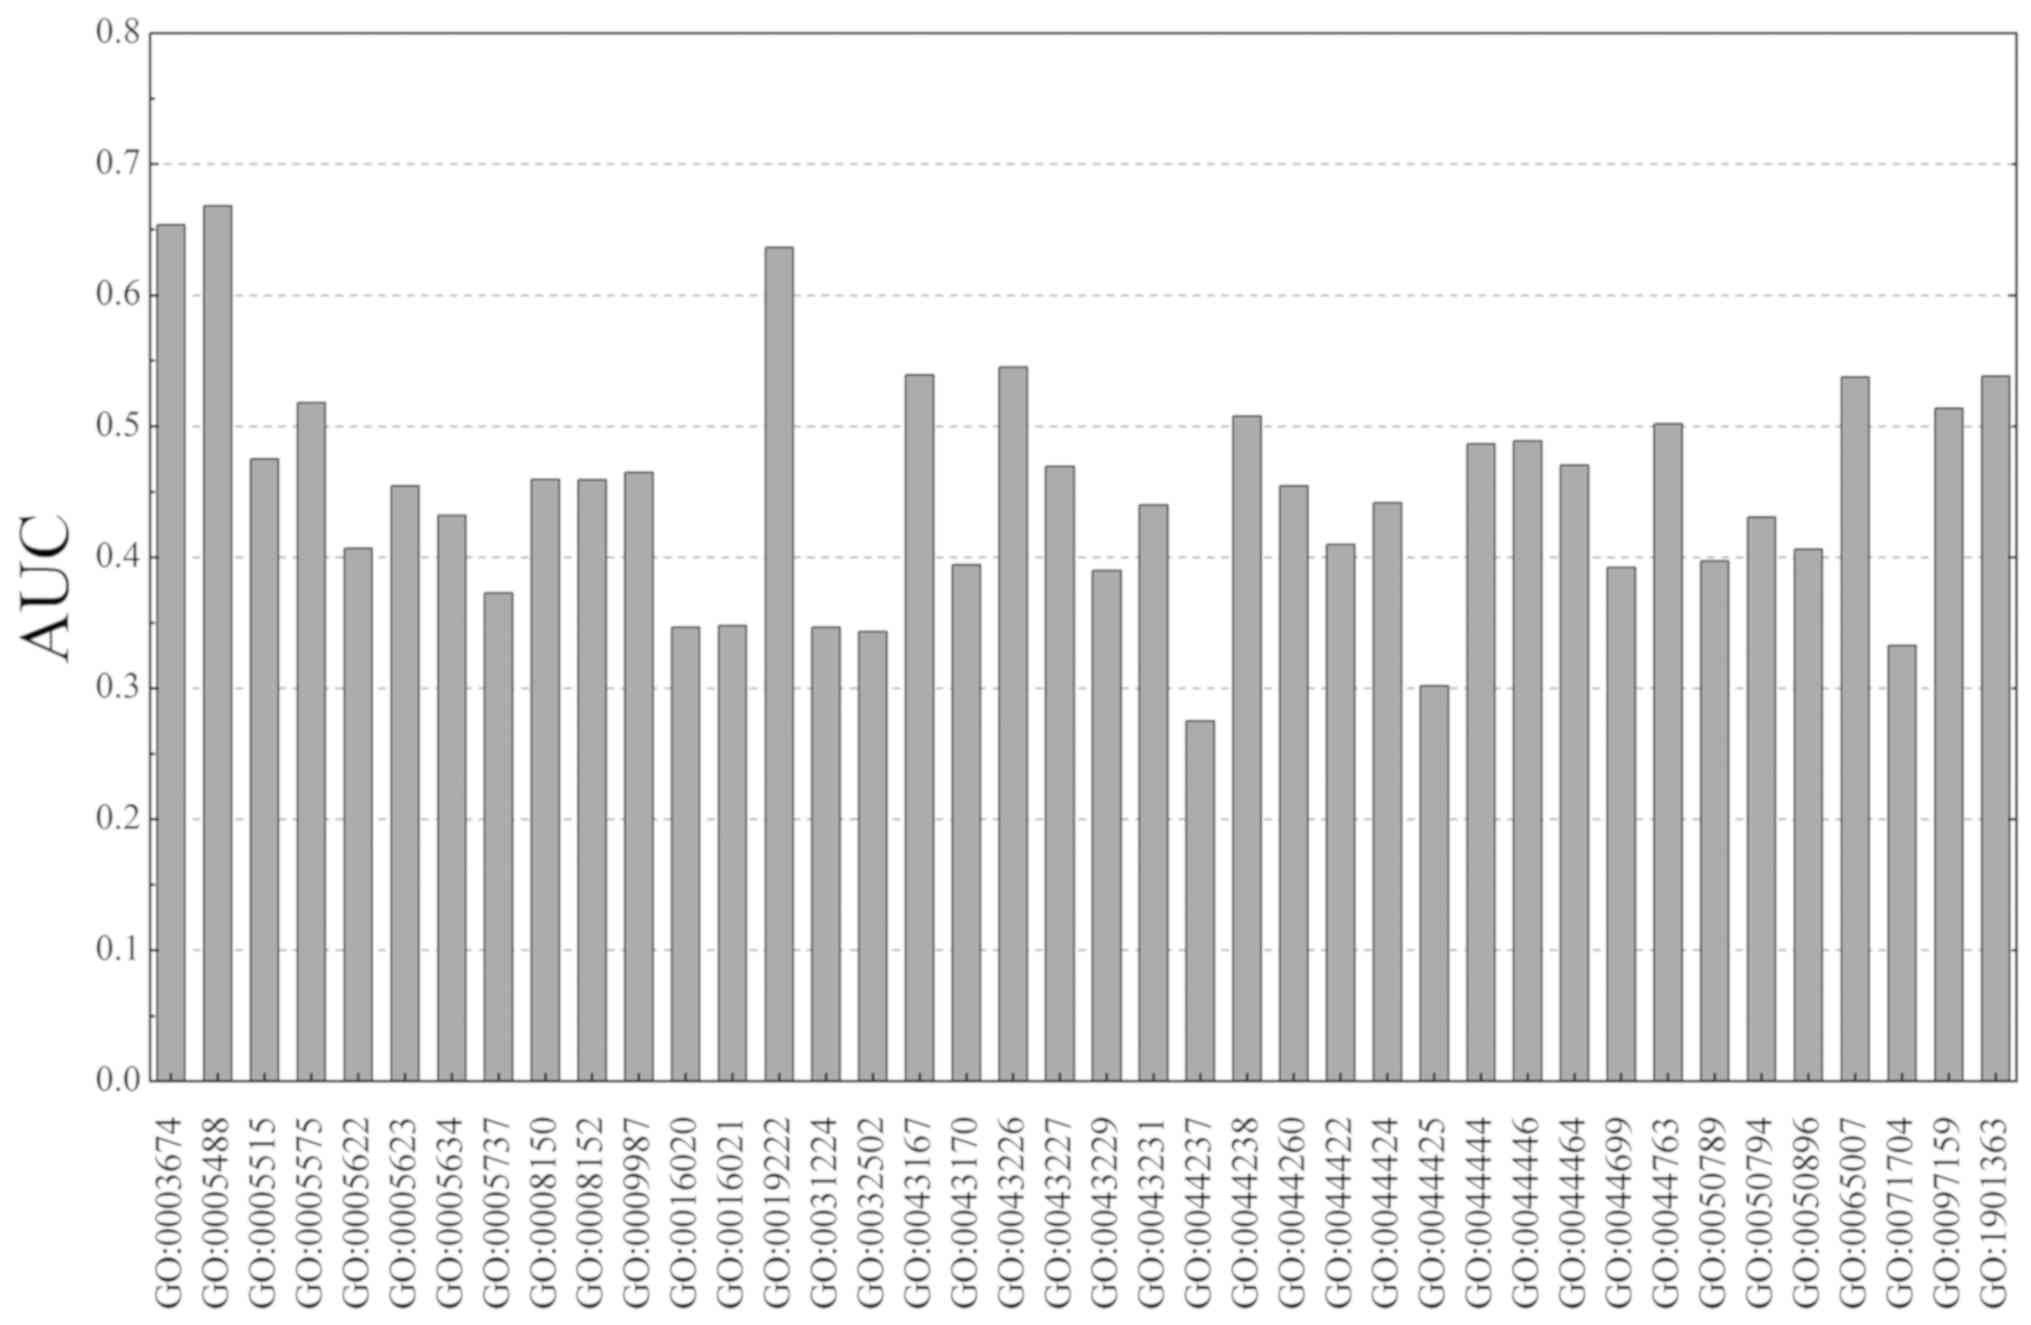
The AUC index was applied to evaluate the classified
performance on MF scores between progressors and non-progressors by
the 3-fold cross-validation. Generally, if an AUC for a gene or
process was >0.5, it could be used to classify the case group
from controls. In this report, the AUC for the 40 gene sets are
shown in Fig. 3. There were 11 GO
terms with AUC >0.5 in total. Thus, 11 of 40 (27.5%) gene sets
had a good classification performance between progressors and
non-progressors of DN. Among them, 3 with AUC >0.6 were
considered to be seed gene functions in progressors of DN. The seed
gene functions were Binding (GO:0005488, AUC=0.668), Molecular
function (GO:0003674, AUC=0.654), and Regulation of metabolic
process (GO:0019222, AUC=0.636).
Discussion
In the present study, we predicted seed gene
functions in PDN patients by using a network-based GBA method,
since the network-based approach systematically investigate the
molecular complexity of a particular disease (29) and identify potential signatures
through bio-molecular networks rather than individual genes
(30,31). An integration of co-expression
network and the GBA algorithm provide a new manner to predict
significant gene functions and reveal molecular mechanism
underlying PDN.
On the basis of SCC method, a CEM for progressors
was constructed on DEGs, and a sub-network of weight >0.8 was
extracted from the CEM. Interestingly, we found that PGAP3,
C6orf120 and RBM12B had high degree both in CEM and its
sub-network, which indicated their importance in progressors.
Taking RBM12B as an example, RBM12B (RNA binding
motif protein 12B) is a protein coding gene that relates to
functions of RNA binding, nucleic acid binding and nucleotide
binding (32). It has been
demonstrated that Rbm12b and Rbm3 are mainly
down-regulated and highly responsive to systemic hypoxia in mouse
developing brain and placenta (33).
This is the first time the key role of RBM12B in human PDN
patients was uncovered. In addition, in our study, this gene was
enriched in two seed gene functions, Binding and Molecular
function. The possible inference was that the dys-regulation of
RBM12B might disturb the normal functions of binding and
lead to brain injury, even lesions of the nervous system.
Particularly, a total of 40 background GO terms were
identified as gene sets for the current study. Subsequently, an MF
score was assigned to each gene in the specific gene set, and then
an AUC for each GO term was produced to assess the prediction
performance between progressors and non-progressors. In
consequence, 27.5% of all gene sets had a good classified
performance with AUC >0.5. Most significantly, 3 gene sets with
AUC >0.6 were denoted as seed gene functions for PDN, including
Binding, Molecular function and Regulation of metabolic process. It
is a common phenomenon that a given gene is present in one or more
molecular functions (such as RBM12B described above), and
two or more genes exhibit the same function.
Cameron et al reviewed that poor metabolic
control was one of microvascular complications correlated to DN
(34). Thus, it was important to
improve the metabolic conditions that led to the pathology
underlying peripheral DN, and the metabolic correction modified
symptom control and clinical results (35). Moreover, metabolic dysfunction in
experimental DN due to energy homeostasis and/or oxidative stress
is limited to the sciatic nerve (36). Above all, we might conclude various
metabolic processes play crucial roles in DP, and thus the
regulation of metabolic process has become informative in PDN
patients.
In summary, we have predicted 3 seed gene functions
for progressors of DP compared with non-progressors utilizing
network-based GBA algorithm. The findings provide insights to
reveal pathological and molecular mechanism underlying PDN.
However, the expression data used in this work was recruited from
the open access database, and the 3 seed gene functions still need
to be validated.
Acknowledgements
Not applicable.
Funding
No funding was received.
Availability of data and materials
The datasets used and/or analyzed during the current
study are available from the corresponding author on reasonable
request.
Authors' contributions
SSL and XBZ conceived the study and drafted the
manuscript. XBZ, JMT and HRW acquired the data. SSL and THW
analyzed the data and revised the manuscript. All the authors read
and approved the final manuscript.
Ethics approval and consent to
participate
Not applicable.
Patient consent for publication
Not applicable.
Competing interests
The authors declare that they have no competing
interests.
References
|
1
|
Edwards JL, Vincent AM, Cheng HT and
Feldman EL: Diabetic neuropathy: Mechanisms to management.
Pharmacol Ther. 120:1–34. 2008. View Article : Google Scholar : PubMed/NCBI
|
|
2
|
Sima AAF and Zhang W: Mechanisms of
diabetic neuropathy: Axon dysfunction. Handb Clin Neurol.
126:429–442. 2014. View Article : Google Scholar : PubMed/NCBI
|
|
3
|
Vinik AI, Nevoret ML, Casellini C and
Parson H: Diabetic neuropathy. Endocrinol Metab Clin North Am.
42:747–787. 2013. View Article : Google Scholar : PubMed/NCBI
|
|
4
|
Oyenihi AB, Ayeleso AO, Mukwevho E and
Masola B: Antioxidant strategies in the management of diabetic
neuropathy. BioMed Res Int. 2015:5150422015. View Article : Google Scholar : PubMed/NCBI
|
|
5
|
Charnogursky G, Lee H and Lopez N:
Diabetic neuropathy. Handb Clin Neurol. 120:773–785. 2014.
View Article : Google Scholar : PubMed/NCBI
|
|
6
|
Zhao J, Yang TH, Huang Y and Holme P:
Ranking candidate disease genes from gene expression and protein
interaction: A Katz-centrality based approach. PLoS One.
6:e243062011. View Article : Google Scholar : PubMed/NCBI
|
|
7
|
Good PJ: The role of elav-like genes, a
conserved family encoding RNA-binding proteins, in growth and
development. Semin Cell Dev Biol. 8:577–584. 1997. View Article : Google Scholar : PubMed/NCBI
|
|
8
|
Ogawa Y, Kakumoto K, Yoshida T, Kuwako KI,
Miyazaki T, Yamaguchi J, Konno A, Hata J, Uchiyama Y, Hirai H, et
al: Elavl3 is essential for the maintenance of Purkinje neuron
axons. Sci Rep. 8:27222018. View Article : Google Scholar : PubMed/NCBI
|
|
9
|
Ogawa Y, Yamaguchi J, Yano M, Uchiyama Y
and Okano HJ: Elavl3 regulates neuronal polarity through the
alternative splicing of an embryo-specific exon in AnkyrinG.
Neurosci Res. 135:13–20. 2018. View Article : Google Scholar : PubMed/NCBI
|
|
10
|
Reinecke JB, Katafiasz D, Naslavsky N and
Caplan S: Novel functions for the endocytic regulatory proteins
MICAL-L1 and EHD1 in mitosis. Traffic. 16:48–67. 2015. View Article : Google Scholar : PubMed/NCBI
|
|
11
|
Takahashi Y, Tanikawa C, Miyamoto T,
Hirata M, Wang G, Ueda K, Komatsu T and Matsuda K: Regulation of
tubular recycling endosome biogenesis by the p53-MICALL1 pathway.
Int J Oncol. 51:724–736. 2017. View Article : Google Scholar : PubMed/NCBI
|
|
12
|
Miao L, Li J, Li J, Tian X, Lu Y, Hu S,
Shieh D, Kanai R, Zhou BY, Zhou B, et al: Notch signaling regulates
Hey2 expression in a spatiotemporal dependent manner during cardiac
morphogenesis and trabecular specification. Sci Rep. 8:26782018.
View Article : Google Scholar : PubMed/NCBI
|
|
13
|
Chen FZ, Zhao Y and Chen HZ: MicroRNA-98
reduces amyloid β-protein production and improves oxidative stress
and mitochondrial dysfunction through the Notch signaling pathway
via HEY2 in Alzheimer's disease mice. Int J Mol Med. 43:91–102.
2019.PubMed/NCBI
|
|
14
|
Gillis J and Pavlidis P: The impact of
multifunctional genes on ‘guilt by association’ analysis. PLoS One.
6:e172582011. View Article : Google Scholar : PubMed/NCBI
|
|
15
|
Chua HN, Sung WK and Wong L: Exploiting
indirect neighbours and topological weight to predict protein
function from protein-protein interactions. Bioinformatics.
22:1623–1630. 2006. View Article : Google Scholar : PubMed/NCBI
|
|
16
|
Yip AM and Horvath S: Gene network
interconnectedness and the generalized topological overlap measure.
BMC Bioinformatics. 8:222007. View Article : Google Scholar : PubMed/NCBI
|
|
17
|
Weston AD and Hood L: Systems biology,
proteomics, and the future of health care: Toward predictive,
preventative, and personalized medicine. J Proteome Res. 3:179–196.
2004. View Article : Google Scholar : PubMed/NCBI
|
|
18
|
Peña-Castillo L, Tasan M, Myers CL, Lee H,
Joshi T, Zhang C, Guan Y, Leone M, Pagnani A, Kim WK, et al: A
critical assessment of Mus musculus gene function prediction using
integrated genomic evidence. Genome Biol. 9 (Suppl 1):S22008.
View Article : Google Scholar
|
|
19
|
Hur J, Sullivan KA, Pande M, Hong Y, Sima
AA, Jagadish HV, Kretzler M and Feldman EL: The identification of
gene expression profiles associated with progression of human
diabetic neuropathy. Brain. 134:3222–3235. 2011. View Article : Google Scholar : PubMed/NCBI
|
|
20
|
Wiggin TD, Sullivan KA, Pop-Busui R, Amato
A, Sima AAF and Feldman EL: Elevated triglycerides correlate with
progression of diabetic neuropathy. Diabetes. 58:1634–1640. 2009.
View Article : Google Scholar : PubMed/NCBI
|
|
21
|
Consortium GO; Gene Ontology Consortium, :
Gene Ontology Consortium: Going forward. Nucleic Acids Res. 43(D1):
D1049–D1056. 2015. View Article : Google Scholar : PubMed/NCBI
|
|
22
|
Gillis J and Pavlidis P: The role of
indirect connections in gene networks in predicting function.
Bioinformatics. 27:1860–1866. 2011. View Article : Google Scholar : PubMed/NCBI
|
|
23
|
Ritchie ME, Phipson B, Wu D, Hu Y, Law CW,
Shi W and Smyth GK: limma powers differential expression analyses
for RNA-sequencing and microarray studies. Nucleic Acids Res.
43:e472015. View Article : Google Scholar : PubMed/NCBI
|
|
24
|
Datta S, Satten GA, Benos DJ, Xia J,
Heslin MJ and Datta S: An empirical bayes adjustment to increase
the sensitivity of detecting differentially expressed genes in
microarray experiments. Bioinformatics. 20:235–242. 2004.
View Article : Google Scholar : PubMed/NCBI
|
|
25
|
Reiner A, Yekutieli D and Benjamini Y:
Identifying differentially expressed genes using false discovery
rate controlling procedures. Bioinformatics. 19:368–375. 2003.
View Article : Google Scholar : PubMed/NCBI
|
|
26
|
Szmidt E and Kacprzyk J: The Spearman rank
correlation coefficient between intuitionistic fuzzy sets. 2010 5th
IEEE International Conference Intelligent Systems. IEEE; London:
pp. 276–280. 2010, View Article : Google Scholar
|
|
27
|
Huang J and Ling CX: Using AUC and
accuracy in evaluating learning algorithms. Knowledge and Data
Engineering. IEEE Trans. 17:299–310. 2005.
|
|
28
|
Zhu Q, Sun Y, Zhou Q, He Q and Qian H:
Identification of key genes and pathways by bioinformatics analysis
with TCGA RNA sequencing data in hepatocellular carcinoma. Mol Clin
Oncol. 9:597–606. 2018.PubMed/NCBI
|
|
29
|
Barabási AL, Gulbahce N and Loscalzo J:
Network medicine: A network-based approach to human disease. Nat
Rev Genet. 12:56–68. 2011. View
Article : Google Scholar : PubMed/NCBI
|
|
30
|
Liu ZP, Wang Y, Zhang XS and Chen L:
Network-based analysis of complex diseases. IET Syst Biol. 6:22–33.
2012. View Article : Google Scholar : PubMed/NCBI
|
|
31
|
Chen L, Wang RS and Zhang XS:
Reconstruction of gene regulatory networks. In: Biomolecular
Networks: Methods and Applications in Systems Biology. John Wiley
& Sons Inc.; Hoboken, NJ: pp. 47–87. 2009
|
|
32
|
Zhang G, Bowling H, Hom N, Kirshenbaum K,
Klann E, Chao MV and Neubert TA: In-depth quantitative proteomic
analysis of de novo protein synthesis induced by brain-derived
neurotrophic factor. J Proteome Res. 13:5707–5714. 2014. View Article : Google Scholar : PubMed/NCBI
|
|
33
|
Trollmann R, Rehrauer H, Schneider C,
Krischke G, Huemmler N, Keller S, Rascher W and Gassmann M:
Late-gestational systemic hypoxia leads to a similar early gene
response in mouse placenta and developing brain. Am J Physiol Regul
Integr Comp Physiol. 299:R1489–R1499. 2010. View Article : Google Scholar : PubMed/NCBI
|
|
34
|
Cameron NE, Eaton SEM, Cotter MA and
Tesfaye S: Vascular factors and metabolic interactions in the
pathogenesis of diabetic neuropathy. Diabetologia. 44:1973–1988.
2001. View Article : Google Scholar : PubMed/NCBI
|
|
35
|
Miranda-Massari JR, Gonzalez MJ, Jimenez
FJ, Allende-Vigo MZ and Duconge J: Metabolic correction in the
management of diabetic peripheral neuropathy: Improving clinical
results beyond symptom control. Curr Clin Pharmacol. 6:260–273.
2011. View Article : Google Scholar : PubMed/NCBI
|
|
36
|
Freeman OJ, Unwin RD, Dowsey AW, Begley P,
Ali S, Hollywood KA, Rustogi N, Petersen RS, Dunn WB, Cooper GJ, et
al: Metabolic dysfunction is restricted to the sciatic nerve in
experimental diabetic neuropathy. Diabetes. 65:228–238.
2016.PubMed/NCBI
|