Introduction
Aplastic anemia (AA) is a type of acquired bone
marrow failure syndrome that is associated with a high mortality
rate. AA is characterized by the destruction of hematopoietic cells
by the immune system, which can lead to severe anemia and
pancytopenia (1,2). Bone marrow biopsy results in AA have
demonstrated that the bone cavity is filled with fat cells
following the destruction of hematopoietic cells. Thus, marrow fat
expansion may be another pathological factor of AA (3). However, the mechanism underlying the
increased bone fat in AA patients is currently not well
understood.
Bone marrow mesenchymal stem cells (MSCs) are a
group of homogeneous cells that can differentiate into adipocytes,
osteoblasts, chondrocytes, tendon cells and stellate nerve cells in
the appropriate microenvironment (4). Studies have reported that MSCs
synthesize and secrete various cytokines, including interleukin
(IL)-6, IL-11, granulocyte-macrophage colony-stimulating factor and
stem cell factor (5–7). In addition, MSCs interact with immune
cells and hematopoietic stem cells to ensure normal hematopoiesis
in the bone marrow. However, in AA patients, MSCs differentiate
abnormally, with induction to adipocytes but decreased
differentiation in osteoblasts, resulting in the conversation of
bone marrow into fat, as well as altered levels of various
hormonals, including leptin (5,8).
Leptin (LEP) is a circulating hormone that is mainly
secreted by adipose tissues, as well as a few other tissues and
cells, such as the placenta, gastric mucosa, skeletal muscle and
human mammary epithelial cells (9–11). LEP
functions through its interaction with the LEP receptor (LEP-R),
which is expressed in several cell types of the innate and adaptive
immunity systems, including MSCs, and dendritic, natural killer, T
and B cells (12). LEP has been
recognized as an important factor for modulating the immune
responses, as well as bone growth.
According to previous studies, LEP signaling is
involved in the differentiation of MSCs into osteoblasts or
adipogenic cells (13,14). A previous study reported a higher
level of LEP and a lower level of LEP-R in the plasma of AA
patients (15). Our preliminary data
identified the same tendency regarding the levels of LEP and LEP-R
in the bone marrow biopsy tissue (16). Thus, in the present study, AA model
mice were established to explore the role of LEP and LEP-R in the
differentiation of MSCs in AA. The results of the present study
offer a new perspective for the treatment of AA.
Materials and methods
Animals
A total of 70 BALB/c mice (male; weight, 18–25 g;
age, 7–10 weeks) were obtained from the Experimental Animal Center
of Hubei Province (Shiyan, China). Three model mice had infections
and one had a serious visceral hemorrhage; these mice were humanely
euthanized and removed from the study. Three mice (two in model
group and one in control) that were still alive on day 18 were
removed from the studies and they were excessive Therefore, only 63
BALB/c mice were assessed in the current study. A total of 10
C57BL/6 mice (male; weight, 25–30 g; age, 8–10 weeks) were obtained
from Hunan Silaike Jingda Laboratory Animal Co., Ltd. (China). The
mice were housed individually in a temperature- and
light-controlled room (21–23°C; 12-h light/dark cycle) under
specific pathogen-free conditions. The mice were maintained in
accordance with the Guide for the Care and the Use of Laboratory
Animals of the National Institutes of Health. All experiments using
mice were performed according to protocols approved by the Ethics
Committee of the Affiliated Hospital of Qingdao University
(Qingdao, China).
Induction of AA model and specimen
collection
The AA mouse model was developed by infusion of
lymph node (LN) cells obtained from C57BL/6 mice into the BALB/c
mice (17,18). A total of 70 BALB/c mice were
randomly divided into the control (n=7, including 1 extra mouse in
case of death during the experiments) and model (n=56, including
10% extra in case of death) groups. Mice in the model group were
induced into immune-mediated AA as reported (19). Briefly, mice were subjected to
whole-body exposure to a single dose of 4 Gy at a dose rate of 0.5
Gy/min using an X-ray irradiator system in well-ventilated vinyl
containers without anesthesia. After 6 h, AA was induced in the
model group through intraperitoneal injection with 1×10⁶
LN cells collected from C57BL/6 donors. After X-ray exposure, the
number of hematopoietic stem cells in bone marrow decreased and the
immune function was abnormal; this protocol was performed as
previously described (20). After
the donor lymphocytes were injected, the immune function was
disturbed, the distribution and function of T lymphocyte subgroups
were abnormal, and a large number of T cells were activated which
eventually induces T lymphocytes to attack hematopoietic cells,
inducing AA occurred; this protocol was performed as previously
described (21). The LN cells
included thymus, inguinal and axillary LN cells, which were
disaggregated, filtered through a 200-mesh nylon filter, and then
washed twice with phosphate-buffered saline (PBS) and lymphocyte
separation media. The control mice were sham-irradiated, and
received intraperitoneal injection of PBS and lymphocyte separation
media of the same volume.
Food intake and behavior of mice were observed every
day after LN cell infusion. Samples were randomly harvested from
the mice on days 0, 3, 6, 9, 12, 15 and 18 after LN cell infusion.
In total, 8 mice from the model group and 1 from the control group
were examined at each time point, resulting in a total number of 63
animals tested in the two groups. Prior to sample collection, mice
were fasted for 1 h, and then blood was collected from the
retro-orbital plexus under 2.5% isoflurane anesthesia, following
which mice were immediately euthanized by cervical dislocation.
Cardiac blood samples, as well as iliac and femur specimens that
were surgically dissected, were collected for further examination.
Each experiment was performed twice. The study experiments lasted
for ~1 month, with a preparation period of 2 days, an experimental
period of 18 days and index testing for approximately 10 days.
Complete blood count
Routine blood tests, including white blood cell
(WBC), red blood cell (RBC), hemoglobin (HB) and platelet (PLT)
counts, were assayed with the blood collected from the
retro-orbital plexus. An automatic biochemical analyzer (Sysmex
F-820 semi-automatic blood analyzer; Sysmex Corporation, Kobe,
Japan) was used for these tests, according to the manufacturer's
protocol.
Enzyme-linked immunosorbent assay
(ELISA)
Cardiac blood was centrifuged at 1,509.3 × g for 10
min at room temperature and the serum was extracted from the upper
layer. The serum concentrations of IL-2, IL-4, IL-5, interferon
(IFN)-γ, LEP and LEP-R were determined by ELISA using kits from BD
Biosciences (San Diego, CA, USA). Absorbance at 450 nm was measured
using a Wallac1420 Victor 3 reader (PerkinElmer, Inc., Wellesley,
MA, USA).
Flow cytometry analysis of lymphocyte
phenotype
Cardiac blood was used for lymphocyte phenotyping.
Briefly, the samples were digested and washed twice with PBS. Next,
approximately 1×10⁶ cells were incubated with 50 µl
fluorescein isothiocyanate (FITC)-conjugated anti-CD4 and
anti-CD8-phycoerythrin antibodies (cat. nos. 11-0341-81 and
11-0341-81, respectively; eBioscience; Thermo Fisher Scientific,
Inc., Waltham, MA, USA) for 30 min. Immediately after washing with
PBS, the cells were analyzed by flow cytometry using a FACS Calibur
flow cytometer (BD Biosciences).
Pathological observation of iliac bone
tissue
Iliac bone tissues from AA model and control mice
were fixed in 10% formalin at room temperature for 30 min.
Specimens were then decalcified, dehydrated, fixed with xylene at
room temperature for 1 h and embedded in paraffin. Next, the
tissues were cut into sections with a thickness of 3 µm, and
further deparaffinized with xylene and ethanol. Finally, the
sections were stained with hematoxylin-eosin (HE), and observed
under a Nikon ECLIPESEE600 light microscope and Nikon camera (Nikon
Corporation, Tokyo, Japan).
Immunohistochemical analysis
In the current study, the PV-9000 two-step
immunohistochemical method was used to evaluate LEP-R level in
slices of iliac bone tissue (22).
Briefly, paraffin-embedded sections were deparaffinized and
hydrated. Next, antigen retrieval was performed in 0.01 M citric
acid (pH 6.0), and the sections were then incubated with a 3%
H2O2 solution for 15 min at room temperature
to block endogenous peroxidase activity. Subsequently, the sections
were incubated with an anti-LEP-R antibody (cat. no. sc-8325;
1:150; Santa Cruz Biotechnology, Inc., Dallas, TX, USA) at 4°C
overnight in a humid environment, followed by incubation with a
horseradish peroxidase-labeled secondary antibody (cat. no.
PV-9000; 1:50; OriGene Technologies, Inc., Beijing, China) at room
temperature for 20 min. Then chromogenic agents from the DAB
chromogenic agent kit (Wuhan Boshide Biological Engineering Co.,
Ltd., Wuhan, China) were added to the sections. Finally, the
sections were counterstained with Harris hematoxylin, dehydrated
and sealed. Positive LEP-R expression was noted when the membrane
presented brown-yellow staining. Sections were observed under a
light microscope, and the integral optical density (IOD) of each
field was measured with Image-ProPlus analysis software (version
6.0; Media Cybernetics, Inc., Rockville, MD, USA). The mean IOD
value of five fields is reported as the IOD of the section.
MSC isolation, flow cytometry and
reverse transcription- quantitative polymerase chain reaction
(RT-qPCR)
Bone marrow-derived MSCs were obtained on days 0, 3,
6, 9, 12, 15 and 18 after injection of LN cells. The MSCs were
isolated from the bone marrow of left and right femur specimens
according to the following procedure: Briefly, the femurs were
broken, and bone marrow cells were shocked several times with
serum-free Dulbecco's modified Eagle's medium-low glucose (Gibco;
Thermo Fisher Scientific, Inc.) to collect the bone marrow fluid.
Next, the cells were mixed with a syringe needle, and the cell
suspension was aspirated into a centrifuge tube with a sterile
pipette and centrifuged at 2,675 × g at room temperature for 5 min,
following which the supernatant was discarded. The rest of the bone
marrow cell samples (1–2 ml) were diluted to 1:1 with RPMI-1640
medium (Gibco; Thermo Fisher Scientific, Inc.) containing 10% fetal
bovine serum (Gibco; Thermo Fisher Scientific, Inc.) and layered
over Ficoll-Paque solution (Haoyang Biotechnology Co. Ltd.,
Tianjin, China). Cells were subsequently centrifuged at 267 × g for
10 min at room temperature. Then, they were placed in an 3 ml
lymphocyte separation fluid (Haoyang Biotechnology Co. Ltd.,
Tianjin, China) and centrifuged at 2,675 × g at room temperature
for 5 min. The milky white layer at the junction of the separator
and the cell suspension was obtained as it contained the
mononuclear cells. PBS was added to the mononuclear cells, which
were then centrifugation at 267 × g for 10 min at room temperature,
and then they were washed twice with PBS. As MSCs adhere in
vitro, RPMI-1640 medium was completely replaced and
non-adherent cells, which were not considered to be MSCs, were
removed after 3 days. When 80–85% confluence was reached, the
adherent cells were detached by treatment with 0.125% trypsin and
0.1% EDTA (Sigma-Aldrich; Merck KGaA, Darmstadt, Germany), and
replanted at a 1:2 dilution under the same culture conditions. At
passage 4, adherent cells were identified by surface markers, using
PE-conjugated CD29 (cat. no. 12-0291), CD44 (cat. no. 12-0441),
CD34 (cat. no. 12-0349) and CD45 (cat. no. 12-0451) monoclonal
antibodies (all 1:100; eBioscience; Thermo Fisher Scientific, Inc.)
that were incubated for 30 min at room temperature in the dark;
cells were then analyzed using a FACScan flow cytometer (BD
Biosciences).
Subsequent to 4–5 passages, the MSCs were detached,
and total RNA was extracted with the RNeasy Mini kit (Qiagen)
according to the manufacturer's protocol. Prior to processing, RNA
samples were treated with DNase I. Next, qPCR was performed using
an ABI PRISM 7700 system (Applied Biosystems; Thermo Fisher
Scientific, Inc.). The concentration of RNA was measured by a
spectrophotometer. Reverse transcription was performed using cDNA
First Chain Synthesis kit (Fermentas; Thermo Fisher Scientific,
Inc.). The thermocycling conditions were as follows: 1 cycle of
50°C for 2 min and 95°C for 10 min, followed by 40 cycles of 95°C
for 30 sec and 60°C for 30 sec. The data was analyzed with
2−ΔΔCt (23). The primers
used for β-actin, LEP, LEP-R, CCAAT/enhancer-binding protein
(C/EBP)α, peroxisome proliferator-activated receptor γ (PPARγ) and
runt-related transcription factor 2 (Runx2) are listed in Table I.
 | Table I.Primers of reverse
transcription-quantitative PCR. |
Table I.
Primers of reverse
transcription-quantitative PCR.
| Primers | Direction | Sequence
(5′-3′) | Size (bp) |
|---|
| β-actin | F |
CACGATGGAGGGGCCGGACTCATC | 240 |
|
| R |
TAAAGACCTCTATGCCAACACAG |
|
| LEP | F |
ACCCTGTGCGGATTCTTGTG | 147 |
|
| R |
GGAGGAGACTGACTGCGTGT |
|
| LEP-R | F |
ACATACTGTTACGGTTCTGG | 175 |
|
| R |
TAGCTTGTAATCACTGGGTG |
|
| C/EBPα | F |
CCACTTGCAGTTCCAGATCG | 239 |
|
| R |
CCACCGACTTCTTGGCTTTG |
|
| C/EBPβ | F |
CGCCATCGACTTCAGCCCCTAC | 133 |
|
| R |
CGGCTTCTTGCTCGGCTTGG |
|
| PPARγ | F |
TTTCAAGGGTGCCAGTTTCG | 169 |
|
| R |
CATCTTTATTCATCAGGGAGGC |
|
| Runx2 | F |
CTCTGGCCTTCCTCTCTCAG | 150 |
|
| R |
GTAGGTAAAGGTGGCTGGGT |
|
Statistical analysis
All data are expressed as the mean ± standard
deviation, and were analyzed using SPSS statistical software,
version 17.0 (SPSS, Inc., Chicago, IL, USA). Normal distribution
and homogeneity tests were used for measurement data. The results
of blood routine tests, serum concentrations (IL-2, IL-4, IL-5,
IFN-γ, LEP and LEP-R), lymphocyte phenotype, LEP-R expression in
iliac bone marrow and MSC-associated genes (LEP, LEP-R, C/EBPα,
PPARγ and Runx2) were compared between the control and model groups
using analysis of variance (parametric) or Kruskal-Wallis test
(non-parametric), as appropriate. Bivariate correlation analysis
with Pearson's correlation coefficient was used to explore the
direction and degree of the correlation between two factors.
Comparisons with a probability value of P<0.05 were considered
to be statistically significant.
Results
General state of mice
Mice in the control group exhibited no evident
decrease in activity or any other physical changes. Subsequent to
injection with the LN cells, mice in the model group exhibited
different degrees of weight loss, activity reduction, lassitude,
piloerection, eye closure and arched backs.
Identification of the AA model
Infusion of 1×10⁶ LN cells into BALB/c
mice induced pancytopenia. On average, the number of WBCs was
reduced by ~3-fold as compared with the count in control mice
(Fig. 1A). In addition, 0.5- to
3-fold reductions were observed in RBC count, HB level and PLT
count in the AA model mice (Fig.
1B-D). Analysis of the immune system function indicated that
the AA model mice had significantly higher serum IFN-γ and IL-2
levels at 3, 6, 9, 12, 15 and 18 days, and IL-2 levels were also
significantly higher at 0 day when compared with control mice
(P<0.05; Fig. 1E and F). By
contrast, serum IL-4 and IL-5 levels were significantly lower in AA
model mice in comparison with those in untreated mice (P<0.05;
Fig. 1G and H; Table II). The lymphocyte phenotype was
also examined, and as expected, the AA mice exhibited a greater
percentage of CD8+ T cells and reduced CD4+ T
cells in their bone marrow (Fig.
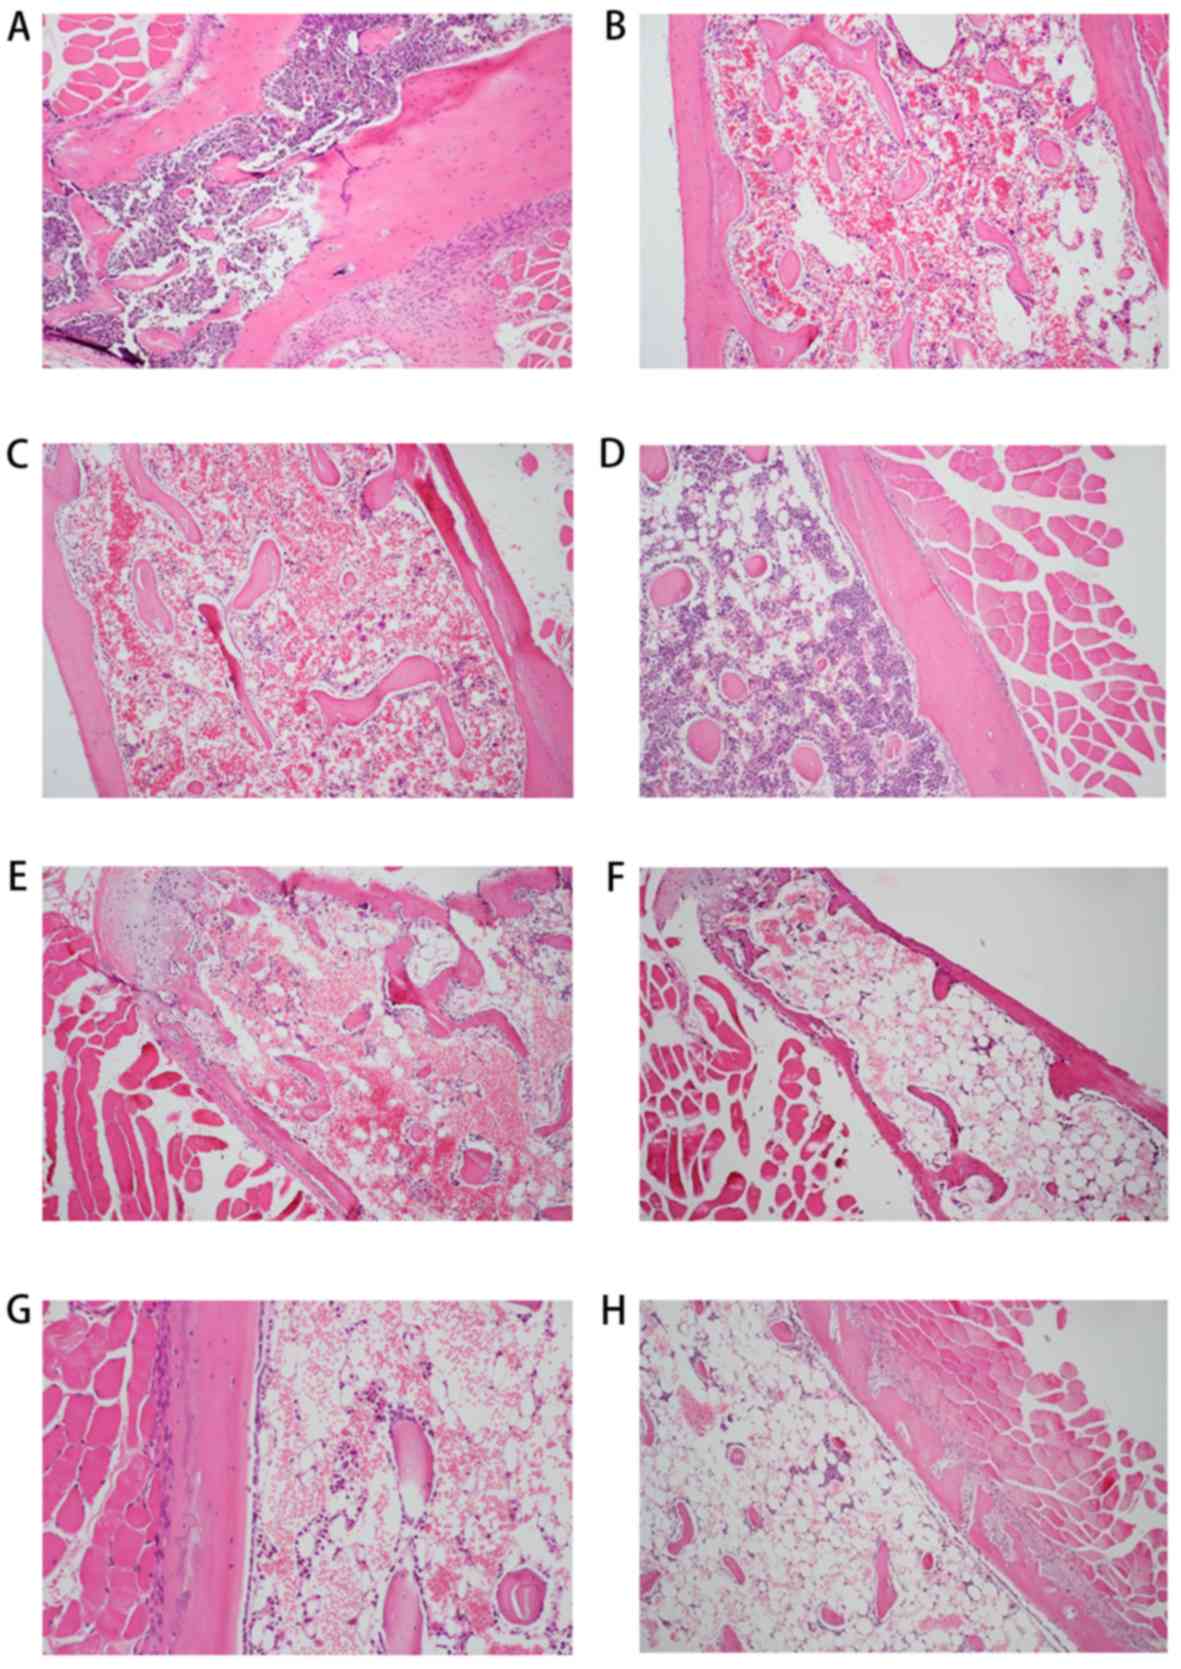
1I-K). Furthermore, histological examination of bone marrow
samples from the AA mice at 0, 3, 6, 9, 12, 15 and 18 days
(Fig. 2B-H) demonstrated various
degrees of hypocellularity and empty marrow replaced by globules of
fat when compared with the normal cellularity observed in control
mice (Fig. 2A).
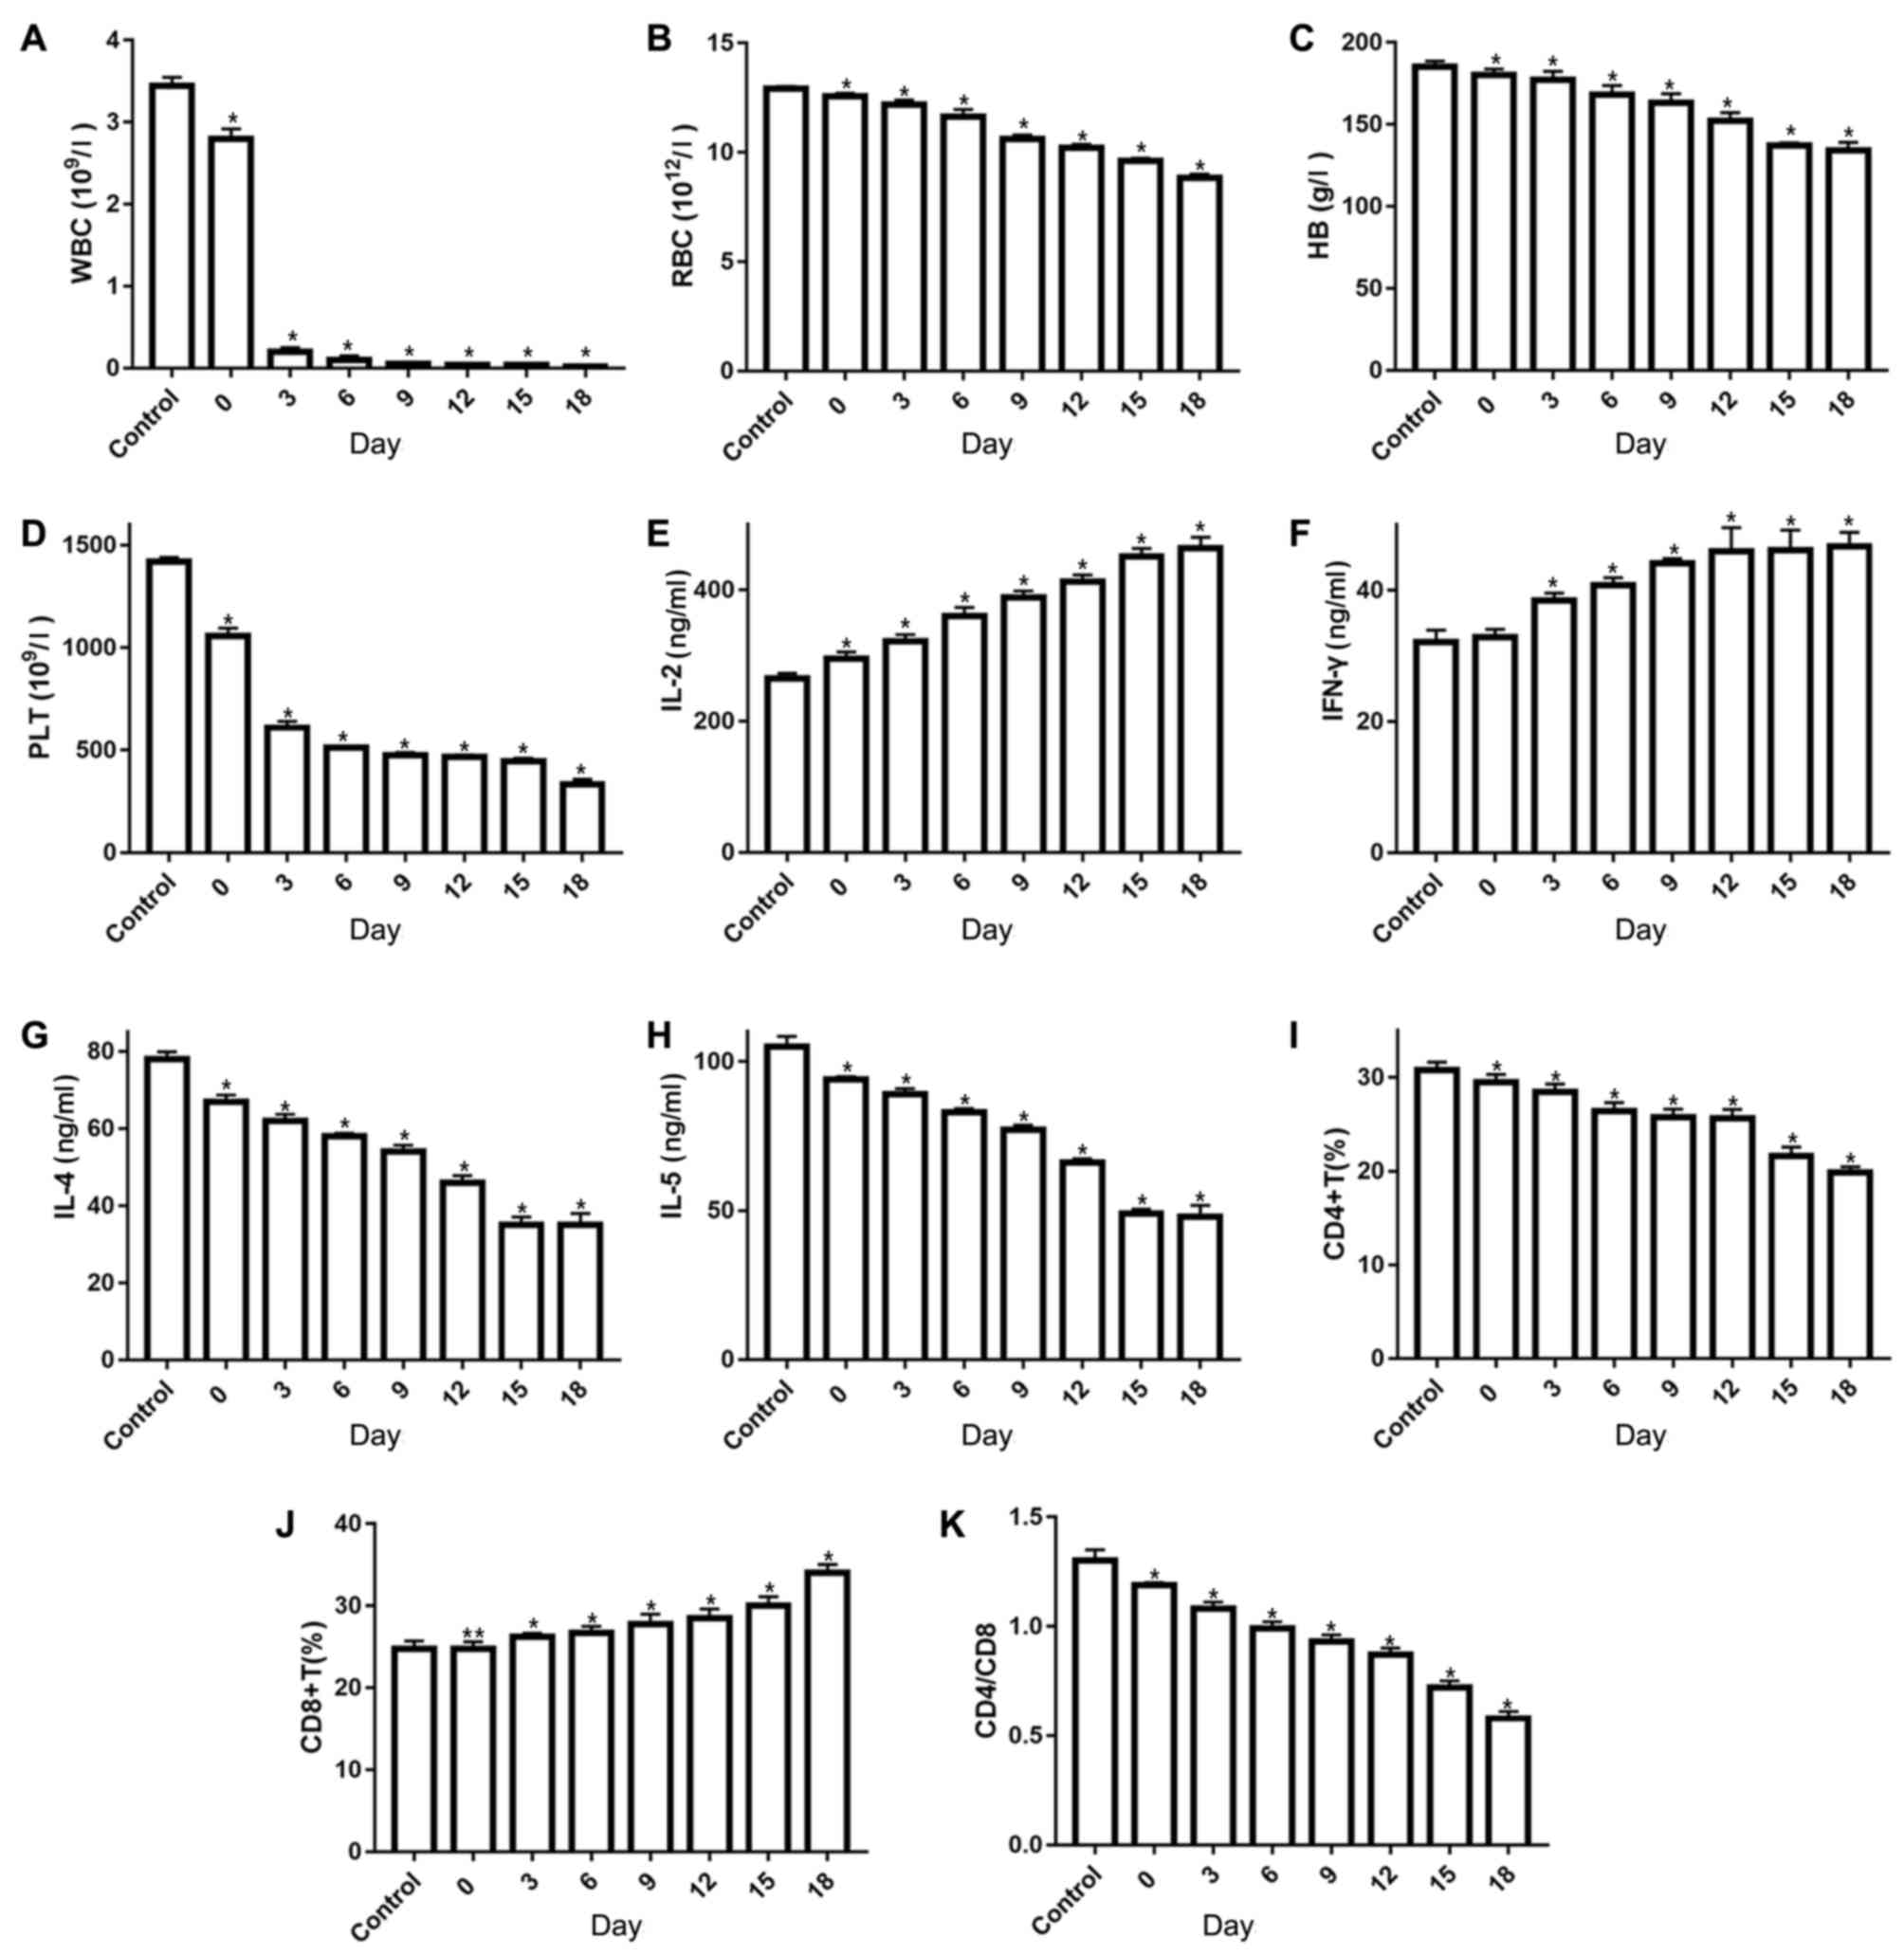 | Figure 1.Results of blood routine examination
and immune factor analyses in aplastic anemia mice and controls.
(A) WBC, (B) RBC, (C) HB and (D) PLT counts. (E) IL-2, (F) IFN-γ,
(G) IL-4 and (H) IL-5 serum levels were examined by ELISA. (I)
CD4+ T cell count and (J) CD8+ T cell count
were examined by flow cytometry. (K) The
CD4+/CD8+ ratio. *P<0.05 and **P<0.01.
WBC, white blood cell; RBC, red blood cell; HB, hemoglobin; PLT,
platelet; IL, interleukin; IFN, interferon. |
| Table II.Comparison of cytokine levels (ng/ml;
mean ± standard deviation) in different groups. |
Table II.
Comparison of cytokine levels (ng/ml;
mean ± standard deviation) in different groups.
| Group | n | IL-2 | IFN-γ | IL-4 | IL-5 |
|---|
| Control | 8 | 265.7±7.55 | 32.12±1.83 | 78.89±1.87 | 105.84±3.38 |
| Model |
|
|
|
|
|
| 0
days | 8 |
295.13±10.32a | 32.91±1.14 |
67.30±1.67a |
94.26±0.89a |
| 3
days | 8 |
322.56±9.74a |
38.49±1.11a |
62.68±1.61a |
89.31±1.92a |
| 6
days | 8 |
360.18±13.41a |
40.82±1.10a |
58.28±0.78a |
83.18±1.22a |
| 9
days | 8 |
389.40±9.49a |
44.10±0.76a |
54.87±1.64a |
77.48±1.58a |
| 12
days | 8 |
413.17±10.14a |
45.96±3.61a |
46.00±1.76a |
66.78±1.30a |
| 15
days | 8 |
451.06±12.38a |
46.14±3.04a |
35.73±2.10a |
49.48±1.43a |
| 18
days | 8 |
464.15±16.64a |
46.17±2.13a |
35.14±3.00a |
48.24±3.75a |
Expression of serum LEP (sLEP) and
serum soluble LEP-R (sLEP-R)
Following the injection of the cells, sLEP levels in
mice were significantly elevated in a time-dependent manner
compared with the levels in control mice, while sLEP-R levels were
markedly decreased (P<0.01; Table
III). In addition, as shown in Table IV, the changes in sLEP and sLEP-R
levels were closely associated with the changes in the levels of
immune factors and various indicators in the blood (P<0.01).
Changes in sLEP levels were negatively correlated with IL-2 and
IFN-γ, but positively correlated with other factors. Changes in
sLEP were positively correlated with IL-2 and IFN-γ (r>0),
whereas they were negatively corrected with other factors (r<0).
By contrast, sLEP-R was negatively corrected with IL-2 and IFN-γ,
and positively correlated with other factors (r<0).
| Table III.Comparison of sLEP and sLEP-R levels
using ELISA. |
Table III.
Comparison of sLEP and sLEP-R levels
using ELISA.
| Group | n | LEP (ng/ml) | sLEP-R (ng/ml) |
|---|
| Control | 8 | 4.16±0.05 | 7.47±0.10 |
| Model |
|
|
|
| 0
days | 8 |
4.33±0.13a |
7.04±0.10a |
| 3
days | 8 |
4.62±0.17a |
6.62±0.12a |
| 6
days | 8 |
5.19±0.12a |
6.25±0.13a |
| 9
days | 8 |
5.37±0.09a |
5.67±0.13a |
| 12
days | 8 |
5.79±0.12a |
4.98±0.16a |
| 15
days | 8 |
6.30±0.06a |
4.28±0.13a |
| 18
days | 8 |
6.33±0.29a |
4.18±0.10a |
| Table IV.Analysis of the association of LEP
and LEP-R levels with immune and blood indices. |
Table IV.
Analysis of the association of LEP
and LEP-R levels with immune and blood indices.
|
| LEP | LEP-R |
|---|
|
|
|
|
|---|
| Parameter | r-value | P-value | r-value | P-value |
|---|
| IL-2 | 0.973 | <0.01 | −0.974 | <0.01 |
| IFN-γ | 0.884 | <0.01 | −0.888 | <0.01 |
| IL-4 | −0.960 | <0.01 | 0.983 | <0.01 |
| IL-5 | −0.957 | <0.01 | 0.987 | <0.01 |
|
CD4+/CD8+ | −0.956 | <0.01 | 0.966 | <0.01 |
| WBC | −0.837 | <0.01 | 0.863 | <0.01 |
| RBC | −0.955 | <0.01 | 0.978 | <0.01 |
| HB | −0.934 | <0.01 | 0.959 | <0.01 |
| PLT | −0.824 | <0.01 | 0.821 | <0.01 |
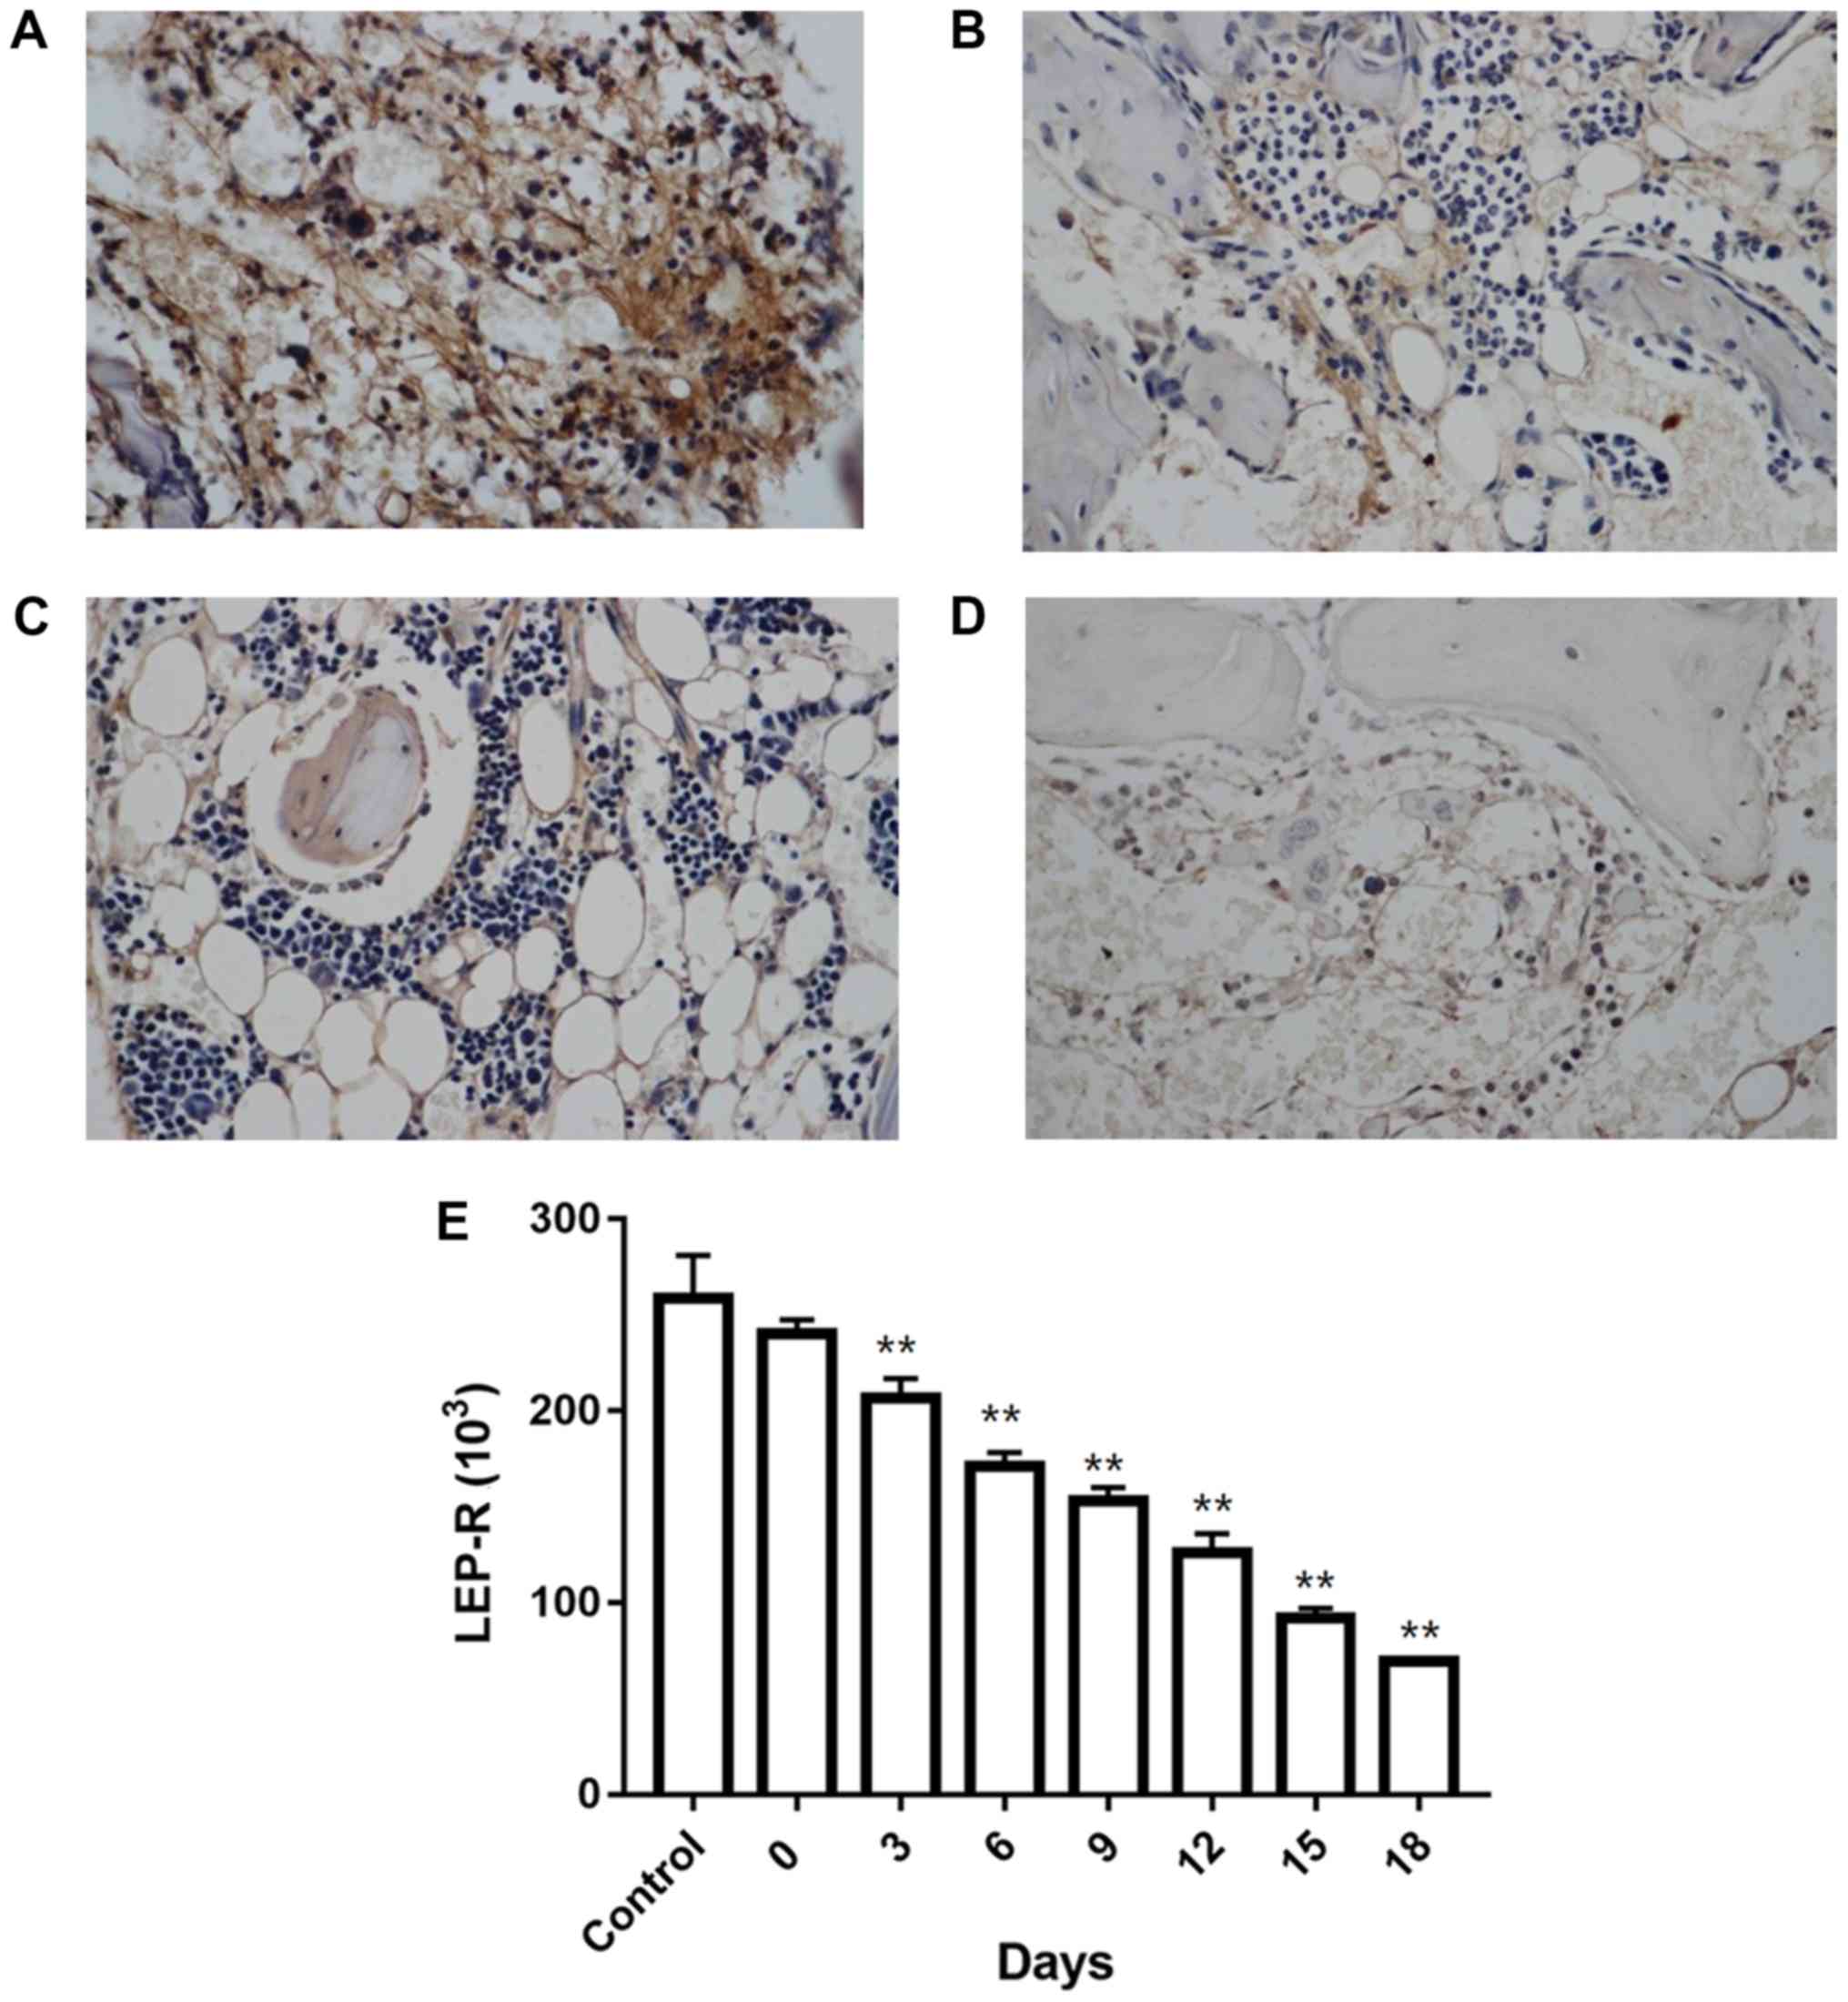
LEP-R levels in iliac bone marrow, as
measured by immunohistochemistry
Analysis of iliac bone marrow sections revealed
cytoplasmic localization of LEP-R with microgranular staining. All
samples examined were stained positive for LEP-R. In control mice,
homogeneous immunoreactivity was observed (Fig. 3A), whereas in the AA model mice, the
LEP-R distribution was heterogeneous (Fig. 3B-D), and LEP-R levels declined in a
time-depended manner (Fig. 3E;
Table V).
| Table V.LEP-R levels in iliac bone marrow
tissue. |
Table V.
LEP-R levels in iliac bone marrow
tissue.
| Group | n | LEP-R
(×103) |
|---|
| Control | 6 | 258.85±22.15 |
| Model |
|
|
| 0
days | 6 | 240.28±7.39 |
| 3
days | 6 |
206.80±10.15a |
| 6
days | 6 |
171.23±7.03a |
| 9
days | 6 |
153.74±6.66a |
| 12
days | 6 |
126.22±9.99a |
| 15
days | 6 |
91.93±5.25a |
| 18
days | 6 |
69.48±1.75a |
Expression levels of LEP, LEP-R,
C/EBPα, C/EBPβ, PPARγ and Runx2 genes in MSCs
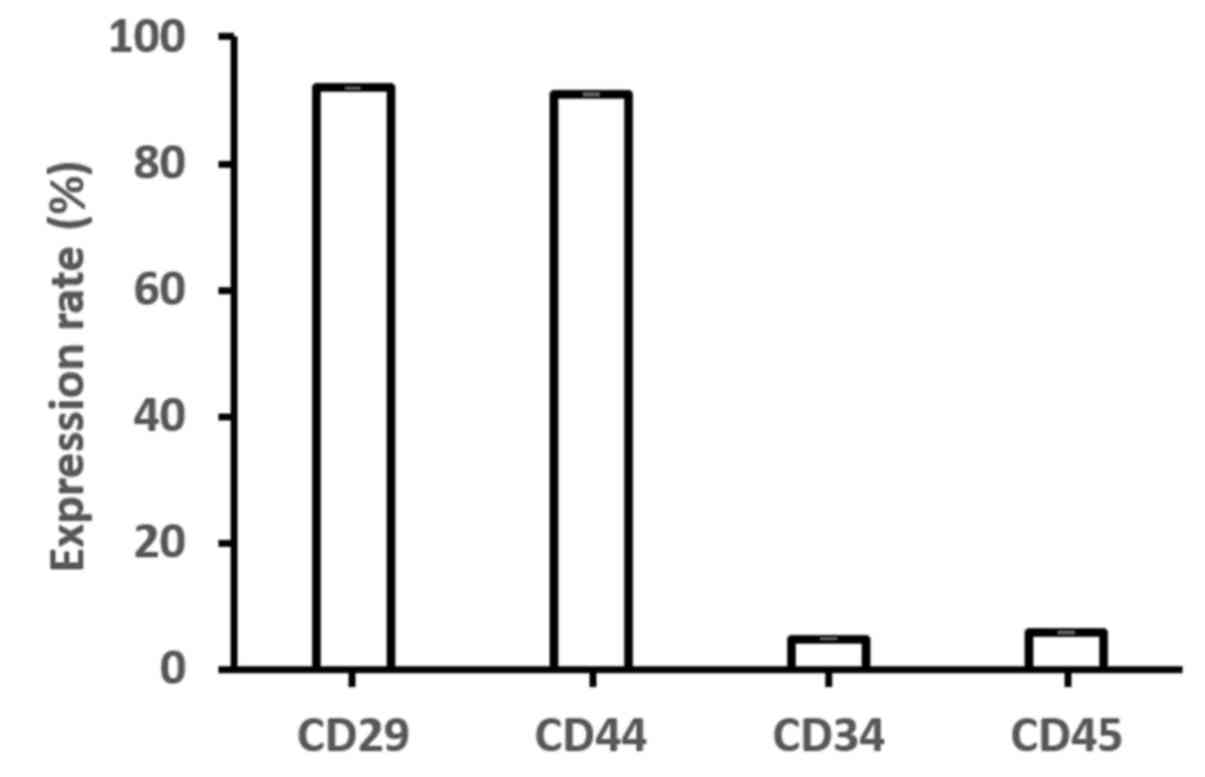
Bone marrow-derived MSCs were harvested at passage 4
to analyze their immunophenotype using flow cytometry. The
expression of CD29 (91.98±0.07%) and CD44 (90.98±0.11%) was
reported, whereas lack of CD34 (4.98±0.08%) and CD45 (5.97±0.09%)
expression was observed (Fig.
4).
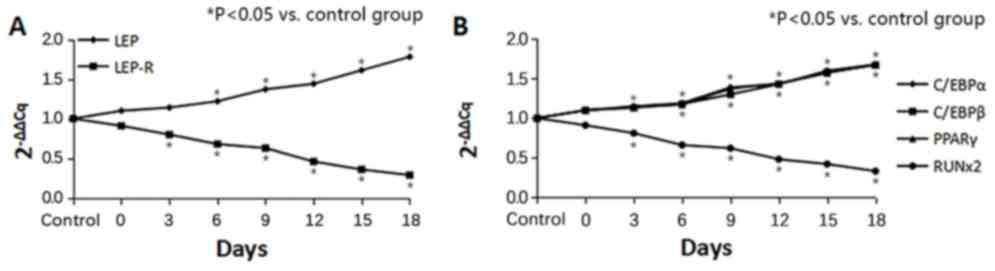
Furthermore, the expression levels of LEP, LEP-R,
C/EBPα, C/EBPβ, PPARγ and Runx2 genes in the bone marrow-derived
MSCs were examined. The LEP and LEP-R expression levels in MSCs
after infusion of LN cells are displayed in Fig. 5A. The MSC samples from all tested AA
model mice expressed high levels of LEP at 6, 9, 12, 15, 18 days
compared with the control group (P<0.01; Table VI). In contrast, injection with the
LN cells induced an evident decline in LEP-R levels at 3, 6, 9, 12,
15, 18 days compared with the control group (P<0.01; Table VII). In addition, the expression
levels of the adipogenic genes C/EBPα, C/EBPβ and PPARγ exhibited
gradual upward trends from day 6–18 (Tables VIII–X), while the expression of the osteogenic
gene Runx2 was significantly decreased at 3, 6, 9, 12, 15, 18 days
compared with the conςtrol (P<0.01; Fig. 5B; Table
XI). These results suggest that an increasing number of MSCs in
the bone marrow were converted to fat cells.
| Table VI.Leptin level in bone marrow
mesenchymal stem cells. |
Table VI.
Leptin level in bone marrow
mesenchymal stem cells.
| Group | n |
2−ΔΔCt | t-value | P-value |
|---|
| Control | 8 | 1.00 | – | – |
| Model |
|
|
|
|
| 0
days | 8 | 1.10 | 1.39 | 0.19 |
| 3
days | 8 | 1.14 | 2.65 | 0.07 |
| 6
days | 8 | 1.22 | 4.12 | <0.01 |
| 9
days | 8 | 1.37 | 8.25 | <0.01 |
| 12
days | 8 | 1.44 | 9.67 | <0.01 |
| 15
days | 8 | 1.61 | 14.72 | <0.01 |
| 18
days | 8 | 1.78 | 16.05 | <0.01 |
| Table VII.Leptin receptor level in bone marrow
mesenchymal stem cells. |
Table VII.
Leptin receptor level in bone marrow
mesenchymal stem cells.
| Group | n |
2−ΔΔCt | t-value | P-value |
|---|
| Control | 8 | 1.00 | – | – |
| Model |
|
|
|
|
| 0
days | 8 | 0.91 | −2.05 | 0.07 |
| 3
days | 8 | 0.80 | −5.87 | <0.01 |
| 6
days | 8 | 0.68 | −9.80 | <0.01 |
| 9
days | 8 | 0.63 | −9.60 | <0.01 |
| 12
days | 8 | 0.46 | −20.95 | <0.01 |
| 15
days | 8 | 0.36 | −24.11 | <0.01 |
| 18
days | 8 | 0.29 | −25.96 | <0.01 |
| Table VIII.CCAAT/enhancer-binding protein α gene
expression level in iliac bone marrow tissue. |
Table VIII.
CCAAT/enhancer-binding protein α gene
expression level in iliac bone marrow tissue.
| Group | n |
2−ΔΔCt | t-value | P-value |
|---|
| Control | 6 | 1.00 | – | – |
| Model |
|
|
|
|
| 0
days | 6 | 1.10 | 2.22 | 0.05 |
| 3
days | 6 | 1.15 | 2.81 | 0.02 |
| 6
days | 6 | 1.19 | 3.98 | <0.01 |
| 9
days | 6 | 1.39 | 5.64 | <0.01 |
| 12
days | 6 | 1.43 | 5.81 | <0.01 |
| 15
days | 6 | 1.60 | 9.00 | <0.01 |
| 18
days | 6 | 1.68 | 9.85 | <0.01 |
| Table X.Peroxisome proliferator-activated
receptor γ gene expression level in iliac bone marrow tissue. |
Table X.
Peroxisome proliferator-activated
receptor γ gene expression level in iliac bone marrow tissue.
| Group | n |
2−ΔΔCt | t-value | P-value |
|---|
| Control | 8 | 1.00 | – | – |
| Model |
|
|
|
|
| 0
days | 8 | 1.10 | 1.61 | 0.14 |
| 3
days | 8 | 1.14 | 1.79 | 0.10 |
| 6
days | 8 | 1.17 | 3.20 | 0.01 |
| 9
days | 8 | 1.37 | 5.26 | <0.01 |
| 12
days | 8 | 1.44 | 6.15 | <0.01 |
| 15
days | 8 | 1.57 | 9.05 | <0.01 |
| 18
days | 8 | 1.68 | 11.60 | <0.01 |
| Table XI.Runt-related transcription factor 2
gene expression level in iliac bone marrow tissue. |
Table XI.
Runt-related transcription factor 2
gene expression level in iliac bone marrow tissue.
| Group | n |
2−ΔΔCt | t-value | P-value |
|---|
| Control | 8 | 1.00 | – | – |
| Model |
|
|
|
|
| 0
days | 8 | 0.91 | −1.40 | 0.19 |
| 3
days | 8 | 0.81 | −4.64 | 0.01 |
| 6
days | 8 | 0.66 | −6.16 | <0.01 |
| 9
days | 8 | 0.62 | −6.97 | <0.01 |
| 12
days | 8 | 0.48 | −13.37 | <0.01 |
| 15
days | 8 | 0.42 | −11.85 | <0.01 |
| 18
days | 8 | 0.33 | −20.82 | <0.01 |
Correlation of LEP and LEP-R with the
expression of osteogenic and adipogenic genes
Based on bivariate correlation analysis with
Pearson's correlation coefficient, LEP levels were significantly
positively correlated with the expression levels of C/EBPα, C/EBPβ
and PPARγ (r>0; P<0.01), and negatively correlated with the
expression of Runx2 (r<0; P<0.01). By contrast, LEP-R
expression was negatively correlated with the expression of the
adipogenic genes (C/EBPα, C/EBPβ and PPARγ) and positively
correlated with the osteogenic gene Runx2 (P<0.01; Table XII).
| Table XII.Correlation analysis of LEP and LEP-R
expression on bone marrow mesenchymal stem cell surface with the
expression of osteogenic and adipogenic genes. |
Table XII.
Correlation analysis of LEP and LEP-R
expression on bone marrow mesenchymal stem cell surface with the
expression of osteogenic and adipogenic genes.
|
| LEP | LEP-R |
|---|
|
|
|
|
|---|
| Gene | r-value | P-value | r-value | P-value |
|---|
| C/EBPα | 0.780 | <0.01 | −0.840 | <0.01 |
| C/EBPβ | 0.810 | <0.01 | −0.869 | <0.01 |
| PPARγ | 0.779 | <0.01 | −0.828 | <0.01 |
| Runx2 | −0.870 | <0.01 | 0.947 | <0.01 |
Discussion
Abnormal immunity and damage to hematopoietic
stem/progenitor cells mediated by the immune system are major
factors in the pathogenesis of AA (24,25). In
the present study, an AA animal model was established by infusion
of LN cells into BALB/c mice, which was similar to
graft-versus-host disease (26). A
relatively low dosage of X-ray was used in the experiments of the
present study to ensure longer survival of mice. In our preliminary
experiments (data not shown), the X-ray dosages of 2.0, 4.0 and 6.0
Gy were assessed, and the dose of 4.0 Gy was finally selected since
this exposure caused a notable decrease in blood routine indices,
but fewer mice died from hematopenia. In further preliminary
experiments, normal mice were exposed to 4.0 Gy of X-ray radiation
alone, and the blood- and bone-associated indices were examined
after 10 days. It was observed that the general state, blood
routine results, LEP, LEP-R and bone marrow sections were not
significantly different from those of the control mice (P>0.05;
data are not shown). Thus, it can be inferred that 4.0-Gy X-ray
radiation may be suitable for modeling, without causing a marked
number of cells to die in the bone marrow.
The typical characteristics of AA, including severe
anemia and pancytopenia with decreased WBC, RBC, HB and PLT counts,
were observed in the present study after LN cell infusion (2). Activated CD8+ T cells and an
unbalanced CD4+/CD8+ ratio were also observed
in the AA mice. As expected, different degrees of changes in IL-2,
IL-4, IL-5 and IFN-γ levels were observed. These immune molecules
may comprise a cytokine network that damages hematopoietic
stem/progenitor cells, MSCs and angioblasts/endothelial progenitor
cells (4). Combined with the
histological alterations observed in bone sections, these results
indicate that BALB/c mice infused with LN cells truly mimicked the
pathological changes in AA, and are appropriate mouse models for
studying the underlying mechanism.
Fat conversion of bone marrow is common in patients
with AA, and fat cells are considered to fill the void left after
the destruction of hematopoietic cells. As described in earlier
studies, the process of adipogenesis competes with osteogenesis,
resulting in the differentiation of MSCs into adipocytes over
osteoblasts, with altered levels of various hormones, such as LEP
(27–29). It is well known that LEP is involved
in immune regulation, inflammatory responses and hematopoiesis.
More specifically, LEP can affect the development and maturation of
lymphocytes in bone marrow and inhibit the apoptosis of T and B
lymphocytes (30,31). Fernández-Riejos et al
(32) and Du et al (33) reported that LEP induce the
differentiation of T lymphocytes into T-helper 1 cells, which
produce increased IL-2 and IFN-γ. This is consistent with the
observations of the current study in AA patients, and suggests that
LEP not only regulates immune responses by directly acting on
mature immune cells in the peripheral blood, but also participate
in the regulation of hematopoiesis by affecting lymphoid and
granulocyte differentiation.
In the present study, it was observed that LEP
levels were increased and LEP-R levels were decreased in the
peripheral blood and bone marrow of the AA model mice. With the
gradual decline of bone marrow hematopoietic capacity, LEP levels
increased, and the changes in these two parameters were negatively
correlated. The gradual increase in LEP levels was positively
correlated with the transformation of T cells, suggesting that LEP
may aggravate immune damage (31,34). The
increase in LEP levels and the decreased in the
CD4+/CD8+ ratio were positive correlated,
which also suggests that LEP increased T cell function disorder
(35). LEP damage (30,33). The
increase in LEP levels and the decreased in the
CD4+/CD8+ ratio were positive correlated,
which also suggests that LEP increased T cell function disorder
(34). LEP can regulate fat
metabolism by promoting the osteogenic differentiation and
inhibiting the adipogenic differentiation of MSCs (36). Theoretically, the number of fat cells
in the bone marrow of the AA mice should be reduced by LEP;
however, in the bone marrow microenvironment of the AA mice, LEP
does not regulate the osteogenic and adipogenic differentiation of
MSCs. The present study also observed that LEP-R levels decreased
over time. Therefore, it can be speculated that the adipogenic
differentiation of MSCs was enhanced, and that LEP-R was destroyed
by immune injury or other causes, leading to increased LEP
levels.
The adipogenic differentiation of MSCs is regulated
by a sophisticated gene regulation mechanism. C/EBPβ, C/EBPα and
PPARγ participate in a regulatory cascade during adipogenesis, and
serve key roles in cell growth, differentiation and homeostasis
(37). Furthermore, RUNX2 is a
multifunctional transcription factor that controls skeletal
development by regulating chondrocyte and osteoblast
differentiation (38). In the
present study, overexpression of the adipogenic genes C/EBPβ,
C/EBPα and PPARγ, as well as reduced expression of RUNX2, confirmed
the conversion of MSCs into fat cells.
However, the current study has certain limitations.
Firstly, mice rather than rats were used in the experiments,
despite the potentially better simulation of the AA pathology in
rats, given certain tolerances and more tissues for testing.
Secondly, the animal model was more relevant for the analysis of
acute AA and may not be a study of chronic AA. To this end, a rat
model will be used in future studies to detect in more detail how
the MSC function on adipogenic differentiation would change via
X-ray irradiation or LN infusion alone. Thirdly, the number of mice
was low, which may potentially result in inaccuracies of the
results. Furthermore, LEP-R levels will be artificially altered to
investigate the differentiation of MSCs.
In conclusion, increased LEP levels and decreased
LEP-R levels were detected in the peripheral blood and MSCs of AA
mice in the present study. It is speculated that the high levels of
LEP may increase the immune injury in the AA mice. In addition, the
decrease in LEP-R levels may contribute to the failure of LEP to
regulate the differentiation of MSCs into osteoblasts, leading to
the increase of fat cells in the bone marrow of AA mice.
Acknowledgements
Not applicable.
Funding
The present study was funded by the National Natural
Science Foundation (grant no. H0806).
Availability of data and materials
All data generated or analyzed during the present
study are included in this manuscript.
Authors' contributions
XDL and CTZ conceived of and designed the study.
XCY, JY, JZ, HGZ and WW performed the experiments. YHL, CLX, XS and
GLL analyzed the data. XCY, ZGC, and XDL wrote the paper. All
authors read and approved the manuscript.
Ethics approval and consent to
participate
All experiments using mice were performed according
to protocols approved by the Ethics Committee of the Affiliated
Hospital of Qingdao University (Qingdao, China).
Patient consent for publication
Not applicable.
Competing interests
The authors declare that they have no competing
interests.
References
|
1
|
Scheinberg P and Young NS: How I treat
acquired aplastic anemia. Blood. 120:1185–1196. 2012. View Article : Google Scholar : PubMed/NCBI
|
|
2
|
Scheinberg P and Chen J: Aplastic anemia:
What have we learned from animal models and from the clinic. Semin
Hematol. 50:156–164. 2013. View Article : Google Scholar : PubMed/NCBI
|
|
3
|
Bredella MA, Fazeli PK, Miller KK, Misra
M, Torriani M, Thomas BJ, Ghomi RH, Rosen CJ and Klibanski A:
Increased bone marrow fat in anorexia nervosa. J Clin Endocrinol
Metab. 94:2129–2136. 2009. View Article : Google Scholar : PubMed/NCBI
|
|
4
|
Ng F, Boucher S, Koh S, Sastry KS, Chase
L, Lakshmipathy U, Choong C, Yang Z, Vemuri MC, Rao MS and Tanavde
V: PDGF, TGF-beta, and FGF signaling is important for
differentiation and growth of mesenchymal stem cells (MSCs):
Transcriptional profiling can identify markers and signaling
pathways important in differentiation of MSCs into adipogenic,
chondrogenic, and osteogenic lineages. Blood. 112:295–307. 2008.
View Article : Google Scholar : PubMed/NCBI
|
|
5
|
Majumdar MK, Thiede MA, Haynesworth SE,
Bruder SP and Gerson SL: Human marrow-derived mesenchymal stem
cells (MSCs) express hematopoietic cytokines and support long-term
hematopoiesis when differentiated toward stromal and osteogenic
lineages. J Hematother Stem Cell Res. 9:841–848. 2000. View Article : Google Scholar : PubMed/NCBI
|
|
6
|
Prockop DJ: ‘Stemness’ does not explain
the repair of many tissues by mesenchymal stem/multipotent stromal
cells (MSCs). Clin Pharmacol Ther. 82:241–243. 2007. View Article : Google Scholar : PubMed/NCBI
|
|
7
|
Zhou BO, Yu H, Yue R, Zhao Z, Rios JJ,
Naveiras O and Morrison SJ: Bone marrow adipocytes promote the
regeneration of stem cells and haematopoiesis by secreting SCF. Nat
Cell Biol. 19:891–903. 2017. View
Article : Google Scholar : PubMed/NCBI
|
|
8
|
Li J, Yang S, Lu S, Zhao H, Feng J, Li W,
Ma F, Ren Q, Liu B, Zhang L, et al: Differential gene expression
profile associated with the abnormality of bone marrow mesenchymal
stem cells in aplastic anemia. PLoS One. 7:e477642012. View Article : Google Scholar : PubMed/NCBI
|
|
9
|
Masuzaki H, Ogawa Y, Sagawa N, Hosoda K,
Matsumoto T, Mise H, Nishimura H, Yoshimasa Y, Tanaka I, Mori T and
Nakao K: Nonadipose tissue production of leptin: Leptin as a novel
placenta-derived hormone in humans. Nat Med. 3:1029–1033. 1997.
View Article : Google Scholar : PubMed/NCBI
|
|
10
|
Bado A, Levasseur S, Attoub S, Kermorgant
S, Laigneau JP, Bortoluzzi MN, Moizo L, Lehy T, Guerre-Millo M, Le
Marchand-Brustel Y and Lewin MJ: The stomach is a source of leptin.
Nature. 394:790–793. 1998. View
Article : Google Scholar : PubMed/NCBI
|
|
11
|
Smith-Kirwin SM, O'Connor DM, De Johnston
J, Lancey ED, Hassink SG and Funanage VL: Leptin expression in
human mammary epithelial cells and breast milk. J Clin Endocrinol
Metab. 83:1810. 1998. View Article : Google Scholar : PubMed/NCBI
|
|
12
|
Lee NJ, Wong IP, Baldock PA and Herzog H:
Leptin as an endocrine signal in bone. Curr Osteoporosis Rep.
6:62–66. 2008. View Article : Google Scholar
|
|
13
|
Zhou BO, Yue R, Murphy MM, Peyer JG and
Morrison SJ: Leptin-receptor-expressing mesenchymal stromal cells
represent the main source of bone formed by adult bone marrow. Cell
Stem Cell. 15:154–168. 2014. View Article : Google Scholar : PubMed/NCBI
|
|
14
|
Hamrick MW, Della-Fera MA, Choi YH,
Pennington C, Hartzell D and Baile CA: Leptin treatment induces
loss of bone marrow adipocytes and increases bone formation in
leptin-deficient ob/ob mice. J Bone Miner Res. 20:994–1001. 2005.
View Article : Google Scholar : PubMed/NCBI
|
|
15
|
Li Y, et al: The study on the leptin level
of aplastic anemia. J Clin Hematol. 17:135–136. 2004.
|
|
16
|
Guowen Liu, Yuhua Liu, Xiaodan Liu, et al:
The expression and significance of leptin and leptin receptor in
plasma and bone marrow of AA patients. Acta Academiae Medicinae
Qingdao Universitatis. 2014:493–495. 2014.
|
|
17
|
Chen J, Lipovsky K, Ellison FM, Calado RT
and Young NS: Bystander destruction of hematopoietic progenitor and
stem cells in a mouse model of infusion-induced bone marrow
failure. Blood. 104:1671–1678. 2004. View Article : Google Scholar : PubMed/NCBI
|
|
18
|
Sun J, Wang S, Xie Y and Shi X:
Experimental study on animal model of aplastic anemia. Chin J Lab
Animal Sci. 10:210–212. 2000.
|
|
19
|
Arieta Kuksin C, Gonzalez-Perez G and
Minter LM: CXCR4 expression on pathogenic T cells facilitates their
bone marrow infiltration in a mouse model of aplastic anemia.
Blood. 125:2087–2094. 2015. View Article : Google Scholar : PubMed/NCBI
|
|
20
|
Gault N, Verbiest T, Badie C, Romeo PH and
Bouffler S: Hematopoietic stem and progenitor cell responses to low
radiation doses-implications for leukemia risk. Int J Radiat Biol.
17:1–8. 2019.(Epub ahead of print). View Article : Google Scholar
|
|
21
|
Knospe WH, Husseini SG, Chiu KM and Fried
W: Immunologically mediated aplastic anemia in mice: Evidence of
hematopoietic stromal injury and injury to hematopoietic stem
cells. Exp Hematol. 22:573–581. 1994.PubMed/NCBI
|
|
22
|
Sun Z, Yu X, Wang H, Zhang S, Zhao Z and
Xu R: Clinical significance of mismatch repair gene expression in
sporadic colorectal cancer. Exp Ther Med. 8:1416–1422. 2014.
View Article : Google Scholar : PubMed/NCBI
|
|
23
|
Burr LD, Rogers GB, Chen AC, Taylor SL,
Bowler SD, Keating RL, Martin ML, Hasnain SZ and McGuckin MA: PPARγ
is reduced in the airways of non-CF bronchiectasis subjects and is
inversely correlated with the presence of Pseudomonas aeruginosa.
PLoS One. 13:e02022962018. View Article : Google Scholar : PubMed/NCBI
|
|
24
|
Li JP, Zheng CL and Han ZC: Abnormal
immunity and stem/progenitor cells in acquired aplastic anemia.
Crit Rev Oncol Hematol. 75:79–93. 2010. View Article : Google Scholar : PubMed/NCBI
|
|
25
|
Lin FC, Karwan M, Saleh B, Hodge DL, Chan
T, Boelte KC, Keller JR and Young HA: IFN-γ causes aplastic anemia
by altering hematopoiesis stem/progenitor cell composition and
disrupting lineage differentiation. Blood. 124:3699–3708. 2014.
View Article : Google Scholar : PubMed/NCBI
|
|
26
|
Edinger M, Hoffmann P, Ermann J, Drago K,
Fathman CG, Strober S and Negrin RS: CD4+ CD25+ regulatory T cells
preserve graft-versus-tumor activity while inhibiting
graft-versus-host disease after bone marrow transplantation. Nat
Med. 9:1144–1150. 2003. View
Article : Google Scholar : PubMed/NCBI
|
|
27
|
Bäckesjö CM, Li Y, Lindgren U and Haldosén
LA: Activation of Sirt1 decreases adipocyte formation during
osteoblast differentiation of mesenchymal stem cells. J Bone Miner
Res. 21:993–1002. 2006. View Article : Google Scholar : PubMed/NCBI
|
|
28
|
Nuttall ME and Gimble JM: Controlling the
balance between osteoblastogenesis and adipogenesis and the
consequent therapeutic implications. Curr Opin Pharmacol.
4:290–294. 2004. View Article : Google Scholar : PubMed/NCBI
|
|
29
|
Kawai M and Rosen CJ: PPARγ: A circadian
transcription factor in adipogenesis and osteogenesis. Nat Rev
Endocrinol. 6:629–236. 2010. View Article : Google Scholar : PubMed/NCBI
|
|
30
|
Fantuzzi G and Faggioni R: Leptin in the
regulation of immunity, inflammation, and hematopoiesis. J Leukoc
Biol. 68:437–446. 2000.PubMed/NCBI
|
|
31
|
Abella V, Scotece M, Conde J, Pino J,
Gonzalez-Gay MA, Gómez-Reino JJ, Mera A, Lago F, Gómez R and
Gualillo O: Leptin in the interplay of inflammation, metabolism and
immune system disorders. Nat Rev Rheumatol. 13:100–109. 2017.
View Article : Google Scholar : PubMed/NCBI
|
|
32
|
Fernández-Riejos P, Najib S,
Santos-Alvarez J, Martín-Romero C, Pérez-Pérez A, González-Yanes C
and Sánchez-Margalet V: Role of leptin in the activation of immune
cells. Mediators Inflamm. 2010:5683432010. View Article : Google Scholar : PubMed/NCBI
|
|
33
|
Du HZ, Wang Q, Ji J, Shen BM, Wei SC, Liu
LJ, Ding J, Ma DX, Wang W, Peng J and Hou M: Expression of IL-27,
Th1 and Th17 in patients with aplastic anemia. J Clin Immunol.
33:436–445. 2013. View Article : Google Scholar : PubMed/NCBI
|
|
34
|
Çakır B, Cevik H, Contuk G, Ercan F,
Ekşioğlu-Demiralp E and Yeğen BC: Leptin ameliorates burn-induced
multiple organ damage and modulates postburn immune response in
rats. Regul Pept. 125:135–144. 2005. View Article : Google Scholar : PubMed/NCBI
|
|
35
|
Batra A, Okur B, Glauben R, Erben U, Ihbe
J, Stroh T, Fedke I, Chang HD, Zeitz M and Siegmund B: Leptin: A
critical regulator of CD4+ T-cell polarization in vitro and in
vivo. Endocrinology. 151:56–62. 2010. View Article : Google Scholar : PubMed/NCBI
|
|
36
|
Han G, Jing Y, Zhang Y, Yue Z, Hu X, Wang
L, Liang J and Liu J: Osteogenic differentiation of bone marrow
mesenchymal stem cells by adenovirus-mediated expression of leptin.
Regul Pept. 163:107–112. 2010. View Article : Google Scholar : PubMed/NCBI
|
|
37
|
Tang QQ, Zhang JW and Lane MD: Sequential
gene promoter interactions by C/EBPbeta, C/EBPalpha, and PPARgamma
during adipogenesis. Biochem Biophys Res Commun. 318:213–218. 2004.
View Article : Google Scholar : PubMed/NCBI
|
|
38
|
Komori T: Regulation of bone development
and extracellular matrix protein genes by RUNX2. Cell Tissue Res.
339:189–195. 2010. View Article : Google Scholar : PubMed/NCBI
|