Introduction
Chronic hepatitis B (CHB) is the most common
infectious chronic liver disease in humans, with a total of 240
million patients suffering from chronic hepatitis. CHB causes
>600,000 mortalities each year from complications of end-stage
liver disease and hepatocellular carcinoma (1). Antiviral treatments approved and
available in China for CHB infection include standard or pegylated
(Peg-) interferon (IFN) and nucleos(t)ide analogs (NAs), including
an L-nucleoside analog (lamivudine), acyclic nucleoside
phosphonates (adefovirdipivoxil and tenofovirdisoproxilfumarate)
and a D-cyclopentane class nucleoside analog (entecavir). However,
drug resistance and high cost of these drugs limits their long-term
efficacy (2).
IFN, including Peg-IFN and unmodified IFN, has
direct antiviral activity and immune stimulating properties. As a
result, it has been widely used in recent decades. Studies have
indicated that patients who received IFN therapy had a lower risk
of decompensated liver diseases (3,4).
However, the available clinical data suggest that the antiviral
efficacy of IFN therapy is currently not satisfactory. In clinical
observation, the rate of effective IFN treatment was reported to be
only 30–42% (5–7). Therefore, it is important to identify
the factors that affect the treatment outcomes of patients with CHB
who receive IFN therapy.
In the present study, isobaric tags for relative and
absolute quantitation (iTRAQ)-based mass spectrometry (MS) was
performed to quantify differentially expressed proteins (DEPs)
between plasma samples from virological response (VR) patients
before and after IFN therapy. DEPs are also sometimes referred to
as ‘aberrantly expressed proteins’ in the present study when we
wish to emphasize their biological and/or clinical relevance. The
present iTRAQ analysis verified the likely importance of
downregulated haptoglobin (Hp) expression after 48 weeks of IFN
therapy. Serum Hp levels were lower in the VR group than in the
non-VR group. Further in vitro experiments were conducted to
verify the effects of Hp on IFN and on the clearance of hepatitis B
virus (HBV). The present results suggest that Hp is a potentially
useful target for the treatment of HBV and a marker for predicting
the efficacy of IFN therapy.
Materials and methods
Subjects and plasma collection
In the present study, 38 patients with CHB who
received 48 weeks of Peg-IFN monotherapy (180 µg/week) were
followed up for ≥48 weeks from September 2014-November 2015 at the
Department of Infectious Diseases, The Second Affiliated Hospital,
Chongqing, China. These patients were hepatitis B surface antigen
(HBsAg) positive for >6 months and were currently HBsAg and/or
DNA HBV positive at the time of treatment. Following 48 weeks of
Peg-IFN treatment, for hepatitis B envelope antigen
(HBeAg)-positive patients with CHB, virological response (VR) was
defined as HBeAg seroconversion and an HBV DNA level <2,000
IU/ml. For HBeAg-negative patients with CHB, VR was defined as an
HBV DNA level <2,000 IU/ml, in accordance with American
Association for the Study of Liver Diseases guidelines (7). Following 48 weeks of IFN treatment, 10
VR patients and 28 non-VR patients were identified. The Ethics
Committee of Chongqing Medical University (Chongqing, China)
approved the present study. Written informed consent was obtained
from all participants prior to treatment. Table I presents the patient demographics
and clinical pathological data. Serum samples were collected,
according to the guidelines set forth by the Human Proteome
Organization Plasma Proteome Project (8), at the initiation, midpoint and end of
therapy (weeks 0, 24 and 48, respectively), and stored at
−80°C.
 | Table I.Baseline characteristics and clinical
data of patients receiving interferon therapy. |
Table I.
Baseline characteristics and clinical
data of patients receiving interferon therapy.
|
| Virological response
(n=10) | Non-virological
response (n=28) |
|---|
|
|
|
|
|---|
| Characteristic | 0 weeks | 48 weeks | 0 weeks | 48 weeks |
|---|
| Age (years), mean ±
SD | 42.0±13.4 | NA | 41.0±9.9 | NA |
| Sex (males) | 6 (60.0%) | NA | 15 (53.6%) | NA |
| HBeAg (+) | 5 (50.0%) | 0 (0%) | 18 (64.3%) | 13 (46.4%) |
| ALT (U/l) | 105.8±37.8 | 46.4±23.9 | 132.8±60.0 | 71.4±35.6 |
| HBV DNA (log IU/ml),
mean ± SD | 6.41±1.17 | 2.68±0.51 | 6.81±1.26 | 4.69±0.80 |
iTRAQ labeling
A total of 10 individual samples from VR patients
taken at 0, 24 and 48 weeks were mixed following treatment to
create three sample pools. A ProteoPrep 20 Plasma Immunodepletion
Kit (GE Healthcare Life Sciences, Shanghai, China) was used to
deplete the most abundant proteins. A 2-D Quant kit (GE Healthcare
Life Sciences) was used to measure the protein concentration of the
immune depleted plasma. Protein samples were acetone precipitated
at −20°C for 1 h and dissolved in lysis buffer, denatured at 60°C
for 1 h and blocked in 1 µl cysteine at room temperature for 10
min. Each sample was digested with trypsin solution at 37°C
overnight, and then labeled with the iTRAQ tags with iTRAQ reagents
(Applied Biosystems; Thermo Fisher Scientific, Inc., Waltham, MA,
USA) as follows: week 0, 113 tag; week 24, 114 tag; and week 48,
115 tag. The labeled samples were pooled prior to further analysis
(9).
Peptide fractionation
The pooled iTRAQ labeled trypsin peptide samples
were dissolved in 1% Pharmalyte and 8M urea and evenly coated on
prehydrated immobilized pH gradient (IPG) strips (18 cm; pH 3–10).
Samples were placed in an IPGphor system (GE Healthcare, Chicago,
IL, USA)and subjected to isoelectric focusing at 68 kV/h. The
adhesive strip was then cut into 36 sections (thickness, 0.5 cm).
The peptides were extracted by incubating the gel sections in
buffer A (2% acetonitrile, 0.1% formic acid) for 1 h at room
temperature (10). These isolated
peptides were freeze-dried, purified on a Discovery DSC-18 SPE
column (Sigma-Aldrich; Merck KGaA, Darmstadt, Germany) and
cryopreserved at −80°C prior to further use.
MS
The purified peptides were dissolved in buffer A at
room temperature for 20 min with vortex oscillation and loaded on
to a C18-PepMap (Dionex; Thermo Fisher Scientific, Inc.) column
(100 µm × 3 cm, 3 µm, 150A) of a Dionex Ultimate 3000 system. The
peptides were eluted with the following concentration gradient: 4%
buffer B (98% acetonitrile, 0.1% formic acid) and 96% buffer A, 3
min; 4–10% buffer B, 7 min; 10–35% buffer B, 55 min; 35–100% buffer
B, 25 min; 100% buffer B, 15 min; 96% buffer A, 20 min. The control
flow rate was 0.3 µl/min and the eluted fractions were
automatically injected for MS analysis. The mass spectrometer was
set in the positive ion mode at a mass range of 300–1,800 m/z. The
switching time between MS scan and MS/MS event acquisition was set
to 2 sec. The two most intensely charged peptides >20 counts
were selected for MS/MS. Dynamic exclusion criteria was set to 30
sec.
Protein identification and quantification was
performed using Protein Pilot v2.0 (AB SCIEX, Framingham, MA, USA).
MS/MS data were processed by searching the International Protein
Index Human database v3.77 (11).
Methyl methanethiosulfonate was set as a fixed modification.
Proteins with ≥2 unique peptides were considered to be
differentially expressed. The peak area of the iTRAQ tag molecule
represents the relative quantification of the identified proteins
in different samples, with a 95% confidence interval and a P-value
<0.05.
ELISA
Commercial ELISA kits were used to measure the serum
levels of Hp, hemoglobin subunit β (HBB) and isoform 1 of
fibrinogen α chain (FGA) according to the manufacturer's
instructions. Human Hp ELISA kit (cat. no. ab108856), human HBB
ELISA kit (cat. no. ab137972) and human FGA ELISA kit (cat. no.
ab19079) were purchased from Abcam (Cambridge, UK).
Cell line
The HepG2.2.15 cell line, which was derived from the
hepatoblastoma-derived cell line HepG2 and contains >1-unit
length of the HBV genome integrated into the host genomes (12), was used in the present study. Cells
were cultured at 5% CO2 and 37°C in high-glucose
Dulbecco's modified Eagle's medium (DMEM; GE Healthcare Life
Sciences, Logan, UT USA) supplemented with 100 µg/ml streptomycin,
0.1% non-essential amino acids, 100 IU/ml penicillin, 1.0 mM sodium
pyruvate, 2 mM glutamine and 10% fetal bovine serum (FBS; Gibco;
Thermo Fisher Scientific, Inc.) (13).
Hp small interfering (si)RNA
transfection
For functional studies, three siRNA duplexes against
human Hp (SR302217A, 5′-GACCAGACCAAUGCAUAAGGCATT-3′; SR302217B,
5′-GGAGUGUACACACCUUAAACAAUGAGA-3′; and SR302217C,
5′-CGGAUAUCGCAGAUGACGGCUGCCC-3′) and a negative control (SR30004)
were purchased from OriGene Technologies, Inc. (Rockville, MD,
USA). Briefly, siRNA and Lipofectamine 2000 (Invitrogen; Thermo
Fisher Scientific, Inc.) were diluted inmoderate Opti-MEM I medium
(Gibco; Thermo Fisher Scientific, Inc.) for 5 min and incubated
together for 20 min at room temperature. Subsequently 30–50% cells
were plated into a 6-well plate and the transfection mixture added.
The HepG2.2.15 cells were transfected with 20 nM of Hp-specific
siRNA and a negative control. Following 6 h of transfection, the
medium was replaced with DMEM medium containing 10% FBS and
continued in culture for an additional 42 h. Cells were harvested
48 h following transfection for western blot analysis and reverse
transcription-quantitative polymerase chain reaction (RT-qPCR)
analysis. All experiments were performed at least in
triplicate.
Western blotting
Cells were lysed at 4°C with non-ionic detergent
lysis buffer (50 mM, pH 7.5 Tris-HCl; 0.5% IGEPAL; 150 mM NaCl; 1
mM, pH 8.0 EDTA; 0.5% Triton X; 50 mM sodium fluoride; 1 mM sodium
orthovanadate; and protease inhibitors). The lysates were
centrifuged at 15,294 × g at 4°C for 30 min. A 2-D Quant kit was
used to determine the protein concentration. A total of 40 µg
protein/lane was separated by 10% SDS-PAGE and transferred to
polyvinylidene difluoride membranes. The membranes were blocked at
room temperature for 1 h with 5% non-fat milk in Tris-buffered
saline solution with Tween-20 (TBS-T) and incubated overnight with
the primary antibodies (all 1:500) in TBST plus 5% bovine serum
albumin (Beijing Solarbio Science & Technology Co., Ltd.,
Beijing, China) at 4°C. After washing three times with TBS-T buffer
for 5 min, the membranes were incubated with a horseradish
peroxidase-conjugated goat anti-rabbit IgG as the secondary
antibody (1:5,000) for 1 h at room temperature. Proteins were
visualized with an enhanced chemiluminescencedetection system
(Bio-Rad Laboratories, Hercules, CA, USA) (9,14). The
densitometry was analysed by ImageJ v1.51 (National Institutes of
Health, Bethesda, MD, USA). Anti-Hp antibody(cat. no. ARG55106) was
purchased from Arigo Biolaboratories (Taiwan, R.O.C. China),
anti-GAPDH antibody (cat. no. ab181602) was purchased from Abcam,
and the secondary antibody (cat. no. ATA0011) was purchased from
ATgene Biotech (Chongqing, China).
RT-qPCR
Total RNA was isolated from the transfected cells
using TRIzol reagent (Gibco; Thermo Fisher Scientific, Inc.) and
reversed-transcribed using a Revert Aid First Strand cDNA Synthesis
kit (Thermo Fisher Scientific, Inc.) according to the
manufacturer's protocol. cDNA was quantified via qPCR with a KAPA
SYBR FAST qPCR kit Master Mix (2X) Universal HBV detection kit
(Roche Diagnostics, Basel, Switzerland) on a Roche LightCycler
instrument (Roche Molecular Diagnostics, Pleasanton, CA, USA). The
gene-specific primers used were as follows: Actin, Hp (cat. no.
HP208336; forward, 5′-TGGCTAGTGGAGCACTCGGTT-3′, reverse,
5′-CAGGAAGTTTATCTCCAACAGCC-3′), MX dynamin like GTPase 1 (MX1; cat.
no. HP206142; forward, 5′-GGCTGTTTACCAGACTCCGACA-3′, reverse,
5′-CACAAAGCCTGGCAGCTCTCTA-3′), RNASEL (cat. no. HP214068; forward,
5′-AAGGCTGTTCAAGAACTACACTTG-3′, reverse,
5′-TGGATCTCCAGCCCACTTGATG-3′), hepatic brain-expressed X (HBEX;
cat. no. HP213124; forward, 5′-GCATAGGCTTGGAGAACCACAG-3′, reverse,
5′-CCGCAGACTATGACTCAACTGC-3′), ISG15 (cat. no. HP208303; forward,
5′-CTCTGAGCATCCTGGTGAGGAA-3′, reverse,
5′-AAGGTCAGCCAGAACAGGTCGT-3′), 2′-5′-oligoadenylate synthetase
(OAS)2 (cat. no. HK209134; forward, 5′-GCTTCCGACAATCAACAGCCAAG-3′,
reverse, 5′-CTTGACGATTTTGTGCCGCTCG-3′), eukaryotic translation
initiation factor (EIF)-2α (cat. no. HP215710; forward,
5′-CTGGACCTCATGCAGCTTTAGC-3′, reverse,
5′-CTCCATAGTAGGAAGCTCCTGTC-3′), IFNβ1 (cat. no. HP205913; forward,
5′-CTTGGATTCCTACAAAGAAGCAGC-3′, reverse,
5′-TCCTCCTTCTGGAACTGCTGCA-3′), OAS1 (cat. no. HP234311; forward,
5′-AGGAAAGGTGCTTCCGAG-3′, reverse, 5′-GGACTGAGGAAGACAACCAGGT-3′),
IFNα1 (cat. no. HP214678; forward, 5′-AGAAGGCTCCAGCCATCTCTGT-3′,
reverse, 5′-TGCTGGTAGAGTTCGGTGCAGA-3′) and OAS3 (cat. no. HP209172;
forward, 5′-CCTGATTCTGCTGGTGAAGCAC-3′, reverse,
5′-TCCCAGGCAAAGATGGTGAGGA-3′; OriGene Technologies, Inc.). Relative
quantification of gene expression were calculated using the
2−ΔΔCq method (15).
Statistical analysis
Statistical analyses were performed using GraphPad
Prism 6 (GraphPad Software, Inc., La Jolla, CA, USA) and SPSS v22
software (IBM Corp., Armonk, NY, USA). Continuous variables are
presented as the mean ± standard deviation. Differences between
groups were analyzed using the Student's t-test and one-way ANOVA
followed by Tukey's multiple comparison test. χ2 test or
Fisher's exact test were used appropriately to compare categorical
variables. P<0.05 was considered to indicate a statistically
significant difference.
Results
iTRAQ analysis of DEPs
In order to explore the differential expression
profile of the plasma proteome in the treatment of patients with
CHB with IFN therapy, iTRAQ-based MS was utilized to analyze serum
proteins at 0, 24 and 48 weeks from VR patients receiving IFN
therapy. DEPs were defined using a 1.3 (1×1.3) and 0.77 (1/1.3)
cut-off in accordance with commonly adopted iTRAQ-based MS
conventions. This value has been employed in other large-scale
protein identification and quantification studies using the iTRAQ
approach (9,10,14,16,17).
Briefly, proteins with iTRAQ ratios <0.77 were considered to be
underexpressed, where as those >1.3 were considered
overexpressed (10). A total of 522
non-extension proteins were identified. Based on the above values,
18 proteins were revealed to be differentially expressed between
the groups, with 12 proteins being downregulated and 6 proteins
being upregulated. Information on these proteins is presented in
Table II.
| Table II.Aberrantly expressed plasma proteins
in virological response patients following 24 and 48 weeks of
interferon therapy. |
Table II.
Aberrantly expressed plasma proteins
in virological response patients following 24 and 48 weeks of
interferon therapy.
| A, Downregulated
proteins |
|---|
|
|---|
| N | Name | 24 week/0 week
114/113 | P-value | 48 week/0 week
115/113 | P-value |
|---|
| 1 | HP | 0.185 | <0.001 | 0.056 | <0.001 |
| 2 | TMSL3 | 0.270 | 0.010 | 0.166 | 0.006 |
| 3 | TLN1 | 0.149 | 0.021 | 0.191 | 0.053 |
| 4 | APOA1 | 0.560 | <0.001 | 0.273 | <0.001 |
| 5 | HPX | 0.550 | <0.001 | 0.291 | <0.001 |
| 6 | HRG | 0.655 | 0.011 | 0.417 | <0.001 |
| 7 | TPM4 | 0.275 | 0.041 | 0.425 | 0.062 |
| 8 | IGHA2 | 0.421 | 0.021 | 0.437 | 0.032 |
| 9 | APOH | 0.698 | 0.029 | 0.492 | 0.002 |
| 10 | YWHAE | 0.334 | 0.044 | 0.511 | 0.034 |
| 11 | GSN | 0.679 | 0.002 | 0.530 | <0.001 |
| 12 | APOA4 | 0.570 | <0.001 | 0.575 | <0.001 |
|
| B, Upregulated
proteins |
|
| N | Name | 24 week/0 week
114/113 | P-value | 48 week/0 week
115/113 | P-value |
|
| 1 | HBB | 3.105 | <0.001 | 7.047 | <0.001 |
| 2 | HBA2 | 2.938 | <0.001 | 5.916 | <0.001 |
| 3 | FGA | 2.377 | <0.001 | 3.281 | <0.001 |
| 4 | EEF2 | 1.959 | 0.002 | 2.512 | 0.001 |
| 5 | FGG | 1.528 | 0.001 | 1.837 | <0.001 |
| 6 | LGALS3BP | 2.032 | <0.001 | 1.75 | 0.030 |
Validation of DEPs
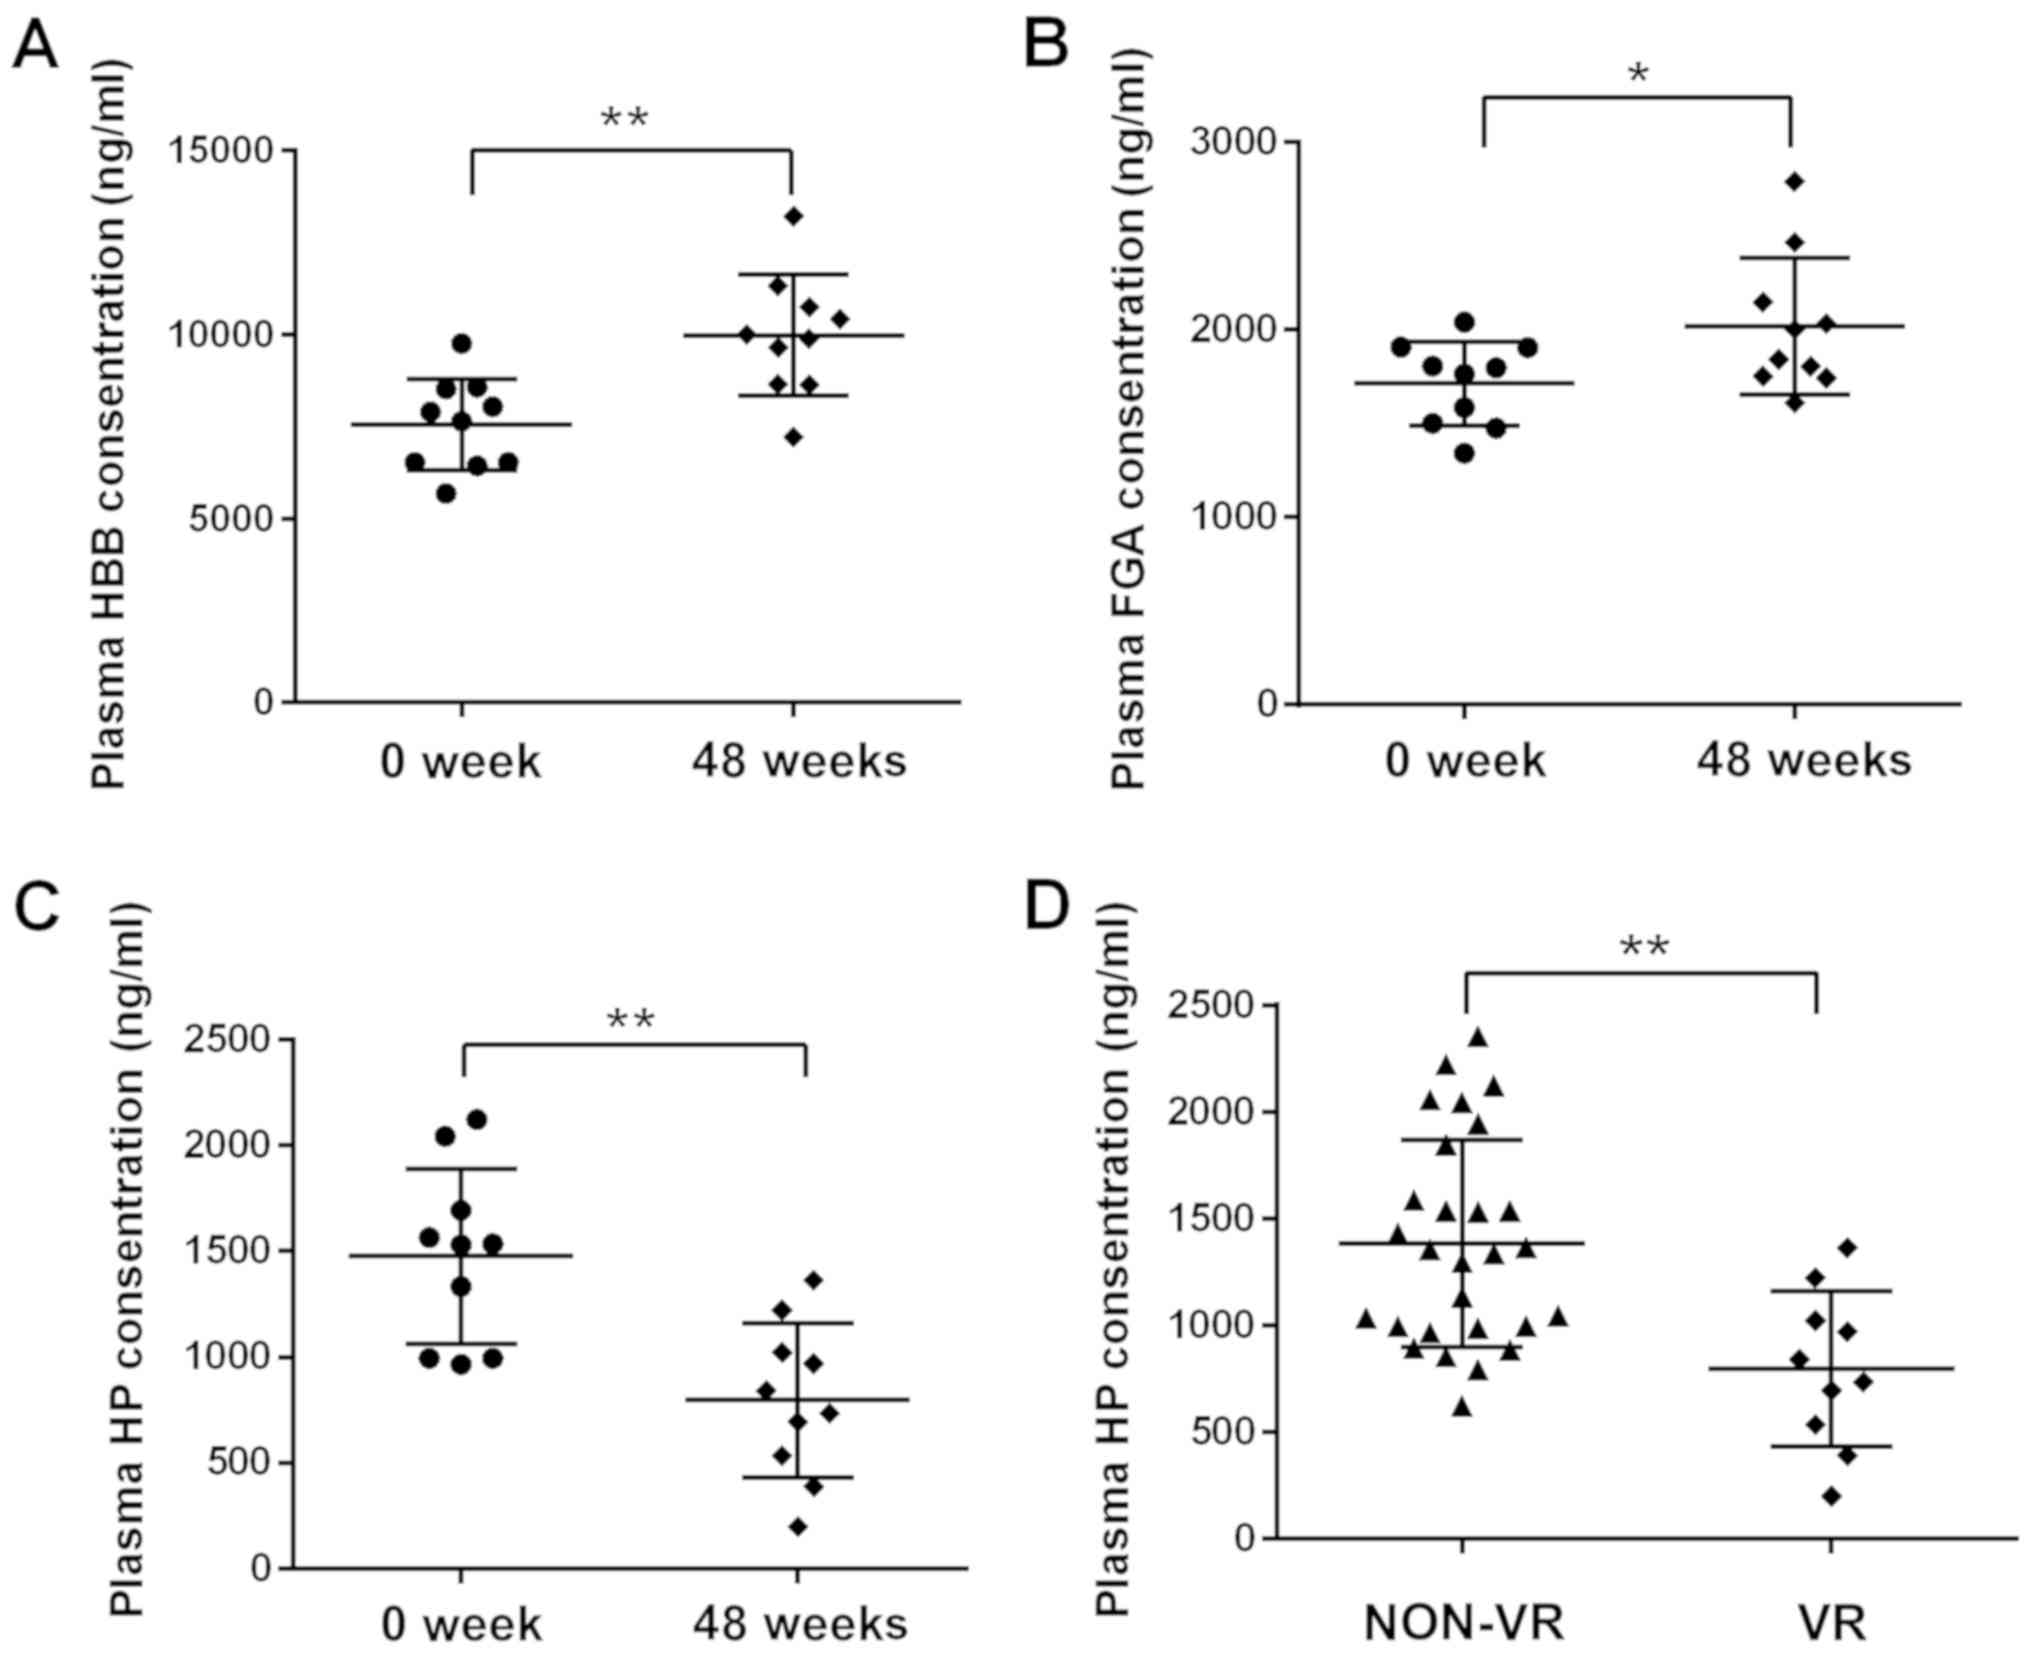
Hp, HBB and FGA were selected from the DEPs for
further validation. ELISA assays were employed to determine the
plasma levels of HP, HBB and FGA from the same sample set utilized
for the iTRAQ analysis. The ELISA results were consistent with the
results of iTRAQ, as the plasma levels of Hp were significantly
decreased and HBB and FGA were increased following IFN therapy
(Fig. 1A-C).
Hp reflects the efficacy of IFN in the
treatment of CHB
The analysis indicated that Hp exhibited the
greatest reduction among the DEPs. ELISA was utilized to detect the
plasma levels of Hp in VR patients and non-VR patients following 48
weeks of treatment. The plasma levels of Hp in VR patients were
significantly lower than in non-VR patients (Fig. 1D). Hp reflects the efficacy of IFN in
the treatment of CHB.
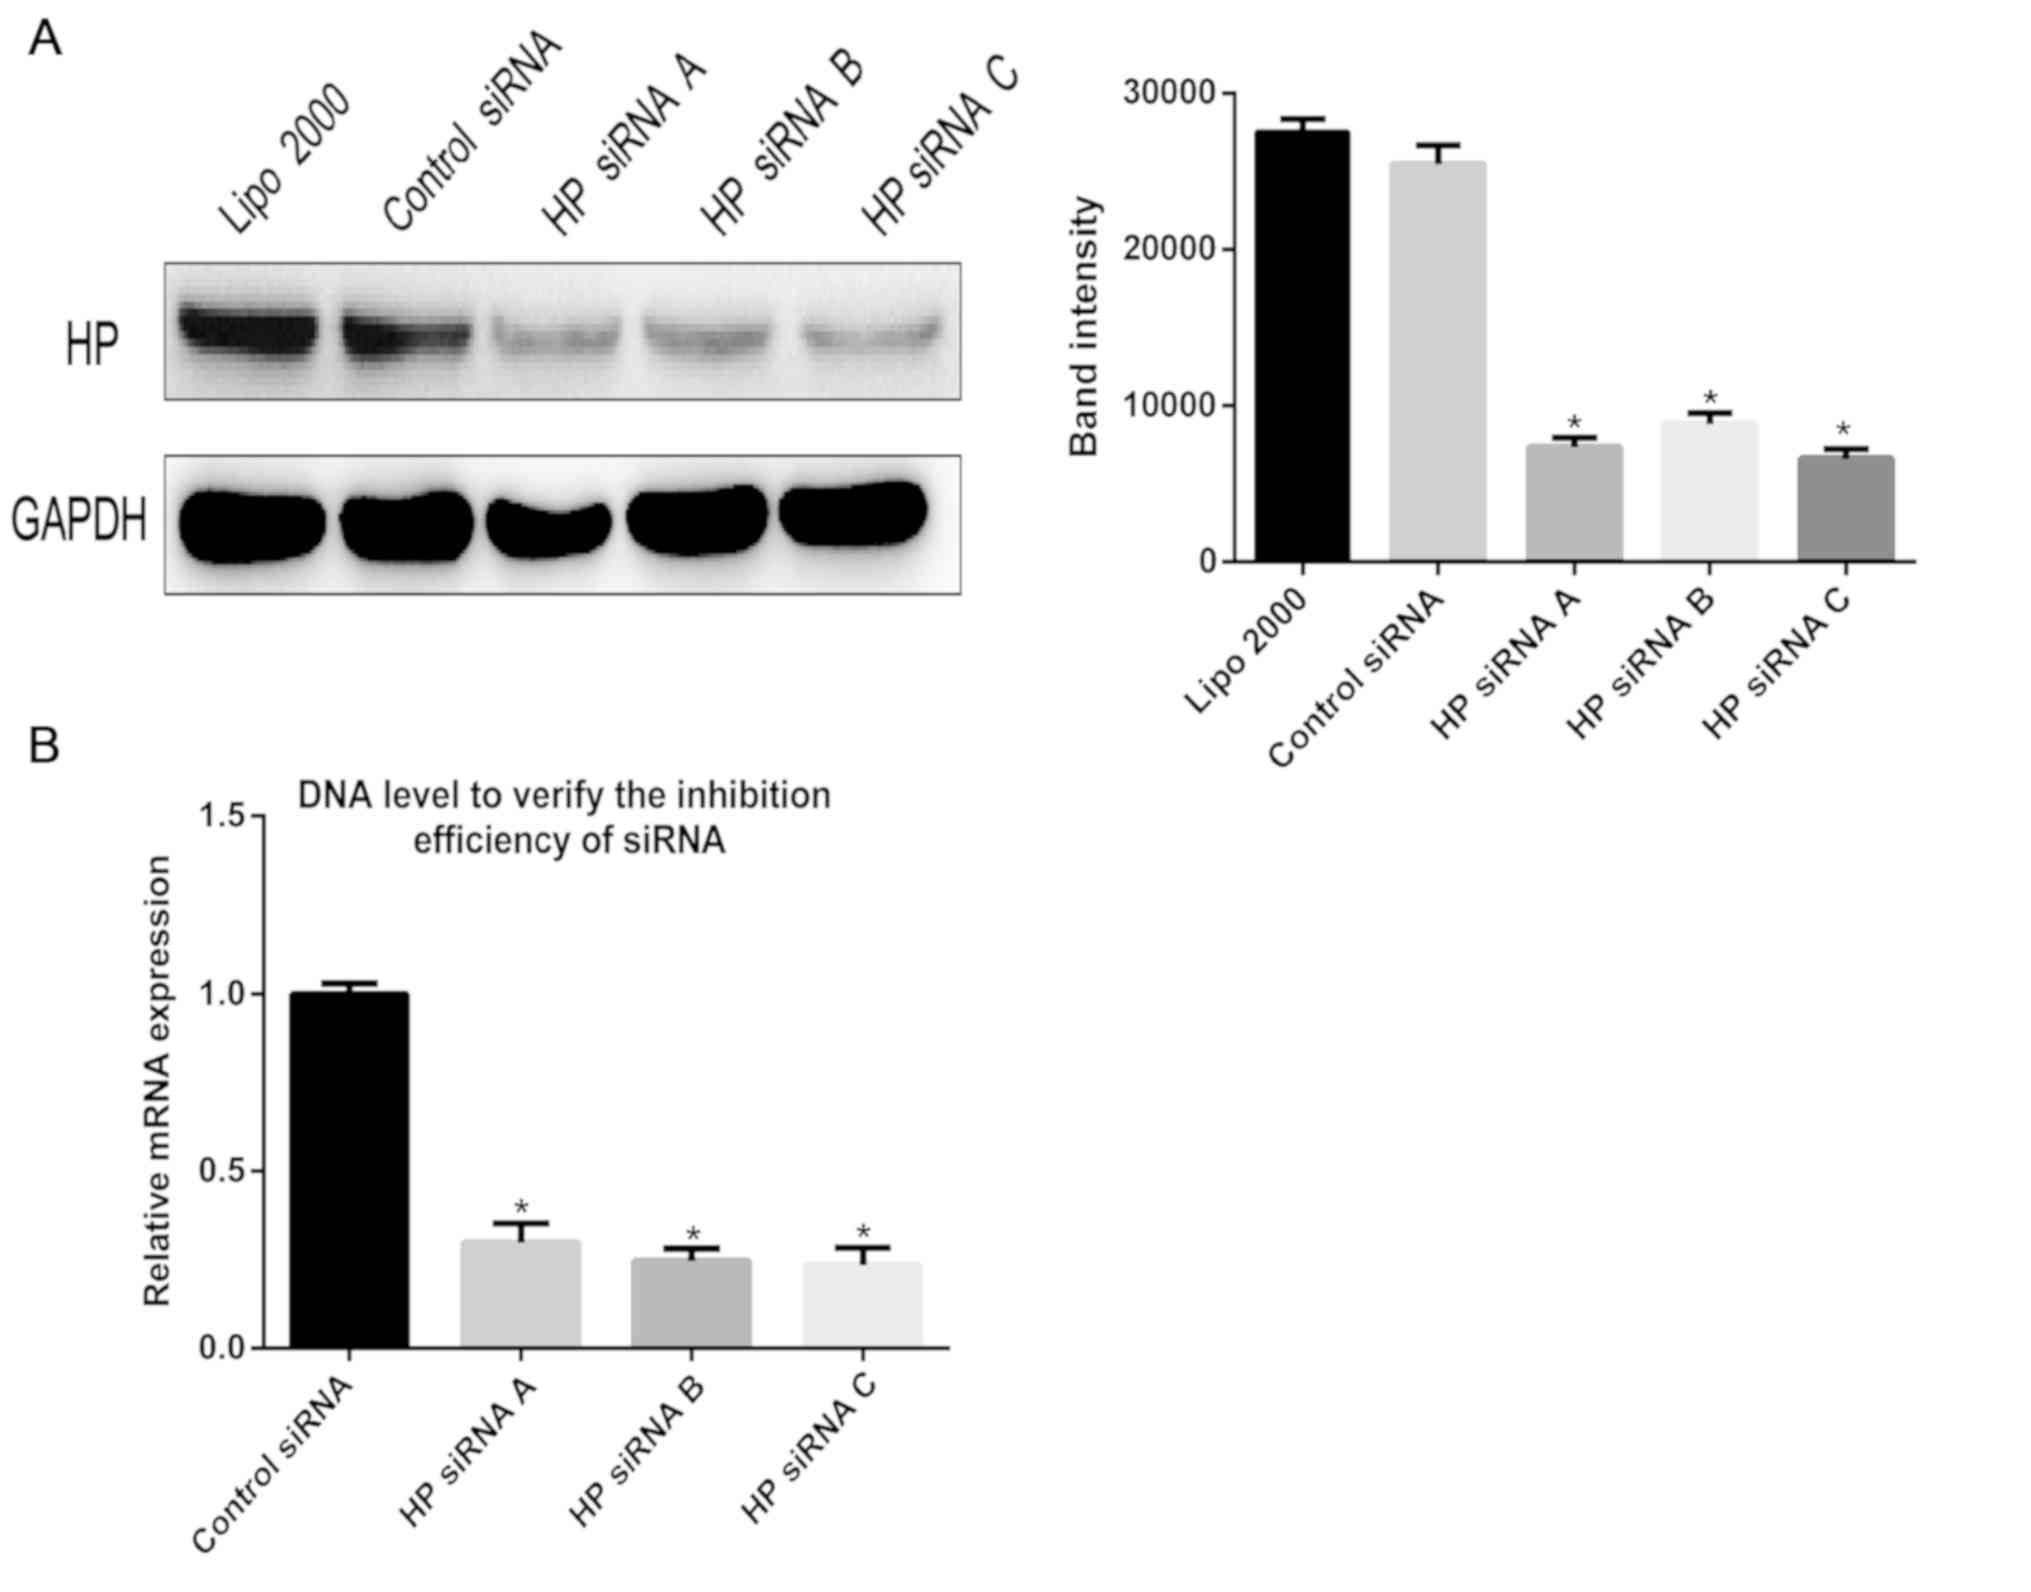
Validation of interference effect
In order to explore the effect of the Hp protein on
the hepatitis B virus, Hp-specific siRNA was used to inhibit the
expression of the Hp gene in HepG2.215 cells. RT-qPCR and western
blotting were utilized to verify the effect of siRNA knockdown at
the gene and protein level. As presented in Fig. 2, the expression of Hp was
significantly reduced at the gene and protein levels in the siRNA
knockdown groups, compared with the control group.
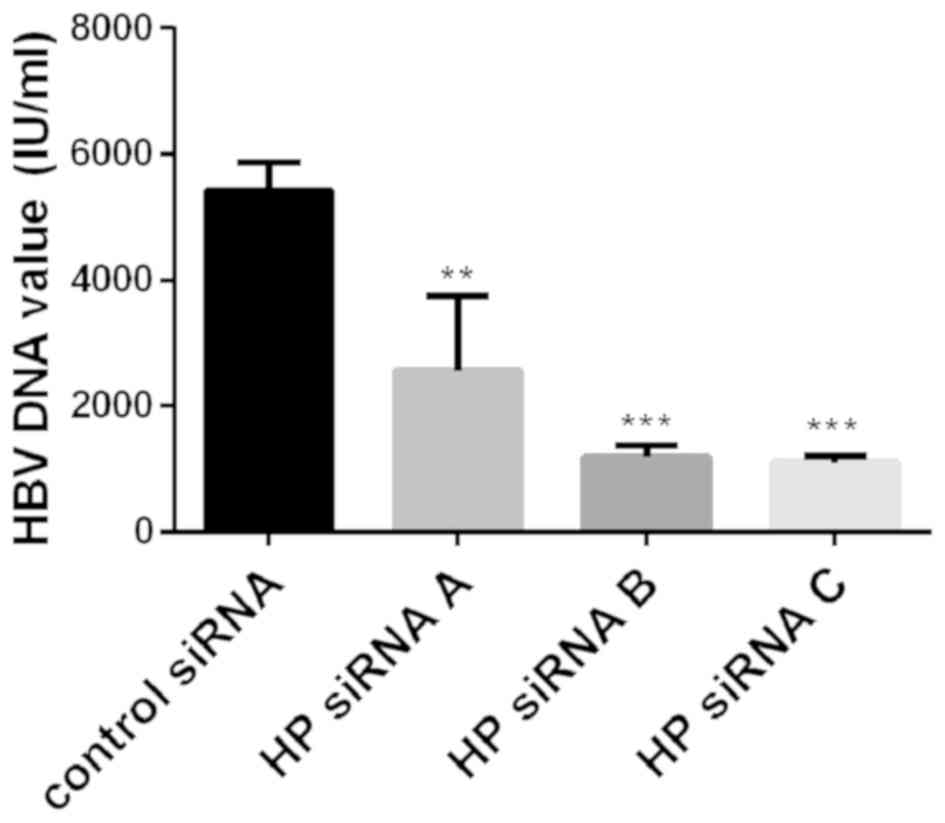
Association of Hp with HBV
replication
In order to explore whether Hp has an effect on the
replication of HBV, the expression of Hp was inhibited with
Hp-specific siRNA to observe changes in the levels of HBV DNA in
HepG2.2.15 cell supernatants. Following 48 h of incubation, the Hp
siRNA-transfected HepG2.2.15 cells exhibited reduced HBV DNA levels
(Fig. 3).
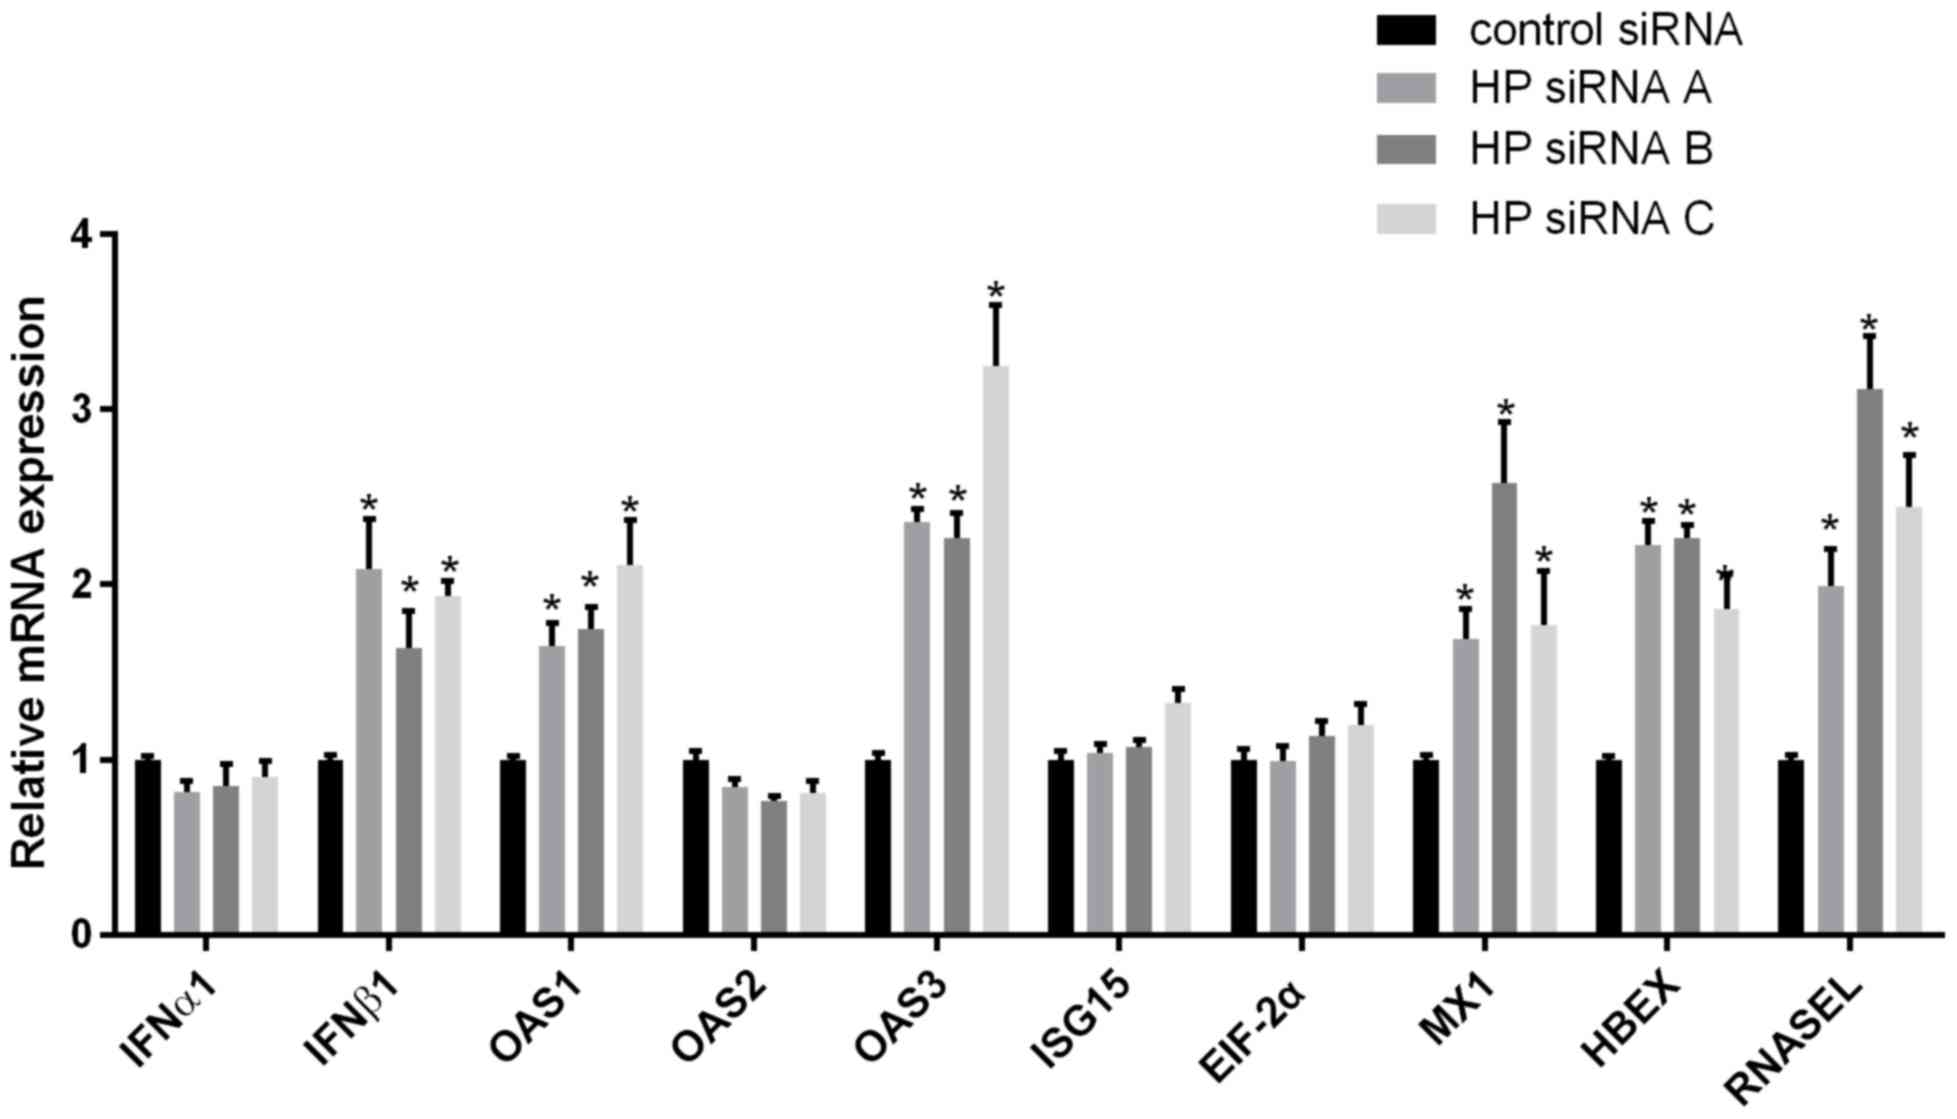
Hp-mediated alteration of IFN and
IFN-Induced downstream signaling pathways
In the treatment of hepatitis B with IFN, the level
of Hp in the different response groups was varied. It was
demonstrated that HBV levels decreased significantly when the
expression of Hp was downregulated, and it was hypothesized that Hp
may affect the production of IFN. Hp-specific siRNA was used to
knockdown Hp expression and, following 48 h of culture, extracted
mRNA from the cells was used to detect the levels of IFN RNA. The
results indicated that IFNβ1 levels were significantly increased in
comparison with the control group (Fig.
4). The expression levels of downstream IFN-stimulated genes in
response to Hp inhibition were also detected and, as presented in
Fig. 4, knockdown of Hp expression
induced increased mRNA levels of five downstream IFN-stimulated
genes (OAS1, OAS3, Mx1, ribonuclease Land HBEX). However, four
other effectors (IFNα1, ISG15, EIF-2α and OAS2) exhibited only
minimally altered mRNA levels in response to HP downregulation.
Discussion
Peg-IFN and nucleoside (acid) analogues are
currently the two major antiviral drugs utilized for the treatment
of hepatitis B. Although NAs are well tolerated, long treatment
periods are required to halt the risk of relapse. Peg-IFN provides
a greater likelihood of improved outcomes in a limited 48-week
period and with a sustained viral response, but its tolerance is
poor and Peg-IFN only exhibits efficacy for a number patients
(18). Many factors may affect the
Peg-IFN effect, such as baseline HBV DNA level, HBV genotype,
alanine amino transferase (ALT) level, sex, age and patient genetic
factor (19); however, the exact
molecular mechanism is not well known. The efficiency of IFN
therapy in the treatment of hepatitis B following 48 weeks is only
30–42% (77), and requires further investigation. HBV genotype, and
pre-treatment HBV DNA and ALT levels have been developed to help
select those patients best suited for Peg-IFN treatment (18,20).
An aim of the present study was to elucidate the
factors that affect the efficacy of IFN therapy. A previous
epidemiological study has indicated that the results of antiviral
therapy are affected by many factors, such as viral and host
factors (20). In order to explore
these differences, many novel labeling methods such as iTRAQ have
been recommended by the proteomics community to provide deeper
proteome coverage and convenient biomarker discovery (21,22). In
the present study, patients with CHB were treated with IFN.
According to the effects of IFN treatment, patients were divided
into the VR and non-VR groups. iTRAQ was utilized in order to
screen the differential expression of proteins in the VR patients
at 0, 24 and 48 weeks of IFN therapy.
Hp is a 2-glycoprotein acute phase reactant which
binds to free hemoglobin and forms a stoichiometrically stable
complex (23). Hpis expressed in
many tissues and cell types, but the major source is the liver
(24). Viagel electrophoresis, Hpis
divided into three main types: Hp 1-1, Hp 2-1, and Hp 2-2 (25). The major biological function of Hp is
to prevent hemoglobin-mediated renal parenchymal injury and the
loss of iron following intravascular hemolysis by binding to
hemoglobin with very high affinity in an equimolar ratio (26). Other functions include antioxidant
activity, prevention of renal damage, antibacterial activity,
inhibition of nitric oxide, inhibition of prostaglandins and
angiogenesis (27).
The present analysis indicated that Hp was the most
markedly reduced DEP. Following ELISA verification, it was also
identified that Hp decreased significantly following treatment.
Meanwhile, in patients with good response, the level of Hp also
decreased significantly. This suggested that the level of Hp may
reflect the efficacy of IFN treatment of CHB.
A number of previous studies have demonstrated that
inflammation, trauma, burns and tumors are often accompanied by an
increase in plasma levels of Hp binding to the plasma protein
(23,28). Therefore, Hp has antioxidant and
anti-hemolytic function. Reduced levels of Hp maybe associated with
hemolysis or liver injury (29).
This is in accordance with the present research results. In the
present study, it was demonstrated that ALT was lower in the VR
group than the NON-VR group. If a significant difference had been
observed in a comparison between the experimental group and another
normal patient group, it would have been more convincing. The
present study indicates that Hp was decreased significantly in the
group with a good response to IFN therapy, which exhibited a
decreased level of HBV-DNA. This suggests that Hp may have an
inhibitory effect on viral clearance. It has been demonstrated that
the Hp level in patients with hepatitis is different from that in
normal subjects. In hepatitis C virus infection, increased levels
of Hp1-1 have been reported (30).
Patients with higher levels of Hp2-2 produce lower levels of
hepatitis B antibody (30). In
vitro cell experiments further verified that, in HepG2.215
cells, the amount of HBV-DNA in the supernatant was detected
following inhibited expression of Hp. In cell experiments, where a
lower expression of Hp was present, the amount of virus was
demonstrated to decrease, indicating that Hp inhibited viral
clearance.
It has previously been demonstrated that Hp
functions as an immune system modulator (27). Hp establishes Th1-Th2 balance by
enhancing the Th1 cellular response in vitro (31). Via the cluster of differentiation
(CD)11b/CD18 (MAC 1) receptor, Hp binds to granulocytes, monocytes,
T CD8 cells and natural killer cells, and can regulate the function
of MAC 1 dependent cells (32). The
Hp-hemoglobin complex is migrated by binding to the CD163 receptors
on the surface of monocytes and macrophages (33,34). In the present
study, the plasma levels of HP following IFN treatment were
significantly lower than prior to treatment. It was hypothesized
that the level of Hp may have some association with IFN. In
vitro experiments demonstrated that the levels of IFN in
HepG2.2.15 cells increased when Hp expression was inhibited. It was
speculated that the presence of Hp may inhibit IFN, but it is not
clear how specific pathways may affect it. The effects of Hp levels
on the levels of downstream molecules of IFN were also explored.
With the siRNA-meditated under expression of Hp, levels of IFNβ
increased and the downstream molecules of IFN increased
significantly. This data demonstrated that the presence of Hp not
only inhibits the production of IFN, but also inhibits the
production of downstream signaling molecules.
The present findings suggest the following: i) Hp
was the most downregulated differential protein following IFN
treatment, the level of Hp is decreased in patients with low HBV
levels and the level of Hp may reflect the therapeutic effect of
IFN. ii) Patients with low HBV levels exhibit a decreased level of
Hp; in the in vitro experiments, the level of HBV-DNA was
significantly decreased when Hp expression was inhibited,
suggesting that Hp may promote the replication of HBV and inhibit
the clearance of HBV. iii) Hp exhibited the greatest downregulation
following IFN treatment, and affects the production of IFN and its
downstream molecules; suggesting that there is an association
between Hp and IFN. In future in vitro experiments, we may
alter exogenous IFN levels to explore whether this inhibits the
clearance of HBV.
The present study also had a number of limitations.
Firstly, changes in serum protein levels following treatment with
other drugs (nucleotide analogues) were not excluded. Secondly,
there was a lack of normal patient control samples. A more rigorous
experimental design is required in future experiments, as the
present conclusions are valuable, and merit further
exploration.
Acknowledgements
Not applicable.
Funding
The present study was supported by National Nature
Science Foundation of China (grant no. 81172804).
Availability of data and materials
The datasets used and/or analyzed during the present
study are available from the corresponding author on reasonable
request.
Authors' contributions
LL made substantial contributions to the design of
the present study and to the acquisition, analysis and
interpretation of the data. LL, TS and YY participated in the
design of the study and in the acquisition, analysis and
interpretation of data. All authors have read and approved the
final manuscript.
Ethics approval and consent to
participate
The Ethics Committee of Chongqing Medical University
(Chongqing, China) approved this study. Written informed consent
was obtained from all participants prior to treatment.
Patient consent for publication
Not applicable.
Competing interests
The authors declare that they have no competing
interests.
References
|
1
|
GBD 2013 Mortality and Causes of Death
Collaborators: Global, regional, and national age-sex specific
all-cause and cause-specific mortality for 240 causes of death,
1990–2013: A systematic analysis for the global burden of disease
study 2013. Lancet. 385:117–171. 2015. View Article : Google Scholar : PubMed/NCBI
|
|
2
|
Torresi J and Locarnini SA: New
therapeutic strategies in the treatment of hepatitis B virus
infection. Expert Opin Investig Drugs. 8:289–305. 1999. View Article : Google Scholar : PubMed/NCBI
|
|
3
|
van Zonneveld M, Honkoop P, Hansen BE,
Niesters HG, Darwish Murad S, de Man RA, Schalm SW and Janssen HL:
Long-term follow-up of alpha-interferon treatment of patients with
chronic hepatitis B. Hepatology. 39:804–810. 2004. View Article : Google Scholar : PubMed/NCBI
|
|
4
|
Sung JJ, Tsoi KK, Wong VW, Li KC and Chan
HL: Meta-analysis: Treatment of hepatitis B infection reduces risk
of hepatocellular carcinoma. Aliment Pharmacol Ther. 28:1067–1077.
2008. View Article : Google Scholar : PubMed/NCBI
|
|
5
|
Lau GK, Piratvisuth T, Luo KX, Marcellin
P, Thongsawat S, Cooksley G, Gane E, Fried MW, Chow WC, Paik SW, et
al: Peginterferon Alfa-2a, lamivudine, and the combination for
HBeAg-positive chronic hepatitis B. N Engl J Med. 352:2682–2695.
2005. View Article : Google Scholar : PubMed/NCBI
|
|
6
|
Janssen HL, van Zonneveld M, Senturk H,
Zeuzem S, Akarca US, Cakaloglu Y, Simon C, So TM, Gerken G, de Man
RA, et al: Pegylated interferon alfa-2b alone or in combination
with lamivudine for HBeAg-positive chronic hepatitis B: A
randomised trial. Lancet. 365:123–129. 2005. View Article : Google Scholar : PubMed/NCBI
|
|
7
|
Terrault NA, Bzowej NH, Chang KM, Hwang
JP, Jonas MM and Murad MH; American Association for the Study of
Liver Diseases, : AASLD guidelines for treatment of chronic
hepatitis B. Hepatology. 63:261–283. 2016. View Article : Google Scholar : PubMed/NCBI
|
|
8
|
Rai AJ, Gelfand CA, Haywood BC, Warunek
DJ, Yi J, Schuchard MD, Mehigh RJ, Cockrill SL, Scott GB, Tammen H,
et al: HUPO plasma proteome project specimen collection and
handling: Towards the standardization of parameters for plasma
proteome samples. Proteomics. 5:3262–3277. 2005. View Article : Google Scholar : PubMed/NCBI
|
|
9
|
Zhang H, Li H, Yang Y, Li S, Ren H, Zhang
D and Hu H: Differential regulation of host genes including hepatic
fatty acid synthase in HBV-transgenic mice. J Proteome Res.
12:2967–2979. 2013. View Article : Google Scholar : PubMed/NCBI
|
|
10
|
Yang Y, Toy W, Choong LY, Hou P, Ashktorab
H, Smoot DT, Yeoh KG and Lim YP: Discovery of SLC3A2 cell membrane
protein as a potential gastric cancer biomarker: Implications in
molecular imaging. J Proteome Res. 11:5736–5747. 2012. View Article : Google Scholar : PubMed/NCBI
|
|
11
|
Kersey PJ, Duarte J, Williams A,
Karavidopoulou Y, Birney E and Apweiler R: The international
protein index: An integrated database for proteomics experiments.
Proteomics. 4:1985–1988. 2004. View Article : Google Scholar : PubMed/NCBI
|
|
12
|
Sells MA, Chen ML and Acs G: Production of
hepatitis B virus particles in Hep G2 cells transfected with cloned
hepatitis B virus DNA. Proc Natl Acad Sci USA. 84:1005–1009. 1987.
View Article : Google Scholar : PubMed/NCBI
|
|
13
|
Lepiller Q, Abbas W, Kumar A, Tripathy MK
and Herbein G: HCMV activates the IL-6-JAK-STAT3 axis in HepG2
cells and primary human hepatocytes. PLoS One. 8:e595912013.
View Article : Google Scholar : PubMed/NCBI
|
|
14
|
She S, Xiang Y, Yang M, Ding X, Liu X, Ma
L, Liu Q, Liu B, Lu Z, Li S, et al: C-reactive protein is a
biomarker of AFP-negative HBV-related hepatocellular carcinoma. Int
J Oncol. 47:543–554. 2015. View Article : Google Scholar : PubMed/NCBI
|
|
15
|
Schmittgen TD and Livak KJ: Analyzing
real-time PCR data by the comparative C(T) method. Nat Protoc.
3:1101–1108. 2008. View Article : Google Scholar : PubMed/NCBI
|
|
16
|
Zhou C, Simpson KL, Lancashire LJ, Walker
MJ, Dawson MJ, Unwin RD, Rembielak A, Price P, West C, Dive C and
Whetton AD: Statistical considerations of optimal study design for
human plasma proteomics and biomarker discovery. J Proteome Res.
11:2103–2113. 2012. View Article : Google Scholar : PubMed/NCBI
|
|
17
|
Chong PK, Lee H, Zhou J, Liu SC, Loh MC,
So JB, Lim KH, Yeoh KG and Lim YP: Reduced plasma APOA1 level is
associated with gastric tumor growth in MKN45 mouse xenograft
model. J Proteomics. 73:1632–1640. 2010. View Article : Google Scholar : PubMed/NCBI
|
|
18
|
Osiowy C, Coffin C and Andonov A: Review
of laboratory tests used in monitoring hepatitis B response to
pegylated interferon and nucleos(t)ide analog therapy. Curr Treat
Options Infect Dis. 8:177–193. 2016. View Article : Google Scholar : PubMed/NCBI
|
|
19
|
Buster EH, Hansen BE, Lau GK, Piratvisuth
T, Zeuzem S, Steyerberg EW and Janssen HL: Factors that predict
response of patients with hepatitis B e antigen-positive chronic
hepatitis B to peginterferon-alfa. Gastroenterology. 137:2002–2009.
2009. View Article : Google Scholar : PubMed/NCBI
|
|
20
|
Gygi SP, Rist B, Gerber SA, Turecek F,
Gelb MH and Aebersold R: Quantitative analysis of complex protein
mixtures using isotope-coded affinity tags. Nat Biotechnol.
17:994–999. 1999. View
Article : Google Scholar : PubMed/NCBI
|
|
21
|
Ross PL, Huang YN, Marchese JN, Williamson
B, Parker K, Hattan S, Khainovski N, Pillai S, Dey S, Daniels S, et
al: Multiplexed protein quantitation in Saccharomyces cerevisiae
using amine-reactive isobaric tagging reagents. Mol Cell
Proteomics. 3:1154–1169. 2004. View Article : Google Scholar : PubMed/NCBI
|
|
22
|
Javid J: Human haptoglobins. Curr Top
Hematol. 1:151–192. 1978.PubMed/NCBI
|
|
23
|
Andersen CBF, Stødkilde K, Sæderup KL,
Kuhlee A, Raunser S, Graversen JH and Moestrup SK: Haptoglobin.
Antioxid Redox Signal. 26:814–831. 2017. View Article : Google Scholar : PubMed/NCBI
|
|
24
|
Smithies O: Zone electrophoresis in starch
gels: Group variations in the serum proteins of normal human
adults. Biochem J. 61:629–641. 1955. View Article : Google Scholar : PubMed/NCBI
|
|
25
|
Lim SK: Consequences of haemolysis without
haptoglobin. Redox Rep. 6:375–378. 2001. View Article : Google Scholar : PubMed/NCBI
|
|
26
|
Sadrzadeh SM and Bozorgmehr J: Haptoglobin
phenotypes in health and disorders. Am J Clin Pathol. 121
(Suppl):S97–S104. 2004.PubMed/NCBI
|
|
27
|
Wang F, Huang W and Li A: Serum
haptoglobin suppresses T-lymphocyte functions following burns. Chin
Med Sci J. 11:180–183. 1996.PubMed/NCBI
|
|
28
|
Peta V, Tse C, Perazzo H, Munteanu M, Ngo
Y, Ngo A, Ramanujam N, Verglas L, Mallet M, Ratziu V, et al: Serum
apolipoprotein A1 and haptoglobin, in patients with suspected
drug-induced liver injury (DILI) as biomarkers of recovery. PLoS
One. 12:e01894362017. View Article : Google Scholar : PubMed/NCBI
|
|
29
|
Louagie H, Delanghe J, Desombere I, De
Buyzere M, Hauser P and Leroux-Roels G: Haptoglobin polymorphism
and the immune response after hepatitis B vaccination. Vaccine.
11:1188–1190. 1993. View Article : Google Scholar : PubMed/NCBI
|
|
30
|
Arredouani M, Matthijs P, Van Hoeyveld E,
Kasran A, Baumann H, Ceuppens JL and Stevens E: Haptoglobin
directly affects T cells and suppresses T helper cell type 2
cytokine release. Immunology. 108:144–151. 2003. View Article : Google Scholar : PubMed/NCBI
|
|
31
|
El Ghmati SM, Van Hoeyveld EM, Van Strijp
JG, Ceuppens JL and Stevens EA: Identification of haptoglobin as an
alternative ligand for CD11b/CD18. J Immunol. 156:2542–2552.
1996.PubMed/NCBI
|
|
32
|
Goldstein JI, Goldstein KA, Wardwell K,
Fahrner SL, Goonan KE, Cheney MD, Yeager MP and Guyre PM: Increase
in plasma and surface CD163 levels in patients undergoing coronary
artery bypass graft surgery. Atherosclerosis. 170:325–332. 2003.
View Article : Google Scholar : PubMed/NCBI
|
|
33
|
Kristiansen M, Graversen JH, Jacobsen C,
Sonne O, Hoffman HJ, Law SK and Moestrup SK: Identification of the
haemoglobin scavenger receptor. Nature. 409:198–201. 2001.
View Article : Google Scholar : PubMed/NCBI
|