Introduction
Extracellular matrix (ECM) accumulation or changing
of the condition of the extracellular matrix is a common
pathological reaction to tissue abuse acting as hyperglycemia
(1). ECM is dissimilar
quantitatively and qualitatively within various tissue and organs.
The changes of which lead to diabetes-induced organ and system
failure, resulting in nephropathy, retinopathy, and diabetic
cardiomyopathy (2). It comprises
protein fibers such as collagens and elastins implanted in an
amorphous compound of proteoglycan molecules. Chronic hyperglycemia
can cause disturbances of morphology and biochemistry of ECM that
are associated with a lost function in target organs and induces
the increase of reactive oxidative species (ROS) production
(3). Furthermore, the excessive
accumulation of fat and oxidative stress can influence diabetic
pathology and complications, including diabetic liver damage
(4). Oxidative stress occurs when
the production of ROS exceeds its clearance. It constitutes a
characteristic feature of hepatic injuries (5). At this time, the hepatocytes are
damaged and Kupffer cells are activated. The inflammatory cells and
platelets release cytokines and growth factors that result in
fibrogenesis (6,7). Fibrosis is the deposit of connective
tissue by the liver in response to injury commonly found in most
chronic inflammatory liver diseases.
Liver fibrosis entails substantial alterations in
both composition and amount of the deposited ECM (4). This process comprises an inflammatory
response and limits ECM deposition. The inflammatory cytokines and
growth factors induce hepatic stellate cell (HSC) activation and
cellular production such as transforming growth factor (TGF)-β
(8), collagen (type I, III, and IV)
(9), and fibronectin (10,11).
TGF-β creates an accumulation of pro-fibrotic factors at the site
of injury, which is common in several human fibrotic states
(12). Collagens type I and IV are
associated with the healing process of diabetic liver tissue
(6). Therefore, the appearance and
detection of collagen deposition in liver tissues might be the key
markers for diagnosis (13,14). Fibronectin participates in the
progression of the fibrotic state and supports other matrix
proteins correlating with cell cycle development. Furthermore, it
also cooperates in cell proliferation and adhesion (15).
The deposition of collagen is the initiating event
triggering liver fibrosis (16,17).
Concerning acute hepatic injury, HSCs (HSCs) differentiate from
pericytes into myofibroblasts for reconstruction of the ECM.
Conversely, in chronic hepatic injury, HSCs occupy the space of
Disse to serve the progression of excessive ECM production and
decrease ECM metabolism (11).
Movement and aggregation of HSCs at the area of tissue
reconstruction activate ECM deposition and alter its degeneration
(9). If the hepatic injury
continues, the liver regeneration eventually fails, and abundant
ECM fills the place occupied by hepatocytes leading to
collagenization of liver tissue (16).
Licorice has been reported to protect against
hepatic injury (18). It also
prevents oncogenesis caused by abnormal hormones or toxic
substances and ameliorates free radical-induced oxidative of kidney
damage (19). Glabridin ishe main
active component of licorice (Glycyrrhiza glabra). It is a
polyphenolic flavonoid that displays estrogenic, antimicrobial,
anti-fatigue and anti-proliferative activity activities in human
breast cancer cells (20). In
addition, it reduces inflammation and alters melanogenesis
(21). Glabridin displays potent
antioxidative and superoxide-scavenging activities in biological
membranes (22). It can prevent
mitochondrial lipid peroxidation and protect respiratory enzyme
activities against oxidative stresses in the mitochondrial electron
transport system (22). Accumulating
lines of evidence demonstrated that licorice has anti-inflammatory,
anticancer, antioxidant and antimicrobial effects (20,23). In
particular, Jung et al (24)
have previously evaluated the hepatoprotective effects of licorice
extract and suggested that it could reduce liver injury by
enhancing antioxidant and anti-inflammatory capacity in alcohol
induced fatty liver disease. In addition, Wu et al (25), reported that the hypoglycemic effect
of glabridin increased body weight, glucose tolerance and
superoxide dismutase (SOD) activities in the liver, kidney and
pancreas, whereas decreasing fasting blood sugar levels and
malondialdehyde (MDA) content in the liver, kidney and pancreas in
the STZ induced diabetic mice for 28 days. The morphological
changes of liver cells and tissues that may result from the
treatment and supplementation with glabridin remain to be
elucidated. The present study aimed to evaluate the efficiency of
glabridin on restoration and improvement of diabetic liver tissue
on histological, ultrastructural changes and to determine the
collagen type I and fibronectin protein expressions in
streptozotocin (STZ)-induced diabetic rats. The results indicated
that glabridin from licorice may affect the collagen deposition and
the ECM accumulation and reverse the patterns of area-based liver
tissue reorganization. Therefore, glabridin may have potential to
repair the damaged diabetic liver.
Materials and methods
Induction and assessment of
diabetes
The present study used 8-week-old male Wistar rats
(weight, 200–250 g) provided by the Southern Laboratory Animal
Facility, Prince of Songkla University (Hatyai, Thailand). A total
of 40 rats were housed in a controlled animal laboratory
environment and maintained under a humidity of (50±10%) in a 12-h
light/dark cycle (25±2°C), with ad libitum access to
standard rat chow and water. The experimental protocol used was
approved by the Animal Ethics Committee of the Prince of Songkla
University. Experimental diabetic rats were induced by single dose
intraperitoneal injection of STZ (60 mg/kg; Sigma-Aldrich; Merck
KGaA, Darmstadt, Germany) dissolved in 0.1 mol/l citrate buffer.
Control rats were injected with citrate buffer alone. Blood sugar
level was measured and analyzed by one-touch glucometer (Accu-Check
Active®; Roche Diagnostics GmbH, Mannheim, Germany).
Rats with blood sugar level >250 mg/dl were used as the diabetic
group. In order to monitor blood glucose levels, blood glucose was
tested every week for 8 weeks. Control and diabetic rats were
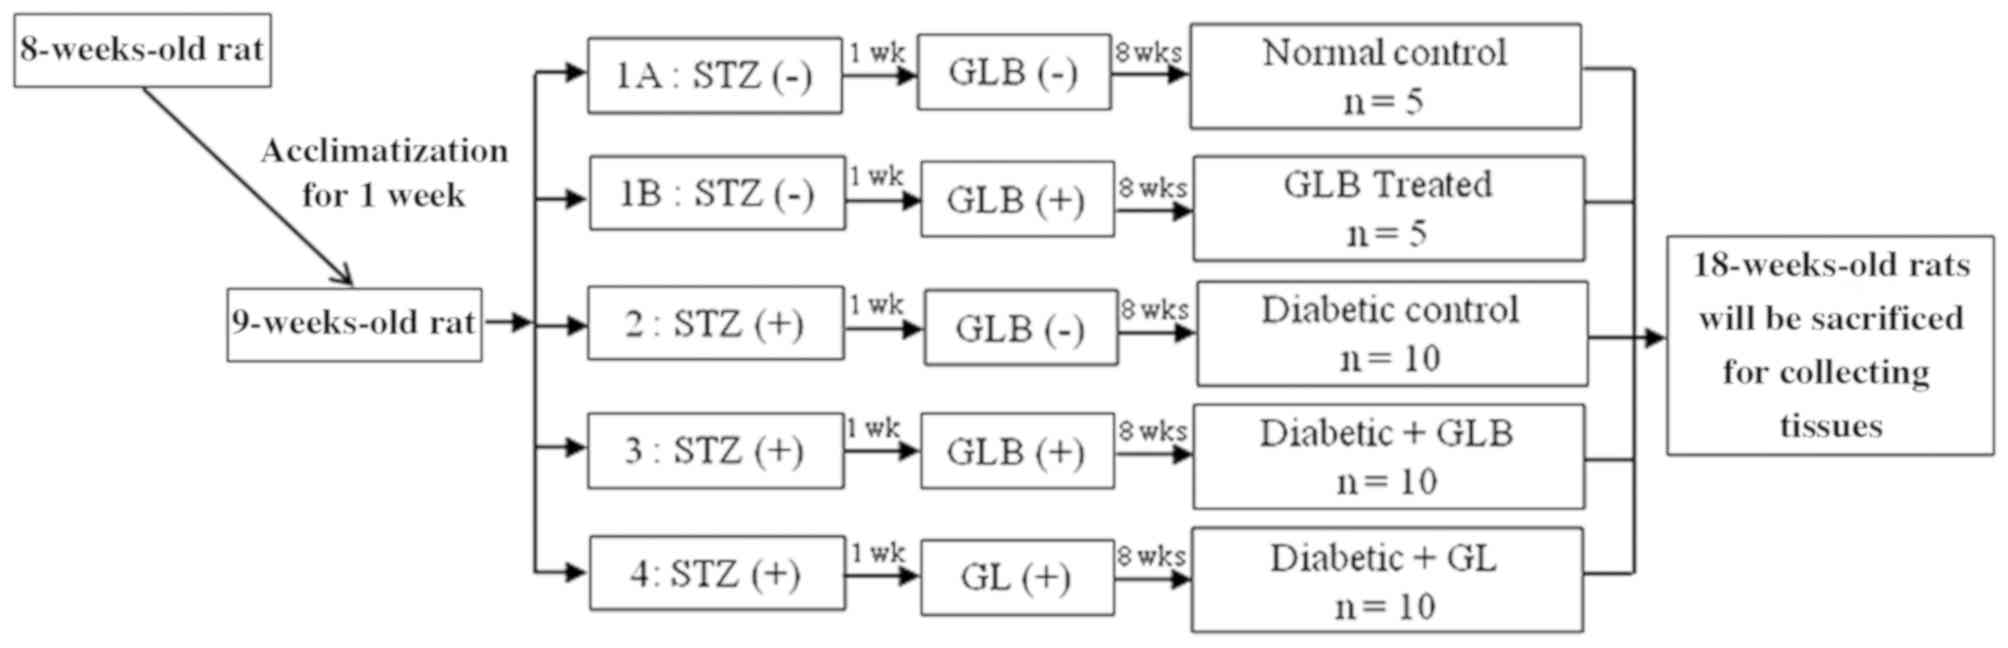
randomly divided into five groups (each, n=10; Fig. 1): Control rats receiving a balanced
standard diet; glabridin control rats receiving the same diet
supplemented with glabridin (GLB; purified >98% by
high-performance liquid chromatography analysis; Shaanxi Langrun
Biotechnology Co., Ltd., Xi'an, China) in 0.5 ml of 0.5% Tween 80
solution; diabetic rats receiving a balanced standard diet (DM);
diabetic rats receiving a balanced standard diet supplemented with
glabridin (DM+GLB) in 0.5 ml of 0.5% Tween 80 solution; and
diabetic rats treated with glibenclamide (Sigma-Aldrich; Merck
KGaA; DM+GL) 4 mg/kg in 0.5 ml of 0.5% Tween 80 solution in order
to demonstrate the effectiveness of glabridin. All animals were
clinically observed and weighed on a weekly basis. Following 8
weeks of glabridin supplementation, the animals were sacrificed and
blood was drawn from the heart into sample tubes for screening of
liver function. The liver function test was analyzed by the
Southern Lab Center Saha Clinic (Songkhla, Thailand; using a
Siemens ADVIA 1800 System Analyzer; Siemens Healthineers, Erlangen,
Germany). Livers were removed, dissected, and immediately fixed in
10% formalin at room temperature for 24 h as a preparation for
histological experiments.
Masson's trichrome staining
Following fixing the hepatic tissue samples in 10%
formalin, they were dehydrated in graded series of ethanol through
70, 80, 90, 95 and 100% with two changes for 1 h each. Three
changes of xylene as clearing reagent for 30 min each were
performed. Hepatic tissues were then embedded in paraffin, sliced
into 5-µm sections, and stained with Masson's trichrome at room
temperature for 2 h. All hepatic sections were examined and images
were captured via light microscopy (magnification, ×20 and ×60;
BX-50; Olympus Corporation, Tokyo, Japan). Thickenings of the
perisinusoidal, periportal and pericentral spaces (26) were measured and analyzed by Olympus
cellSens software version 1.12 (Olympus Corporation).
Transmission electron microscopy
(TEM)
Liver tissue samples, 1 mm3 in size, were
taken from the livers. They were immediately fixed in 2.5% buffered
glutaraldehyde for 2 h at room temperature. Subsequently, the
specimens were immersed in 1% osmium tetroxide, dehydrated,
infiltrated with propylene oxide, and embedded in pure Araldite 502
resin polymerized at room temperature for 24 h, 48°C for 48 h and
60°C for 48 h. Then, thin sections (0.5–1.0 µm) were stained with
Toluidine blue for 2 min at room temperature, used as a guideline
to identify the area of interest and further sections. Ultrathin
sections ~60 nm were processed using an ultramicrotome. Ultrathin
sections were then spread mostly on 200 or 300 mesh copper grids
and stained with uranyl acetate and lead citrate solutions both at
room temperature for 15 min. The section were examined and images
were captured using TEM (TEM-JEM2010; JEOL, Ltd., Tokyo,
Japan).
Western blot analysis of collagen type
I and fibronectin
Liver lysates were prepared on ice-cold RIPA buffer
(Sigma-Aldrich; Merck KGaA) supplemented with 1× protease inhibitor
cocktails (EMD Millipore, Billerica, MA, USA). Homogenates were
centrifuged at 14,000 × g for 30 min at 4°C to collect
supernatants. The protein concentration of the supernatant was
assessed using a BCA protein assay kit (Pierce; Thermo Fisher
Scientific, Inc., Waltham, MA, USA). Protein samples (10 µg) of
liver tissues from control, GLB, DM, DM+GLB and DM+GL rats were
diluted 1:2 in 2X treatment buffer (0.125 M Tris-HCl, 4% SDS, 20%
glycerol, 10% 2-mercaptoethanol and 0.2% bromophenol blue) and
boiled for 5 min. Protein samples were separated by 12%
polyacrylamide gel electrophoresis and then transferred (100 V,
0.35 A and 300 W for 1.5 h) onto nitrocellulose membranes (GE
Healthcare, Chicago, IL, USA). The membrane was blocked with 5%
non-fat dry milk in 0.1% Tween phosphate buffer (PBS-T) for 60 min
at 4°C. Nitrocellulose blot was then probed with monoclonal
antibodies for collagen type I (1:3,000; cat. no. ab34710),
anti-fibronectin (1:3,000; cat. no. ab2413) and β-actin (1:5,000;
cat. no. ab8227; all Abcam, Cambridge, MA, USA) for 24 h at 4°C.
After incubating the sample with the primary antibody, the blot was
washed thrice in PBS-T, and then incubated for 2 h at room
temperature with a goat anti-rabbit horseradish
peroxidase-conjugated immunoglobulin G (1:10,000; cat. no. ab6721;
Abcam) which was used as a source of secondary antibodies. Finally,
the membranes were exposed to film for collagen type I and
fibronectin detection by enhanced chemiluminescence (ECL) method.
The ECL detection system and ECL film (GE Healthcare) were used to
visualize the presence of proteins on the nitrocellulose blots. The
intensity of western blot bands was quantified by densitometry,
using Scion Image 4.0 software (Scion Corporation, Frederick, MD,
USA).
Statistical analysis
Data are expressed as the mean ± standard error of
the mean. Statistical analysis was performed using one-way analysis
of variance and Bonferroni's post hoc test. P<0.05 was
considered to indicate a statistically significant difference.
Results
Effect of glabridin on blood sugar
levels and liver function test
Blood sugar levels in all animals were presented in
Table I. Following 1 week, rats
receiving STZ injection exhibited an increase in blood glucose
levels. They were significantly elevated in DM rats (P<0.001) as
compared with control rats until termination of the study at 8
weeks. The blood sugar levels of DM+GLB and DM+GL rats were reduced
when compared with DM rats. There was a significant decrease in
blood sugar levels in DM+GLB rats (5 weeks, P<0.01; 6–8 weeks,
P<0.001) and in DM+GL rats (P<0.001) at 5–8 weeks when
compared with DM rats. There were no significant differences
observed in the blood sugar levels between DM+GLB and DM+GL rats
for 8 weeks. The liver function test results of blood samples at 8
weeks are presented in Table II.
The glutamate oxaloacetate transaminase (SGOT), glutamate pyruvate
transaminase (SGPT) and alkaline phosphatase (ALP) levels in DM,
DM+GLB and DM+GL rats were increased when compared with control
rats. SGPT and ALP were significantly increased in DM rats
(P<0.05, and P<0.001 respectively) when compared with control
rats. Following administration with glabridin and glybenclamide,
the three parameters were markedly decreased in DM+GLB and DM+GL
rats when compared with DM rats; however, no significance
differences were identified among DM, DM+GLB and DM+GR rats.
 | Table I.Comparison of blood sugar levels in
different groups for 8 weeks. |
Table I.
Comparison of blood sugar levels in
different groups for 8 weeks.
| Week | Control
(mg/dl) | GLB (mg/dl) | DM (mg/dl) | DM+GLB (mg/dl) | DM+GL (mg/dl) |
|---|
| 1 | 70.50±4.92 | 67.00±5.15 |
360.50±32.33a |
314.83±30.71a |
297.67±20.69b |
| 2 | 72.00±5.49 | 88.50±7.75 |
290.50±34.44a |
311.67±49.73a |
241.00±36.43c |
| 3 | 79.17±3.25 | 100.50±5.68 |
351.17±43.25a |
305.33±52.59a |
176.50±38.65c |
| 4 | 73.33±3.57 | 86.33±2.67 |
243.67±30.75a | 170.67±41.11 | 187.50±45.61 |
| 5 | 72.00±3.98 | 75.67±3.55 |
301.50±55.41a |
137.00±40.87d |
192.50±54.94c |
| 6 | 73.58±3.55 | 82.83±1.51 |
351.00±34.82a |
69.50±13.69c |
149.00±47.48c |
| 7 | 73.00±4.25 | 83.00±4.37 |
457.00±20.99a |
158.33±37.64c |
165.83±49.04c |
| 8 | 74.67±3.31 | 81.17±3.73 |
353.83±35.16a |
174.50±30.99c |
160.67±52.46c |
| Table II.Comparison of liver function test
results in different groups at 8 weeks. |
Table II.
Comparison of liver function test
results in different groups at 8 weeks.
| Parameters | Control (U/L) | GLB (U/L) | DM (U/L) | DM+GLB (U/L) | DM+GL (U/L) |
|---|
| SGOT | 196.00±18.28 | 182.17±12.28 | 223.67±24.26 | 212.17±29.64 | 205.00±18.02 |
| SGPT | 69.83±6.82 | 63.83±7.88 |
182.33±20.05b | 115.67±18.56 | 111.83±18.52 |
| ALP | 162.33±18.27 | 157.33±17.64 |
837.33±55.49a |
726.50±27.57a |
766.83±87.85a |
Histological observations of liver
tissues with Masson's trichrome staining
Hepatocytes and blood vessels of the livers in all
rats throughout the 8-week experiments were radially arranged in
the liver lobule (Fig. 2). A
cellular plate formed of hepatocytes was directed from the
periphery of the lobule to its center, which was primarily one cell
thick and situated between a system of capillary sinusoids, forming
a meandering and porous like structure. The spaces between these
hepatic plates contained irregular dilated vessels, which were
capillaries and sinusoids. The sinusoids ran in the direction of
the center, where they drained into the central vein (Fig. 2C and F). The portal triad contained a
portal venule (a branch of the portal vein), an arteriole (a branch
of the hepatic artery) and bile ducts (portion of the hepatobiliary
system; Fig. 2A, B, D and E). The
loose connective tissue containing collagen fibers were also
present and located around every blood vessel, keeping the vessels
in place. Collagen was stained and indicated in blue or very light
green. Hepatocyte nuclei could be observed as dark red structures
within cells whereas the cytoplasm was stained red. The spaces
between the formed elements of the tissue were filled with the
matrix.
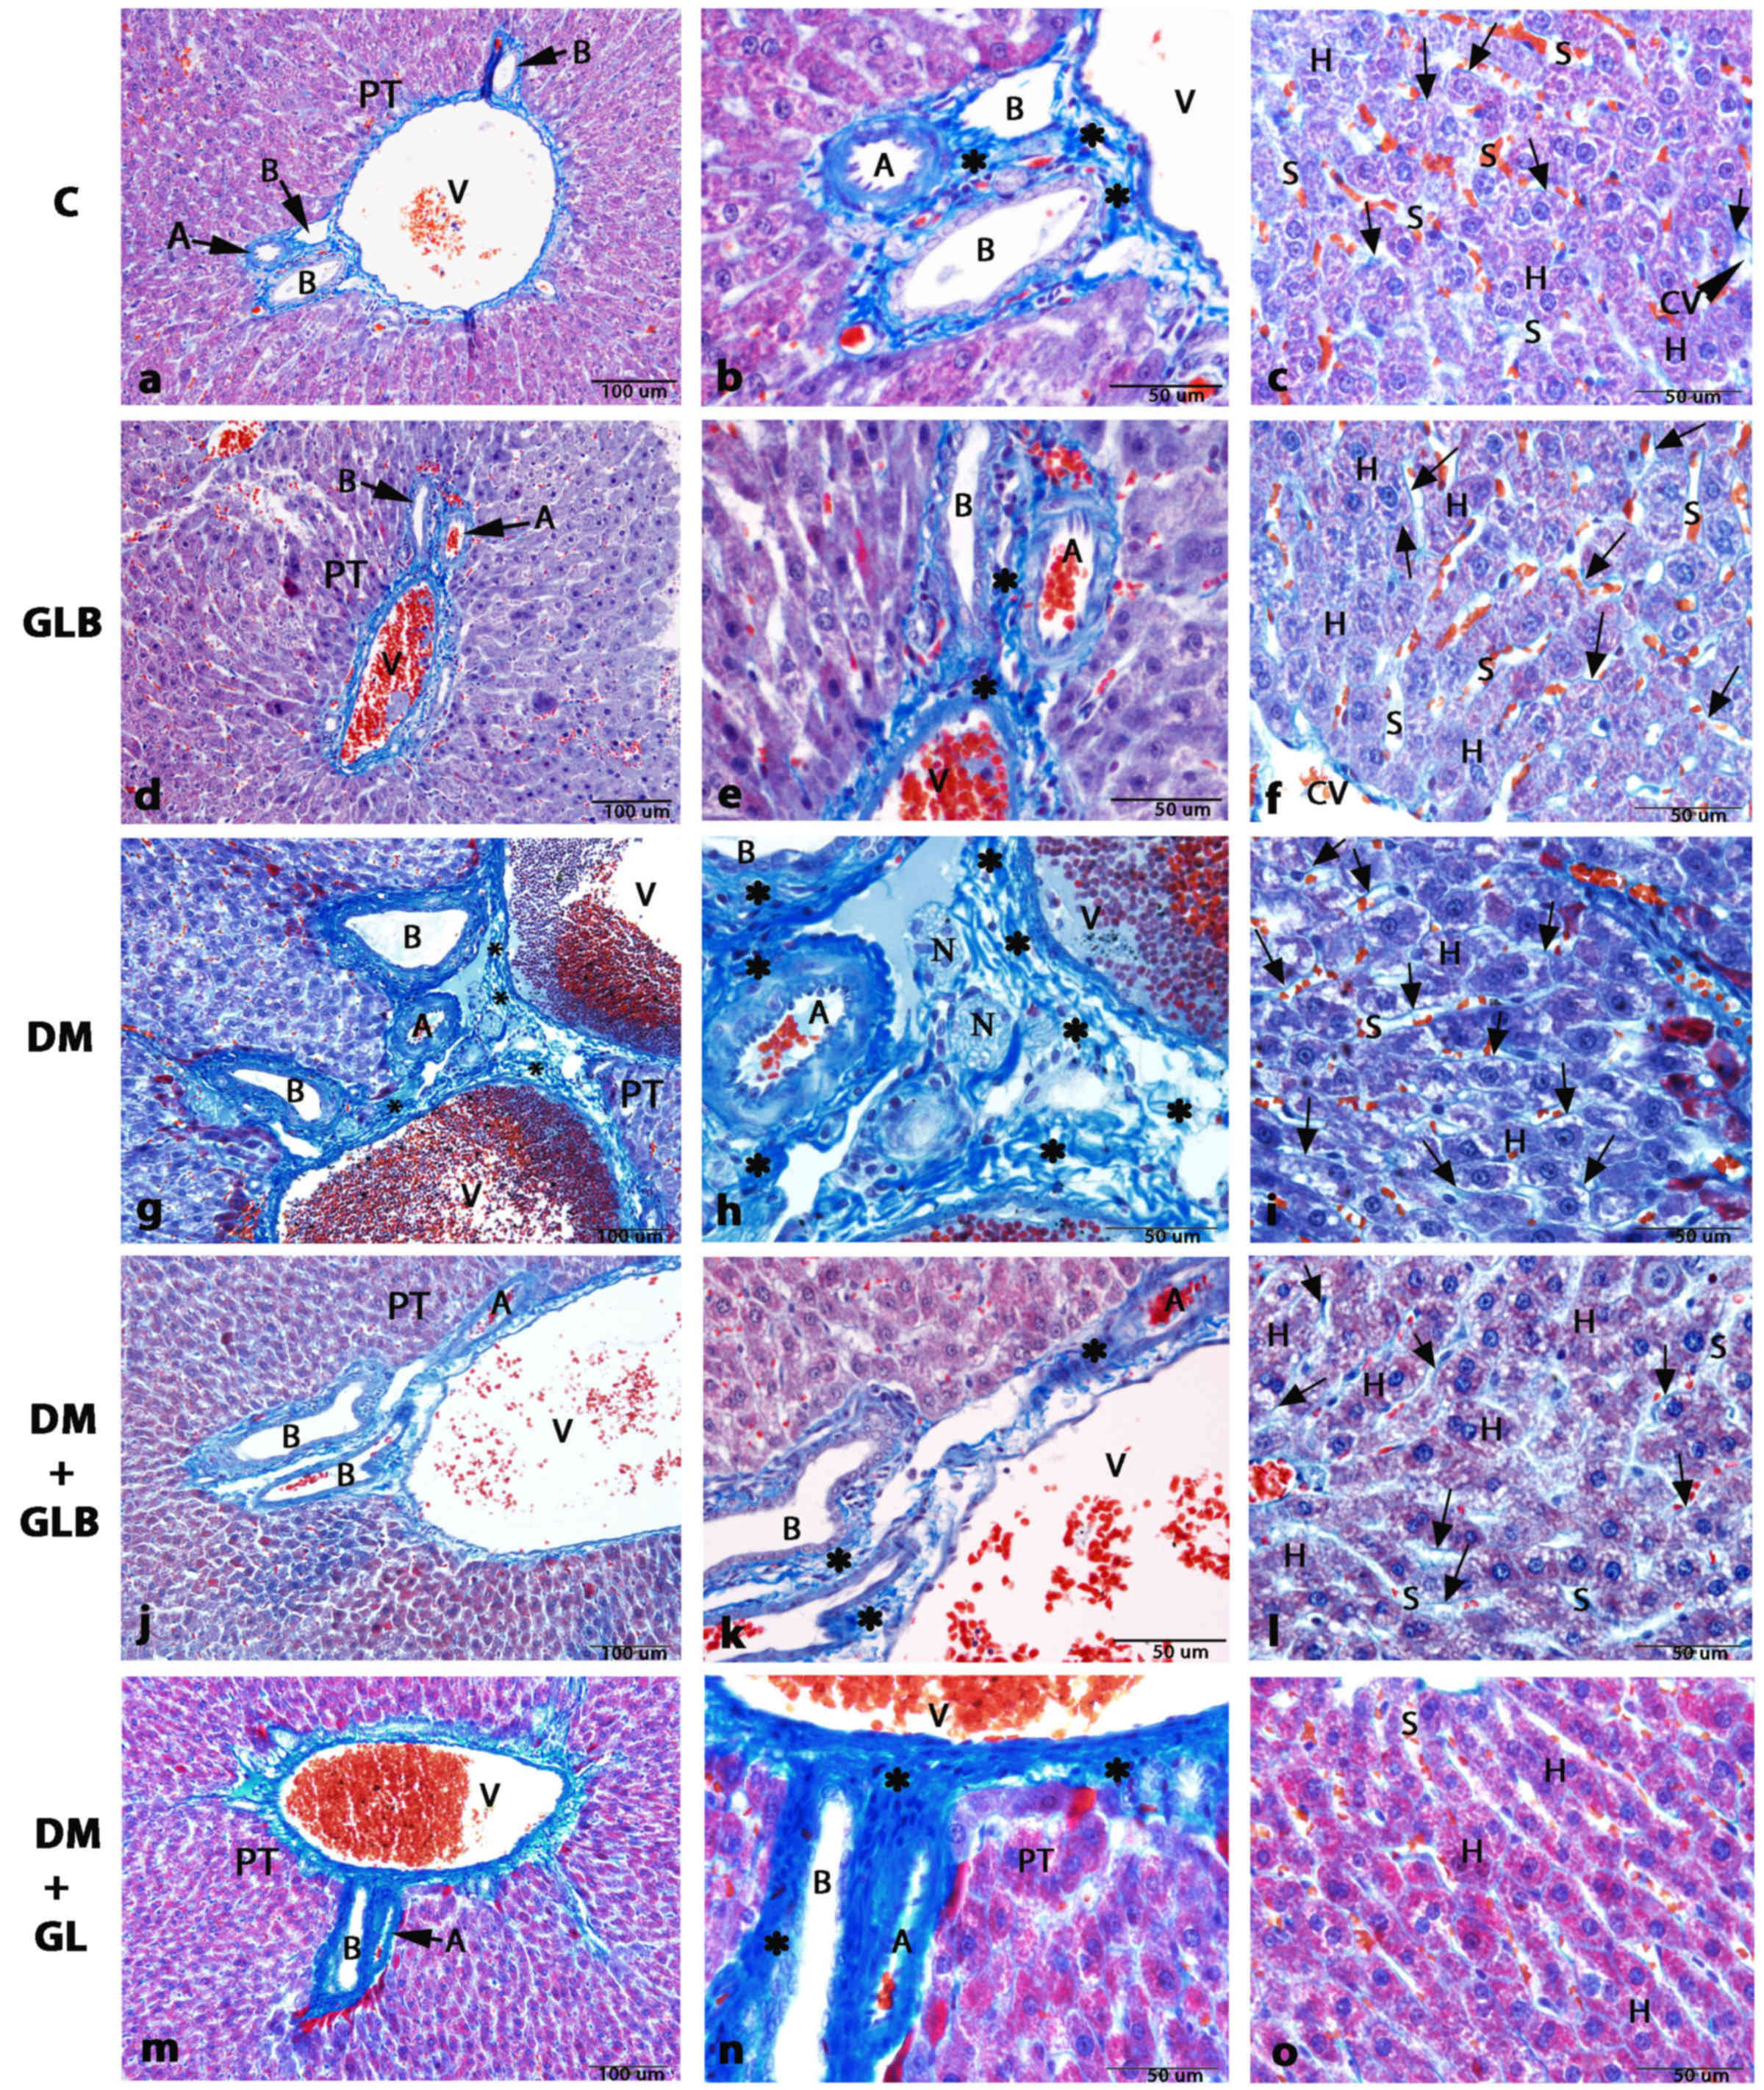 | Figure 2.Photomicrographs of histological
structure of liver tissue in rats by Masson's trichrome staining.
(A, B, and C) Control and (D, E and F) GLB tissue exhibited a
normal PT cellular architecture, consisting of V, A and B. A and D
(magnification, ×20). (B and E) Micrographs in the area of PT
showing the normal collagen fiber deposition (magnification, ×60).
(C and F) H arrangement resembled that of a sponge with sinusoids
presented by the S in the direction of the center, where they
drained into the CV. Collagen fibers are stained very light blue
(arrows) around the boundary of H (magnification, ×60). (G) The DM
group exhibited collagen fiber deposition which was increased at
the area of PT (magnification, ×20). (H) Micrograph in the area of
PT illustrating the abundant of collagen fiber deposition
(magnification, ×60). (I) Collagen fibers deposition also increases
in the area around the boundary of H along the sinusoids
(magnification, ×60). The DM+GLB (J, K and L) and DM+GL groups (M,
N and O) respectively illustrating the area of PT, which is similar
to control and GLB rats (magnification, ×20). (K and N) Micrographs
in the area of PT in high magnification (magnification, ×60). (L
and O) Liver tissue exhibits normal collagen fiber deposition
stained very light blue (arrows) around the boundary of H.
(magnification, ×60). *indicates collagen fiber deposition. PT,
portal triad; V, portal venule; A, arteriole; B, bile duct; H,
hepatocyte; CV, central vein; S, sinusoids; N, nerve bundles; DM,
diabetes mellitus; GLB, glabridin; GL, glibenclamide; H,
hepatocyte; CV, central vein. |
Liver tissues of DM rats revealed by collagen fiber
deposition were increased in the portal triads (Fig. 2G and H) and in the areas around the
boundary of hepatocytes along the sinusoidal spaces (Fig. 2I). The blood sinusoids around the
central vein were dilated (Fig. 2I).
Few sinusoids were opened into the central vein. Edema appeared in
the hepatocytes. The hepatocyte nuclei displayed signs of pyknosis.
Hepatocytes were large polyhedral cells with large round nuclei
(Fig. 2L). In addition, a number of
hepatocytes contained small dense nuclei with eosinophilic
cytoplasm. Another finding was that lipids accumulated in the
hepatocytes and formed non-membrane bound vacuoles with peripheral
nuclei. The hepatocytes radiating from the central vein exhibited a
regular pattern following glabridin supplementation. The portal
triad contained a portal venule, an arteriole, a bile duct and
lymphatic vessels (Fig. 2I and K),
which were similar in the normal portal triad of control rats.
Blood sinusoids were located between plates of hepatocytes.
Administration of glabridin in DM+GLB (Fig. 2L) and glibenclamide in DM+GL
(Fig. 2O) rats lowered the increase
of central vein and sinusoidal dilatation, lipid accumulation,
pyknotic nuclei of hepatocytes and inflammation in the area of
portal triad. Decreased collagen fiber deposition in the portal
triad in DM+GLB and DM+GL rats (Fig. 2I
and K) were a signal of reduced fibrosis. Therefore, glabridin
attenuated the severity of liver damage resulting from STZ-induced
diabetes.
The area of collagen deposition in the liver tissue,
stained in blue, were quantified by thickness in three zones, area
of portal triad (periportal area or periportal space; PT), area
around the boundary of hepatocytes along the sinusoidal space
(perisinusoidal area or perisinusoidal space; PS) and around the
central vein (pericentral area or pericentral space; PC) of all
animal groups. The thickness of these three different zones were
measured (Table III). The
thickness of PT, PC and PS in DM rats (70.71±7.13, 9.92±1.74 and
3.06±0.56 µm, respectively) was increased, when compared with
control rats. They were significantly increased in PT and PC of DM
(P<0.001) when compared with control rats. In contrast,
thickness of PT, PC and PS was markedly reduced compared with the
DM group following supplementation of DM+GLB (38.36±6.36, 5.19±0.50
and 1.16±0.26, respectively) and DM+GL (37.49±3.66, 5.07±0.81 and
1.18±0.16, respectively).
| Table III.Thickness of collagen deposition in
PT, PC and PS (µm) in different groups. |
Table III.
Thickness of collagen deposition in
PT, PC and PS (µm) in different groups.
| Group | PT (µm) | PC (µm) | PS (µm) |
|---|
| Control | 31.51±2.49 | 4.63±0.50 | 1.15±0.25 |
| GLB | 31.77±1.95 | 4.49±0.58 | 1.13±0.18 |
| DM |
70.71±7.13a |
9.92±1.74a | 3.06±0.56 |
| DM+GLB | 38.36±6.36 | 5.19±0.50 | 1.16±0.26 |
| DM+GL | 37.49±3.66 | 5.07±0.81 | 1.18±0.16 |
Histological changes in liver cells
and tissue with TEM technique
TEM was used to observe differences in hepatic cells
and tissues (Figs. 3 and 4). Micrographs of normal livers in control
(Fig. 3A) and GLB (Fig. B rats
exhibited round euchromatic nuclei. The cytoplasm contained
numerous mitochondria, which presented with round and oval shapes
inside. Smooth and rough endoplasmic reticulum were abundant
whereas Golgi apparatus were dispersed in the cytoplasm. The
hepatic sinusoids were lined with thin endothelial cells. The
perisinusoidal space was located between hepatocytes and the wall
of hepatic sinusoids. Numerous microvilli extended from the surface
of hepatocyte to the perisinusoidal space. (Fig. 4A) and GLB (Fig. 4B) rats. HSCs were observed in the
perisinusoidal space that separated sinusoid and hepatocytes. The
nuclei of the HSCs were visible with heterochromatin. Its cytoplasm
was abundant and indented by fat droplets (Fig. 4A and B).
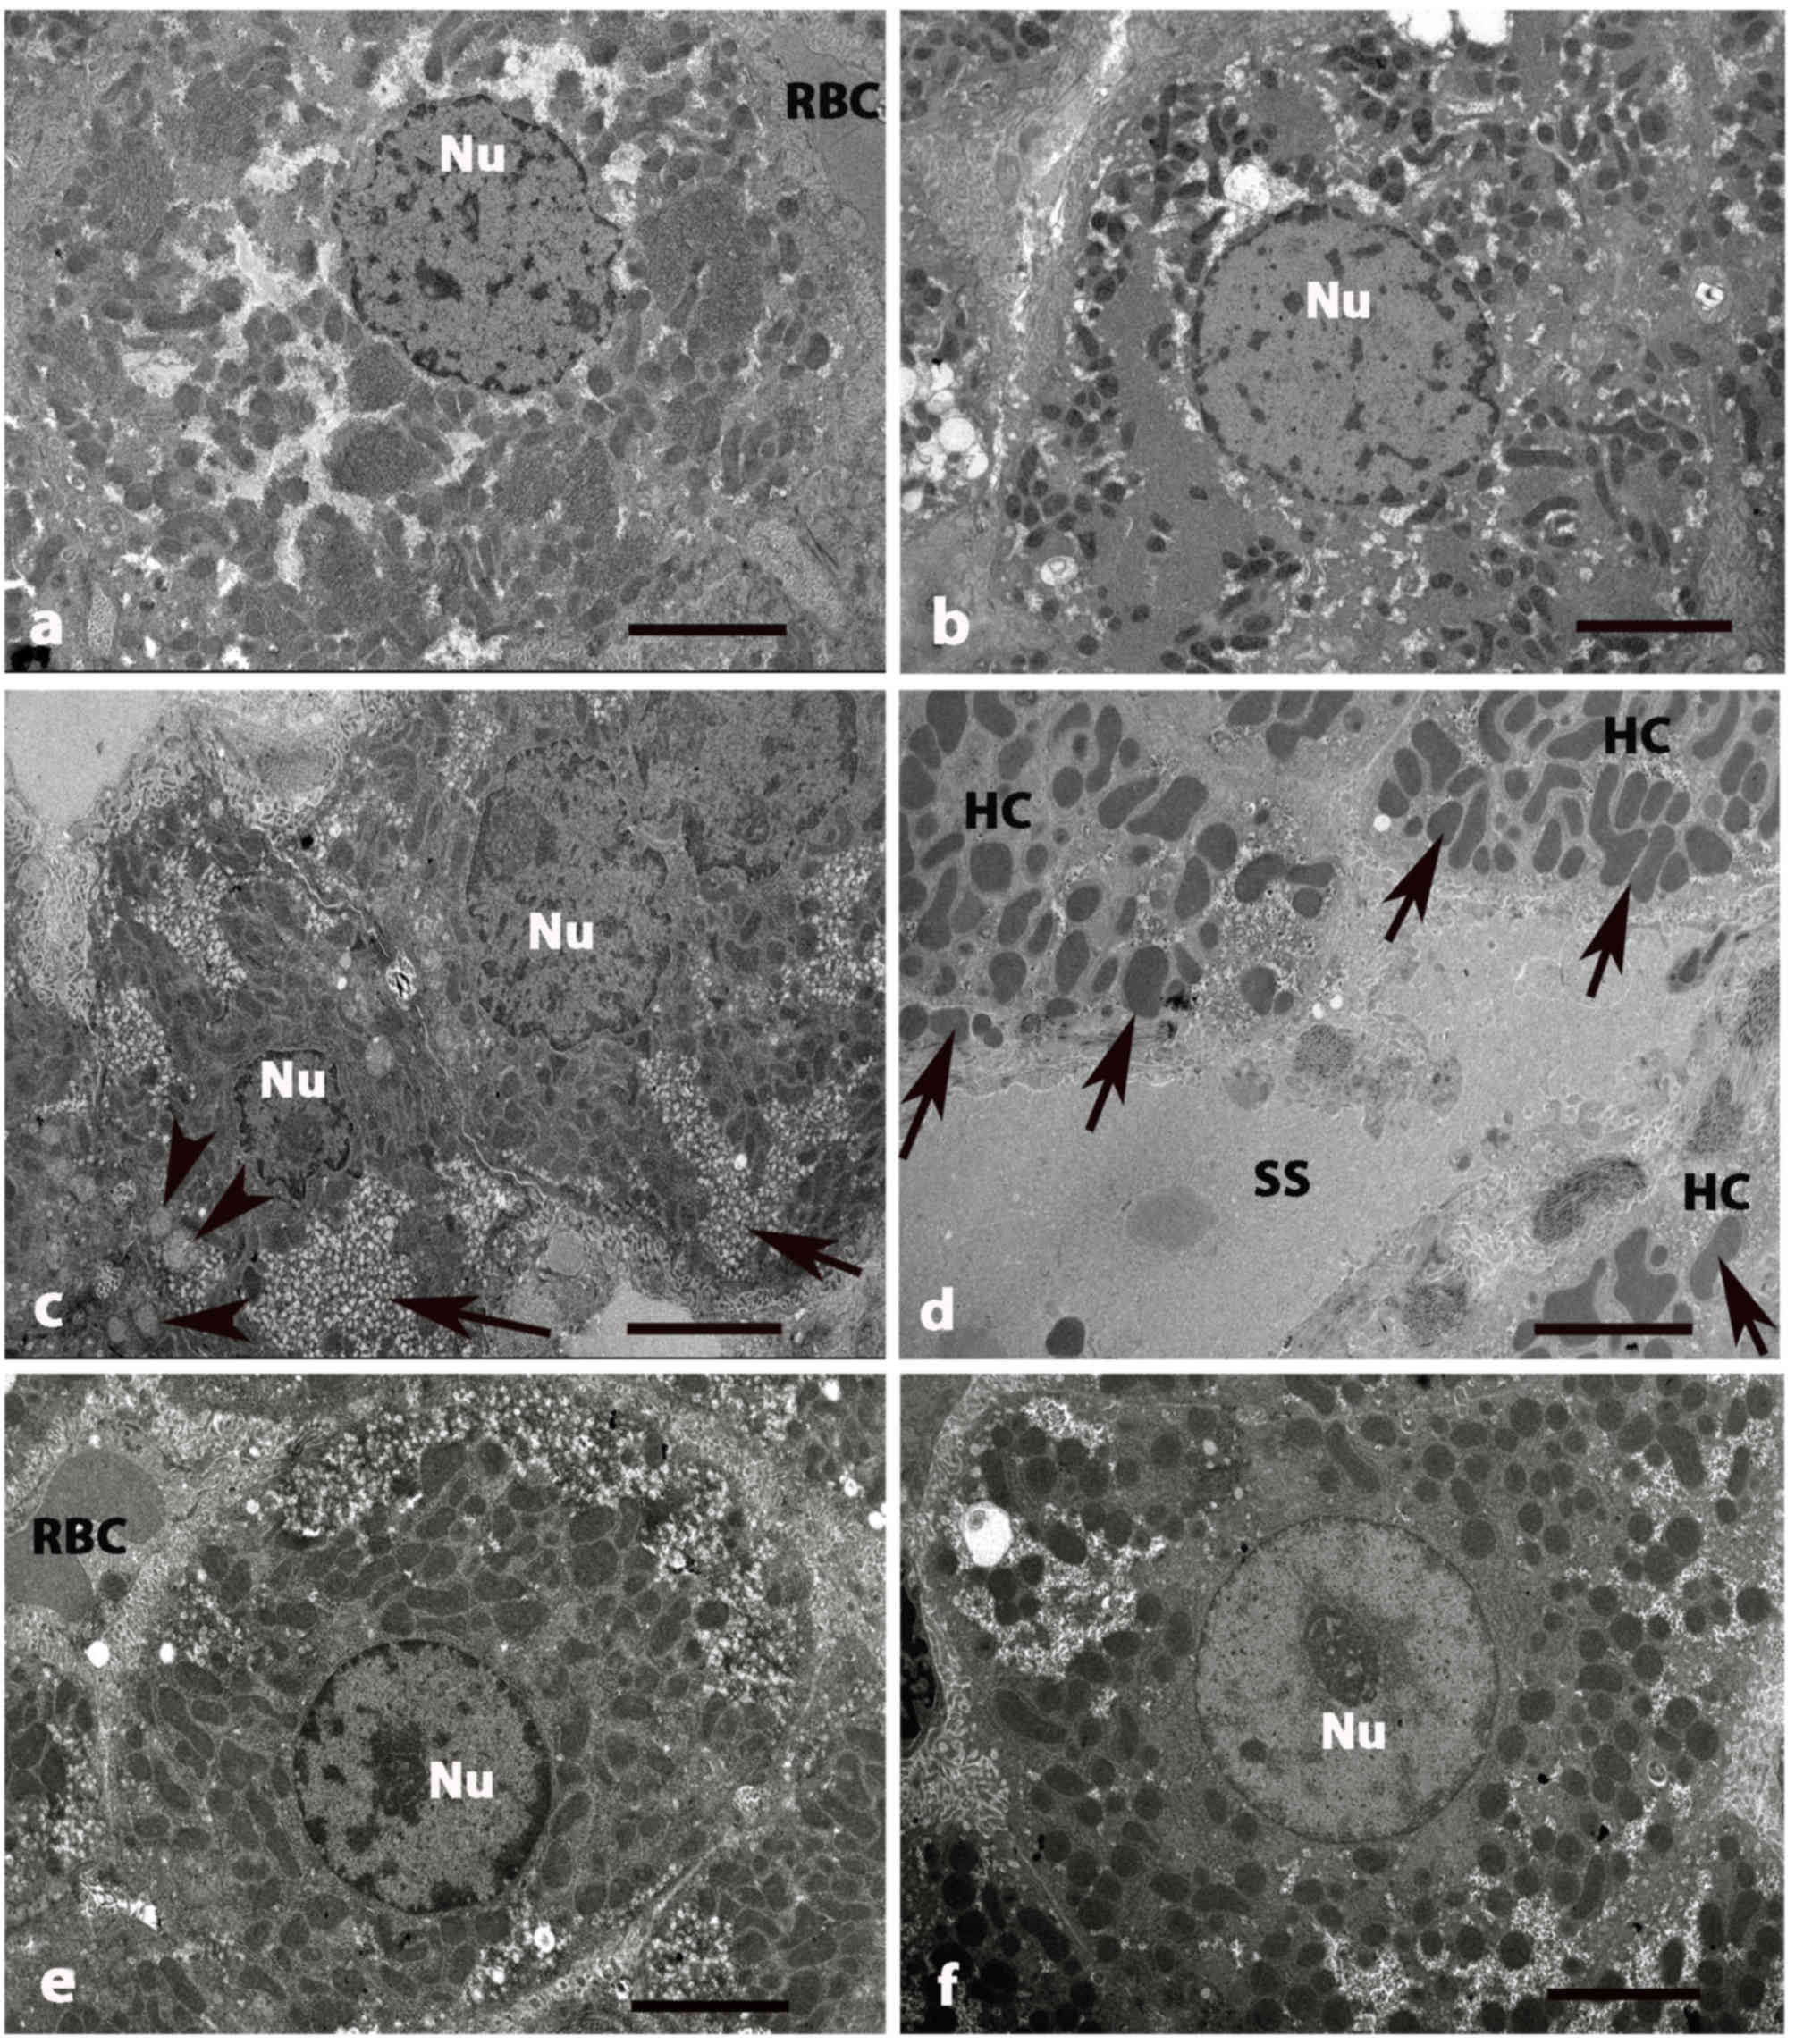 | Figure 3.Electron micrographs of liver tissue
in five groups of rats at 8 weeks. (A) Control and (B) GLB rats
exhibited HCs with central, rounded Nu with numerous mitochondria.
(C) DM rats exhibited small and fragmented HCs. The irregular Nu
exhibited damage and disruption of the nuclear membranes. (D) A
number of mitochondria (arrows) in HCs become swollen. Blood SS
around the boundary of hepatocytes are also dilated. (E) DM+GLB and
(F) DM+GL rats exhibiting the healthy hepatocyte with oval Nu. The
cytoplasm contains some lightly stained swollen mitochondria,
darkly stained mitochondria and few vacuoles. Original
magnification, ×2,000. Scale bar, 2 µm. GLB, glabridin; HC,
hepatocyte; Nu, nucleus; DM, diabetes mellitus; SS, sinusoids; GL,
glibenclamide; RBC, red blood cell. |
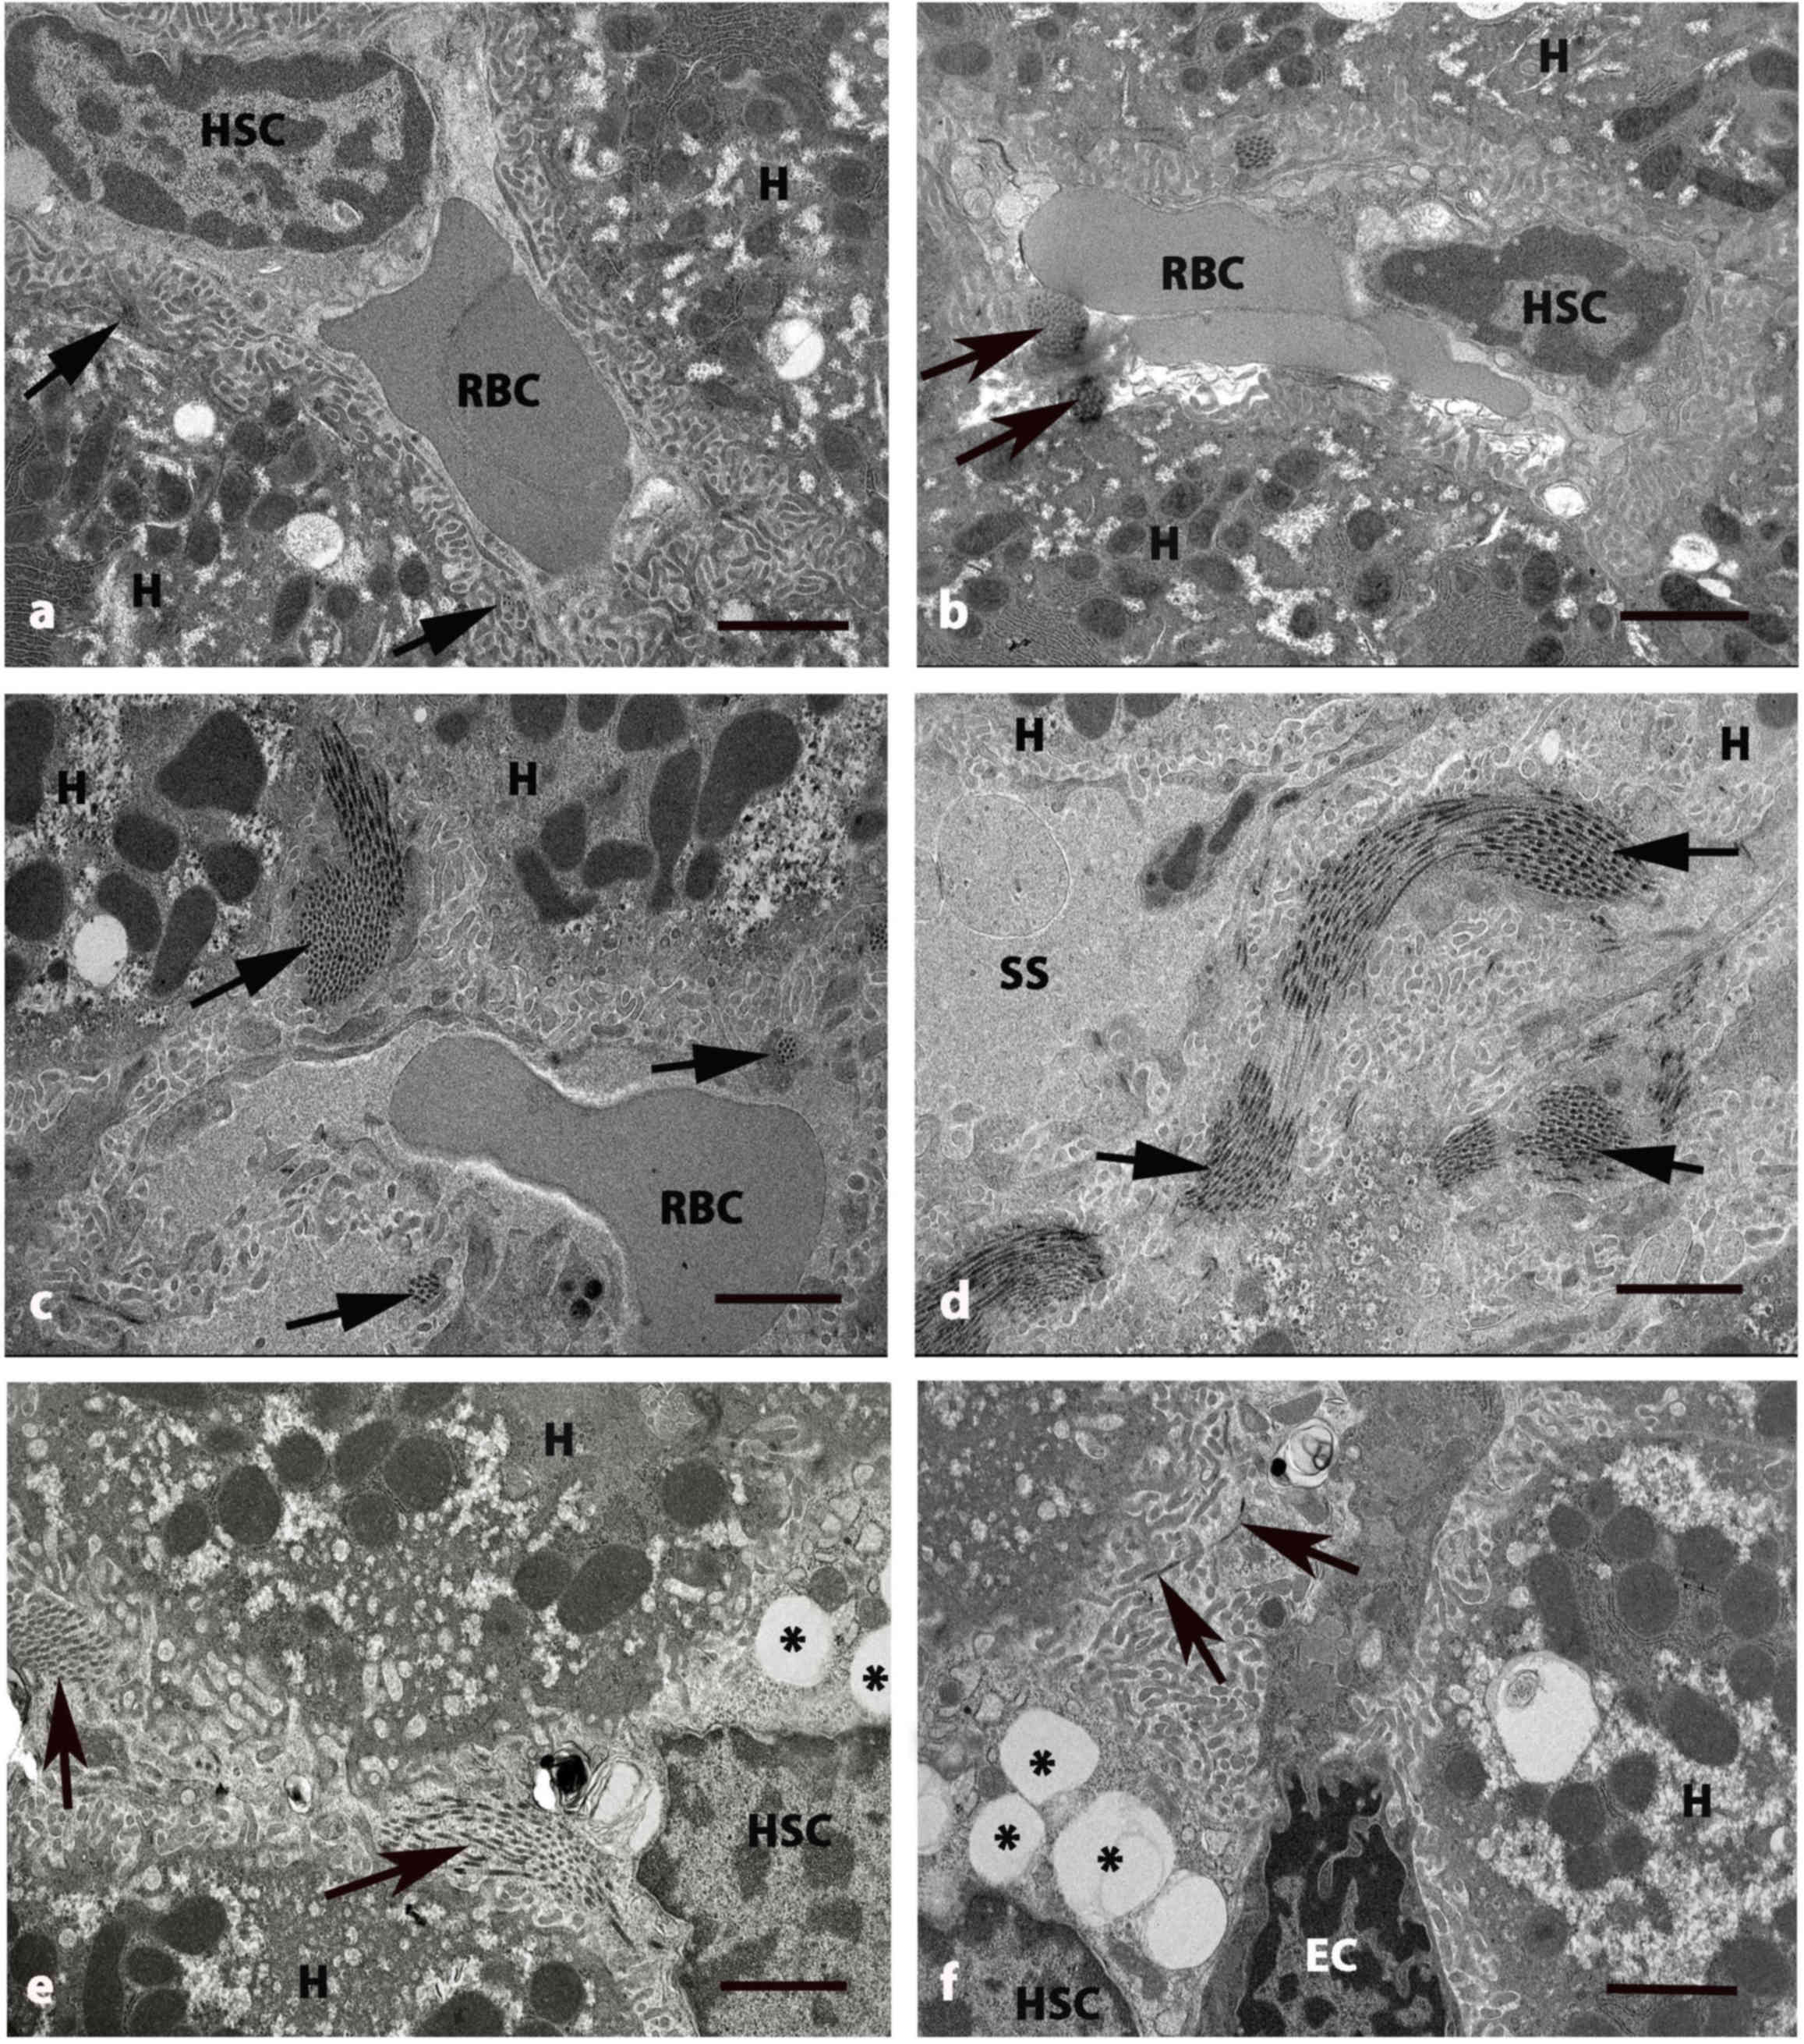 | Figure 4.Electron micrographs of
perisinusoidal space of liver in five groups at 8 weeks. (A)
Control and (B) GLB rats exhibited H and SS that have RBCs and HSC
with normal collagen bundles (arrows) at the perisinusoidal space.
(C and D) DM rats exhibited swollen mitochondria in cytoplasm of H.
The deposition of collagen bundles were increased in the
perisinusoidal space (arrows) and dilated blood SS. (E) DM+GLB and
(F) DM+GL rats exhibited the decrease of collagen bundles in
perisinusoidal space (arrows) around the boundary of H. Original
magnification, ×4000. Scale bar, 2 µm. GLB, glabridin; H,
hepatocyte; SS, sinusoids; RBC, red blood cell; HSC, hepatic
stellate cell; DM, diabetes mellitus; GL, glibenclamide; EC,
endothelial cell. |
TEM examination revealed the pathological
hepatocytes and liver tissues in DM rats. Hepatocytes were small
and shrunken as fragmented cells. The irregular nucleus of
hepatocytes exhibited damage with finger-like projections of the
nuclear membrane. The degeneration and disorganization of
cytoplasmic organelles was also presented (Fig. 3C). Many mitochondria of hepatocytes
became swollen while huge lipid vacuoles were deposited in the
cytoplasm of hepatocytes. Nuclear membranes were disrupted and
nuclear chromatins were exposed. Endoplasmic reticulum cisternae
and Golgi apparatus were dilated and destructed with irregular
lamellar organization and large dilatations (Fig. 3D).
Blood sinusoids around the boundary of hepatocytes
were also dilated (Fig. 3D).
Collagen fiber deposition was increased in the area adjacent to the
perisinusoidal space in DM rats (Fig. 4C
and D). The variable size of collagen bundles was observed in
the perisinusoidal space. After supplementation of glabridin for 8
weeks, the hepatocytes and HSCs had a similar appearance as that of
the control group. Healthy hepatocytes with round nuclei indicated
the regenerated hepatocytes of DM+GLB rats and DM+GL (Fig. 3E and F, respectively). The cytoplasm
contained light and dark stained swollen mitochondria and few
vacuoles. TEM examination revealed the collagen production in the
intracytoplasmic compartment of HSCs and these collagen fibers were
radiated from cytoplasm toward the liver parenchyma. Collagen fiber
deposition was decreased in the area adjacent to the perisinusoidal
space in DM+GLB and DM+GL rats.
Western blot analysis of collagen type
I and fibronectin
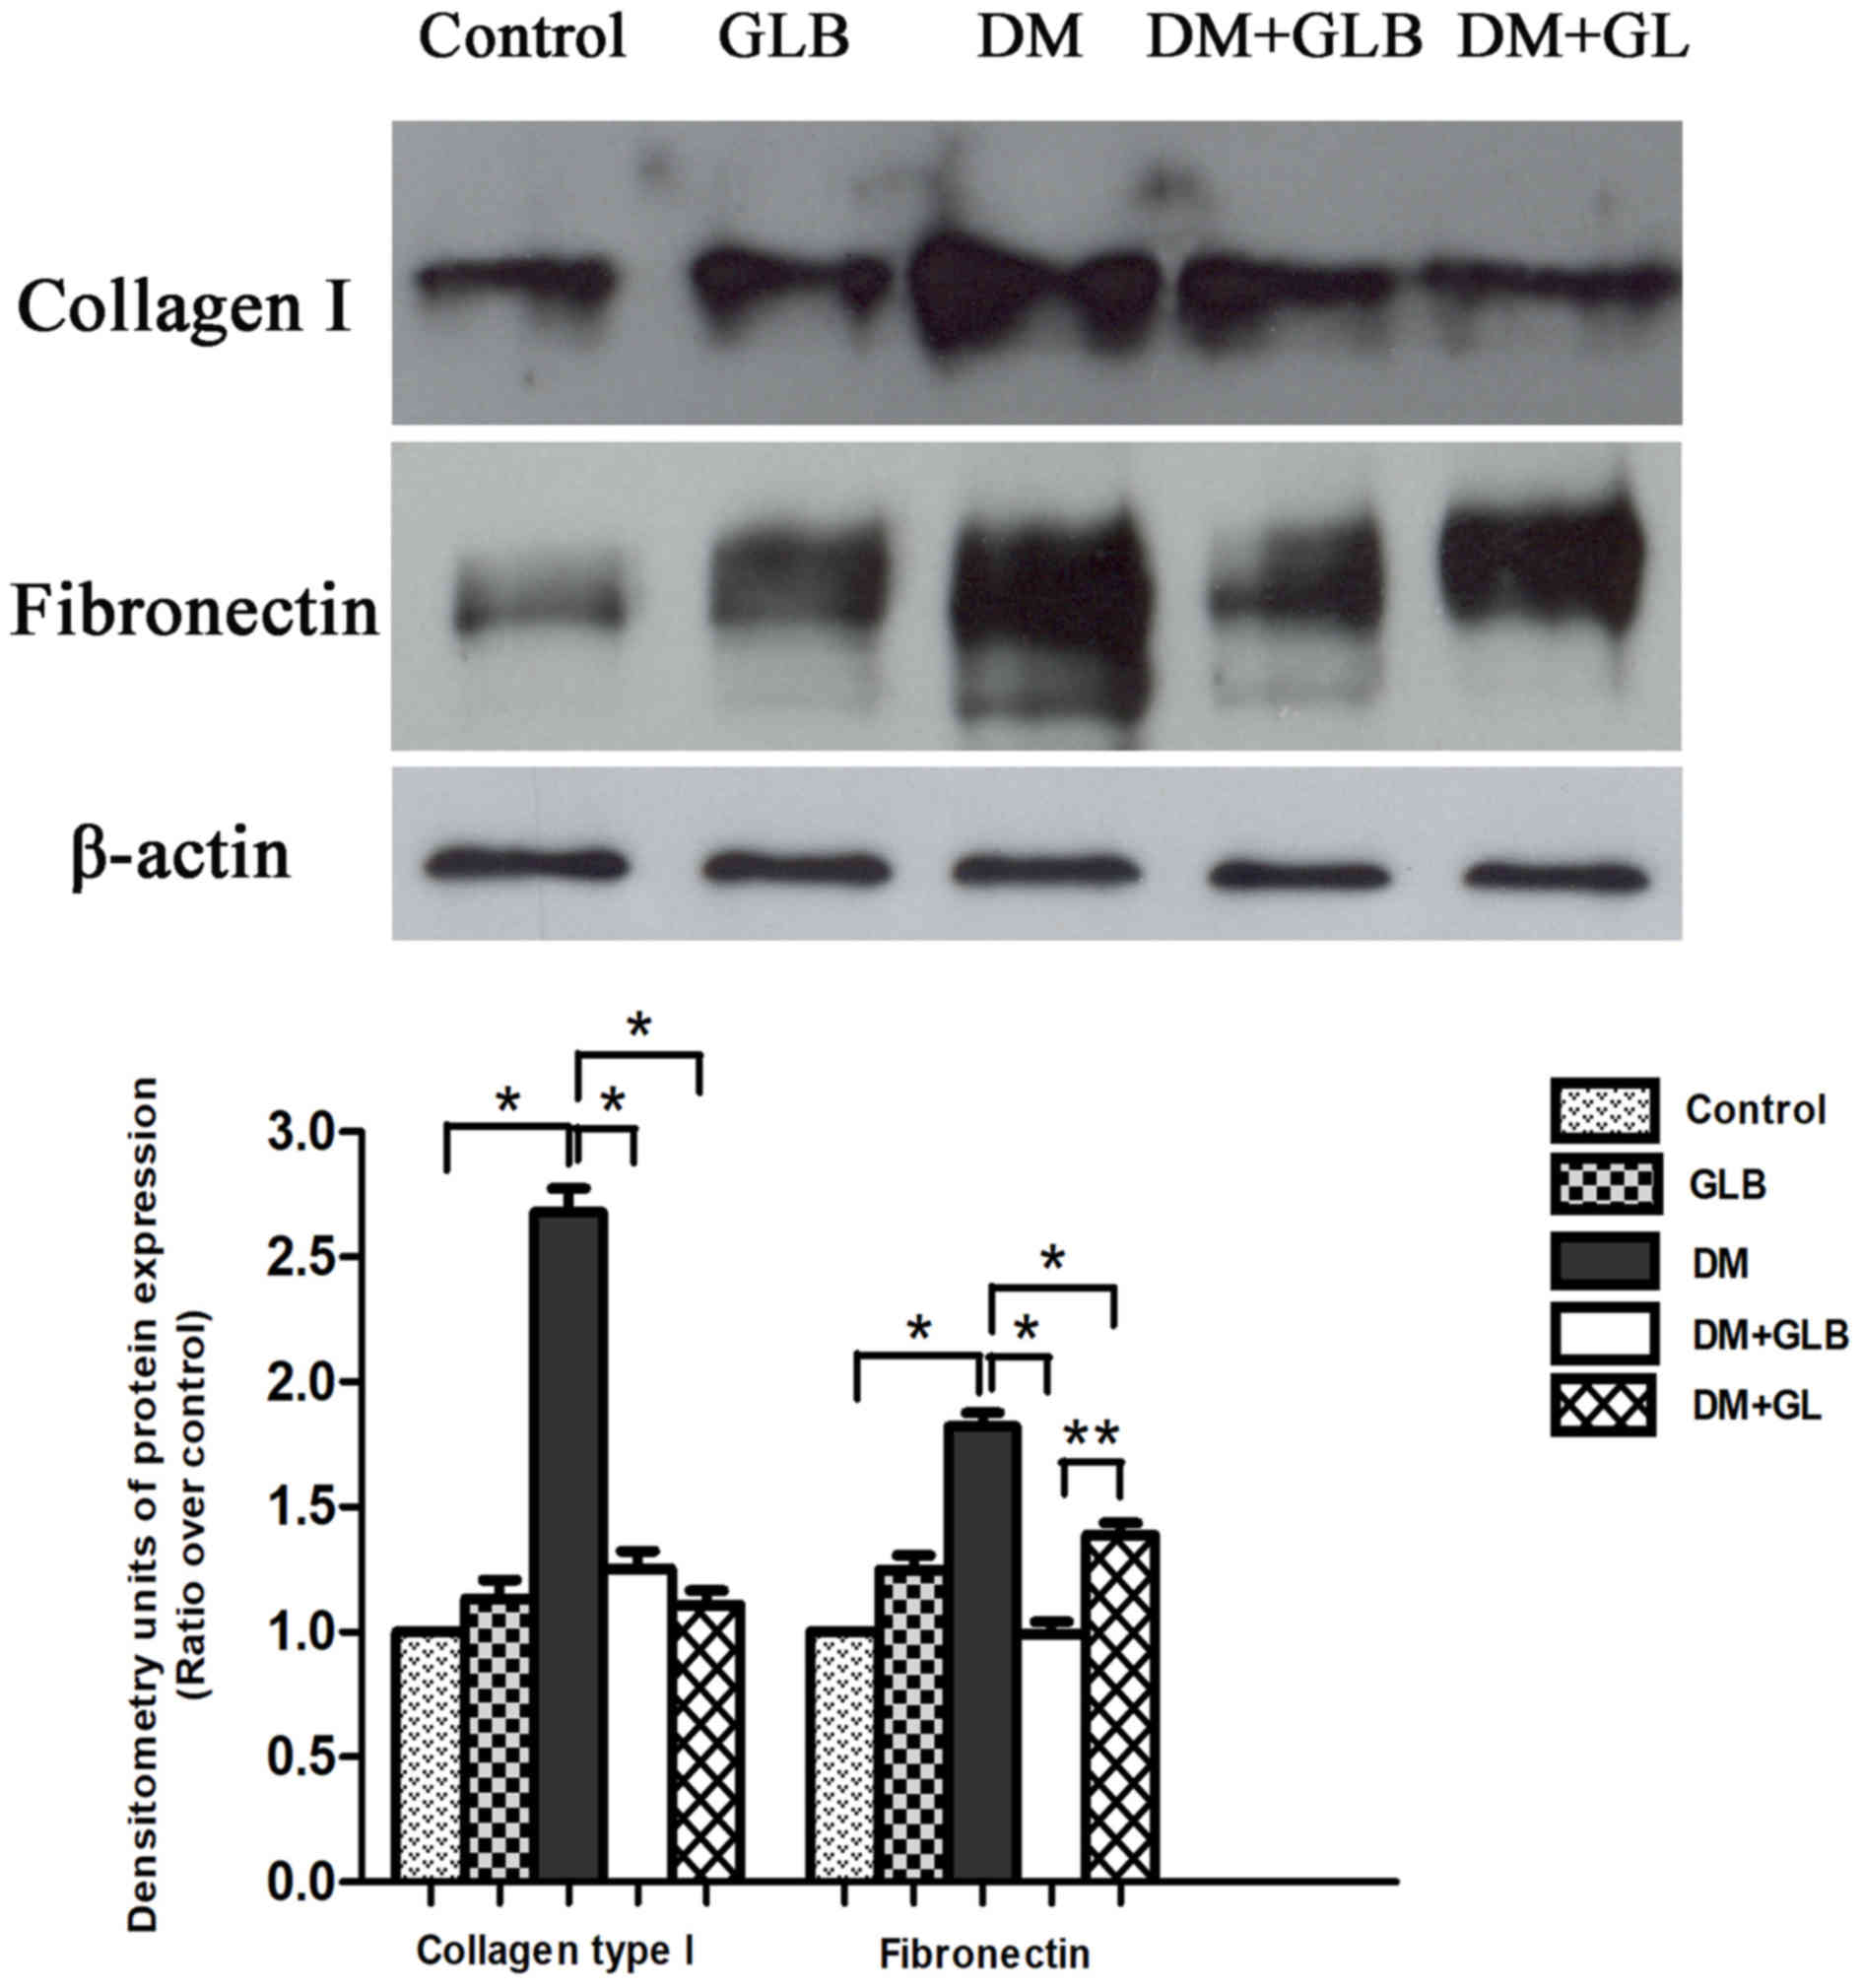
The collagen type I and fibronectin protein bands
were observed and visualized using monoclonal anti-collagen type I
and anti-fibronectin antibodies. Western blot analysis established
the specific collagen type I protein band at molecular weight 130
kDa and a fibronectin protein band of molecular weight 220 kDa on
films via ECL in control, GLB, DM, DM+GLB and DM+GL samples from
rat livers (Fig. 5). These specific
proteins represented the expression of type I collagen and
fibronectin. The bands from DM revealed more intense protein
expressions than that those of the control, GLB, DM, DM+GLB, and
DM+GL rats on ECL films. In addition, the positive control
expression and characterization of β-actin protein were revealed at
molecular weight 43 kDa. The β-actin protein was further used for
protein analysis. The collagen type I and fibronectin expressions
decreased following treatment with glabridin and glyburide when
compared with DM animals. The amount of collagen type I and
fibronectin proteins in DM rats were significantly increased
compared with control (P<0.001). In DM+GLB rats, the quantity of
collagen type I and fibronectin significantly increased when
compared with control (P<0.001). However, the amount of collagen
type I and fibronectin in DM+GLB were significantly decreased
compared with DM rats (P<0.001; Fig.
5).
Discussion
The diabetic model was developed by the
administration of STZ to male rats. It was revealed that
STZ-injected rats produced significantly increased levels of blood
glucose. The increase of blood glucose levels stimulated the
sorbital pathway and protein kinase C (PKC), which may lead to the
production of growth factor and cytokines. Direct high glucose
concentration which induces mitogen-activated protein kinase (MAPK)
and PCK activation. Supplementation of glabridin revealed that the
blood sugar levels were decreased. The effectiveness of glabridin
from licorice extract and against the diabetogenic effects of
streptozocin has also been established in rats (26).
For screening liver disease, liver function test are
commonly used in clinical practice. In the present study, liver
function tests were performed to observe the effects of STZ-induced
diabetes on the liver at 8 weeks following STZ treatment. The
levels of SGOT, SGPT and ALP were increased in the livers of DM
rats when compared with control rats. Following glabridin
supplementation, they were decreased when compared with DM rats.
SAKP is a membrane bound enzyme glycoprotein enzyme (27). Expression of this enzyme is increased
when the bile ducts become blocked. SGOT and SGPT are both enzymes
that are mainly found in mitochondria of the liver (28). If liver damage is present, the
enzymes are released into the bloodstream following liver cell
death (29). Abnormally high
concentrations of SGOT and SGPT in the blood may indicate damage to
the liver (30). SGOT is normally
present in liver, heart, skeletal muscle, kidneys, brain and red
blood cells (31). SGOT is elevated
with liver damage or heart attack. Elevated SGOT levels are not
specific for liver damage, and SGOT has also been used as a cardiac
marker (32). By contrast, SGPT is
normally found largely in the liver. Therefore SGPT is a much more
specific indicator of liver dysfunction (33).
The results from the histological observation of
liver sections of DM rats indicated that sinusoids around the
central veins and central veins were dilated. Edema appeared in the
hepatocytes. The hepatocyte nuclei were evident of pyknosis. In
addition, some hepatocytes were containing small dense nuclei and
disruption of nuclear membranes. Another finding was that lipids
accumulated in the hepatocytes and formed non-membrane bound
vacuoles with peripheral nuclei. According to the results, the
presented pyknosis of hepatocyte nuclei and edematous hepatocytes
were displayed by continuous hepatocytes injury and death. It was
evident that there were lipid droplets accumulating in the
cytoplasm of hepatocytes (34). The
accumulation of cytoplasmatic lipid droplets in hepatocytes is a
situation that evokes the transformation into fatty liver. It is
possible that this situation arises from an increased incorporation
of fatty acids into the liver, which could have been a consequence
of the hypoinsulinemia and the decreased capacity to excrete of
lipoprotein secretion resulting from an insufficient production of
apolipoprotein B (35).
Characteristics of a fatty liver include the intracellular
accumulation of triglycerides resulting from an increased
liponeogenesis and an increased triglyceride uptake (36). Concomitantly, the hepatic secretion
of very low-density lipoproteins decreases (37). The mechanism of liver damage includes
cellular necrosis and inflammation, both of which are consequences
of the increased mitochondrial oxidative stress from the
triglyceride metabolism and the generation of free radicals in the
peroxisomes (37). Another factor
that increases mitochondrial oxidative stress is the increased
production of adipokines (cytokines produced by the adipocytes)
including tumor necrosis factor-α (TNF-α) and leptin (38). These chemical mediators, which are
produced during inflammation and cell necrosis, activate HSCs that
respond by expressing collagen, connective tissue growth factor and
aggregation of extracellular matrix components, thus leading to
fibrosis (39,40). Furthermore, the hepatic glycogen
content of the STZ-treated animals decreased substantially. It is
plausible that the displacement of glycogen in the hepatocyte
cytoplasm is the result of lipid droplet accumulation (41). In addition, there are also anatomical
changes of the sinusoidal capillarization. Sinusoidal endothelial
cells are reported to lose fenestrae, basement membrane accumulates
and sinusoidal outlets become sparse (42). These pathological alterations disturb
the normal function of the sinusoid (42). Besides, capillarization of the
sinusoid may disturb the exchange of several bioactive substances
between the hepatocytes across, perisinusoidal space, and
sinusoidal blood (43). All of these
processes are to contribute to the hepatic fibrosis.
Furthermore, DM rats revealed that collagen fiber
deposition was increased in the PT, PS and PC areas. Adipokines are
known to activate HSCs and induce them to increase production of
connective tissue growth factor, collagen, and to accumulate
extracellular matrix components, in this way, favoring fibrosis
(44). HSCs, also called Ito cells
or perisinusoidal cells, are pericytes found in the space of Disse,
the hepatic space surrounding the sinusoids (45). Alteration in the microenvironment
within the perisinusoidal space caused by activated HSCs
facilitates the development of liver fibrosis (45). The number of activated HSCs increases
in areas of inflammation (46),
emphasizing the importance of resident HSCs migration into the PS
during the progression of liver fibrosis. Accordingly, the number
of activated HSCs is substantially reduced during the regression of
liver fibrosis. This occurs by the induction of apoptosis or
cellular senescence, which returns cells to a quiescent state
(47). The HSCs thus constitute the
main cell type participating in liver fibrosis. HSCs become
activated following hepatic damage. This process is characterized
by proliferation, changes in contractility, and chemotaxis. The
activated HSCs secretes collagen to the scar tissue, with cirrhosis
as a potential outcome (39). HSCs
are also stimulated by other cells, including hepatocyte,
T-lymphocyte, and Kupffer cells. The systems of stimulation are
groups of cytokine and inflammatory secretions that include TNF-α,
TGF-β, insulin-like growth factor, interleukin-6, and interferon-γ
(13,14,48).
TGF-β constitutes an important mediator of liver fibrosis (49–51).
TGF-β causes an increase of ECM protein production that results in
myofibroblast differentiation of HSCs (52). Thus, TGF-β serves an important role
in proliferation, differentiation, and morphogenesis. In hepatic
fibrosis there is an increase of TGF-β expression, which can be
understood as a homeostatic response to repair damage tissue
(53). Fibronectin a non-collagenous
glycoprotein serving several functions, is synthesized and secreted
by hepatocytes, endothelial cells, macrophages and fibroblasts
(53). Fibronectin expression is
associated with normal processes such as differentiation, and to
pathological processes such as cellular damage, hepatic fibrosis
and repair (54). The most abundant
collagen types found in a healthy liver are the fibril-forming
types, i.e. collagen types I and III (55). During fibrogenesis, as the collagen
becomes integrated into the ECM, there is an eight-fold increase in
types I and III (55). In addition,
the ratio of collagen type I/III is changed from 1:1 in healthy
liver to 1:2 in the cirrhotic liver (55).
Recent studies have demonstrated that the cause of
the development of DM and its complications are lipid peroxidation
that leads to the formation of ROS (56). An increase in ROS generation together
with a decrease in the activity of antioxidant system causes an
imbalance that leads to oxidative stress (57). The high level of blood sugar that
occurs in diabetes results in oxidative stress and weakens the
capacity of endogenous antioxidant substances due to the synthesis
of several reducing sugars via both the glycolytic and polyol
pathways (57).
In the present study, the demonstration of the
therapeutic effect of glabridin and the drug, glibenclamide, were
similar. Glibenclamide is used most commonly as a standard drug in
STZ-induced diabetes (58) and used
as positive control compared with glabridin from licorice. It is an
effective drug to facilitate insulin release from β cells (59). The mechanism of action of
glibenclamide in hyperglycemic conditions is to lower blood glucose
via stimulating insulin production from the existing β cells of
pancreas in STZ diabetic rats (59).
In addition to this direct action, it also exhibits pancreatic
effects. This drug binds to the sulfonylurea receptor 1 in the
pancreatic β cells (60). This
inhibition causes cell membrane depolarization and opens the
voltage dependent calcium channels (61). It is one of the leading treatments
for diabetes that can increase intracellular calcium concentration
in β cells and subsequently stimulates the release of insulin
(62). Glabridin can be used as a
complementary and alternative therapy due to its reduced cost
compared with other pharmaceutical agents and easier access to
diabetes treatment (25). The
hypolipidemia effect and the marked decrease in artherogenic
indexes by glabridin in STZ-treated rats reduced the incidence of
artherosclerosis in diabetic patients (63). Additionally, the beneficial
therapeutic effect has been reviewed for the active compound from
licorice; glabridin significantly elevates SOD activities which
lowers MDA content of kidney, pancreas and liver. Hence, it may be
concluded that part of the antioxidative activities of glabridin in
STZ-induced diabetic mice may result from its hypoglycemic effects
(25). Therefore, glabridin may
prevent the progression of diabetic liver fibrosis, which probably
acts by enhancing anti-oxidative and anti-inflammatory
capacity.
In conclusion, the present findings suggest that
glabridin has the potential to recover the damaged liver tissue of
STZ-induced diabetic rat. The 40-mg/kg dose of glabridin from
licorice results in a suitable outcome to ameliorate the
pathological changes in diabetes rat hepatocytes and collagen
accumulation in the extracellular matrix of the liver. Furthermore,
the method of light microscopy, TEM and western blot analysis
clearly elucidated the decrease of collagen deposition in the liver
and was beneficial in establishing glabridin as a therapeutic
target for diabetes treatment. The results of the present study
suggest that further study is required to assess the mechanism and
pharmacological actions of glabridin, and to assess if it may be
beneficial as a therapeutic agent in the treatment of diabetes.
Acknowledgements
The authors are thankful to Mrs. Anna Chatthong for
improving the English of this manuscript.
Funding
The present study was supported by a grant from
Prince of Songkla University Research Fund (grant no.
SCI581209S).
Availability of data and materials
The datasets used and/or analyzed during the present
study are available from the corresponding author on reasonable
request.
Authors' contributions
WK designed and conducted the research. JN prepared
the tissue. MK and UV performed staining and western blot analysis.
WK and VA wrote the manuscript and performed statistical analysis.
All authors read and approved the final version of the
manuscript.
Ethics approval and consent to
participate
The experimental protocol used was approved by the
Animal Ethics Committee of the Prince of Songkla University
(Hatyai, Thailand).
Patient consent for publication
Not applicable.
Competing interests
The authors declare that they have no competing
interests.
References
|
1
|
Ban CR and Twigg SM: Fibrosis in diabetes
complications: Pathogenic mechanisms and circulating and urinary
markers. Vasc Health Risk Manag. 4:575–596. 2008. View Article : Google Scholar : PubMed/NCBI
|
|
2
|
Law B, Fowlkes V, Goldsmith JG, Carver W
and Goldsmith EC: Diabetes-induced alterations in the extracellular
matrix and their impact on myocardial function. Microsc Microanal.
18:22–34. 2012. View Article : Google Scholar : PubMed/NCBI
|
|
3
|
Ikeda S, Makino H, Haramoto T, Chikata K,
Kumagai I and Ota Z: Changes in glomerular extracellular matrices
components in diabetic nephropathy. J Diabet Complications.
5:186–188. 1991. View Article : Google Scholar : PubMed/NCBI
|
|
4
|
Arthur MJ: Fibrogenesis II.
Metalloproteinases and their inhibitors in liver fibrosis. Am J
Physiol Gastrointest Liver Physiol. 279:G245–G249. 2000. View Article : Google Scholar : PubMed/NCBI
|
|
5
|
Das J, Roy A and Sil PC: Mechanism of the
protective action of taurine in toxin and drug induced organ
pathophysiology and diabetic complications: A review. Food Funct.
3:1251–1264. 2012. View Article : Google Scholar : PubMed/NCBI
|
|
6
|
Friedman SL: Molecular regulation of
hepatic fibrosis, an integrated cellular response to tissue injury.
J Biol Chem. 275:2247–2250. 2000. View Article : Google Scholar : PubMed/NCBI
|
|
7
|
Rockey DC: The cell and molecular biology
of hepatic fibrogenesis: Clinical and therapeutic implications.
Clin Liver Dis. 4:319–355. 2000. View Article : Google Scholar : PubMed/NCBI
|
|
8
|
Wu LL, Cox A, Roe CJ, Dziadek M, Cooper ME
and Gilbert RE: Transforming growth factor beta1 and renal injury
following subtotal nephrectomy in the rat: Role of the
renin-angiotensin system. Kidney Int. 51:1553–1567. 1994.
View Article : Google Scholar
|
|
9
|
Benyon RC and Iredale JP: Is liver
fibrosis reversible? Gut. 46:443–446. 2000. View Article : Google Scholar : PubMed/NCBI
|
|
10
|
Friedman SL: Hepatic stellate cells:
Protean, multifunctional, and enigmatic cells of the liver. Physiol
Rev. 88:125–172. 2008. View Article : Google Scholar : PubMed/NCBI
|
|
11
|
Safadi R and Friedman SL: Hepatic fibrosis
- role of hepatic stellate cell activation. MedGenMed.
4:272002.PubMed/NCBI
|
|
12
|
Walton KL, Johnson KE and Harrison CA:
Targeting TGF-β mediated SMAD signaling for the prevention of
fibrosis. Front Pharmacol. 8:4612017. View Article : Google Scholar : PubMed/NCBI
|
|
13
|
Liu T, Wang X, Karsdal MA, Leeming DJ and
Genovese F: Molecular serum markers of liver fibrosis. Biomark
Insights. 7:105–117. 2012. View Article : Google Scholar : PubMed/NCBI
|
|
14
|
Fallatah HI: Noninvasive biomarkers of
liver fibrosis: An overview. Adv Hepatol. 2014:1152014.
|
|
15
|
Manabe R, Oh-e N and Sekiguchi K:
Alternatively spliced EDA segment regulates fibronectin-dependent
cell cycle progression and mitogenic signal transduction. J Biol
Chem. 274:5919–5924. 1999. View Article : Google Scholar : PubMed/NCBI
|
|
16
|
Mabuchi A, Mullaney I, Sheard P, Hessian
P, Zimmermann A, Senoo H and Wheatley AM: Role of hepatic stellate
cells in the early phase of liver regeneration in rat: Formation of
tight adhesion to parenchymal cells. Comp Hepatol 1 (3 Suppl).
S292004. View Article : Google Scholar
|
|
17
|
Ala-Kokko L, Pihlajaniemi T, Myers JC,
Kivirikko KI and Savolainen ER: Gene expression of type I, III, IV
collagens in hepatic fibrosis induced by dimethylnitrosamine in the
rat. Biochem J. 244:75–79. 1987. View Article : Google Scholar : PubMed/NCBI
|
|
18
|
Yokozawa T, Cho EJ, Rhyu DY, Shibahara N
and Aoyagi K: Glycyrrhizae radix attenuates
peroxynitrite-induced renal oxidative damage through inhibition of
protein nitration. Free Radic Res. 39:203–211. 2005. View Article : Google Scholar : PubMed/NCBI
|
|
19
|
Mori H, Niwa K, Zheng Q, Yamada Y, Sakata
K and Yoshimi N: Cell proliferation in cancer prevention; effects
of preventive agents on estrogen-related endometrial carcinogenesis
model and on an in vitro model in human colorectal cells. Mutat
Res. 480–481, 201-207. 2001.
|
|
20
|
Shang H, Cao S, Wang J, Zheng H and
Putheti R: Glabridin from Chinese herb licorice inhibits fatigue in
mice. Afr J Tradit Complement Altern Med. 7:17–23. 2009.PubMed/NCBI
|
|
21
|
Yokota T, Nishio H, Kubota Y and Mizoguchi
M: The inhibitory effect of glabridin from licorice extracts on
melanogenesis and inflammation. Pigment Cell Res. 11:355–361. 1998.
View Article : Google Scholar : PubMed/NCBI
|
|
22
|
Choi EM: The licorice root derived
isoflavan glabridin increases the function of osteoblastic MC3T3-E1
cells. Biochem Pharmacol. 70:363–368. 2005. View Article : Google Scholar : PubMed/NCBI
|
|
23
|
Gnanamoorthy M, Sridharan K, Dhayananth N
and Ramesh Babu NG: Antimicrobial and anticancer potential of
glycyrrhiza glabra. IJERM. 4:2349–2058. 2017.
|
|
24
|
Jung JC, Lee YH, Kim SH, Kim KJ, Kim KM,
Oh S and Jung YS: Hepatoprotective effect of licorice, the root of
Glycyrrhiza uralensis Fischer, in alcohol induced fatty liver
disease. BMC Complement Altern Med. 16:192016. View Article : Google Scholar : PubMed/NCBI
|
|
25
|
Wu F, Jin Z and Jin J: Hypoglycemic
effects of glabridin, a polyphenolic flavonoid from licorice, in an
animal model of diabetes mellitus. Mol Med Rep. 7:1278–1282. 2013.
View Article : Google Scholar : PubMed/NCBI
|
|
26
|
Hui AY, Liew CT, Go MY, Chim AM, Chan HL,
Leung NV and Sung JJ: Quantitative assessment of fibrosis in liver
biopsies from patients with chronic hepatitis B. Liver Int.
24:611–618. 2004. View Article : Google Scholar : PubMed/NCBI
|
|
27
|
Stinson RA and Hamilton BA: Human liver
plasma membranes contain an enzyme activity that removes membrane
anchor from alkaline phosphatase and converts it to a plasma-like
form. Clin Biochem. 27:49–55. 1994. View Article : Google Scholar : PubMed/NCBI
|
|
28
|
Wilson PD, Franks LM, Cottell DC and
Benham F: Alkaline phosphatase in mitochondria. Cell Biol Int Rep.
1:85–92. 1977. View Article : Google Scholar : PubMed/NCBI
|
|
29
|
Jeschke MG: The hepatic response to
thermal injury: Is the liver important for postburn outcomes? Mol
Med. 15:337–351. 2009. View Article : Google Scholar : PubMed/NCBI
|
|
30
|
Tian Z, Liu H, Su X, Fang Z, Dong Z, Yu C
and Luo K: Role of elevated liver transaminase levels in the
diagnosis of liver injury after blunt abdominal trauma. Exp Ther
Med. 4:255–260. 2012. View Article : Google Scholar : PubMed/NCBI
|
|
31
|
Giannini EG, Testa R and Savarino V: Liver
enzyme alteration: A guide for clinicians. CMAJ. 172:367–379. 2005.
View Article : Google Scholar : PubMed/NCBI
|
|
32
|
Shen J, Zhang J, Wen J, Ming Q, Zhang J
and Xu Y: Correlation of serum alanine aminotransferase and
aspartate aminotransferase with coronary heart disease. Int J Clin
Exp Med. 8:4399–4404. 2015.PubMed/NCBI
|
|
33
|
Schneeberger EE, Arriola MS, Fainboim H,
Schroder T, González J, Baiges D, Luque M, Maldonado Coco JA and
Citera G: Idiophatic inflammatory myophaties: Its association with
liver disorders. Rev Fac Cien Med Univ Nac Cordoba. 69:139–143.
2012.(In Spanish). PubMed/NCBI
|
|
34
|
Hosseinzadeh H and Nassiri-Asl M:
Pharmacological effects of glycyrrhiza spp. And its bioactive
constituents: Update and review. Phytother Res. 29:1868–1886. 2015.
View Article : Google Scholar : PubMed/NCBI
|
|
35
|
Bilal HM, Riaz F, Munir K, Saqib K and
Sawa MR: Histological changes in the liver of diabetic rats: A
review of pathogenesis of nonalcoholic fatty liver disease in type
1 diabetes mellitus. Cogent Medicine. 3:12754152016. View Article : Google Scholar
|
|
36
|
Kawano Y and Cohen DE: Mechanisms of
hepatic triglyceride accumulation in non-alcoholic fatty liver
disease. J Gastroenterol. 48:434–441. 2013. View Article : Google Scholar : PubMed/NCBI
|
|
37
|
Nakashima O, Kurogi M, Yamaguchi R,
Miyaaki H, Fujimoto M, Yano H, Kumabe T, Hayabuchi N, Hisatomi J,
Sata M and Kojiro M: Unique hypervascular nodules in alcoholic
liver cirrhosis: Identical to focal nodular hyperplasia-like
nodules. J Hepatol. 41:992–998. 2004. View Article : Google Scholar : PubMed/NCBI
|
|
38
|
Pessayre D, Fromenty B and Mansouri A:
Mitochondrial injury in steatohepatitis. Eur J Gastroenterol
Hepatol. 16:1095–1105. 2004. View Article : Google Scholar : PubMed/NCBI
|
|
39
|
Crespo J, Cayon A, Fernandez-Gil P,
Hernandez-Guerra M, Mayorga M, Dominguez-Diez A,
Fernandez-Escalante JC and Pons-Romero F: Gene expression of tumor
necrosis factor alpha and TNF-receptors, p55 and p75, in
nonalcoholic steatohepatitis patients. Hepatology. 34:1158–1163.
2001. View Article : Google Scholar : PubMed/NCBI
|
|
40
|
Sanyal AJ; American Gastroenterological
Association, : AGA technical review on nonalcoholic fatty liver
disease. Gastroenterology. 123:1705–1725. 2002. View Article : Google Scholar : PubMed/NCBI
|
|
41
|
Bertolani C and Marra F: The role of
adipokines in liver fibrosis. Pathophysiology. 15:91–101. 2008.
View Article : Google Scholar : PubMed/NCBI
|
|
42
|
Poisson J, Lemoinne S, Boulanger C, Durand
F, Moreau R, Valla D and Rautou PE: Liver sinusoidal endothelial
cells: Physiology and role in liver diseases. J Hepatol.
66:212–227. 2017. View Article : Google Scholar : PubMed/NCBI
|
|
43
|
Ohno T, Horio F, Tanaka S, Terada M,
Namikawa T and Kitch J: Fatty liver and hyperlipidemia in IDDM
(insulin dependent diabetes mellitus) of streptozotocin treated
shrew. Life Sci. 66:125–131. 2000. View Article : Google Scholar : PubMed/NCBI
|
|
44
|
Onori P, Morini S, Franchitto A, Sferra R,
Alvaro D and Gaudio E: Hepatic microvascular features in
experimental cirrhosis: A structural and morphometrical study in
CCI4-treated rats. J Hepatol. 33:555–563. 2000. View Article : Google Scholar : PubMed/NCBI
|
|
45
|
Hynes RO: The extracellular matrix; not
just pretty fibrils. Science. 326:1216–1219. 2010. View Article : Google Scholar
|
|
46
|
Yerian L: Identifying activated hepatic
stellate cells in chronic and posttransplant recurrent hepatitis C.
Liver Transpl. 14:756–758. 2008. View Article : Google Scholar : PubMed/NCBI
|
|
47
|
Friedman SL: The virtuosity of hepatic
stellate cells. Gastroenterology. 117:1244–1246. 1999. View Article : Google Scholar : PubMed/NCBI
|
|
48
|
Inagaki Y and Okazaki I: Emerging insights
into Transforming growth factor beta Smad signal in hepatic
fibrogenesis. Gut. 56:284–292. 2007. View Article : Google Scholar : PubMed/NCBI
|
|
49
|
Meindl-Beinker NM and Dooley S:
Transforming growth factor-beta and hepatocyte transdifferentiation
in liver fibrogenesis. J Gastroenterol Hepatol. 23 (Suppl
1):S122–S127. 2008. View Article : Google Scholar : PubMed/NCBI
|
|
50
|
Arauz J, Zarco N, Segovia J, Shibayama M,
Tsutsumi V and Muriel P: Caffeine prevents experimental liver
fibrosis by blocking the expression of TGF-β. Eur J Gastroenterol
Hepatol. 26:164–273. 2014. View Article : Google Scholar : PubMed/NCBI
|
|
51
|
Gressner AM and Weiskirchen R: Modern
pathogenetic concepts of liver fibrosis suggest stellate cells and
TGF-beta as major players and therapeutic targets. J Cell Mol Med.
10:76–99. 2006. View Article : Google Scholar : PubMed/NCBI
|
|
52
|
Mosesson MW: Fibrinogen and fibrin and
structure and functions. J Thromb Haemost. 3:1894–1904. 2005.
View Article : Google Scholar : PubMed/NCBI
|
|
53
|
Gressner OA, Weiskirchen R and Gressner
AM: Biomarkers of liver fibrosis: Clinical translation of molecular
pathogenesis or based on liver dependent malfunction tests. Clin
Chim Acta. 381:107–113. 2007. View Article : Google Scholar : PubMed/NCBI
|
|
54
|
Kawelke N, Vasel M, Sens C, Au AV, Dooley
S and Nakchbandi IA: Fibronectin protects from excessive liver
fibrosis by modulating the availability of and responsiveness of
stellate cells to active TGF-β. PLoS One. 6:e281812011. View Article : Google Scholar : PubMed/NCBI
|
|
55
|
Liu XY, Liu RX, Hou F, Cui LJ, Li CY, Chi
C, Yi E, Wen Y and Yin CH: Fibronectin expression is critical for
liver fibrogenesis in vivo and in vitro. Mol Med Rep. 14:3669–3675.
2016. View Article : Google Scholar : PubMed/NCBI
|
|
56
|
Masarone M, Rosato V, Dallio M, Gravina
AG, Aglitti A, Loguercio C, Federico A and Persico M: Role of
oxidative stress in pathophysiology of nonalcoholic fatty liver
disease. Oxid Med Cell Longev. 2018:95476132018. View Article : Google Scholar : PubMed/NCBI
|
|
57
|
Meng XM, Chung AC and Lan HY: Role of the
TGF-β/BMP-7/Smad pathways in renal diseases. Clin Sci (Lond).
124:243–254. 2013. View Article : Google Scholar : PubMed/NCBI
|
|
58
|
Gandhi GR and Sasikumar P: Antidiabetic
effect of Merremia emarginata Burm. F. in streptozotocin
induced diabetic rats. Asian Pac J Trop Biomed. 2:281–286. 2012.
View Article : Google Scholar : PubMed/NCBI
|
|
59
|
Patanè G, Piro S, Anello M, Rabuazzo AM,
Vigneri R and Purrello F: Exposure to glibenclamide increases rat
beta cells sensitivity to glucose. Br J Pharmacol. 129:887–892.
2000. View Article : Google Scholar : PubMed/NCBI
|
|
60
|
Oh CS, Kohanim S, Kong FL, Song HC, Huynh
N, Mendez R, Chanda M, Edmund Kim E and Yang DJ: Sulfonylurea
receptor as a target for molecular imaging of pancreas beta cells
with (99m)Tc-DTPA-glipizide. Ann Nucl Med. 26:253–261. 2012.
View Article : Google Scholar : PubMed/NCBI
|
|
61
|
Petit P and Loubatières-Mariani MM:
Potassium channels of the insulin-secreting B cell. Fundam Clin
Pharmacol. 6:123–134. 1992. View Article : Google Scholar : PubMed/NCBI
|
|
62
|
Serrano-Martín X, Payares G and
Mendoza-León A: Glibenclamide, a blocker of K+(ATP) channels, shows
antileishmanial activity in experimental murine cutaneous
leishmaniasis. Antimicrob Agents Chemother. 50:4214–4216. 2006.
View Article : Google Scholar : PubMed/NCBI
|
|
63
|
Abd EI-Ghffar EA: Ameliorative effect of
glabridin, a main component of Glycyrrhiza glaba L. roots in
streptozotocin induced Type I diabetes in male albino rats. Indian
J Tradit Knowle. 15:570–579. 2016.
|