Introduction
Degenerative changes frequently occur in the spine
and may present with or without back pain (1). More specifically, spinal degeneration
is a disorder with an increasing frequency as a result of aging
populations (2). Degenerative
changes in intervertebral discs commonly occur in the third and
second decade of life in females and males, respectively (3). In comparison with the dorsal spine, the
cervical and lumbar spine are more commonly affected by
degeneration (4). Patients suffering
from spinal degenerative disease (SDD) experience back pain,
radicular pain and stiffness, resulting in a reduced ability to
work and a lower quality of life (5). Previous studies have revealed the
prevalence of SDD in adolescents, which is associated with active
participation in sports (6–8). The role of inflammatory cytokines in
spinal diseases has been increasingly documented. Omair et
al (9) have revealed that
inflammation exacerbates the severity of lumbar disc degeneration,
pain and disability. In addition, spinal cord injury induces
inflammation via the activation of innate immune responses, causing
axonal degeneration, demyelination and neuronal death (10). Furthermore, it has been demonstrated
that the suppressor of cytokine signaling-3 (SOCS-3) serves as a
potent regulator of inflammation (11) and spinal disease (12). Based on these previous findings, the
current study hypothesized that SOCS-3 may have a potential role in
SDD.
SOCS-3, a member of the SOCS protein family,
combines with glycoprotein 130 or with Janus Kinase (JAK) 1 and
JAK2 to suppress signal transduction (13). Osuka et al (14) reported that SOCS-3 molecules may
serve as modulators in the degeneration of chondrocytes within
herniated discs by negatively regulating the expression of JAK1 and
signal transducer and activator of transcription 3 (STAT3). A
previous study also demonstrated that enhanced SOCS-3 inhibits
proliferation and inflammation in osteoarthritis (15), a degenerative joint disorder
(16). In addition, SOCS-3 is a
pivotal feedback inhibitor of leptin, while leptin induces the
expression of SOCS-3 (17,18). Leptin is a 16 kDa hormone and a
product of the “ob” gene, which is generated by white
adipocytes and regulates the intake of food and the balance of
energy (19,20). Leptin is also a direct regulator of
bone growth, inducing osteoblast proliferation, collagen synthesis
and bone mineralization (21). In
addition, tumor necrosis factor-α (TNF-α) is a prominent regulator
of disc degeneration and lower back pain, exacerbating inflammatory
processes (22). SOCS-3 regulates
proinflammatory TNF-α signal transduction by suppressing
TNF-α-mediated signaling in hepatitis C virus infection (23). The current study assessed the effect
of SOCS-3 on SDD in adolescents, as well as its involvement in
regulating leptin and TNF-α. The results revealed that SOCS-3
protects degenerative nucleus pulposus cells (NPCs) against SDD in
adolescents by modulating leptin and TNF-α.
Materials and methods
Ethics statement
The experimental protocols of the present study were
approved by the Ethical Committee of the Affiliated Huai'an No.1
People's Hospital of Nanjing Medical University (Huai'an, China).
All patients provided signed informed consent.
Patients
From January 2010 to January 2016, 120 adolescents
(age range, 14–25 years) admitted to The Affiliated Huai'an No.1
People's Hospital of Nanjing Medical University were selected for
participation in the current study. X-ray and magnetic resonance
imaging (MRI) scans were performed. The inclusion criteria were as
follows: Patients >20 years; patients that were diagnosed with
SDD based on the following: Cervical spondylosis, cervical spinal
stenosis, ossification of the posterior longitudinal ligament of
the cervical vertebra, posterior longitudinal ligament ossification
of the cervical vertebra, thoracic disc herniation, thoracic spinal
stenosis, ossification of the posterior longitudinal ligament of
the thoracic vertebra, lumbar disc herniation, lumbar spinal
stenosis, non-traumatic spinal instability or spondylolisthesis.
The exclusion criteria were as follows: Patients with cognitive or
communication disorders that were unable to complete the scale and
express their feelings clearly; patients who are critically ill or
have other chronic diseases that lead to life dysfunction; patients
that had experienced trauma, including spinal fracture within 3
months; and patients diagnosed with spinal neoplasms, tuberculosis
or ankylosing spondylitis. According to Gries' scoring standard
(24), a total of 68 patients (46
males and 22 females; mean age, 18.89±2.78) with a score of 1, 2
and 3 were diagnosed with mild (n=21), moderate (n=28) and severe
(n=19) spinal degeneration, respectively. Those who scored 0
exhibited no degeneration in the spine (n=52; 29 males and 23
females; mean age, 18.27±2.41) and served as controls. Comparisons
of age (t=1.42; P=0.16) and sex (χ2=1.77; P=0.18)
between the patients and controls were not statistically
significant. Of the 68 patients recruited, 43 patients were
selected randomly to obtain their NPCs. These NPCs were then
subdivided into three treatment groups as mentioned below.
Isolation and culture of NPCs
Degenerative NPCs were extracted from patients via
puncture to the nucleus pulposus of the intervertebral disc. Normal
NPCs were extracted from intervertebral disc tissue of the lesions
following surgery for acute trauma. PBS was utilized to wash tissue
in a sterile environment. NPCs were isolated (25), cut into sections (diameter, 2–3 mm),
washed twice with PBS, digested with 0.2% protease at 37°C for 60
min and then digested with 0.02% type II collagenase overnight at
37°C. After the detachment was terminated with Dulbecco modified
Eagle medium Ham's F-12 (DMEM/F12; Thermo Fisher Scientific, Inc.),
the NPCs were centrifuged at 201 × g (5 min, 3 times) at room
temperature. NPCs were collected, counted using cell-counting
boards, and inoculated into a 25 cm culture flask at a density of
1×10⁶ cells/ml. DMEM/F12 with 10% fetal bovine serum
(FBS; Gibco; Thermo Fisher Scientific, Inc.) and 1%
penicillin-streptomycin was subsequently added, and cells were
incubated with 5% CO2 at 37°C for 7–10 days until cells
covered the whole wall of the culture flask. During incubation,
culture medium was refreshed every 3 days.
Cell Construction and
transfection
pCR3.1-SOCS-3 and pCR3.1 were purchased from
Invitrogen (Thermo Fisher Scientific, Inc., Waltham, MA, USA). NPCs
were divided into the following four groups: The blank group
(degenerative NPCs without transfection), the pCR3.1-SOCS-3 group
(degenerative NPCs transfected with pCR3.1-SOCS-3), the pCR3.1
group (degenerative NPCs transfected with pCR3.1) and the normal
group (normal NPCs without transfection). NPCs extracted and
cultured from 42 SDD patients were allocated evenly into the
following three groups: The blank group, the pCR3.1-SOCS-3 group
and the pCR3.1 group, with 14 patients in each group. Passaged NPCs
were inoculated into 24-well plates at a density of
4×10⁴ cells/well for 24 h at 37°C. Cells were then
transfected when the confluence of adherent cells reached 30–50%. A
total of 50 µl Opti-MEM (Gibco; Thermo Fisher Scientific, Inc.) was
used to dilute 20 pmol pCR3.1-SOCS-3 and pCR3.1, which were then
gently mixed. Opti-MEM (50 µl) was used to dilute 1 µl liposome
Lipofectamine 2000 (Invitrogen; Thermo Fisher Scientific, Inc.),
which was mixed and incubated at room temperature for 5 min.
Diluted pCR3.1 plasmids and liposome Lipofectamine 2000 were then
mixed and incubated at room temperature for 20 min. Each well
received a mixture of liposome and vectors (100 µl) and was added
with DMEM/F12 (Gibco; Thermo Fisher Scientific, Inc.) with 10% FBS
(Gibco; Thermo Fisher Scientific, Inc.) and 1%
penicillin-streptomycin. Cell culture plates were then incubated
with 5% CO2 at 37°C for 8 h. The culture medium
(DMEM/F12 with 2% FBS) was then replaced with DMEM-F12 cell culture
medium with 10% FBS and incubated at 37°C for 48 h.
Flow cytometry
After NPCs of each group were digested with trypsin
and counted, they were resuspended in an Eppendorf (EP) tube at a
density of 2×10⁵ and incubated with 5 µl Human TruStain
FcX™ (Fc receptor blocking solution; BioLegend, Inc.) at room
temperature for 5–10 min. Subsequently, cells were probed with
PE-labeled monoclonal antibodies against TNF-α (1:20; cat. no.
MABF352; Sigma-Aldrich; Merck KGaA) and FITC-labeled Annexin V
(1:10; cat. no. ab63556; Abcam) at 4°C for 30 min. After cells were
centrifuged three times at 201 × g (5 min each) at 37°C, the
aforementioned antibodies were washed with cell staining buffer.
Flow cytometry was performed detection, and flowJo V10.0.7 software
(FlowJo LLC) was applied for analysis.
ELISA
After cells in each group were cultured for 12, 24
or 48 h, cell supernatants were collected. TNF-α (cat. no. 555268;
BD Pharmingen; BD Biosciences, San Jose, CA, USA) and leptin
(SBJ-H1014, Nanjing SenBeiJia Biological Technology Co., Ltd.,
Nanjing, China) levels were detected using ELISA kits. The optical
density (OD) value was determined at 450 nm. TNF-α and leptin
levels in samples were calculated using a standard curve.
Reverse transcription-quantitative
polymerase chain reaction (RT-qPCR)
NPCs from the blank, pCR3.1-SOCS-3, pCR3.1 and
normal groups were collected. SOCS-3 levels were detected using
RT-qPCR. Leptin at different concentrations (0, 1, 2.5, 5, 10 and
15 mM) were added to degenerative NPCs, and following 48 h, cells
were collected. The levels of leptin and SOCS-3 were examined
following RT-qPCR. Total RNA was extracted from the NPCs of each
group using TRIzol (cat. no. 1559602; Invitrogen; Thermo Fisher
Scientific, Inc.) and then reversely transcribed to cDNA. First
strand cDNA was synthesized using the High-Capacity cDNA reverse
transcription kit (Applied Biosystems; Thermo Fisher Scientific,
Inc.) according to the manufacturer's protocol. Subsequently, 1 µl
cDNA was added to 25 µl of a quantitative fluorescence reaction
system (SYBR Green Realtime PCR Master Mix; cat. no. QPK-201;
Toyobo Life Science) containing, forward primer (10 µM; 0.5 µl),
reverse primer (10 µM; 0.5 µl), SYBR Green Real-time PCR Master Mix
(12.5 µl; cat. no. QPK-201; Toyobo Life Science) and nuclease-free
water (10.5 µl). ABI 7500 PCR (Applied Biosystems; Thermo Fisher
Scientific, Inc.) was used to analyze curves of PCR amplification
and solubility. The primer sequences were as follows. Leptin
forward, 5′-ATGCATTGGGAACCCTGTGCGG-3′ and reverse,
5′-TGAGGTCCAGCTGCCACAGCATG-3′; SOCS-3 forward,
5′-CTACGCATCCAGTGTGAGGG-3′ and reverse, 5′-TGAGTACACAGTCGAAGCGG-3′;
β-actin forward 5′-TTGCCGACAGGATGCAGAAGGA-3′ and reverse,
5′-AGGTGGACAGCGAGGCCAGGAT-3′. The thermocycling conditions were as
follows: 50°C for 2 min, 95°C for 2 min, 95°C for 15 sec, 60°C for
30 sec and 40 cycles of amplification. Melting curves were then
drawn using 95°C for 15 sec, 60°C for 1 min, 85°C for 15 sec and
60°C for 15 sec. Finally, results were obtained using the
2−ΔΔCq method (26), with
β-actin as an internal reference. Experiments were repeated three
times for each sample.
Western blot analysis
Recombined human leptin proteins at final
concentrations of 0, 1, 2.5, 5, 10 and 15 mM were added to cells
from each group in accordance with experimental requirements.
Following 48 h, cells from each group were collected. Changes in
SOCS-3 levels were determined via western blotting (27,28).
Prepared protein samples (20–60 µg/l) were isolated via 12%
SDS-PAGE. Electrophoresis (80–120 V) was immediately terminated
once bromophenol blue reached the bottom of the gel. Protein was
then transferred onto nitrocellulose membranes for 1.5 h at 100 V.
After washing with PBS containing 0.5% Tween 20 (PBST), the
membranes were blocked in 5% skimmed milk at room temperature for 2
h. The following primary antibodies were then added and incubated
at 4°C overnight: GAPDH (cat. no. ab37168; 1:1,000), SOCS-3 (cat.
no. ab16030; l:1,000), leptin receptor (cat. no. ab5593; l:2,000),
leptin (cat. no. ab3583; l:500) and phosphorylated leptin receptor
(cat. no. PA5-64634; l:5,000). Membranes were washed four times
with PBST (each, 10 min) and incubated with secondary antibodies
(horseradish peroxidase-conjugated goat anti-rabbit IgG (cat. no.
ab97051; 1:2,000) at room temperature for 2 h on a shaking table
(HS 501 digita; IKA-Werke, Staufen, Germany). All antibodies were
purchased from Abcam. Membranes were then washed four times with
PBST (each, 10 min) and developed using a chemiluminescence (ECL)
fluorescent detection kit (cat. no. BB-3501; GE Healthcare,
Chicago, IL, USA). ImageJ 1.46r software (National Institutes of
Health, Bethesda, MD, USA) was utilized to quantitatively analyze
the molecular weight and net optical density value of target bands,
with GAPDH used as a reference.
Statistical analysis
SPSS 20.0 software (IBM Corp., Armonk, NY, USA) was
utilized for data analysis. Data are expressed as the mean ±
standard deviation. Normal distribution and variance homogeneity
were tested for all the data. The statistical significance of data
with normal distribution and equal variance between two groups were
compared using an unpaired t-test. Comparisons among multiple
groups were analyzed using one-way analysis of variance or repeated
measurement analysis of variance, followed by a Tukey's post-hoc
test. Data with a skewed distribution or heterogeneity of variance
were compared using a rank sum test. The correlation between SOCS-3
and phosphorylated leptin receptor levels were analyzed using a
Pearson's correlation test. P<0.05 was considered to indicate a
statistically significant difference.
Results
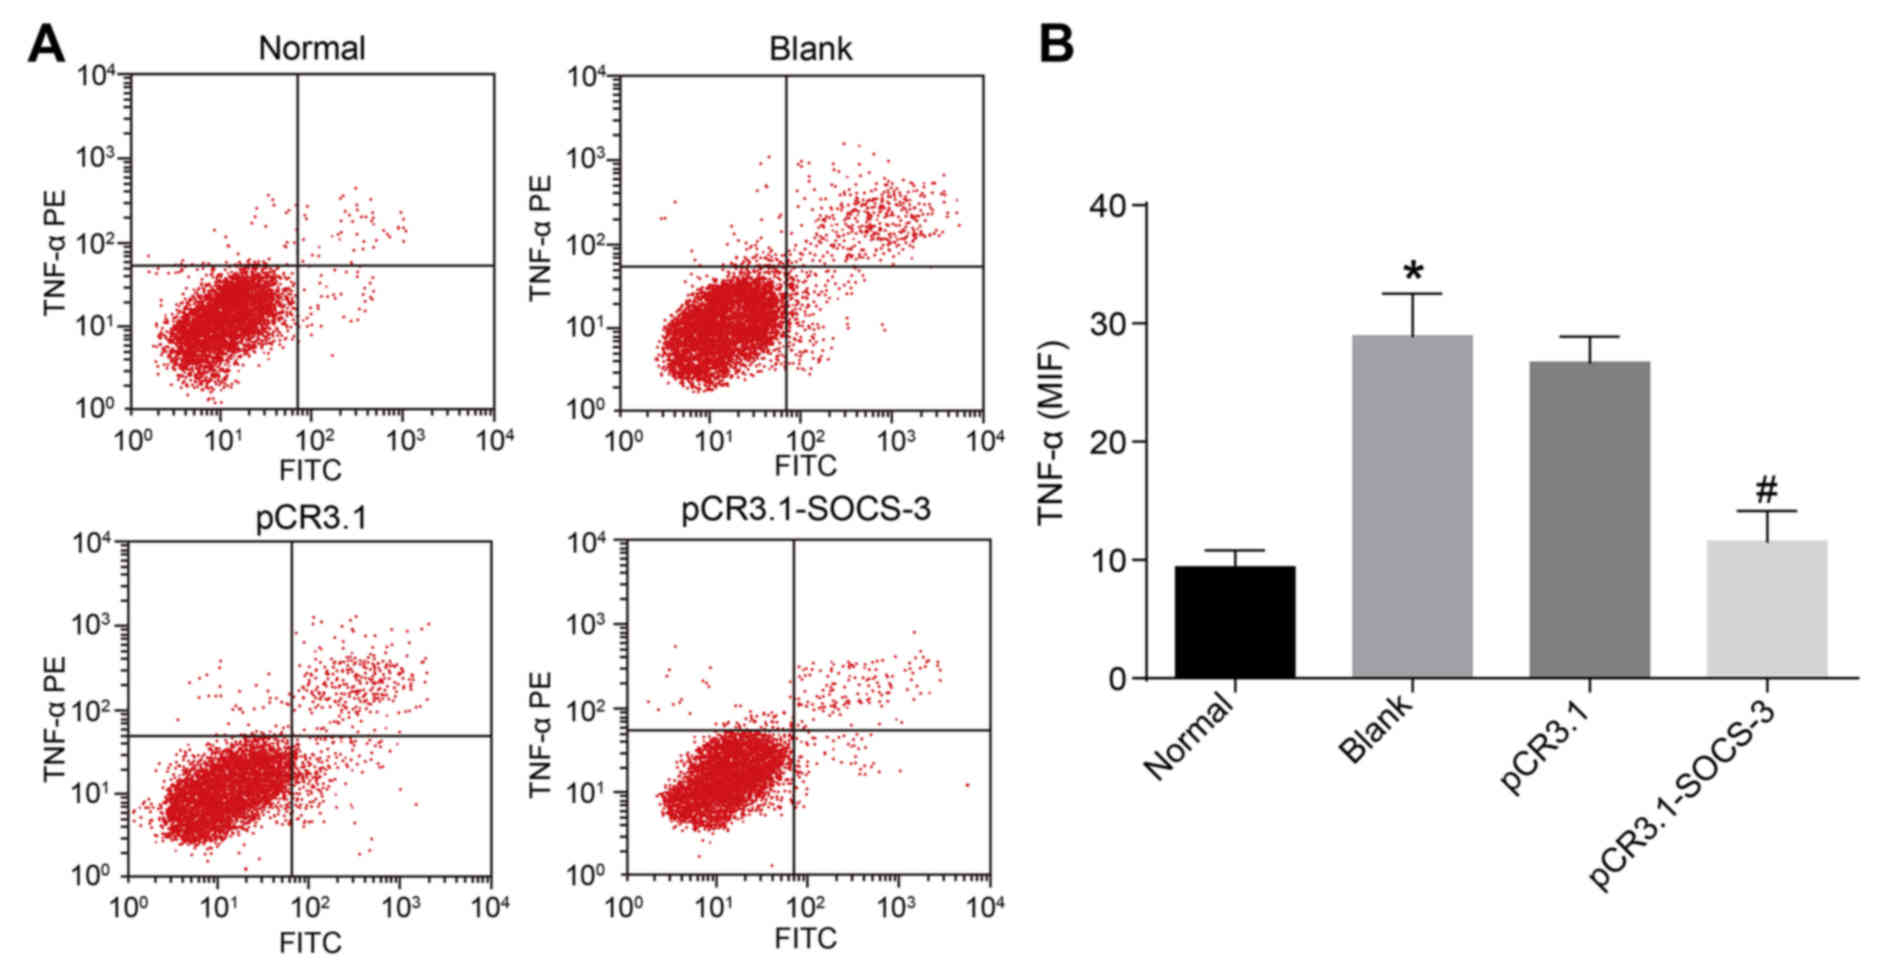
Overexpression of SOCS-3 decreases
TNF-α levels in degenerative NPCs
To assess the expression of TNF-α in degenerative
NPCs transfected with SOCS-3, flow cytometry was performed. The
number of TNF-α positive cells and the MFI of the blank group were
significantly higher than that of the normal group (P<0.05).
TNF-α was overexpressed in degenerative NPCs and underexpressed in
normal NPCs. Following degenerative NPC transfection, the number of
TNF-α positive cells and the MFI of the pCR3.1-SOCS-3 group
significantly decreased when compared with the pCR3.1 group
(P<0.05; Fig. 1). These data
indicate that SOCS-3 overexpression results in a significant
reduction of TNF-α in degenerative NPCs.
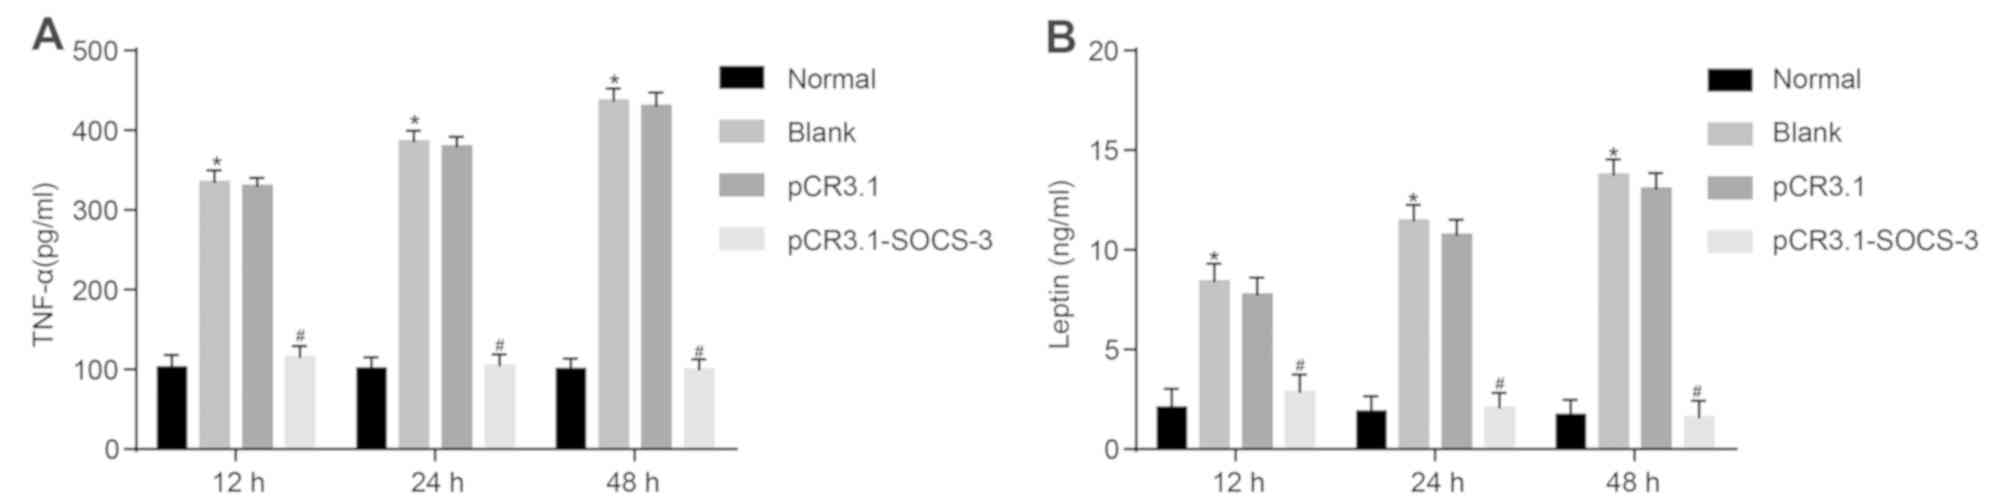
Overexpression of SOCS-3 decreases
levels of TNF-α and leptin in degenerative NPCs
To assess the effect of SOCS-3 on TNF-α and leptin
in degenerative NPCs, ELISA was performed. As presented in Fig. 2, TNF-α and leptin levels were
significantly higher in the blank group compared with the normal
group at 12, 24 and 48 h (P<0.05). Following the transfection of
degenerative NPCs, levels of TNF-α and leptin were significantly
decreased in the pCR3.1-SOCS-3 group compared with the pCR3.1 group
(P<0.05), indicating that levels of TNF-α and leptin were
increased in degenerative NPCs without treatment and remained
relatively low in normal NPCs. The results revealed that the
overexpression of SOCS-3 reduces the level of TNF-α and leptin in
degenerative NPCs.
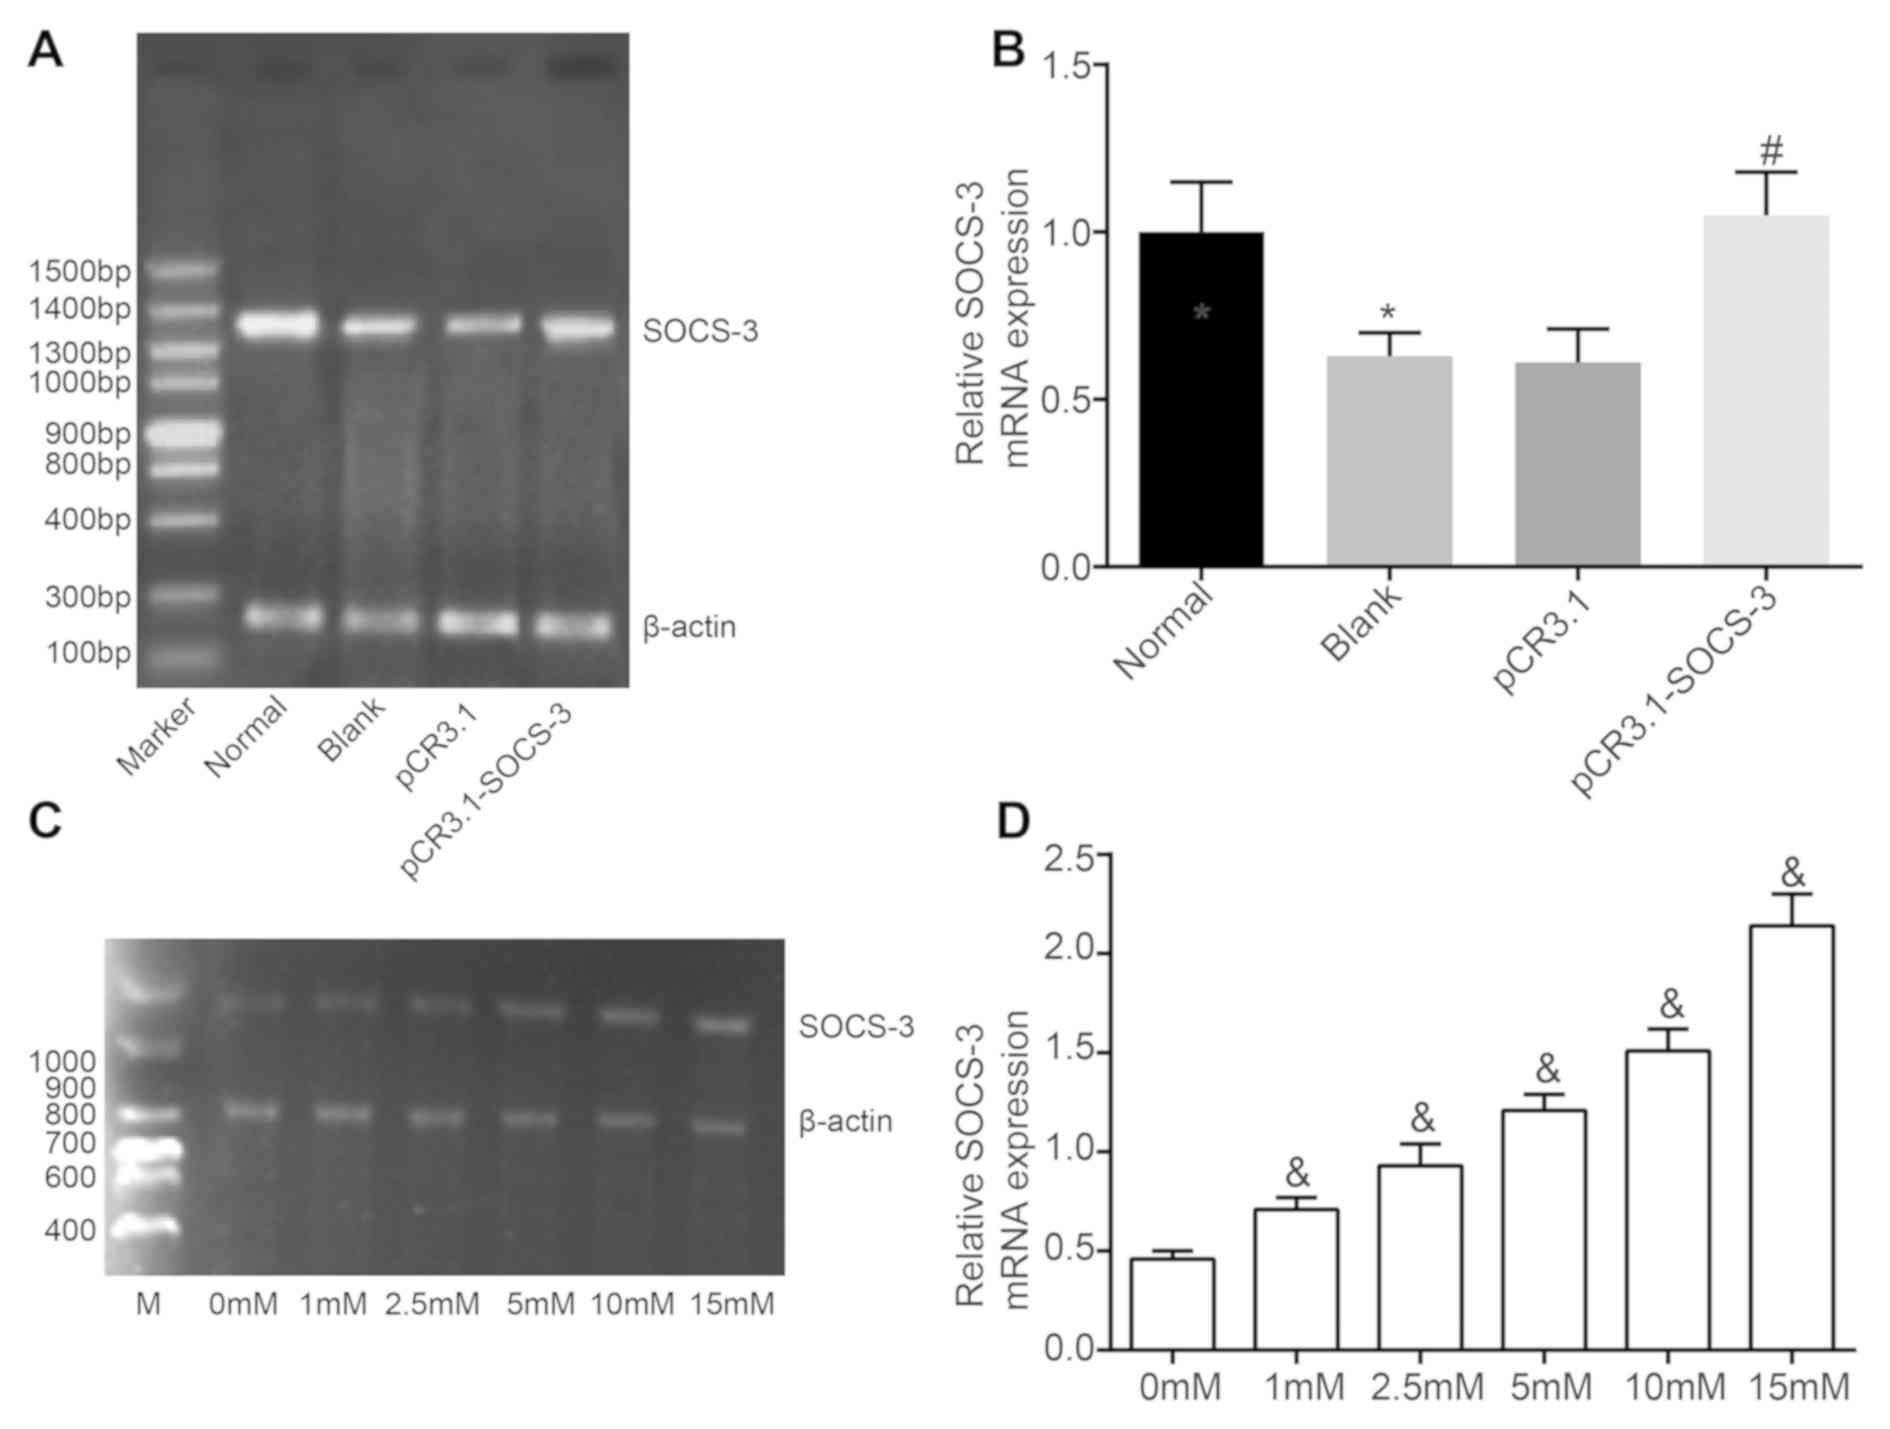
Leptin induces SOCS-3 mRNA levels
To assess the mechanism and function of SOCS-3 and
leptin in NPCs, their expression was determined using RT-qPCR.
SOCS-3 was revealed to be poorly expressed in degenerative NPCs
compared with normal NPCs (P<0.05). SOCS-3 mRNA levels in the
pCR3.1-SOCS-3 group were markedly higher than those in the pCR3.1
group (P<0.05). However, SOCS-3 mRNA levels in the pCR3.1 group
were not significantly different from those in the blank group
(Fig. 3A and B). Following
degenerative NPC culture with increasing concentrations of leptin
for 48 h, SOCS-3 mRNA was induced in a concentration-dependent
manner (Fig. 3C and D).
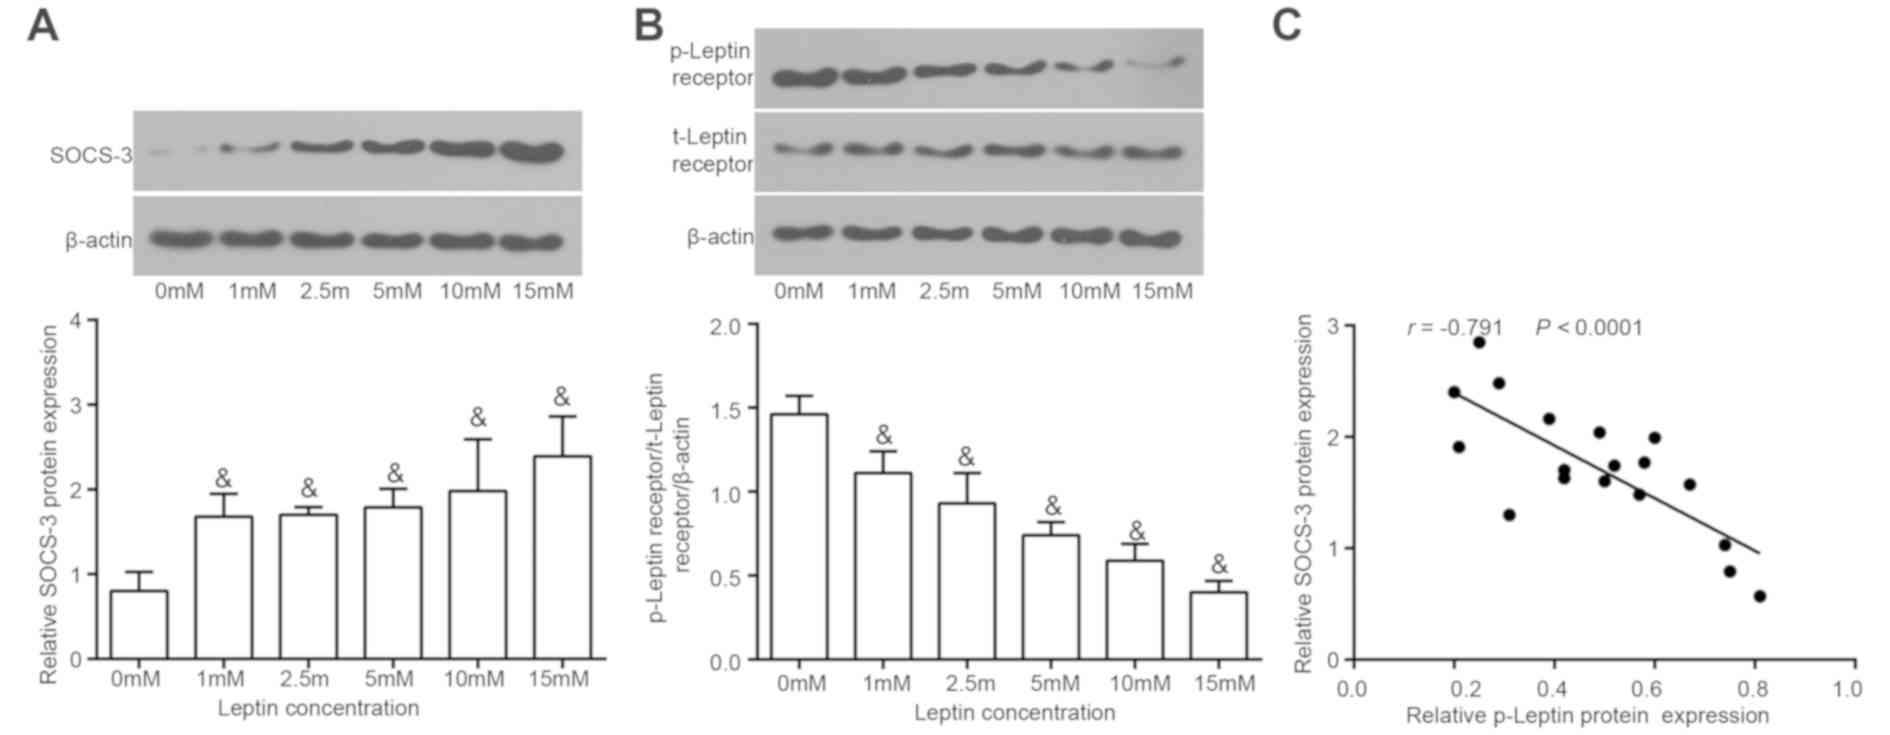
Leptin increases SOCS-3 protein levels
in a concentration-dependent manner
The ability of SOCS-3 to influence the biological
function of leptin in NPCs was assessed. The leptin receptor itself
does not possess tyrosine kinase activity and therefore is
phosphorylated by leptin only. Different concentrations of leptin
were added to degenerative NPCs to induce the upregulation of
SOCS-3 for 48 h. Leptin expression and leptin receptor
phosphorylation was determined using western blotting. The results
demonstrated that SOCS-3 protein levels increased gradually with
increasing concentrations of leptin in degenerative NPCs (Fig. 4A). However, the extent of leptin
receptor phosphorylation (Fig. 4B)
gradually decreased with increasing leptin concentrations. A
Pearson's correlation analysis was performed to assess the
correlation between SOCS-3 and phosphorylated leptin receptor
levels. The results revealed that phosphorylated leptin receptor
levels were negatively correlated with SOCS-3 levels (Fig. 4C). Thus, leptin induces SOCS-3 in a
concentration-dependent manner.
Discussion
Although SDD is rare in pediatric and adolescent
populations, those affected experience a reduced quality of life
and suffering (29). The SOCS family
[comprised of eight genes (SOCS1 to SOCS7 along with CIS) that
share similar structures], function as negative mediators of
cytokine signaling and serve a critical role in the immune system
(30,31). The current study assessed the effect
of SOCS-3 on adolescent SDD and its association with leptin and
TNF-α. The results demonstrated that the overexpression of SOCS-3
reduced leptin levels and inhibited TNF-α, providing a theoretical
foundation for SDD treatment in adolescents.
Initially, the present study revealed that the
number of TNF-α positive cells in degenerative NPCs was
significantly higher compared with normal NPCs, indicating that
TNF-α is overexpressed in the former. Furthermore, the number of
TNF-α positive cells in degenerative NPCs transfected with
pCR3.1-SOCS-3 were reduced compared with those transfected with
pCR3.1, indicating that the overexpression of SOCS-3 decreases
TNF-α levels. TNF-α is a proinflammatory cytokine that contributes
to inflammation-induced disease pathology, while SOCS proteins
function as suppressors of cytokine signaling and mediators of
inflammation (23). A previous study
determined the prominent role of SOCS-3 in herniated lumbar disc
degeneration by inhibiting the JAK/STAT3 signaling pathway
(14). SOCS-3 also exhibits
anti-inflammatory and anti-proliferation effects in osteoarthritis
by downregulating levels of nuclear factor-κB and cyclooxygenase 2
(15). Dai et al (32) demonstrated that the upregulation of
SOCS-3 expression results in reduced TNF-α levels and the
regulation of Kallikrein-binding protein. Furthermore, Collino
et al (33) determined that
SOCS-3 restoration leads to a decreased local inflammatory response
by suppressing levels of TNF-α in patients with acute kidney injury
(33).
The ELISA results of the current study demonstrated
that levels of TNF-α and leptin at 12, 24 and 48 h in degenerative
NPCs were significantly higher than in normal NPCs. Following
transfection with pCR3.1, levels of TNF-α and leptin in the
pCR3.1-SOCS-3 group decreased to a greater extent than in the
pCR3.1 group. This indicates that TNF-α and leptin are
overexpressed in degenerative NPCs free of any treatment and
underexpressed in normal NPCs. Furthermore, overexpressed SOCS-3
was determined to decrease TNF-α and leptin levels in degenerative
NPCs. A previous study by Ohtori et al (34) revealed that more TNF-α
immune-reactive cells were observed in the nucleus pulposus from
adolescent patients with lumbar disc herniation with compared with
adolescent patients with nonpainful scoliosis, indicating that
TNF-α may be associated with disc degeneration and pain in
adolescent patients with lumbar disc herniation. TNF-α was also
revealed to initiate early stage disc degeneration, which indicates
that it may be an early pathogenetic factor in disc degeneration
(35). In addition, Wang et
al (36) determined that leptin
levels were elevated in rat models of femoral fracture and
traumatic spinal cord injury.
In addition to the inhibitory effect of SOCS-3 on
leptin, the results indicated that leptin induces SOCS-3
expression. SOCS-3 has been reported to negatively regulate leptin
in patients with osteoarthritis (37). Yang et al (38) also demonstrated that SOCS-3
negatively regulates leptin signaling in the hypothalamus and that
leptin induces SOCS-3, thus preventing leptin signaling and
indicating that SOCS-3 functions as a regulator of leptin
sensitivity (38). Furthermore, a
previous study determined that high-dose leptin triggers the
increased expression of SOCS-3 in people that are obese (39).
In conclusion, the present study revealed that the
upregulated expression of SOCS-3 may be a novel treatment target
for SDD, as SOCS-3 overexpression may alleviate SDD by reducing
leptin expression and TNF-α levels. However, the relatively small
sample size in the current study may have influenced the results
obtained. Thus, further studies with larger sample sizes should be
performed to explore the protective value of SOCS-3 in adolescent
patients with SDD. It is anticipated that with a further
understanding of SDD, SOCS-3 and leptin may be a promising target
for the prevention and treatment of SDD in adolescents.
Acknowledgements
Not applicable.
Funding
No funding was received.
Availability of data and materials
The datasets used and/or analyzed during the present
study are available from the corresponding author on reasonable
request.
Authors' contributions
XT and JD designed the current study, JD and HS
collected the data. XT and JD performed data analyses and produced
the initial draft of the manuscript. All authors have read and
approved the final submitted manuscript.
Ethics approval and consent to
participate
The experimental protocols of the present study were
approved by the Ethical Committee of Huai'an First People's
Hospital (Huai'an, China). All patients provided signed informed
consent.
Patient consent for publication
Not applicable.
Competing interests
The authors declare they have no competing
interests.
References
|
1
|
Brinjikji W, Luetmer PH, Comstock B,
Bresnahan BW, Chen LE, Deyo RA, Halabi S, Turner JA, Avins AL,
James K, et al: Systematic literature review of imaging features of
spinal degeneration in asymptomatic populations. AJNR Am J
Neuroradiol. 36:811–816. 2015. View Article : Google Scholar : PubMed/NCBI
|
|
2
|
Matsumoto M, Okada E, Ichihara D, Watanabe
K, Chiba K, Toyama Y, Fujiwara H, Momoshima S, Nishiwaki Y,
Hashimoto T, et al: Age-related changes of thoracic and cervical
intervertebral discs in asymptomatic subjects. Spine (Phila Pa
1976). 35:1359–1364. 2010. View Article : Google Scholar : PubMed/NCBI
|
|
3
|
Lao LF, Zhong GB, Li QY and Liu ZD:
Kinetic magnetic resonance imaging analysis of spinal degeneration:
A systematic review. Orthop Surg. 6:294–299. 2014. View Article : Google Scholar : PubMed/NCBI
|
|
4
|
Goel A: Facet distraction spacers for
treatment of degenerative disease of the spine: Rationale and an
alternative hypothesis of spinal degeneration. J Craniovertebr
Junction Spine. 1:65–66. 2010. View Article : Google Scholar : PubMed/NCBI
|
|
5
|
Hey HW and Hee HT: Lumbar degenerative
spinal deformity: Surgical options of PLIF, TLIF and MI-TLIF.
Indian J Orthop. 44:159–162. 2010. View Article : Google Scholar : PubMed/NCBI
|
|
6
|
Takatalo J, Karppinen J, Näyhä S, Taimela
S, Niinimäki J, Blanco Sequeiros R, Tammelin T, Auvinen J and
Tervonen O: Association between adolescent sport activities and
lumbar disk degeneration among young adults. Scand J Med Sci
Sports. 27:1993–2001. 2017. View Article : Google Scholar : PubMed/NCBI
|
|
7
|
Wang H, Cheng J, Xiao H, Li C and Zhou Y:
Adolescent lumbar disc herniation: Experience from a large
minimally invasive treatment centre for lumbar degenerative disease
in Chongqing, China. Clin Neurol Neurosurg. 115:1415–1419. 2013.
View Article : Google Scholar : PubMed/NCBI
|
|
8
|
Daniels DJ, Luo TD, Puffer R, McIntosh AL,
Larson AN, Wetjen NM and Clarke MJ: Degenerative changes in
adolescent spines: A comparison of motocross racers and age-matched
controls. J Neurosurg Pediatr. 15:266–271. 2015. View Article : Google Scholar : PubMed/NCBI
|
|
9
|
Omair A, Holden M, Lie BA, Reikeras O and
Brox JI: Treatment outcome of chronic low back pain and
radiographic lumbar disc degeneration are associated with
inflammatory and matrix degrading gene variants: A prospective
genetic association study. BMC Musculoskelet Disord. 14:1052013.
View Article : Google Scholar : PubMed/NCBI
|
|
10
|
Ren Y and Young W: Managing inflammation
after spinal cord injury through manipulation of macrophage
function. Neural Plast. 2013:9450342013. View Article : Google Scholar : PubMed/NCBI
|
|
11
|
Carow B and Rottenberg ME: SOCS3, a Major
regulator of infection and inflammation. Front Immunol. 5:582014.
View Article : Google Scholar : PubMed/NCBI
|
|
12
|
Park KW, Lin CY and Lee YS: Expression of
suppressor of cytokine signaling-3 (SOCS3) and its role in neuronal
death after complete spinal cord injury. Exp Neurol. 261:65–75.
2014. View Article : Google Scholar : PubMed/NCBI
|
|
13
|
Park KW, Lin CY, Li K and Lee YS: Effects
of reducing suppressors of cytokine signaling-3 (SOCS3) expression
on dendritic outgrowth and demyelination after spinal cord injury.
PLoS One. 10:e01383012015. View Article : Google Scholar : PubMed/NCBI
|
|
14
|
Osuka K, Usuda N, Aoyama M, Yamahata H,
Takeuchi M, Yasuda M and Takayasu M: Expression of the
JAK/STAT3/SOCS3 signaling pathway in herniated lumbar discs.
Neurosci Lett. 569:55–58. 2014. View Article : Google Scholar : PubMed/NCBI
|
|
15
|
Gui T, He BS, Gan Q and Yang C: Enhanced
SOCS3 in osteoarthiritis may limit both proliferation and
inflammation. Biotech Histochem. 92:107–114. 2017. View Article : Google Scholar : PubMed/NCBI
|
|
16
|
Dreier R: Hypertrophic differentiation of
chondrocytes in osteoarthritis: The developmental aspect of
degenerative joint disorders. Arthritis Res Ther. 12:2162010.
View Article : Google Scholar : PubMed/NCBI
|
|
17
|
Babon JJ and Nicola NA: The biology and
mechanism of action of suppressor of cytokine signaling 3. Growth
Factors. 30:207–219. 2012. View Article : Google Scholar : PubMed/NCBI
|
|
18
|
Lubis AR, Widia F, Soegondo S and
Setiawati A: The role of SOCS-3 protein in leptin resistance and
obesity. Acta Med Indones. 40:89–95. 2008.PubMed/NCBI
|
|
19
|
Garner M, Alshameeri Z and Khanduja V:
Osteoarthritis: Genes, nature-nurture interaction and the role of
leptin. Int Orthop. 37:2499–2505. 2013. View Article : Google Scholar : PubMed/NCBI
|
|
20
|
Vuolteenaho K, Koskinen A and Moilanen E:
Leptin-a link between obesity and osteoarthritis. Applications for
prevention and treatment. Basic Clin Pharmacol Toxicol.
114:103–108. 2014. View Article : Google Scholar : PubMed/NCBI
|
|
21
|
Mutabaruka MS, Aoulad Aissa M, Delalandre
A, Lavigne M and Lajeunesse D: Local leptin production in
osteoarthritis subchondral osteoblasts may be responsible for their
abnormal phenotypic expression. Arthritis Res Ther. 12:R202010.
View Article : Google Scholar : PubMed/NCBI
|
|
22
|
Johnson ZI, Schoepflin ZR, Choi H, Shapiro
IM and Risbud MV: Disc in flames: Roles of TNF-alpha and IL-1β in
intervertebral disc degeneration. Eur Cell Mater. 30:104–116. 2015.
View Article : Google Scholar : PubMed/NCBI
|
|
23
|
Collins AS, Ahmed S, Napoletano S,
Schroeder M, Johnston JA, Hegarty JE, O'Farrelly C and Stevenson
NJ: Hepatitis C virus (HCV)-induced suppressor of cytokine
signaling (SOCS) 3 regulates proinflammatory TNF-α responses. J
Leukoc Biol. 96:255–263. 2014. View Article : Google Scholar : PubMed/NCBI
|
|
24
|
Poiraudeau S, Monteiro I, Anract P,
Blanchard O, Revel M and Corvol MT: Phenotypic characteristics of
rabbit intervertebral disc cells. Comparison with cartilage cells
from the same animals. Spine (Phila Pa 1976). 24:837–844. 1999.
View Article : Google Scholar : PubMed/NCBI
|
|
25
|
Chelberg MK, Banks GM, Geiger DF and
Oegema TR Jr: Identification of heterogeneous cell populations in
normal human intervertebral disc. J Anat. 186:43–53.
1995.PubMed/NCBI
|
|
26
|
Livak KJ and Schmittgen TD: Analysis of
relative gene expression data using real-time quantitative PCR and
the 2(-Delta Delta C(T)) method. Methods. 25:402–408. 2001.
View Article : Google Scholar : PubMed/NCBI
|
|
27
|
Yu J, Ryan DG, Getsios S,
Oliveira-Fernandes M, Fatima A and Lavker RM: MicroRNA-184
antagonizes microRNA-205 to maintain SHIP2 levels in epithelia.
Proc Natl Acad Sci USA. 105:19300–19305. 2008. View Article : Google Scholar : PubMed/NCBI
|
|
28
|
Yu J, Peng H, Ruan Q, Fatima A, Getsios S
and Lavker RM: MicroRNA-205 promotes keratinocyte migration via the
lipid phosphatase SHIP2. FASEB J. 24:3950–3959. 2010. View Article : Google Scholar : PubMed/NCBI
|
|
29
|
Kumar R, Kumar V, Das NK, Behari S and
Mahapatra AK: Adolescent lumbar disc disease: Findings and outcome.
Childs Nerv Syst. 23:1295–1299. 2007. View Article : Google Scholar : PubMed/NCBI
|
|
30
|
Lindemann C, Hackmann O, Delic S, Schmidt
N, Reifenberger G and Riemenschneider MJ: SOCS3 promoter
methylation is mutually exclusive to EGFR amplification in gliomas
and promotes glioma cell invasion through STAT3 and FAK activation.
Acta Neuropathol. 122:241–251. 2011. View Article : Google Scholar : PubMed/NCBI
|
|
31
|
Kershaw NJ, Murphy JM, Liau NP, Varghese
LN, Laktyushin A, Whitlock EL, Lucet IS, Nicola NA and Babon JJ:
SOCS3 binds specific receptor-JAK complexes to control cytokine
signaling by direct kinase inhibition. Nat Struct Mol Biol.
20:469–476. 2013. View Article : Google Scholar : PubMed/NCBI
|
|
32
|
Dai Z, Lu L, Yang Z, Mao Y, Lu J, Li C, Qi
W, Chen Y, Yao Y, Li L, et al: Kallikrein-binding protein inhibits
LPS-induced TNF-α by upregulating SOCS3 expression. J Cell Biochem.
114:1020–1028. 2013. View Article : Google Scholar : PubMed/NCBI
|
|
33
|
Collino M, Benetti E, Miglio G, Castiglia
S, Rosa AC, Aragno M, Thiemermann C and Fantozzi R: Peroxisome
proliferator-activated receptor β/δ agonism protects the kidney
against ischemia/reperfusion injury in diabetic rats. Free Radic
Biol Med. 50:345–353. 2011. View Article : Google Scholar : PubMed/NCBI
|
|
34
|
Ohtori S, Inoue G, Eguchi Y, Orita S,
Takaso M, Ochiai N, Kishida S, Kuniyoshi K, Aoki Y, Nakamura J, et
al: Tumor necrosis factor-α-immunoreactive cells in nucleus
pulposus in adolescent patients with lumbar disc herniation. Spine
(Phila Pa 1976). 38:459–462. 2013. View Article : Google Scholar : PubMed/NCBI
|
|
35
|
Kang R, Li H, Rickers K, Ringgaard S, Xie
L and Bünger C: Intervertebral disc degenerative changes after
intradiscal injection of TNF-α in a porcine model. Eur Spine J.
24:2010–2016. 2015. View Article : Google Scholar : PubMed/NCBI
|
|
36
|
Wang L, Tang X, Zhang H, Yuan J, Ding H
and Wei Y: Elevated leptin expression in rat model of traumatic
spinal cord injury and femoral fracture. J Spinal Cord Med.
34:501–509. 2011. View Article : Google Scholar : PubMed/NCBI
|
|
37
|
Vuolteenaho K, Koskinen A, Moilanen T and
Moilanen E: Leptin levels are increased and its negative
regulators, SOCS-3 and sOb-R are decreased in obese patients with
osteoarthritis: A link between obesity and osteoarthritis. Ann
Rheum Dis. 71:1912–1913. 2012. View Article : Google Scholar : PubMed/NCBI
|
|
38
|
Yang Z, Hulver M, McMillan RP, Cai L,
Kershaw EE, Yu L, Xue B and Shi H: Regulation of insulin and leptin
signaling by muscle suppressor of cytokine signaling 3 (SOCS3).
PLoS One. 7:e474932012. View Article : Google Scholar : PubMed/NCBI
|
|
39
|
Teran-Cabanillas E and Hernandez J: Role
of Leptin and SOCS3 in inhibiting the type I interferon response
during obesity. Inflammation. 40:58–67. 2017. View Article : Google Scholar : PubMed/NCBI
|