Introduction
Glioblastoma multiforme (GBM) is one of the most
common, malignant and deadly of the primary brain tumour types,
with a typical survival time from identification of ~1 year
(1,2). Despite significant efforts to increase
the knowledge and improve the treatment regimens for GBM, the
prognosis remains unsatisfactory (3,4). Due to
the multifactorial and complex pathogenesis of GBM (5), its complex pathogenesis has remained to
be fully elucidated. In-depth exploration of the pathogenic
mechanisms may provide novel clues for diagnosis and therapy.
Tumour epigenetics is defined as heritable or
non-heritable alterations that affect gene expression and genome
stability through inappropriate regulation of the local chromatin
structure; the mechanisms primarily include DNA methylation,
histone acetylation and the action of non-coding RNAs (6). According to certain studies, epigenetic
modification may be involved in the earliest phases of
tumourigenesis and tumour promotion (7,8).
Aberrant DNA methylation, the most widely investigated aspect of
cancer epigenetics, mainly includes the gain in methylation of
tumour suppressor genes and loss of methylation of oncogenes, which
has an important role in the regulation of gene expression and
various biological functions (9).
Multiple studies have demonstrated that certain genes with altered
DNA methylation and gene expression, e.g. the O-6-methylguanine-DNA
methyltransferase gene, promote the development of GBM (10,11).
However, the comprehensive profiles, pathways and interaction
networks associated with these aberrantly methylated genes in GBM
remain largely elusive. In addition, previous studies performed
analyses of independent databases containing data from individual
investigations, and the false-positive rates make it difficult to
identify reliable results. Combined analysis of multiple gene
expression and methylation profiles may provide more meaningful and
credible results.
Gene expression microarray and transcriptome
sequencing have been used to detect thousands of genes
simultaneously, and are commonly used to identify differentially
expressed genes (DEGs) and gene alterations (12,13). For
the gene expression microarray, the detected hybrid signal has a
good linear correlation with the abundance of the target sequence.
In addition, microarrays have high sensitivity for short sequences,
which is suitable for identifying biomarkers for the diagnosis of
diseases or associated predictions (14). In addition, the public database Gene
Expression Omnibus (GEO) contains extensive genetic information and
serves as a repository for microarray data retrieval and
deposition. Thus, in the present study, a combined analysis of
multiple datasets from the GEO and further databases was performed
to increase the reliability of the results.
In the present study, a Bioinformatics analysis was
performed to uncover aberrantly methylated DEGs (AMDEGs) in GBM.
Based on the combined analysis of multiple microarray datasets in
GEO, a number of reliable biomarkers were identified. In addition,
the present study focused on revealing the functional terms and
pathways through enrichment analysis and aimed to filter hub genes,
which may serve as important diagnostic markers. Eventually,
several genes with a stable impact on prognosis with a threshold of
P<0.001 were screened in order to provide a set of useful
therapeutic targets for future research. Finally, the potential
genes worthy of further study were validated in another independent
database, The Cancer Genome Atlas (TCGA).
Materials and methods
Microarray data retrieval and
processing
The keywords ‘GBM’ and ‘gene expression’ or ‘GBM’
and ‘methylation’ were used to search the GEO database (https://www.ncbi.nlm.nih.gov/geo/) (15,16).
Finally, two gene expression profiling datasets (accession no.,
GSE16011 and GSE50161) and one methylation profiling dataset
(accession no., GSE50923) were selected according to the following
inclusion criteria: Gene expression detected using the Affymetrix
Human Genome U133 Plus 2.0 Array; methylation expression detected
using Illumina Methylation27 platform and sample number of tumours
or controls >5. Of the dataset GSE16011 deposited by Gravendeel
et al (17), only 167
samples, including 8 control brain tissues and 159 GBM tissues,
were included. Of the dataset GSE50161 deposited by Griesinger
et al (18), only 47 samples
comprising 34 GBM tumours and 13 control brain tissues were
incorporated. The dataset GSE50923 deposited by Lai et al
(19) was based on the platform
GPL8490 and included 54 GBM samples and 24 control brain tissues.
The details for these datasets are provided in Table I. The online interactive tool GEO2R
(https://www.ncbi.nlm.nih.gov/geo/geo2r/), an R-based
web tool, was used to filter DEGs or differentially methylated
genes (DMGs) by comparing GBM and normal brain tissue samples
separately in each dataset, as reported by Sang et al
(13). As the threshold for
differential expression, |fold change (FC)|>2 and P<0.05 were
set, and a |log2FC|>0.1 and P<0.05 were used as the criteria
for identification of DMGs. The ‘MATCH’ function was applied to
identify overlapping DEGs between GSE16011 and GSE50161. These
overlapping DEGs were then intersected with the DMGs to obtain
genes affected by altered DNA methylation status. Overall, 450
AMDEGs were identified, of which 199 were hypermethylated and
downregulated genes (Hyper-DGs) and 251 were hypomethylated and
upregulated genes (Hypo-UGs) in GBM. A flow diagram depicting the
study design is provided in Fig.
1.
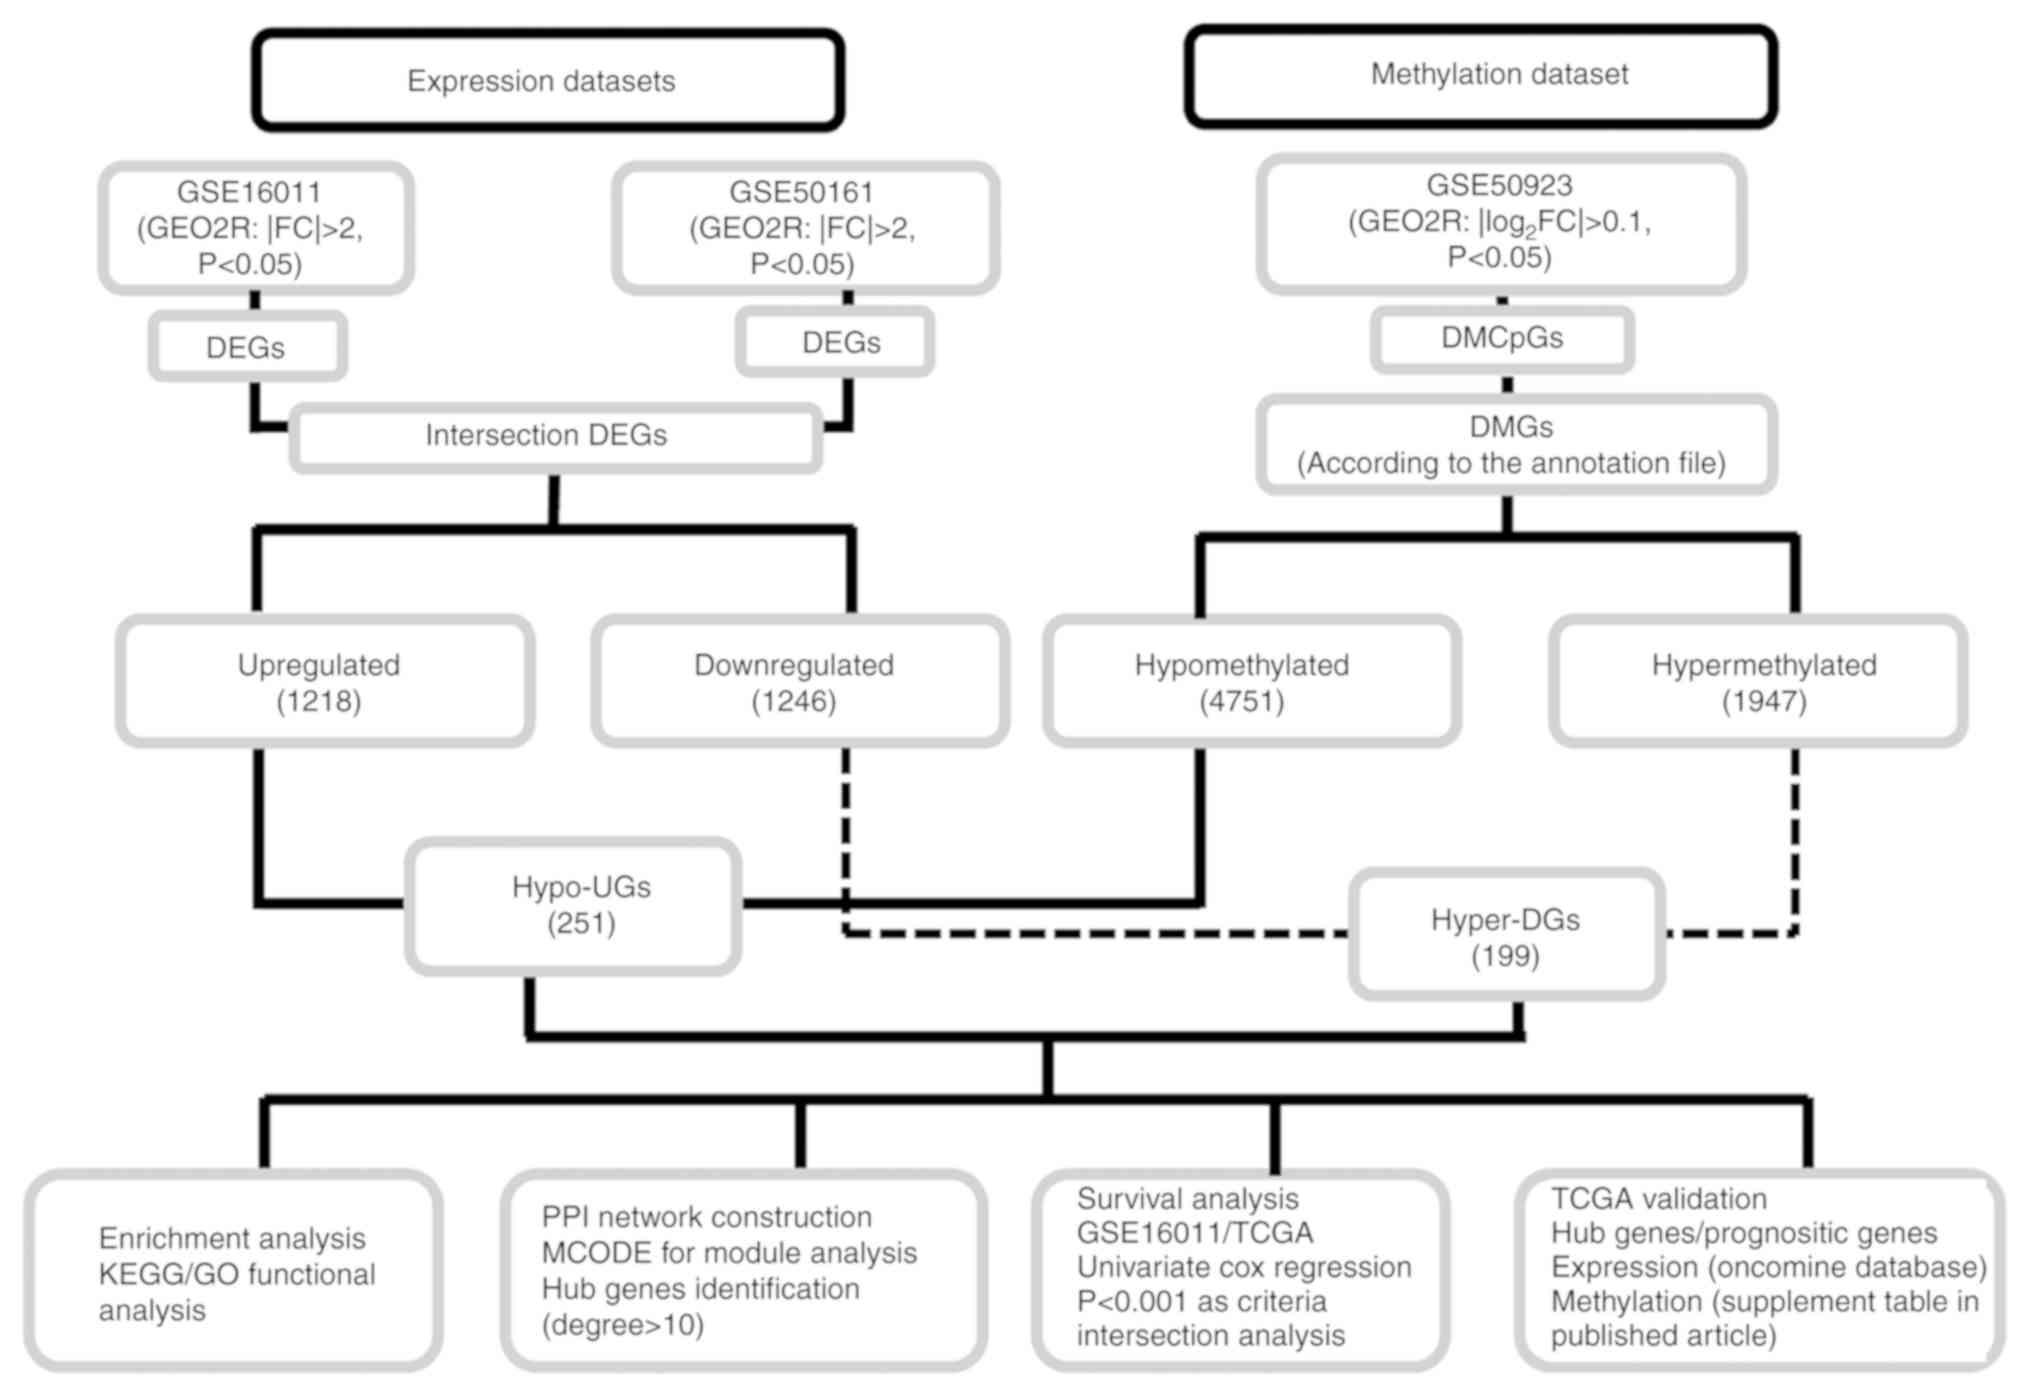 | Figure 1.Flow chart depicting the design of
the present study. DEGs, differentially expressed genes; DMCpGs,
differentially methylated CpG sites; DMGs, differentially
methylated genes; Hyper-DGs, hypermethylated and downregulated
genes; Hypo-UGs, hypomethylated and upregulated genes; FC, fold
change; PPI, protein-protein interaction; GO, gene ontology; KEGG,
Kyoto Encyclopedia of Genes and Genomes; TCGA, The Cancer Genome
Atlas. |
 | Table I.Details of the datasets used in the
present study. |
Table I.
Details of the datasets used in the
present study.
| Dataset | Sample | Array | Platform | Tumour | Normal | Detail |
|---|
| GSE16011 | GBM | mRNA | GPL8542 | 159 | 8 | Affymetrix GeneChip
Human Genome U133 Plus 2.0 Array |
| GSE50161 | GBM | mRNA | GPL570 | 34 | 13 | Affymetrix Human
Genome U133 Plus 2.0 Array |
| GSE50923 | GBM | Methylation | GPL8490 | 54 | 24 | Illumina
HumanMethylation27 BeadChip |
| TCGA
(Oncomine) | GBM | mRNA | AffyU133a | 542 | 10 | Affymetrix HT Human
Genome U133a |
| TCGAa | GBM | Methylation | Methylation27k | 163 | 140
(GEO)b | Illumina
Methylation27 platform |
Gene Ontology (GO) and Kyoto
Encyclopedia of Genes and Genomes (KEGG) pathway enrichment
analyses
The Database for Annotation, Visualization and
Integrated Discovery (DAVID; version 6.8; http://david.ncifcrf.gov/) (20), a web-based online comprehensive
functional annotation tool, was used to perform the GO and KEGG
pathway enrichment analyses on the screened Hyper-DGs and Hypo-UGs
(Fig. 1; enrichment analysis
module). GO functional enrichment analysis was performed in the
categories biological process (BP), cellular component (CC) and
molecular function (MF). All 199 Hyper-DGs and 251 Hypo-UGs genes
were uploaded separately for exploration with the default settings,
and only those enriched terms with >5 gene hits and P<0.05
were regarded as significant.
Generation of protein-protein
interaction (PPI) networks and module analysis
To predict the functional and physical protein
interactions, the PPI networks of the AMDEGs identified were
predicted and constructed using the Search Tool for the Retrieval
of Interacting Genes/Proteins (STRING; version 10.5; http://string-db.org/) under the default settings (PPI
network construction module; Fig.
1), which integrates a variety of predicted and experimentally
validated interactions of proteins (21). Nodes lacking a connection in the
network were excluded. The PPI networks were then further analysed
with the plug-in Molecular Complex Detection (MCODE) clustering
tool in Cytoscape software version 3.4.0 (http://www.cytoscape.org/) (22) to screen significant modules with
default settings. A MCODE score >4 and number of nodes >5
were the criteria used to define a significant module. Genes in the
module with a degree centrality >10 were considered hub genes.
Module enrichment analysis was then performed with STRING.
Analysis of the effect of the AMDEGs
on overall survival (OS)
Prognostic assessments for AMDEGs as continuous
variables were performed separately for the GSE16011 dataset and
the TCGA GBM validation dataset using univariate Cox proportional
hazard regression (survival analysis module; Fig. 1). The hazard ratio (HR) was
calculated and displayed. P<0.001 was considered to indicate
statistical significance. Clinical and gene expression data of
GSE16011 used in the present study were obtained from the official
GEO website (https://www.ncbi.nlm.nih.gov/geo/) and the relevant
study (17). Normalized mRNA array
data and phenotype files of TCGA data on GBM were downloaded from
the University of California Santa Cruz (UCSC) Xena browser
(https://genome-cancer.ucsc.edu)
(23). Samples were divided into two
groups based on the median expression value of specific genes. The
Kaplan-Meier analysis and the log-rank test were utilized to
predict the effect of high or low levels of certain genes on
survival. All analyses and plots were performed with the R software
(version 3.4.4; http://www.R-project.org/) using the packages
‘survival’ and ‘ggplot2’.
Verification of the expression and
methylation levels of hub genes and prognostic genes
The expression and methylation levels of hub genes
and prognostic genes were then validated in TCGA database to
confirm the validity (TCGA validation module; Fig. 1). First, the expression levels of
these hub genes and prognosis-associated genes were explored using
TCGA GBM U133 array dataset in the Oncomine database (https://www.oncomine.org). The DMGs between normal
tissue and GBM in the TCGA GBM datasets were obtained from a
previous study (19). The median
methylation level (β-values) of specific CpG sites in normal brain
tissue and tumour tissue, median β differences between normal
tissue and tumour tissue, and P-values (computed by a
non-parametric Wilcoxon Rank-Sum test) were available from the
supplementary materials of the published study (19). The details of the TCGA GBM gene
expression dataset and methylation dataset are presented in
Table I.
Results
Identification of DMGs and DEGs in
GBM
The flowchart depicting the design of the present
study is provided in Fig. 1. To
characterize the AMDEGs in GBM, two expression profile datasets
(GSE16011 and GSE50161) and one methylation profile (GSE50923) from
the GEO database were analysed. A total of 1,218 overlapping
upregulated genes (1,574 in GSE16011 and 2,854 in GSE50161) and
1,246 overlapping downregulated genes (1,494 in GSE16011 and 2,518
in GSE50161) were identified. In terms of differentially methylated
CpG sites from the methylation array data (GSE50923), 1,947
hypermethylated CpG sites and 4,751 hypomethylated CpG sites were
identified. A total of 199 Hyper-DGs and 251 Hypo-UGs were then
categorized by comparing the 2,464 DEGs with the 6,698 DECpGs. The
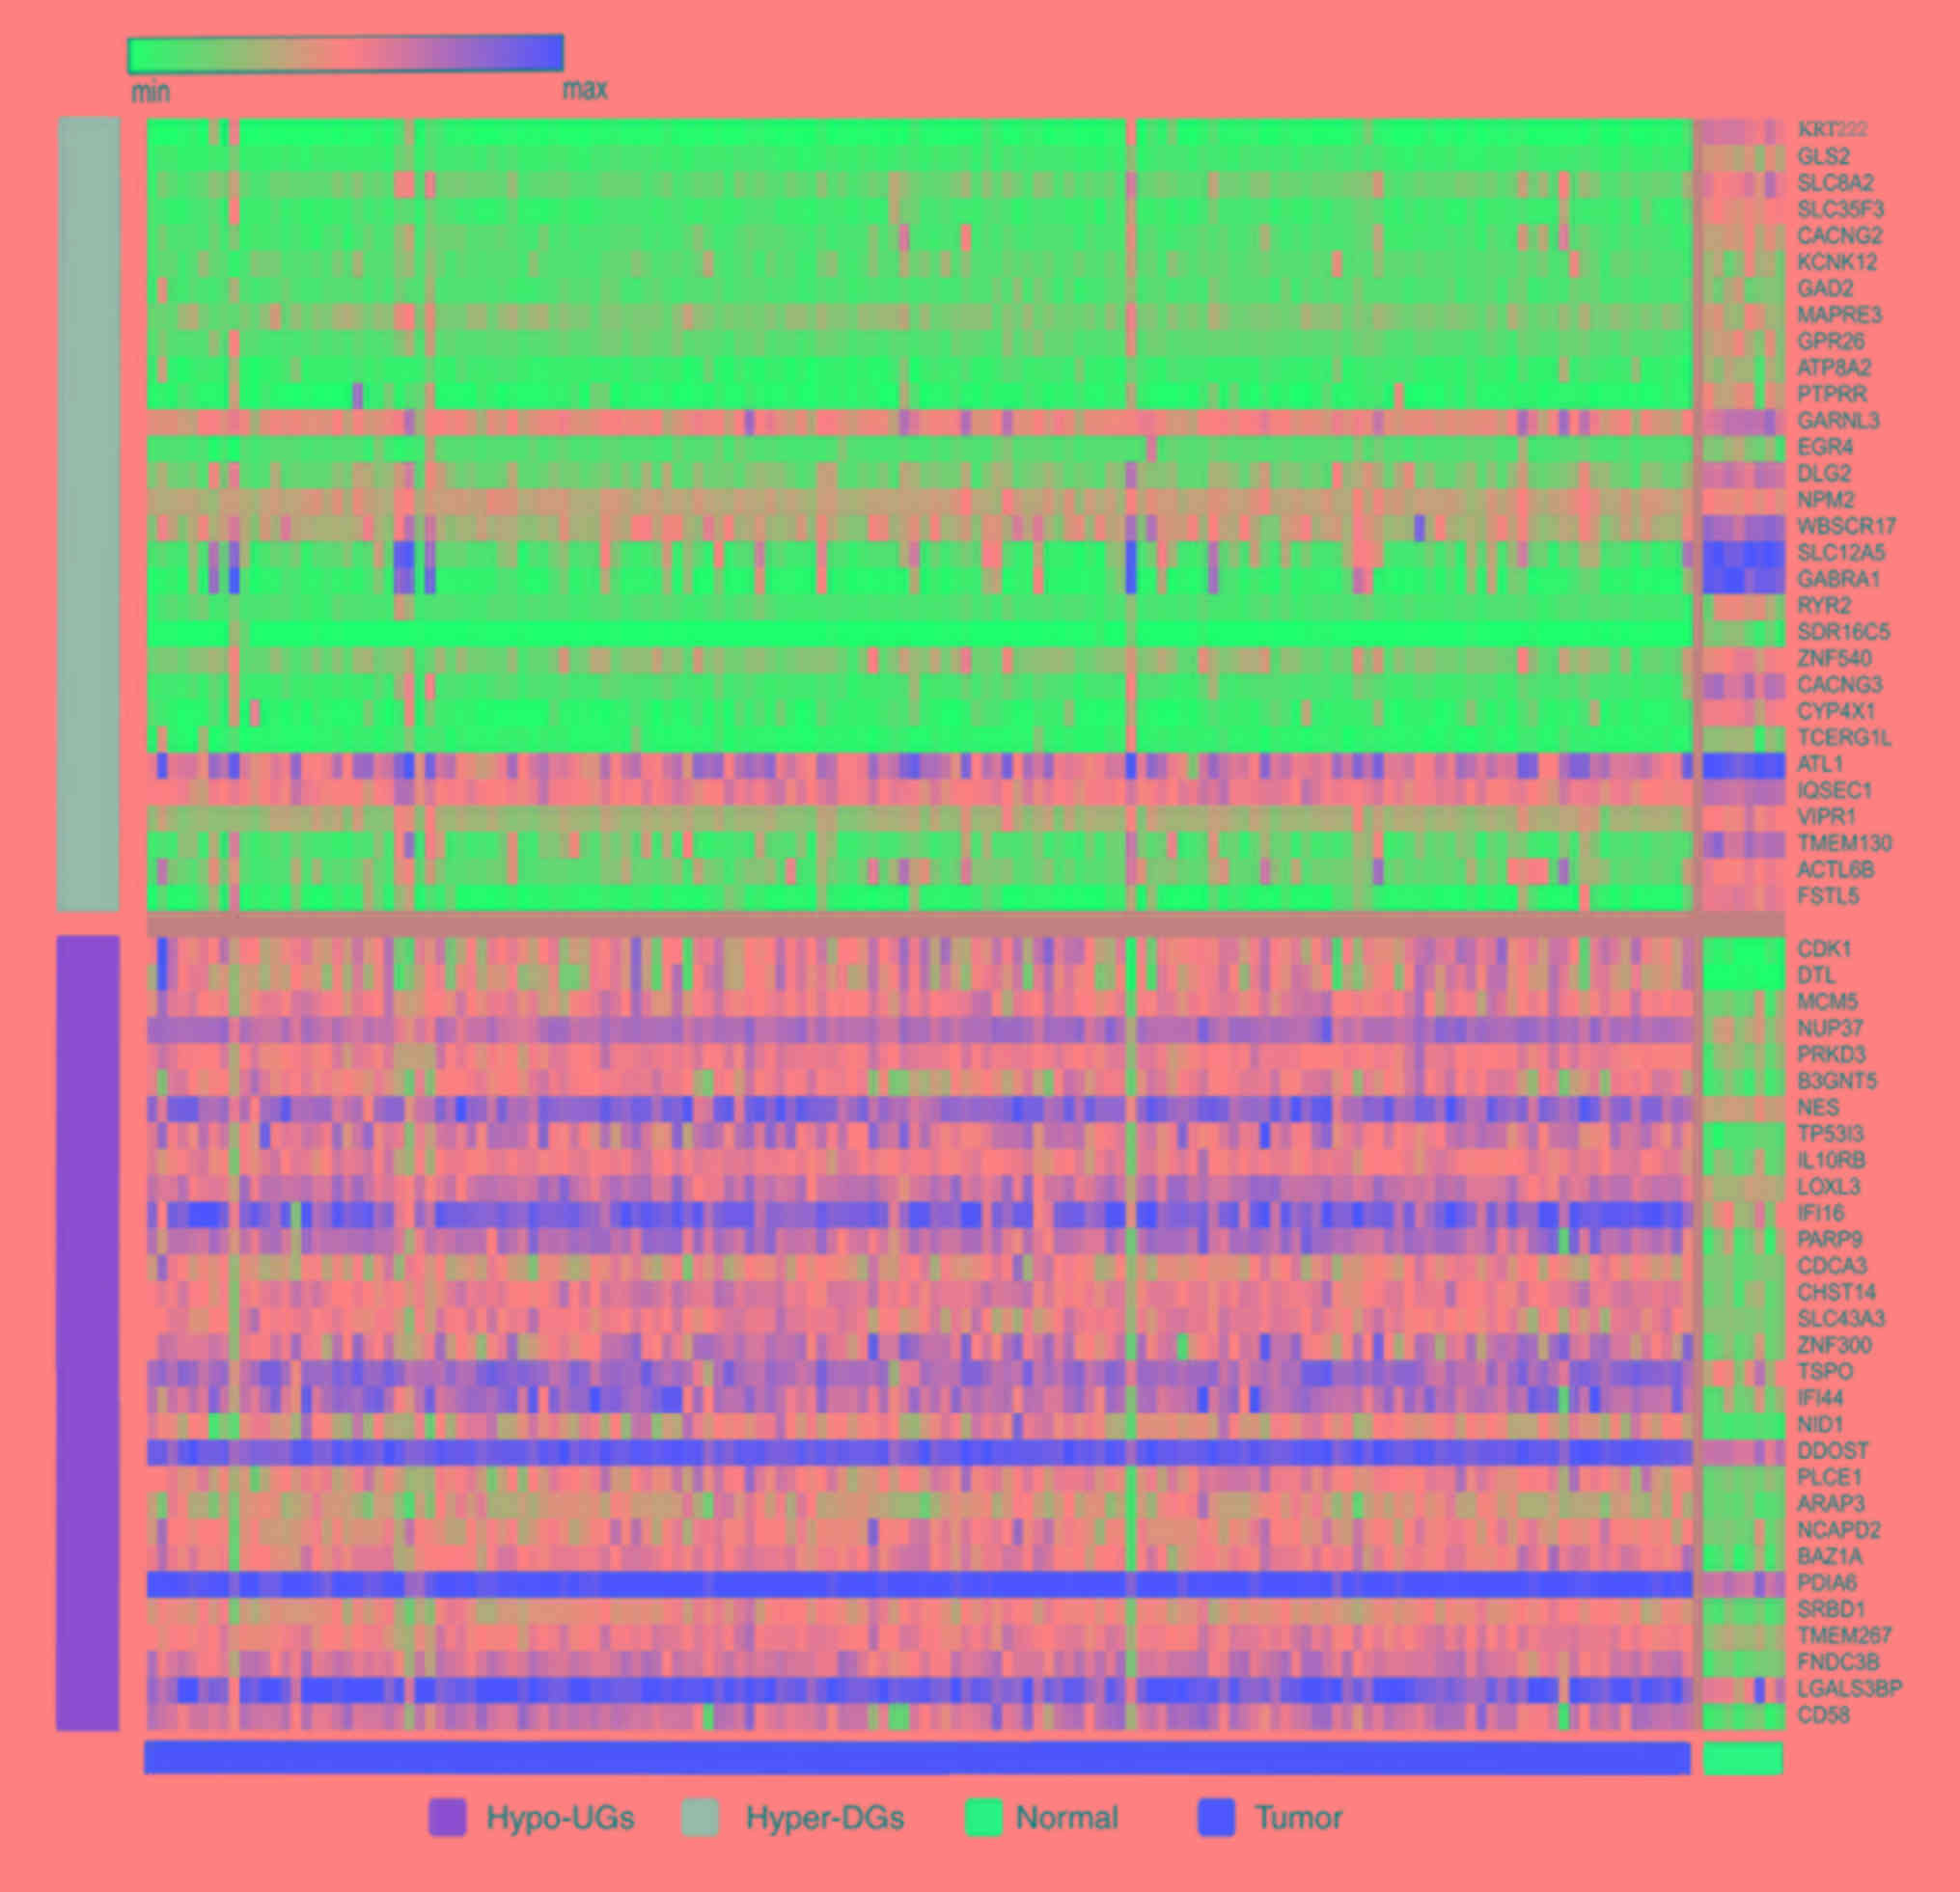
representative heatmap depicting the expression differences of
AMDEGs between normal tissue and tumour tissue in GSE16011 is
provided in Fig. 2. For Hypo-UGs,
the expression of GBM was higher than in normal tissues. For
Hyper-DGs, the expression of GBM was lower than in normal tissues.
The 450 AMDEGs identified are provided in Table SI.
GO and KEGG pathway enrichment
analysis
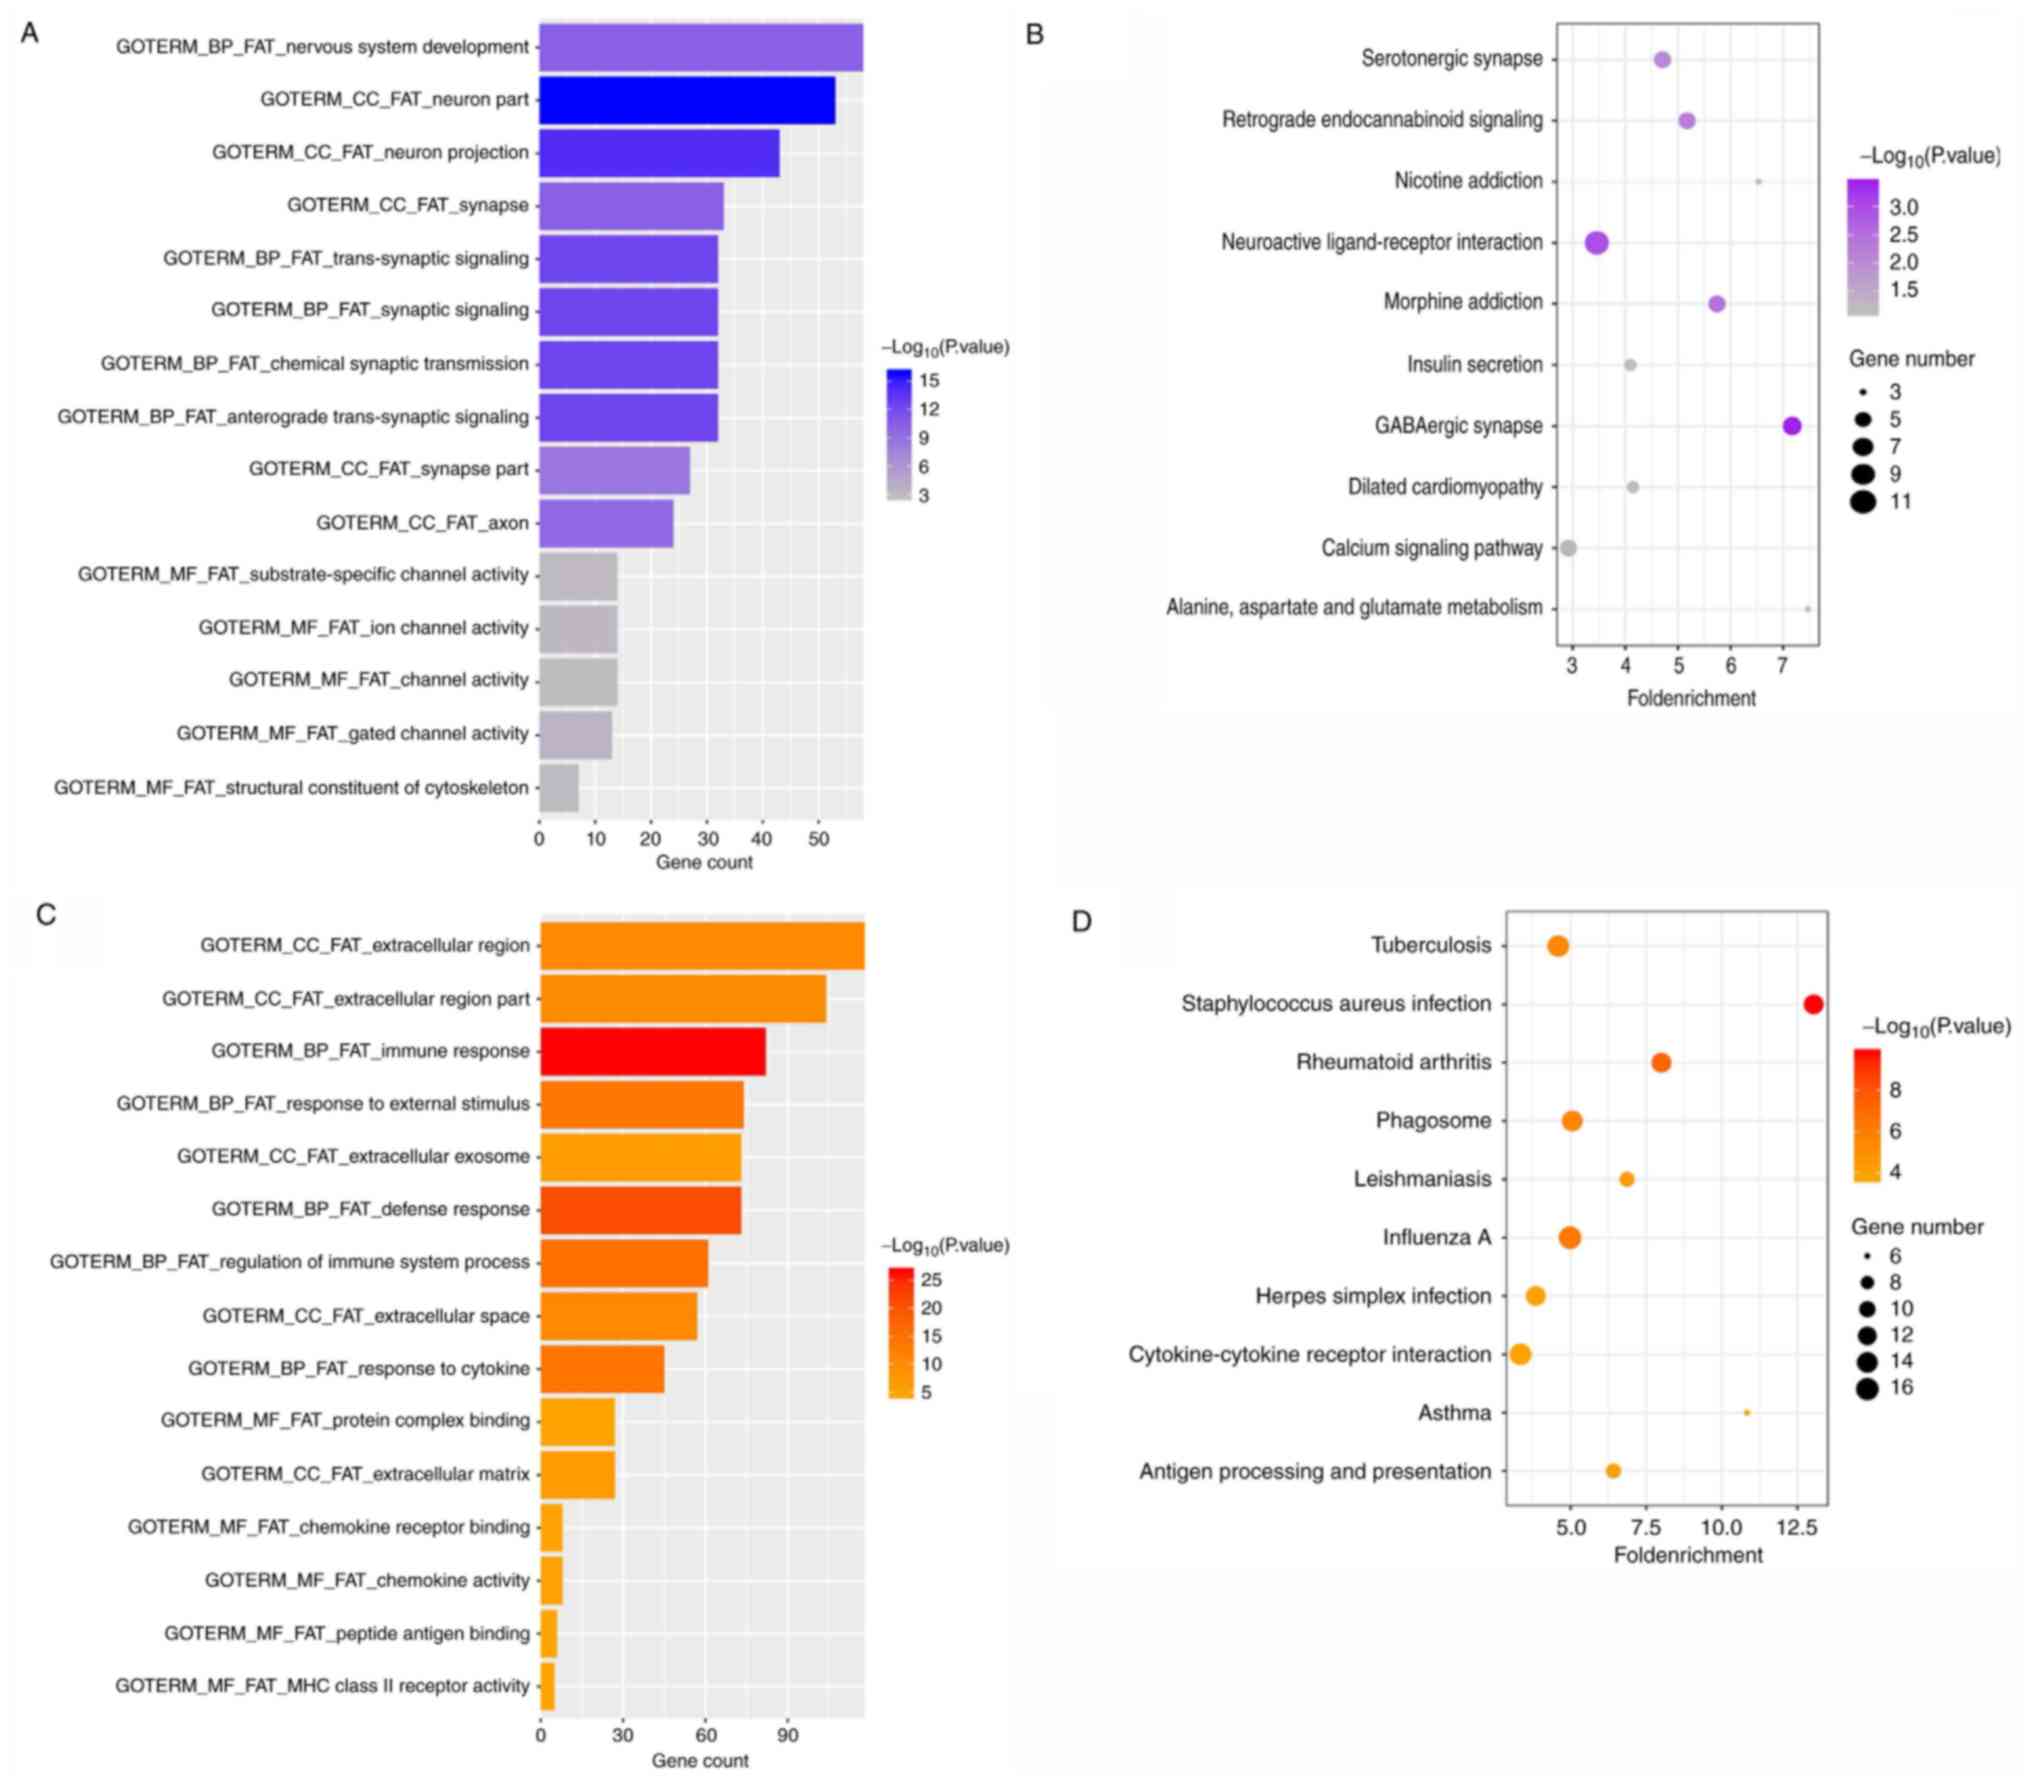
The significant KEGG pathways and GO terms in the
enrichment analysis performed with DAVID are illustrated in
Table II and Fig. 3. Hyper-DGs were mainly enriched in
the functional terms in the category BP of anterograde
trans-synaptic signalling, synaptic signalling, chemical synaptic
transmission, trans-synaptic signalling and nervous system
development. In the category MF, these genes exhibited enrichment
in the terms gated channel activity, ion channel activity,
substrate-specific channel activity, structural constituent of
cytoskeleton and channel activity. Furthermore, in the category CC,
enrichment was predominantly in the neuron part, neuron projection,
synapse, axon and synapse part (Fig.
3A). KEGG pathway analysis of Hyper-DGs indicated that these
genes were significantly enriched in GABAergic synapses,
neuroactive ligand-receptor interactions, morphine addiction,
retrograde endocannabinoid signalling and serotonergic synapses
(Fig. 3B).
| Table II.GO and KEGG pathway enrichment
analysis of aberrantly methylated differentially expressed
genes. |
Table II.
GO and KEGG pathway enrichment
analysis of aberrantly methylated differentially expressed
genes.
| Category | Term | Count (%) | P-value |
|---|
| GOTERM_BP_FAT | GO:0006955~immune
response | 82 (0.24) |
2.08×10⁻²⁷ |
| GOTERM_BP_FAT | GO:0006952~defense
response | 73 (0.21) |
1.25×10⁻²¹ |
| GOTERM_BP_FAT |
GO:0002682~regulation of immune system
process | 61 (0.18) |
5.18×10⁻¹⁶ |
| GOTERM_BP_FAT | GO:0034097~response
to cytokine | 45 (0.13) |
3.18×10⁻¹⁵ |
| GOTERM_BP_FAT | GO:0009605~response
to external stimulus | 74 (0.21) |
1.20×10⁻¹⁴ |
| GOTERM_MF_FAT |
GO:0008009~chemokine activity | 8 (0.02) |
4.32×10⁻⁶ |
| GOTERM_MF_FAT | GO:0032403~protein
complex binding | 27 (0.08) |
1.82×10⁻⁵ |
| GOTERM_MF_FAT |
GO:0042379~chemokine receptor binding | 8 (0.02) |
2.37×10⁻⁵ |
| GOTERM_MF_FAT | GO:0042605~peptide
antigen binding | 6 (0.02) |
3.50×10⁻⁵ |
| GOTERM_MF_FAT | GO:0032395~MHC
class II receptor activity | 5 (0.01) |
4.15×10⁻⁵ |
| GOTERM_CC_FAT |
GO:0005615~extracellular space | 57 (0.17) |
2.26×10⁻¹¹ |
| GOTERM_CC_FAT |
GO:0005576~extracellular region | 118 (0.34) |
3.30×10⁻¹¹ |
| GOTERM_CC_FAT |
GO:0044421~extracellular region part | 104 (0.30) |
9.56×10⁻¹¹ |
| GOTERM_CC_FAT |
GO:0031012~extracellular matrix | 27 (0.08) |
1.30×10⁻⁷ |
| GOTERM_CC_FAT |
GO:0070062~extracellular exosome | 73 (0.21) |
1.51×10⁻⁶ |
| KEGG_PATHWAY |
hsa05150:Staphylococcus aureus
infection | 13 (0.04) |
1.50×10⁻¹⁰ |
| KEGG_PATHWAY | hsa05323:Rheumatoid
arthritis | 13 (0.04) |
5.32×10⁻⁸ |
| KEGG_PATHWAY | hsa05164:Influenza
A | 16 (0.05) |
5.42×10⁻⁷ |
| KEGG_PATHWAY |
hsa04145:Phagosome | 14 (0.04) |
3.07×10⁻⁶ |
| KEGG_PATHWAY |
hsa05152:Tuberculosis | 15 (0.04) |
3.72×10⁻⁶ |
|
|
Category | Term | Count
(%) | P-value |
|
| GOTERM_BP_FAT |
GO:0098916~anterograde trans-synaptic
signaling | 32 (0.10) |
3.62×10⁻¹³ |
| GOTERM_BP_FAT | GO:0099536~synaptic
signaling | 32 (0.10) |
3.62×10⁻¹³ |
| GOTERM_BP_FAT | GO:0007268~chemical
synaptic transmission | 32 (0.10) |
3.62×10⁻¹³ |
| GOTERM_BP_FAT |
GO:0099537~trans-synaptic signaling | 32 (0.10) |
3.62×10⁻¹³ |
| GOTERM_BP_FAT | GO:0007399~nervous
system development | 58 (0.19) |
4.32×10⁻¹¹ |
| GOTERM_MF_FAT | GO:0022836~gated
channel activity | 13 (0.04) |
2.61×10⁻⁴ |
| GOTERM_MF_FAT | GO:0005216~ion
channel activity | 14 (0.05) |
7.37×10⁻⁴ |
| GOTERM_MF_FAT |
GO:0022838~substrate-specific channel
activity | 14 (0.05) |
1.03×10⁻³ |
| GOTERM_MF_FAT |
GO:0005200~structural constituent of
cytoskeleton | 7 (0.02) |
1.19×10⁻³ |
| GOTERM_MF_FAT | GO:0015267~channel
activity | 14 (0.05) |
1.95×10⁻³ |
| GOTERM_CC_FAT | GO:0097458~neuron
part | 53 (0.17) |
1.18×10⁻¹⁶ |
| GOTERM_CC_FAT | GO:0043005~neuron
projection | 43 (0.14) |
7.03×10⁻¹⁵ |
| GOTERM_CC_FAT |
GO:0045202~synapse | 33 (0.11) |
4.11×10⁻¹¹ |
| GOTERM_CC_FAT |
GO:0030424~axon | 24 (0.08) |
2.18×10⁻¹⁰ |
| GOTERM_CC_FAT | GO:0044456~synapse
part | 27 (0.09) |
2.87×10⁻⁹ |
| KEGG_PATHWAY | hsa04727:GABAergic
synapse | 7 (0.02) |
3.76×10⁻⁴ |
| KEGG_PATHWAY |
hsa04080:Neuroactive ligand-receptor
interaction | 11 (0.04) |
1.06×10⁻³ |
| KEGG_PATHWAY | hsa05032:Morphine
addiction | 6 (0.02) |
3.58×10⁻³ |
| KEGG_PATHWAY | hsa04723:Retrograde
endocannabinoid signaling | 6 (0.02) |
5.59×10⁻³ |
| KEGG_PATHWAY |
hsa04726:Serotonergic synapse | 6 (0.02) |
8.29×10⁻³ |
Among the Hypo-UGs, the most significantly enriched
terms in the category BP included immune response, defence
response, regulation of immune system process, response to cytokine
and response to external stimulus. In the category MF, these genes
were accumulated in the terms chemokine activity, protein complex
binding, chemokine receptor binding, peptide antigen binding and
major histocompatibility complex class II receptor activity. In
addition, in the category CC, the Hypo-UGs were enriched in the
terms extracellular space, extracellular region, extracellular
matrix and extracellular exosomes (Fig.
3C). These results indicated that Hypo-UGs may have a critical
role in the tumour immune microenvironment of GBM. In addition,
KEGG pathway analysis indicated enrichment in Staphylococcus
aureus infection, rheumatoid arthritis, influenza A, phagosome
and tuberculosis pathways (Fig.
3D).
PPI network construction, module
analysis and selection of hub genes
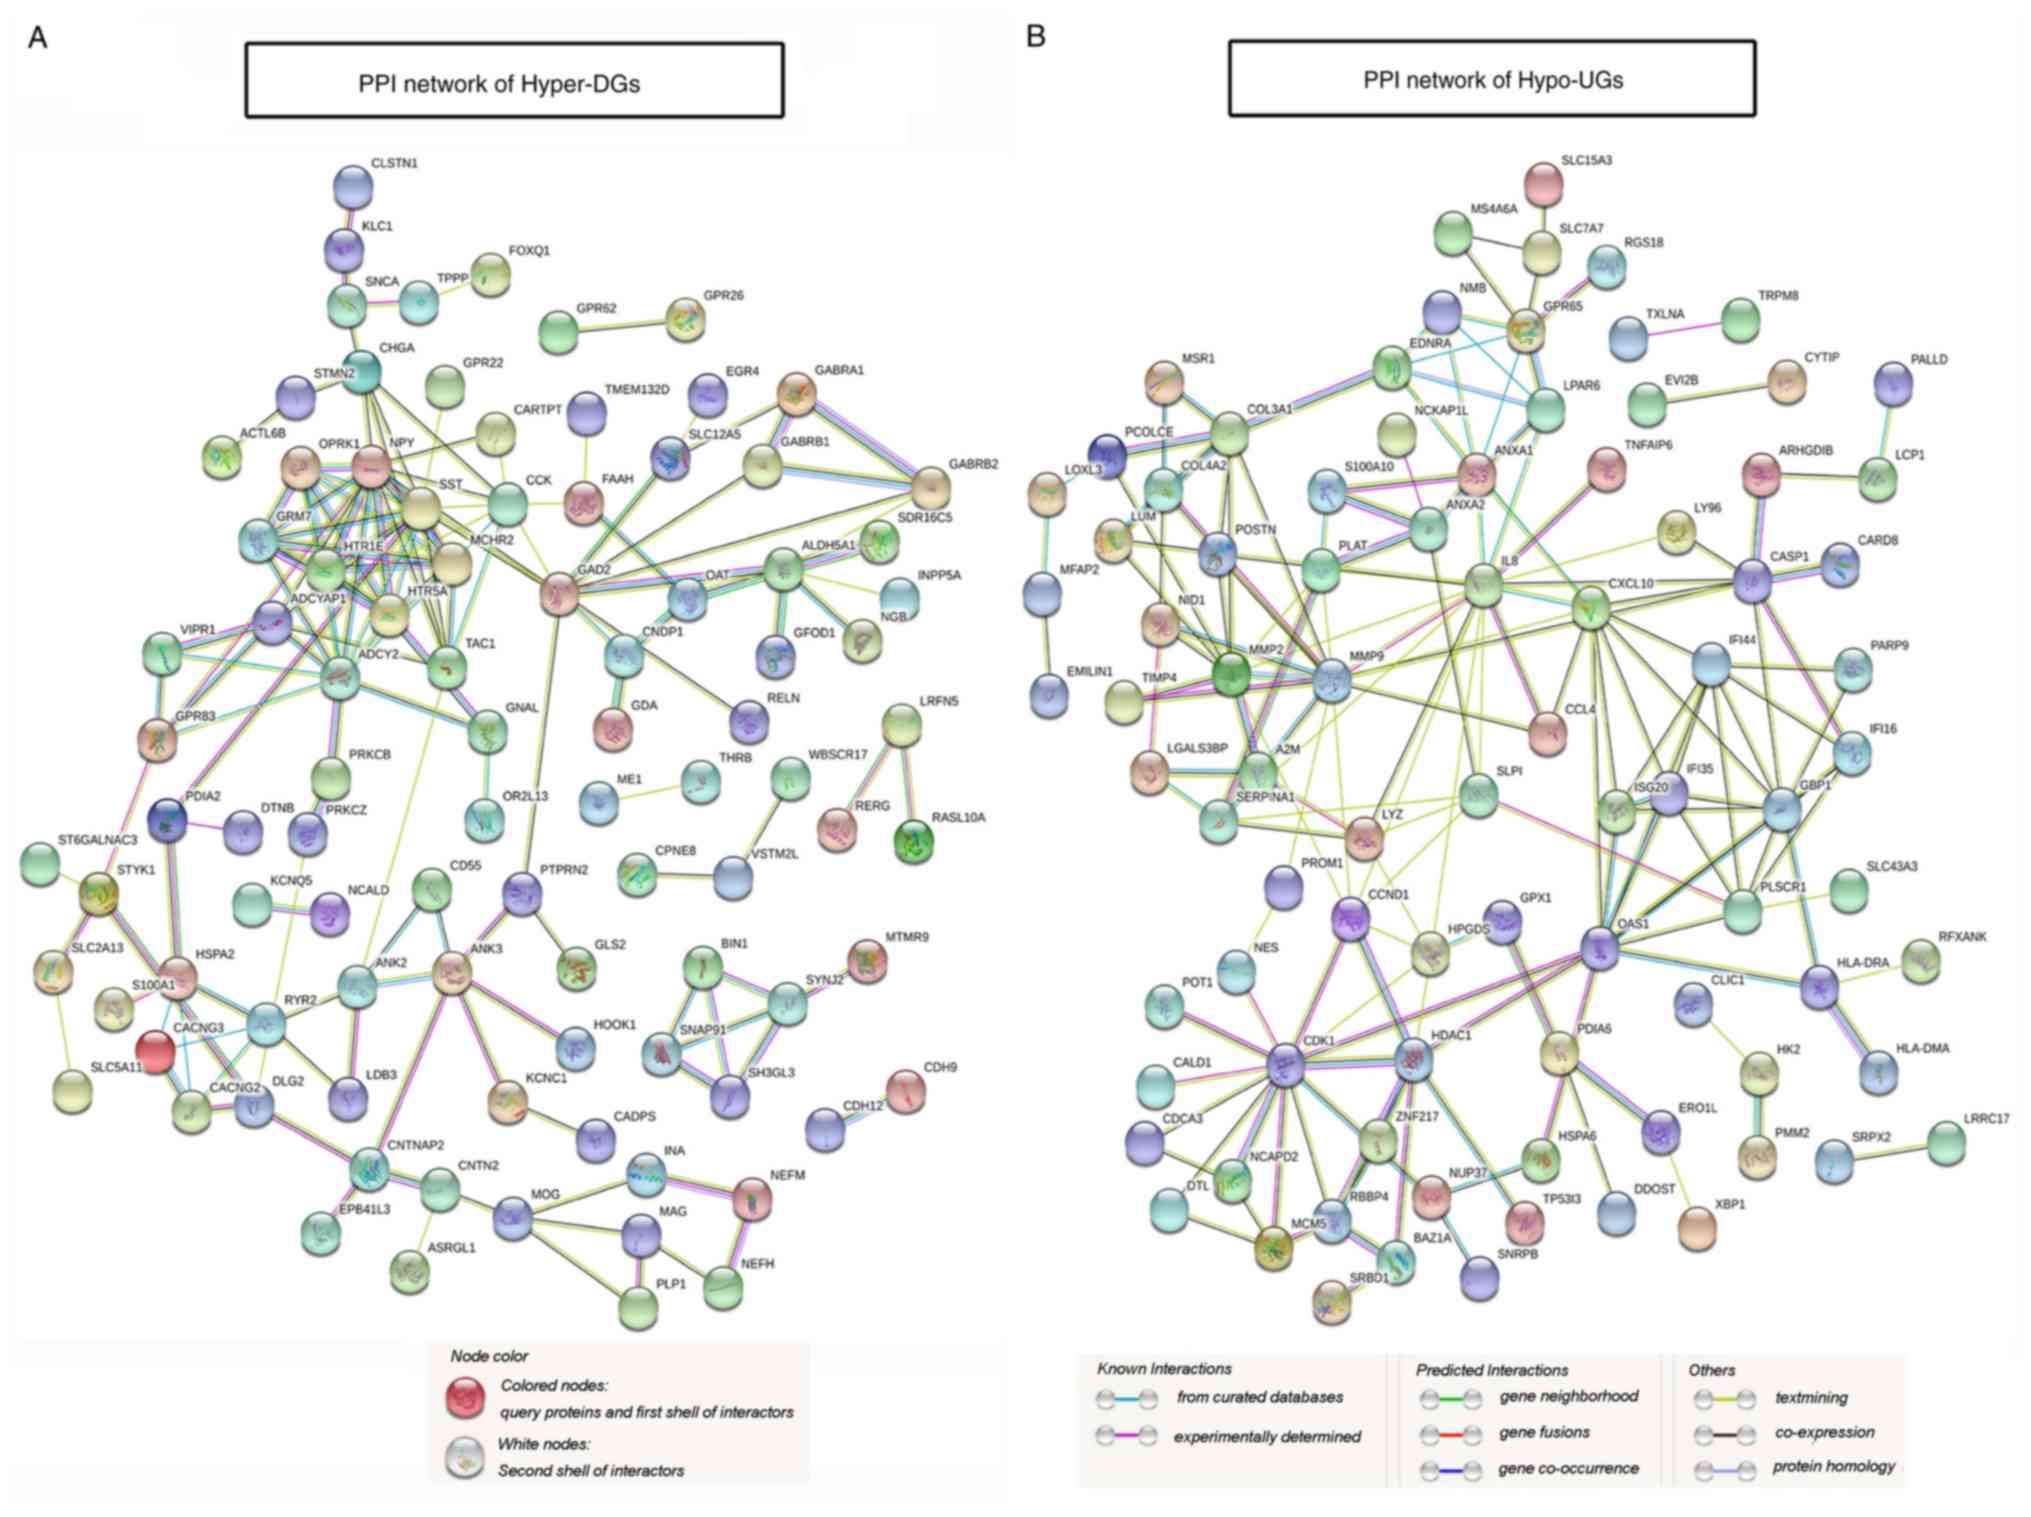
PPI network construction based on identification of
protein functions and interactions may help screen local protein
interaction networks with specific functions and selection of hub
genes with highly connected nodes or edges. For Hyper-DGs, the PPI
network, which includes 94 connected nodes and 148 edges, is
presented in Fig. 4A. The PPI
network of Hypo-UGs, which included 87 connected nodes and 168
edges, is illustrated in Fig. 4B,
The only significant module for Hyper-DGs containing 8 nodes and 28
edges, which is linked to G-protein-coupled receptor signalling
pathways and neuroactive ligand-receptor interactions, is provided
in Fig. 5A. The hub genes of
Hyper-DGs identified included somatostatin (SST), neuropeptide Y
and adenylate cyclase 2 with 14, 14 and 12 degrees of connectivity,
respectively. The most significant module for Hypo-UGs containing
12 nodes and 30 edges is presented in Fig. 5B. Significant vital modules exhibited
functions in several signalling pathways, including response to
virus, response to cytokine and cytokine-mediated signalling
pathways. The significant hub genes of Hypo-UGs mainly included
interleukin (IL)-8, matrix metalloproteinase (MMP)-9,
cyclin-dependent kinase (CDK) 1, 2′-5′-oligoadenylate synthetase 1
(OAS1), C-X-C motif chemokine ligand 10 and MMP2 with 16, 14, 13,
11, 11, 11 and 10 degrees of connectivity, respectively. These
screened hub genes and modules may have important roles in the
occurrence and development of GBM.
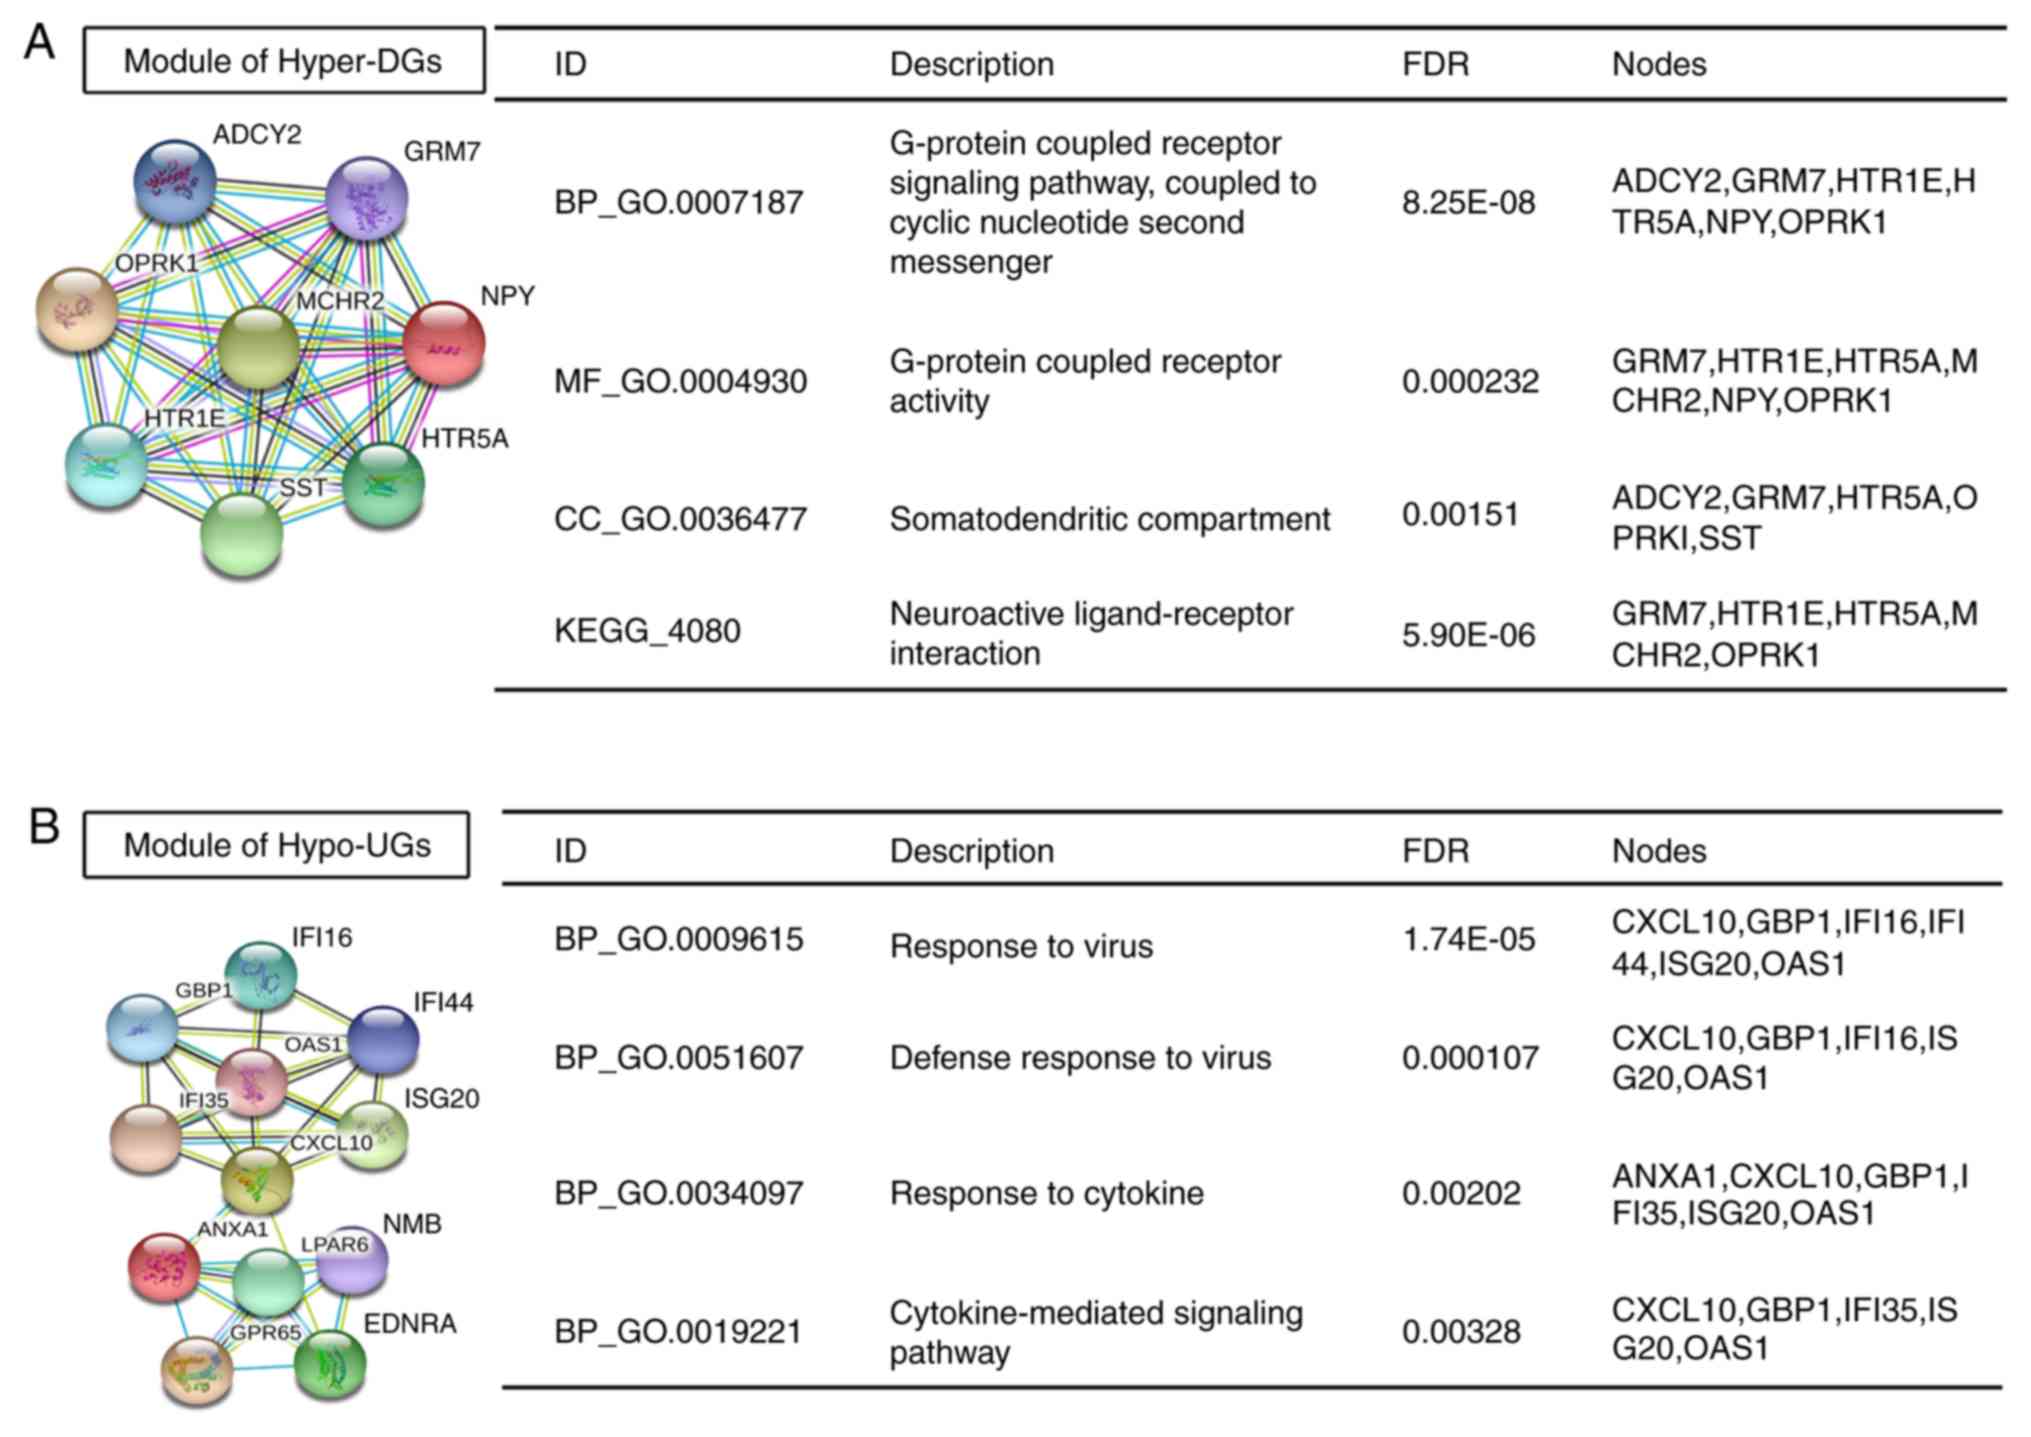 | Figure 5.Significant modules in the
protein-protein interaction network and enrichment results. (A and
B) Significant modules and associated enriched GO terms and KEGG
pathways among (A) Hyper-DGs and (B) Hypo-UGs. ADCY2, adenylate
cyclase 2; GRM7, glutamate metabotropic receptor 7; OPRK1, opioid
receptor kappa 1; MCHR2, melanin concentrating hormone receptor 2;
NPY, neuropeptide Y; HTR1E, 5-hydroxytryptamine receptor 1E, HTR5A,
5-hydroxytryptamine receptor 5A; SST, somatostatin; IFI16,
interferon gamma inducible protein 16; GBP1, guanylate binding
protein 1; IFI14, interferon induced protein 44; IFI35, interferon
induced protein 35; OAS1, 2′-5′-oligoadenylate synthetase 1; ISG20,
interferon stimulated exonuclease gene 20; CXCL10, C-X-C motif
chemokine ligand 10; ANXA1, annexin A1; LPAR6, lysophosphatidic
acid receptor 6; NMB, neuromedin B; GPR65, G protein-coupled
receptor 65; EDNRA, endothelin receptor type A; GO, gene ontology;
KEGG, Kyoto Encyclopedia of Genes and Genomes; Hyper-DGs,
hypermethylated and downregulated genes; Hypo-UGs, hypomethylated
and upregulated genes; CC, cellular component; BP, biological
process; MF, molecular function; FDR, false discovery rate. |
Survival analysis of AMDEGs
As presented in Table
III, univariate Cox regression analysis revealed that several
genes were significantly associated with OS in the GBM cohort from
the GSE16011 dataset. Comparison of these results with those for
the GBM cohort from TCGA revealed that C-type lectin domain
containing 5A (CLEC5A), epithelial membrane protein 3 (EMP3),
solute carrier family 43 member 3 (SLC43A3), STEAP3
metalloreductase, tumour necrosis factor α-induced protein 6
(TNFAIP6) and apolipoprotein B mRNA editing enzyme catalytic
subunit 3G (APOBEC3G) were significant genes that stably associated
with survival in the TCGA and GSE16011 cohorts of GBM patients.
Kaplan-Meier plots with the log-rank test P-values and HRs of these
prognosis-associated genes identified in the GBM cohorts from TCGA
and GSE16011 are provided in Fig. 6.
Compared with the low expression groups, high expression of STEAP3
(Fig. 6A), EMP3 (Fig. 6B), CLEC5A (Fig. 6C), SLC43A3 (Fig. 6D), APOBEC3G (Fig. 6E) and TNFAIP6 (Fig. 6F) indicated poor prognosis in the
TCGA GBM cohort and the GSE16011 cohort.
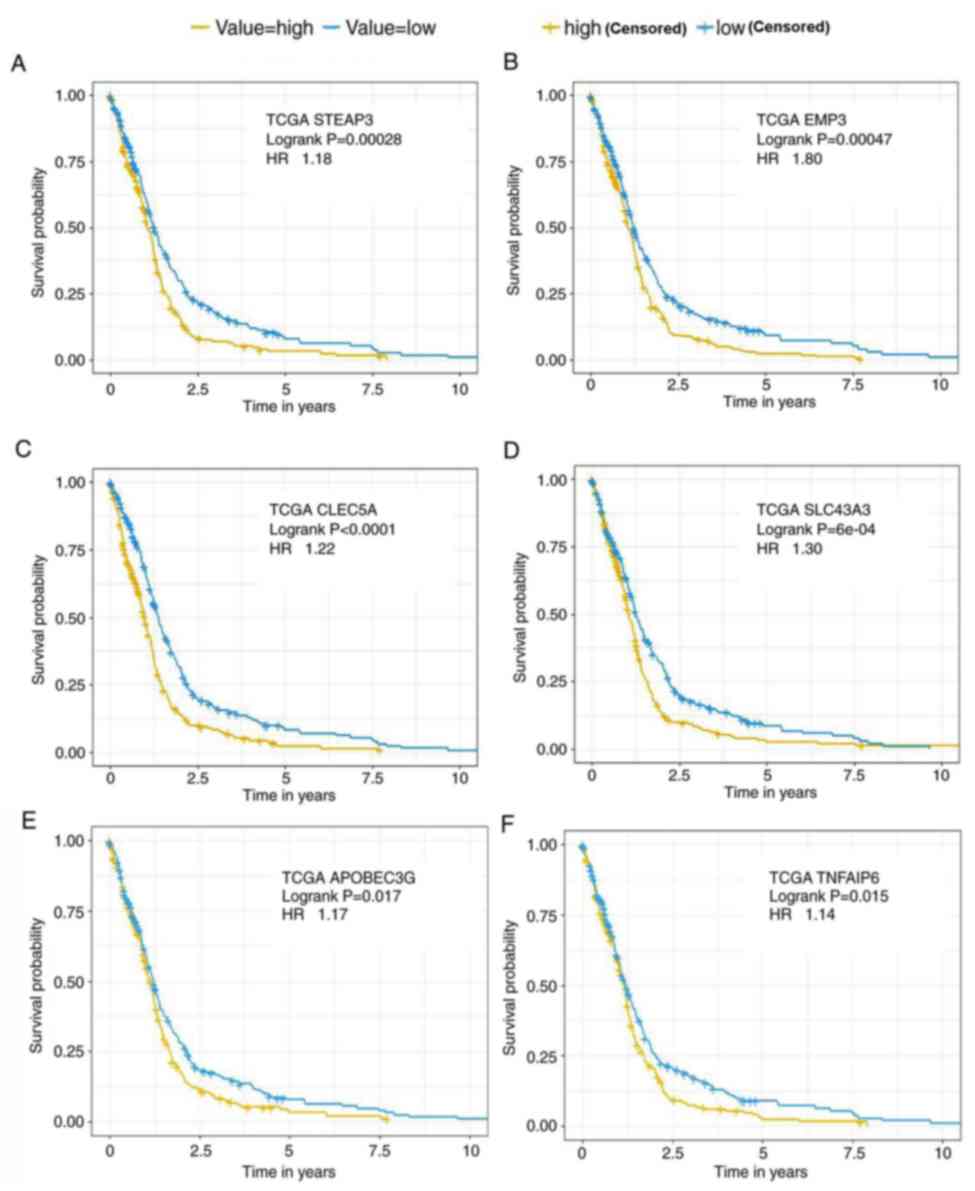 | Figure 6.Kaplan-Meier survival analysis.
Kaplan-Meier plots were generated to analyse the overall survival
of patients with different expression levels of (A) STEAP3, (B)
EMP3, (C) CLEC5A, (D) SLC43A3, (E) APOBEC3G and (F) TNFAIP6 in the
TCGA datasets and log-rank P-values were compared. The median
values of the expression of certain genes were used as the cut-offs
to define the high and low expression groups. HR, hazard ratio;
TCGA, The Cancer Genome Atlas; CLEC5A, C-type lectin domain
containing 5A; EMP3, epithelial membrane protein 3; SLC43A3, solute
carrier family 43 member 3; TNFAIP6, tumour necrosis factor
α-induced protein 6; APOBEC3G, apolipoprotein B mRNA editing enzyme
catalytic subunit 3G. |
| Table III.Significant genes according to the
univariate Cox survival analysis of differentially expressed genes
with altered methylation status in the GSE16011 cohort. |
Table III.
Significant genes according to the
univariate Cox survival analysis of differentially expressed genes
with altered methylation status in the GSE16011 cohort.
| A, Hypomethylated
and upregulated genes |
|---|
|
|---|
| Gene | HR | 95% CI | Z | P-value |
|---|
| CAPG | 1.44 | 0.20–0.54 | 4.22 |
2.40×10⁻⁵ |
| PTGFRN | 1.51 | 0.21–0.61 | 4.03 |
5.68×10⁻⁵ |
| STEAP3a | 1.32 | 0.14–0.42 | 4.02 |
5.92×10⁻⁵ |
| PHLDA1 | 0.68 | -(0.58–0.20) | −3.97 |
7.08×10⁻⁵ |
| EMP3a | 1.22 | 0.10–0.30 | 3.84 |
1.22×10⁻⁴ |
| CLEC5Aa | 1.25 | 0.11–0.34 | 3.83 |
1.26×10⁻⁴ |
| AQP1 | 1.19 | 0.08–0.27 | 3.70 |
2.14×10⁻⁴ |
| PLA2G2A | 1.12 | 0.06–0.18 | 3.69 |
2.25×10⁻⁴ |
|
SLC43A3a | 1.51 | 0.19–0.64 | 3.57 |
3.59×10⁻⁴ |
| GPX1 | 1.77 | 0.25–0.89 | 3.52 |
4.36×10⁻⁴ |
|
APOBEC3Ga | 1.35 | 0.13–0.47 | 3.44 |
5.76×10⁻⁴ |
|
TNFAIP6a | 1.22 | 0.08–0.32 | 3.37 |
7.61×10⁻⁴ |
| OLR1 | 1.25 | 0.09–0.36 | 3.33 |
8.76×10⁻⁴ |
| C1orf54 | 1.47 | 0.16–0.62 | 3.32 |
8.89×10⁻⁴ |
|
| B,
Hypermethylated and downregulated genes |
|
| Gene | HR | 95% CI | Z | P-value |
|
| GNAL | 0.64 | -(0.70–0.20) | −3.55 |
3.85×10⁻⁴ |
| ABCA5 | 1.30 | 0.11–0.42 | 3.43 |
6.14×10⁻⁴ |
Validation of hub and
prognosis-associated genes identified
To test the stability of the results, the expression
and methylation levels of hub genes and prognosis-associated genes
were further explored in the TCGA database for verification. As
presented in Table IV, the
expression levels of all of these genes concurred with the data
presented in Supplementary Table I.
The differences in the methylation levels of these genes, including
CDK1, MMP2 and TNFAIP6, between normal and tumour tissues did not
reach statistical significance in the TCGA cohort, which may be due
to the different standards used to identify DMGs, as mentioned in
the Methods section. In general, most of the data concurred with
those presented in Supplementary Table
I and the results of the present study are therefore reliable
and reproducible.
| Table IV.Validation of the expression and
methylation level of hub genes and prognosis-associated genes in
The Cancer Genome Atlas. |
Table IV.
Validation of the expression and
methylation level of hub genes and prognosis-associated genes in
The Cancer Genome Atlas.
| A, Hypomethylated
and upregulated genes |
|---|
|
|---|
| Gene | Expression
status | Fold change | P-value | Methylation
status | Delta β
(tumour-normal) | P-value |
|---|
| IL8 | Upregulated | 2.603 | 0.049 | Hypomethylated | −0.23191 |
1.50×10⁻¹⁵ |
| MMP9 | Upregulated | 3.065 |
6.65×10⁻¹¹ | Hypomethylated | −0.232866 |
7.10×10⁻¹³ |
| CDK1 | Upregulated | 4.275 |
4.03×10⁻¹⁴ | – | – | – |
| OAS1 | Upregulated | 2.20 |
2.94×10⁻¹³ | Hypomethylated | −0.294876 |
2.70×10⁻¹⁵ |
| CXCL10 | Upregulated | 3.716 |
1.62×10⁻⁵ | Hypomethylated | −0.236382 |
3.70×10⁻¹³ |
| MMP2 | Upregulated | 4.818 |
4.06×10⁻¹⁰ | – | – | – |
| CLEC5A | Upregulated | 3.149 |
6.08×10⁻⁹ | Hypomethylated | −0.283954 |
1.10×10⁻¹¹ |
| EMP3 | Upregulated | 6.029 |
3.25×10⁻¹² | Hypomethylated | −0.270879 |
3.70×10⁻¹⁵ |
| SLC43A3 | Upregulated | 4.864 |
5.48×10⁻⁸ | Hypomethylated | −0.231417 |
3.20×10⁻¹⁵ |
| STEAP3 | Upregulated | 4.968 |
2.93×10⁻¹² | Hypomethylated | −0.210999 |
3.50×10⁻¹⁵ |
| TNFAIP6 | Upregulated | 2.949 |
4.86×10⁻¹⁵ | – | – | – |
| APOBEC3G | Upregulated | 3.055 |
1.14×10⁻⁶ | Hypomethylated | −0.269254 |
2.20×10⁻¹² |
|
| B,
Hypermethylated and downregulated genes |
|
| Gene | Expression
status | Fold
change | P-value | Metdylation
status | Delta β
(tumour-normal) | P-value |
|
| SST | Downregulated | −80.516 |
3.95×10⁻²¹ |
Hypermethylated | 0.353893 |
3.5×10⁻⁵ |
| NPY | Downregulated | −22.749 |
1.58×10⁻¹⁰ |
Hypermethylated | 0.454559 |
2.60×10⁻⁷ |
| ADCY2 | Downregulated | −3.360 |
1.54×10⁻²² |
Hypermethylated | 0.213494 |
1.50×10⁻¹³ |
Discussion
DNA methylation-based central nervous system (CNS)
tumour classification markedly enhances the diagnostic precision
and may correctly modify the primary diagnosis in 12% of cases
(24). Global DNA demethylation is
one of the most important characteristics of glioma. With the
recurrence and progression of glioma, whole DNA methylation
undergoes a marked loss. By contrast, hypermethylation of CpG
islands in promoter regions is an important mechanism of inducing
transcriptional silencing of several genes, which may be important
during glioma formation (25).
Etcheverry et al (12) first
performed a genome-wide integrative analysis of methylation and
gene expression profiles in the same GBM cohort. They determined
that 25% of genes associated with DMCpG sites in GBM vs. control
brain tissues were differentially expressed in a concordant manner.
In addition, Wen et al (26)
reported that with the increase in the degree of malignancy of GBM,
the number of genes whose methylation degree was negatively
correlated with mRNA expression increased as well. Wang et
al (27) recently established a
methylation-based eight-gene signature predicting the survival
outcomes of GBM patients. However, the roles of aberrant
methylation in the pathogenic mechanisms of GBM have remained to be
fully elucidated.
In the present study, 251 Hypo-UGs and 199 Hyper-DGs
that may be associated with the development of GBM were identified
by conjunctively analysing gene expression and methylation
profiles. Through functional analysis, it was determined that
Hyper-DGs were associated with synapsis-associated signalling,
which is consistent with the commonly accepted knowledge that GBM
cells derived from normal brain cells lose numerous functions,
including synaptic transmission performed by normal brain cells.
Hypo-UGs were primarily involved in immune-associated signalling.
Of note, pathway analysis of Hypo-UGs indicated enrichment in
infection-associated pathways. Increasing evidence supports the
view that human herpes virus 6, cytomegalovirus and Epstein-Barr
virus infection may participate in glioma pathogenesis (28–30). A
previous study has demonstrated by electron microscopy that
virus-like particles were present in glioma tissues (31), emphasizing the role of viruses in the
aetiology and pathogenesis of GBM. The present results provide
complementary evidence supporting the theory that a virus may be a
risk factor for the pathogenesis of GBM. In addition, one
significant module identified in Hyper-DGs was linked to G-protein
coupled receptor signalling pathways. Accumulating evidence has
suggested that aberrant expression of G-protein coupled receptors
may participate in BP involved in the initiation, progression and
metastasis of tumours (32,33). The present results suggest that the
function of the G-protein coupled receptor in the regulation of
tumour promotion may be due to the aberrant methylation of
associated genes. However, this warrants further confirmation by
future studies.
Comprehensive analysis of the PPI network identified
6 hub genes in Hypo-UGs and 3 in Hyper-DGs. A previous study
suggested that IL-8 may participate in numerous CNS abnormalities,
including gliomas, by enhancing synaptogenesis, influencing
synaptic transmission and contributing to neuroinflammation
(34). Upregulation of IL-8 has been
observed in glioma tissues (35),
which may be linked to prostaglandin E2-mediated DNA demethylation
of CpG islands in IL-8 genes (24).
OAS1 is a gene that encodes several essential proteins that are
involved in the innate immune response to viral infection. These
encoded molecules may activate latent RNase L, which results in
viral and endogenous RNA degradation, and inhibition of viral
replication. The present results were consistent with those of a
previous study suggesting that OAS1 expression is significantly
inversely correlated with its methylation level (12). Somatostatin, encoded by the SST gene,
is a peptide hormone secreted by parts of the CNS that affect
neurotransmission and cell proliferation (36,37). A
hypermethylation-associated decrease in somatostatin expression was
reported to be important for uncontrolled proliferation of
colorectal cancer and gastric cancer (38–40).
The present results suggested that APOBEC3G,
TNFAIP6, SLC43A3, EMP3, CLEC5A and STEAP3 were stable prognostic
factors for GBM. STEAP3 is a metalloreductase that has an important
role in the function of cellular iron uptake and maintenance of
homeostasis. One study suggested that STEAP3 was significantly
overexpressed in malignant glioma and that it was associated with
poor prognosis (41). Knockdown of
STEAP3 inhibited cell proliferation and progression, indicating a
tumour promotion function of the STEAP3 gene. EMP3, which has been
reported to exhibit frequent promoter methylation in high-grade
glioma (42), is thought to
participate in cell proliferation and cell-cell interactions
(43,44). Studies of other genes in glioma are
limited and these genes require further exploration.
The GBM datasets from TCGA were then used to
validate the expression and methylation levels of the hub and
prognostic genes identified. The expression levels of all of these
genes were consistent with the previously obtained results.
However, the methylation levels of CDK1, MMP2 and TNFAIP6 in the
TCGA cohort were not consistent with the previous results, which
may be due to different methods used to identify the DMGs as
aforementioned.
Several limitations of the present study should be
considered. First, the influence of AMDEGs lacks further
experimental validation. Supplementary molecular experiments are
required to better confirm the results of the candidate genes and
pathways identified. Second, the sample size was insufficient,
although multiple datasets were analysed in combination.
Furthermore, the intersection analysis between GSE16011 and
GSE50161 may exclude certain important predictors that may result
in limited screening ability. However, the indicators highlighted
are biologically reasonable and reliable. In addition, the quality
of the chip was not strictly evaluated and the batch effect may
have occurred in the interior of each dataset. However, through
validation in the TCGA database, the results are relatively stable.
The present study represents a significant step in the systematic
assessment of the GBM microenvironment.
In conclusion, numerous AMDEGs and associated
pathways in GBM were revealed in the present study through
integrative analyses of gene expression and methylation profiling.
These results will help identify valuable therapeutic targets and
diagnostic markers for GBM and promote the understanding of the
cumulative roles of epigenetic mechanisms in the aetiology and
pathogenesis of GBM. In addition, a set of hub genes in a PPI
network was identified, which may be used as methylation-based
biomarkers for the precise diagnosis of GBM. Through survival
analysis, it was determined that CLEC5A, EMP3, SLC43A3, STEAP3 and
APOBEC3G may be used as potential methylation-based prognostic
biomarkers and serve as potential targets for treatment.
Supplementary Material
Supporting Data
Acknowledgements
Not applicable.
Funding
The present study was supported by the National
Natural Science Foundation of China (grant no. 81402521).
Availability of data and materials
All data generated or analysed during the present
study are included in this published article.
Authors' contributions
MZ and QQ conceived and designed the study, and
drafted the manuscript. XL, GL and YJ performed the data
acquisition, analysed the data and interpreted the results. MZ and
GL wrote and edited the manuscript. QQ contributed to critical
revisions of the text. All authors read and approved the final
manuscript.
Ethics approval and consent to
participate
Not applicable.
Patient consent for publication
Not applicable.
Competing interests
The authors declare that they have no competing
interests.
References
|
1
|
Anjum K, Shagufta BI, Abbas SQ, Patel S,
Khan I, Shah SAA, Akhter N and Hassan SSU: Current status and
future therapeutic perspectives of glioblastoma multiforme (GBM)
therapy: A review. Biomed Pharmacother. 92:681–689. 2017.
View Article : Google Scholar : PubMed/NCBI
|
|
2
|
Thakkar JP, Dolecek TA, Horbinski C,
Ostrom QT, Lightner DD, Barnholtz-Sloan JS and Villano JL:
Epidemiologic and molecular prognostic review of glioblastoma.
Cancer Epidemiol Biomarkers Prev. 23:1985–1996. 2014. View Article : Google Scholar : PubMed/NCBI
|
|
3
|
Alexander BM and Cloughesy TF: Adult
glioblastoma. J Clin Oncol. 35:2402–2409. 2017. View Article : Google Scholar : PubMed/NCBI
|
|
4
|
Batash R, Asna N, Schaffer P, Francis N
and Schaffer M: Glioblastoma multiforme, diagnosis and treatment;
Recent literature review. Curr Med Chem. 24:3002–3009. 2017.
View Article : Google Scholar : PubMed/NCBI
|
|
5
|
Aldape K, Zadeh G, Mansouri S,
Reifenberger G and von Deimling A: Glioblastoma: Pathology,
molecular mechanisms and markers. Acta Neuropathol. 129:829–848.
2015. View Article : Google Scholar : PubMed/NCBI
|
|
6
|
Kanwal R, Gupta K and Gupta S: Cancer
epigenetics: An introduction. Methods Mol Biol. 1238:3–25. 2015.
View Article : Google Scholar : PubMed/NCBI
|
|
7
|
Romani M, Pistillo MP and Banelli B:
Epigenetic targeting of glioblastoma. Front Oncol. 8:4482018.
View Article : Google Scholar : PubMed/NCBI
|
|
8
|
Werner RJ, Kelly AD and Issa JJ:
Epigenetics and precision oncology. Cancer J. 23:262–269. 2017.
View Article : Google Scholar : PubMed/NCBI
|
|
9
|
Bender J: DNA methylation and epigenetics.
Annu Rev Plant Biol. 55:41–68. 2004. View Article : Google Scholar : PubMed/NCBI
|
|
10
|
Berghoff AS, Hainfellner JA, Marosi C and
Preusser M: Assessing MGMT methylation status and its current
impact on treatment in glioblastoma. CNS Oncol. 4:47–52. 2015.
View Article : Google Scholar : PubMed/NCBI
|
|
11
|
Skiriute D, Vaitkiene P, Saferis V,
Asmoniene V, Skauminas K, Deltuva VP and Tamasauskas A: MGMT,
GATA6, CD81, DR4, and CASP8 gene promoter methylation in
glioblastoma. BMC Cancer. 12:2182012. View Article : Google Scholar : PubMed/NCBI
|
|
12
|
Etcheverry A, Aubry M, de Tayrac M,
Vauleon E, Boniface R, Guenot F, Saikali S, Hamlat A, Riffaud L,
Menei P, et al: DNA methylation in glioblastoma: Impact on gene
expression and clinical outcome. BMC Genomics. 11:7012010.
View Article : Google Scholar : PubMed/NCBI
|
|
13
|
Sang L, Wang XM, Xu DY and Zhao WJ:
Bioinformatics analysis of aberrantly methylated-differentially
expressed genes and pathways in hepatocellular carcinoma. World J
Gastroenterol. 24:2605–2616. 2018. View Article : Google Scholar : PubMed/NCBI
|
|
14
|
Nazarov PV, Muller A, Kaoma T, Nicot N,
Maximo C, Birembaut P, Tran NL, Dittmar G and Vallar L: RNA
sequencing and transcriptome arrays analyses show opposing results
for alternative splicing in patient derived samples. BMC Genomics.
18:4432017. View Article : Google Scholar : PubMed/NCBI
|
|
15
|
Barrett T, Wilhite SE, Ledoux P,
Evangelista C, Kim IF, Tomashevsky M, Marshall KA, Phillippy KH,
Sherman PM, Holko M, et al: NCBI GEO: Archive for functional
genomics data sets-update. Nucleic Acids Res. 41:D991–D995. 2013.
View Article : Google Scholar : PubMed/NCBI
|
|
16
|
Edgar R, Domrachev M and Lash AE: Gene
expression omnibus: NCBI gene expression and hybridization array
data repository. Nucleic Acids Res. 30:207–210. 2002. View Article : Google Scholar : PubMed/NCBI
|
|
17
|
Gravendeel LA, Kouwenhoven MC, Gevaert O,
de Rooi JJ, Stubbs AP, Duijm JE, Daemen A, Bleeker FE, Bralten LB,
Kloosterhof NK, et al: Intrinsic gene expression profiles of
gliomas are a better predictor of survival than histology. Cancer
Res. 69:9065–9072. 2009. View Article : Google Scholar : PubMed/NCBI
|
|
18
|
Griesinger AM, Birks DK, Donson AM, Amani
V, Hoffman LM, Waziri A, Wang M, Handler MH and Foreman NK:
Characterization of distinct immunophenotypes across pediatric
brain tumor types. J Immunol. 191:4880–4888. 2013. View Article : Google Scholar : PubMed/NCBI
|
|
19
|
Lai RK, Chen Y, Guan X, Nousome D, Sharma
C, Canoll P, Bruce J, Sloan AE, Cortes E, Vonsattel JP, et al:
Genome-wide methylation analyses in glioblastoma multiforme. PLoS
One. 9:e893762014. View Article : Google Scholar : PubMed/NCBI
|
|
20
|
Huang da W, Sherman BT and Lempicki RA:
Systematic and integrative analysis of large gene lists using DAVID
bioinformatics resources. Nat Protoc. 4:44–57. 2009. View Article : Google Scholar : PubMed/NCBI
|
|
21
|
Szklarczyk D, Morris JH, Cook H, Kuhn M,
Wyder S, Simonovic M, Santos A, Doncheva NT, Roth A, Bork P, et al:
The STRING database in 2017: Quality-controlled protein-protein
association networks, made broadly accessible. Nucleic Acids Res.
45:D362–D368. 2017. View Article : Google Scholar : PubMed/NCBI
|
|
22
|
Shannon P, Markiel A, Ozier O, Baliga NS,
Wang JT, Ramage D, Amin N, Schwikowski B and Ideker T: Cytoscape: A
software environment for integrated models of biomolecular
interaction networks. Genome Res. 13:2498–2504. 2003. View Article : Google Scholar : PubMed/NCBI
|
|
23
|
Goldman M, Craft B, Swatloski T, Cline M,
Morozova O, Diekhans M, Haussler D and Zhu J: The UCSC cancer
genomics browser: Update 2015. Nucleic Acids Res. 43:D812–D817.
2015. View Article : Google Scholar : PubMed/NCBI
|
|
24
|
Capper D, Jones DTW, Sill M, Hovestadt V,
Schrimpf D, Sturm D, Koelsche C, Sahm F, Chavez L, Reuss DE, et al:
DNA methylation-based classification of central nervous system
tumours. Nature. 555:469–474. 2018. View Article : Google Scholar : PubMed/NCBI
|
|
25
|
Aoki K and Natsume A: Overview of DNA
methylation in adult diffuse gliomas. Brain Tumor Pathol. 36:84–91.
2019. View Article : Google Scholar : PubMed/NCBI
|
|
26
|
Wen WS, Hu SL, Ai Z, Mou L, Lu JM and Li
S: Methylated of genes behaving as potential biomarkers in
evaluating malignant degree of glioblastoma. J Cell Physiol.
232:3622–3630. 2017. View Article : Google Scholar : PubMed/NCBI
|
|
27
|
Wang W, Zhao Z, Wu F, Wang H, Wang J, Lan
Q and Zhao J: Bioinformatic analysis of gene expression and
methylation regulation in glioblastoma. J Neurooncol. 136:495–503.
2018. View Article : Google Scholar : PubMed/NCBI
|
|
28
|
Chi J, Gu B, Zhang C, Peng G, Zhou F, Chen
Y, Zhang G, Guo Y, Guo D, Qin J, et al: Human herpesvirus 6 latent
infection in patients with glioma. J Infect Dis. 206:1394–1398.
2012. View Article : Google Scholar : PubMed/NCBI
|
|
29
|
Cobbs CS, Harkins L, Samanta M, Gillespie
GY, Bharara S, King PH, Nabors LB, Cobbs CG and Britt WJ: Human
cytomegalovirus infection and expression in human malignant glioma.
Cancer Res. 62:3347–3350. 2002.PubMed/NCBI
|
|
30
|
Akhtar S, Vranic S, Cyprian FS and Al
Moustafa AE: Epstein-barr virus in gliomas: Cause, association, or
artifact? Front Oncol. 8:1232018. View Article : Google Scholar : PubMed/NCBI
|
|
31
|
Tani E, Takeuchi J and Ametani T:
Virus-like particles in cultured human glioma. Acta Neuropathol.
16:266–270. 1970. View Article : Google Scholar : PubMed/NCBI
|
|
32
|
Lynch JR and Wang JY: G protein-coupled
receptor signaling in stem cells and cancer. Int J Mol Sci.
17:E7072016. View Article : Google Scholar : PubMed/NCBI
|
|
33
|
O'Hayre M, Degese MS and Gutkind JS: Novel
insights into G protein and G protein-coupled receptor signaling in
cancer. Curr Opin Cell Biol. 27:126–135. 2014. View Article : Google Scholar : PubMed/NCBI
|
|
34
|
Miller G: Brain cancer. A viral link to
glioblastoma? Science. 323:30–31. 2009.PubMed/NCBI
|
|
35
|
Nitta T, Allegretta M, Okumura K, Sato K
and Steinman L: Neoplastic and reactive human astrocytes express
interleukin-8 gene. Neurosurg Rev. 15:203–207. 1992. View Article : Google Scholar : PubMed/NCBI
|
|
36
|
Florio T and Schettini G: Somatostatin and
its receptors. Role in the control of cell proliferation. Minerva
Endocrinol. 26:91–102. 2001.(In Italian). PubMed/NCBI
|
|
37
|
Theodoropoulou M and Stalla GK:
Somatostatin receptors: From signaling to clinical practice. Front
Neuroendocrinol. 34:228–252. 2013. View Article : Google Scholar : PubMed/NCBI
|
|
38
|
Leiszter K, Sipos F, Galamb O, Krenács T,
Veres G, Wichmann B, Fűri I, Kalmár A, Patai ÁV, Tóth K, et al:
Promoter hypermethylation-related reduced somatostatin production
promotes uncontrolled cell proliferation in colorectal cancer. PLoS
One. 10:e01183322015. View Article : Google Scholar : PubMed/NCBI
|
|
39
|
Liu J, Li H, Sun L, Wang Z, Xing C and
Yuan Y: Aberrantly methylated-differentially expressed genes and
pathways in colorectal cancer. Cancer Cell Int. 17:752017.
View Article : Google Scholar : PubMed/NCBI
|
|
40
|
Li H, Liu JW, Liu S, Yuan Y and Sun LP:
Bioinformatics-based identification of methylated-differentially
expressed genes and related pathways in gastric cancer. Dig Dis
Sci. 62:3029–3039. 2017. View Article : Google Scholar : PubMed/NCBI
|
|
41
|
Han M, Xu R, Wang S, Yang N, Ni S, Zhang
Q, Xu Y, Zhang X, Zhang C, Wei Y, et al: Six-transmembrane
epithelial antigen of prostate 3 predicts poor prognosis and
promotes glioblastoma growth and invasion. Neoplasia. 20:543–554.
2018. View Article : Google Scholar : PubMed/NCBI
|
|
42
|
Alaminos M, Davalos V, Ropero S, Setién F,
Paz MF, Herranz M, Fraga MF, Mora J, Cheung NK, Gerald WL and
Esteller M: EMP3, a myelin-related gene located in the critical
19q13.3 region, is epigenetically silenced and exhibits features of
a candidate tumor suppressor in glioma and neuroblastoma. Cancer
Res. 65:2565–2571. 2005. View Article : Google Scholar : PubMed/NCBI
|
|
43
|
Taylor V and Suter U: Epithelial membrane
protein-2 and epithelial membrane protein-3: Two novel members of
the peripheral myelin protein 22 gene family. Gene. 175:115–120.
1996. View Article : Google Scholar : PubMed/NCBI
|
|
44
|
Ben-Porath I and Benvenisty N:
Characterization of a tumor-associated gene, a member of a novel
family of genes encoding membrane glycoproteins. Gene. 183:69–75.
1996. View Article : Google Scholar : PubMed/NCBI
|