Introduction
Glioblastoma (GBM), also known as glioblastoma
multiforme, comprising 30–40% of all brain tumors, is one of the
most common primary brain tumors with high morbidity and mortality,
and it is characterized by a high recurrence rate, invasiveness and
a low cure rate (1,2). This is due to GBMs rapid growth rate,
substantial molecular heterogeneity, high propensity to infiltrate
vital brain structures and the regenerative capacity of
treatment-resistant cancer stem cells. GBM is also the most lethal
subtype of glioma, with a median survival of <2 years despite
surgical resection, radiation, and chemotherapy (3–6). GBM has
different histopathological features, mutations and clinical
courses in an age-dependent manner (7).
All current high-grade gliomas (HGGs), such as GBM,
are incurable as current standard treatments are insufficient,
including maximal surgical tumor resection, radiotherapy and
chemotherapy (4,8–10).
Molecular approaches that target angiogenesis and
single-compound-targeted therapies have also been unsuccessful
(11).
Although the detailed mechanism of GBM formation and
progression has been extensively studied, the exact etiology of GBM
is poorly understood (12–14). The occurrence and malignant
progression of GBM are associated with a variety of factors, such
as gene aberrations (15). Due to
the high morbidity and mortality of GBM, it is crucial to
understand its etiology and potential molecular mechanisms; it is
also necessary to find novel molecular biomarkers with potential
diagnostic, individualized therapeutic and prognostic value. The
screening of differentially expressed genes (DEGs) can be performed
by using gene chips, which can easily detect all the genes within a
sample and gather information at a specific time point (16). In the past few decades, the use of
high-throughput microarrays to study the molecular mechanisms of
GBM and to reconstruct the gene regulatory network in medical
biology has made substantial progress (17). Microarrays are very valuable for
screening genes associated with the occurrence, progression and
targeted therapy of GBM (6).
Bioinformatics analyses that use microarrays in screening have
revealed that these genes are closely associated with cell
signaling, cell metabolism, cytoskeleton, immunity, cell cycle and
apoptosis (18,19). However, due to tissue heterogeneity
in independent studies or the inherent shortcomings of the
microarray technique, including small sample size, measurement
error and information insufficiency, the results are always
inconsistent (17,20). Therefore, unveiling the specific
molecular mechanism underlying GBM remains a major challenge,
although large numbers of DEGs have been identified between GBM and
normal brain tissues by using microarray analysis (21). Integrated bioinformatics methods
hypothesized to be capable of solving the aforementioned problems
combined with expression profiling techniques have been carried out
to identify the mechanisms underlying GBM (22,23).
Kunkle et al (22) applied a
comprehensive bioinformatics method using a genetic variation
(small-scale variations and copy number variations) and
environmental data integration that links with glioblastoma to
distinguish genes that may be influenced by environmental exposures
and associated with the development of GBM. Using this
bioinformatics method, they identified 173 aberrantly expressed
environmentally responsive genes that may be important to the
pathogenesis of GBM. Additionally, through integrated
bioinformatics methods, Li et al (23) discovered a series of gene pairs whose
relationships were reversed in the progression from normal to GBM,
i.e. from positive to negative correlation or vice versa, including
cyclin-dependent kinase 2 and neuroblastoma RAS, fibroblast growth
factor receptor and cyclin D1. DEGs were first identified from the
GES4290 gene expression profile using Student t test. The relevant
metabolic pathways including the cell cycle and mitogen-activated
protein kinases were then extracted from the Kyoto Encyclopedia of
Genes and Genomes (KEGG) pathway database (https://www.kegg.jp/). A total of 432 cancer genes
were subsequently obtained from the database of Cancer Gene Census
(http://www.sanger.ac.uk/genetics/CGP/Census/), before
the gene pairs were analyzed between DEGs and cancer genes.
In the present study, three microarray datasets
(GSE50161, GSE90598 and GSE104291) were downloaded. In total, there
are 57 GBM and 22 normal brain tissue datasets available. A data
processing standard was used to filter the DEGs on the Morpheus
website, followed by Gene Ontology (GO) and pathway enrichment
analyses using Database for Annotation, Visualization and
Integrated Discovery (DAVID) software. The DEGs protein-protein
interaction (PPI) network and modular analysis were integrated
using Search Tool for the Retrieval of Interacting Genes/Proteins
(STRING) software to identify hub genes in GBMs.
Materials and methods
Identification of DEGs and microarray
data information
GBM and non-cancerous brain tissue gene expression
profiles from GSE50161, GSE90598 and GSE10429 were obtained from
the NCBI-Gene Expression Omnibus (NCBI-GEO; http://www.ncbi.nlm.nih.gov/geo) database, which is a
publicly accessible database of next-generation sequencing and
microarray/gene profiles. The microarray data in GSE50161 were
based on GPL570 microarray platforms (Affymetrix Human Genome U133
Plus 2.0 Array; Affymetrix; Thermo Fisher Scientific, Inc.) and
included 37 American GBM and 13 normal brain tissues (submission
date, 23 Aug 2013) (24). The
GSE90598 data were based on GPL17692 microarray platforms
(Affymetrix Human Gene 2.1 ST Array; Affymetrix; Thermo Fisher
Scientific, Inc.) and included 16 Turkish GBM and 7 normal brain
tissues (submission date, 28 Nov 2016) (25). The GSE104291 data was based on GPL570
microarray platforms and included 4 Swiss GBM and 2 normal brain
tissues (submission date, 26 Sep 2017) (26,27).
These three datasets were chosen due to their representation of
three different racial populations. This project was performed with
the permission of the Institutional Review Board of Tongji
University (Shanghai, China).
High-throughput functional genomic expression data
from the three GSE datasets were first integrated into GEO2R for
further analysis (28). Files in
.TXT format, which represents the analysis results from GEO2R, were
subsequently generated by the GEO2R tool. The Venn diagrams were
produced using Bioinformatics and Evolutionary Genomics software
(http://bioinformatics.psb.ugent.be/webtools/Venn)
and the Morpheus Website (https://software.broadinstitute.org/morpheus) to
process the .TXT format data. DEGs were determined by comparing
their expression levels in GBM and normal brain tissues. DEGs were
identified using unpaired t-test and P<0.01 was considered to
indicate a statistically significant DEGs and [log Fold
Change]>1 was set as the cut-off criteria using the GEO2R tool
(28). GEO2R is a dataset analysis
tool based on R programming language. This tool can perform ANOVA
or t-tests, both of which can be applied to compare two sets of
data samples under the same experimental conditions to determine
differentially expressed microRNAs or genes (28).
GO and pathway enrichment
analysis
DEGs GO analysis, candidate DEGs functions and
pathway enrichment were analyzed using the DAVID tool (Version 6.8;
http://david.ncifcrf.gov/) with
P<0.05 set as the cut-off criterion (17,29–33).
Integration of the PPI network
The online database STRING (http://string-db.org) (34) was used to construct a PPI network of
the proteins encoded by DEGs. Then, Cytoscape software (Version
3.7.1, National Institute of General Medical Sciences) (35) was utilized to perform protein
interaction association network analysis and analyze the
interaction correlation of the candidate proteins encoded by the
DEGs in GBM. Next, the CentiScaPe plugin (Version 2.2) for
Cytoscape was applied to calculate node degree (the number of
connections to the hub in the PPI network) (36). Finally, the MCODE module (Version
1.5.1) for Cytoscape was used to collect the significant modules in
the PPI network complex (20).
Survival analysis of hub genes
The online database OncoLnc (http://www.oncolnc.org/), which can link The Cancer
Genome Atlas (TCGA) survival data to mRNA, miRNA or lncRNA
expression levels, was employed to explore the prognostic value of
the hub genes (37). Kaplan-Meier
survival curves were plotted using OncoLnc. Patients with GBM were
sub-classified into low- and high-expression groups according to
the median expression of each hub gene. Relapse-free survival (RFS)
was used for the survival endpoints. For the log-rank test,
P<0.05 was considered to indicated to be statistically
significant difference.
Results
Identification of DEGs in GBMs
The GSE50161, GSE90598 and GSE104291 microarray data
were obtained from NCBI-GEO. Using the aforementioned cut-off
criteria, 4,482, 1,355 and 1,034 DEGs were extracted from GSE50161,
GSE90598 and GSE104291, respectively. Following integrated
bioinformatics analysis, a total of 378 DEGs were documented
(Fig. 1), including 240 and 138
genes up- and downregulated in GBM tissues compared with normal
brain tissues (Table I).
 | Table I.A total of 378 DEGs identified from
three profile datasets, including 240 upregulated genes and 138
downregulated genes in the glioblastoma tissues compared with
normal brain tissues. |
Table I.
A total of 378 DEGs identified from
three profile datasets, including 240 upregulated genes and 138
downregulated genes in the glioblastoma tissues compared with
normal brain tissues.
| DEGs | Gene names |
|---|
| Upregulated | RALYL GLT1D1 STOX1
GNAL HCN1 GOT1 UNC5A RAB40B BSN PRKCB CA11 KCNA1 SRRM4
CARNS1 ZNF385B CABP1 SLC6A15 RBFOX1 RAB3A CLCN4 CRHBP
NEBL HLF IGSF8 SLC39A12 IDS MFSD4A FRMPD4 ATP2B2 RIMBP2 MAP7
C1orf115 OTUD7A RAB11FIP4 NEGR1 MAP1A REPS2 CD200 GAD2
HPCAL4 SST GRM1 ERC2 TRHDE RASGEF1A RIMS1 PHF24
GRIN2A SHANK3 IL1RAPL1 KIF5C GABRA1 UBE2QL1 CACNA2D2 SYN2
GRM3 NEUROD2 KIAA0513 KIAA1644 GNG3 SLC8A2 PPFIA2 PIP4K2A
MYT1L LINGO2 IPCEF1 NRG3 OSBPL1A NRGN UNC13A KCNJ3 MOBP
NEURL1 NTSR2 CPLX2 FBXL16 RAPGEF5 KCNV1 DGKE KIRREL3 GABRA5 NRXN3
STXBP1 HOOK1 PPP1R1A KCNQ3 ATRNL1 TPPP ATP8A2 ATP2B3 SLIT2
OLFM3 STMN2 ADAM11 SYT4 MAP3K9 YPEL2 SLC6A17 PPIP5K1 HECW1
VAMP2 ROGDI RBFOX3 SYNGR3 GJB6 CACNA1E CNTN4 CHST1 RAP1GAP2
VAMP1 FRRS1L CREG2 CEP170B CPLX1 SYN1 MPPED1 ADCY5
MAL CACNA1B SLC7A14 OLFM1 GABRG1 EPB41L1 KIAA1549L PCLO SV2B
FABP3 KCNJ9 SNAP25 ANKS1B SPOCK3 JAKMIP1 SH3GL3 RIMS3 FGFR2
GABRB2 RGS7 NPM2 SVOP ITPR1 KIF5A PKP4 CNTNAP4 PAK3 PPP2R2C
RUNDC3B WBSCR17 MAP7D2 CCK DOK6 CSMD1 CDKL2 SLC17A7 S100A1
BRINP1 CELF3 RXFP1 SLC35F3 SULT4A1 KHDRBS2 RAPGEF4 PDE1A OPALIN
GPR26 DNAJC6 SRCIN1 ETNPPL SYT1 EDIL3 CNNM1 DLG2
CYP4X1 PACSIN1 TBC1D30 STXBP6 CACNG8 MTURN NELL1 PLCL1 C11orf87
TBR1 ASIC2 CAMK2A FAIM2 GRM5 CACNG3 DDN ST8SIA3
NECAB1 ATP8A1 IQSEC1 LRRC7 LINC00889 CDK5R1 RYR2 FEZF2
NIPAL3 CAMK1D DYNC1I1 ARHGAP44 SLC12A5 RUSC2 PAIP2B NKAIN2 PPP1R16B
KIAA0319 CHD5 MYRIP ACSL6 PITPNM3 KCNB1 UNC13C NPTX1 RIMS2 CAMKK2
KSR2 ANK3 STMN4 VIPR1 DOCK3 CHN1 SYT9 RUNDC3A JPH3 CELF4 MAL2
TUBB4A LANCL1 HHATL WASF1 DLG4 MEG3 PHYHIP AK5 SNCA CYP46A1
MIAT CBLN2 ZC3H12B KRT222 |
| Downregulated | CD44 MMP2
ABCB7 HNMT MCUB STK17A BCHE TRAM1 PHLDA1 GNG12 FCGBP ANXA2P2
FN1 PRRX1 IFI16 SYTL4 KIF4A CD93 TNFRSF19 CDH11 TIMP1 CLIC1 TWSG1
WEE1 CKS2 TRIM24 ECT2 CCDC102B FAM111A ZPR1 NAMPT SPRY1 TRIM4 GBE1
PLSCR1 RBBP8 F2R GUSB LSM8 STXBP4 CDK2 TIMELESS COL4A1 VCAN
LAP3 COLGALT1 TGFB1I1 KDELR2 HLA-C TIMP4 ELK3 SERPINA3 ETV1 PARP9
LOC154761 LBR IQGAP2 ANXA1 C1R MSN KDELC2 FAM129A PTPN12
GPX7 PTPRZ1 TMEM45A APOL6 PLP2 DCBLD2 STEAP3 ABCA1 DTX3L DYNLT1
TAP1 JAG1 SMC4 CROT ZFP36L2 EMP1 ZC3HAV1 SLC43A3 LIMA1 GAS2L3
PLA2G4A VIM LGALS3BP SAMD9L PCNA CRISPLD1 TGFBR1 GBP2
NEDD1 CMTM6 RP2 ARAP3 MAP3K1 PRRC1 LAMC1 ANXA5 SNX7 RNF213 PDPN
PCDHB7 IKBIP TNC LOXL2 PYGL CFI NUP160 FAM46A CALU CKAP2 PCDHB16
RIT1 TMX1 BAZ1A GBP3 TSPAN6 DDX60L DESI2 DDX58 NES SEMA5A
SAMD9 SPARC PDIA4 MTMR11 ANO6 IFI44 NUSAP1 CTSC GNAI3
ARHGAP18 TCTN1 IDH1 MRC2 C21orf62 GBP1 |
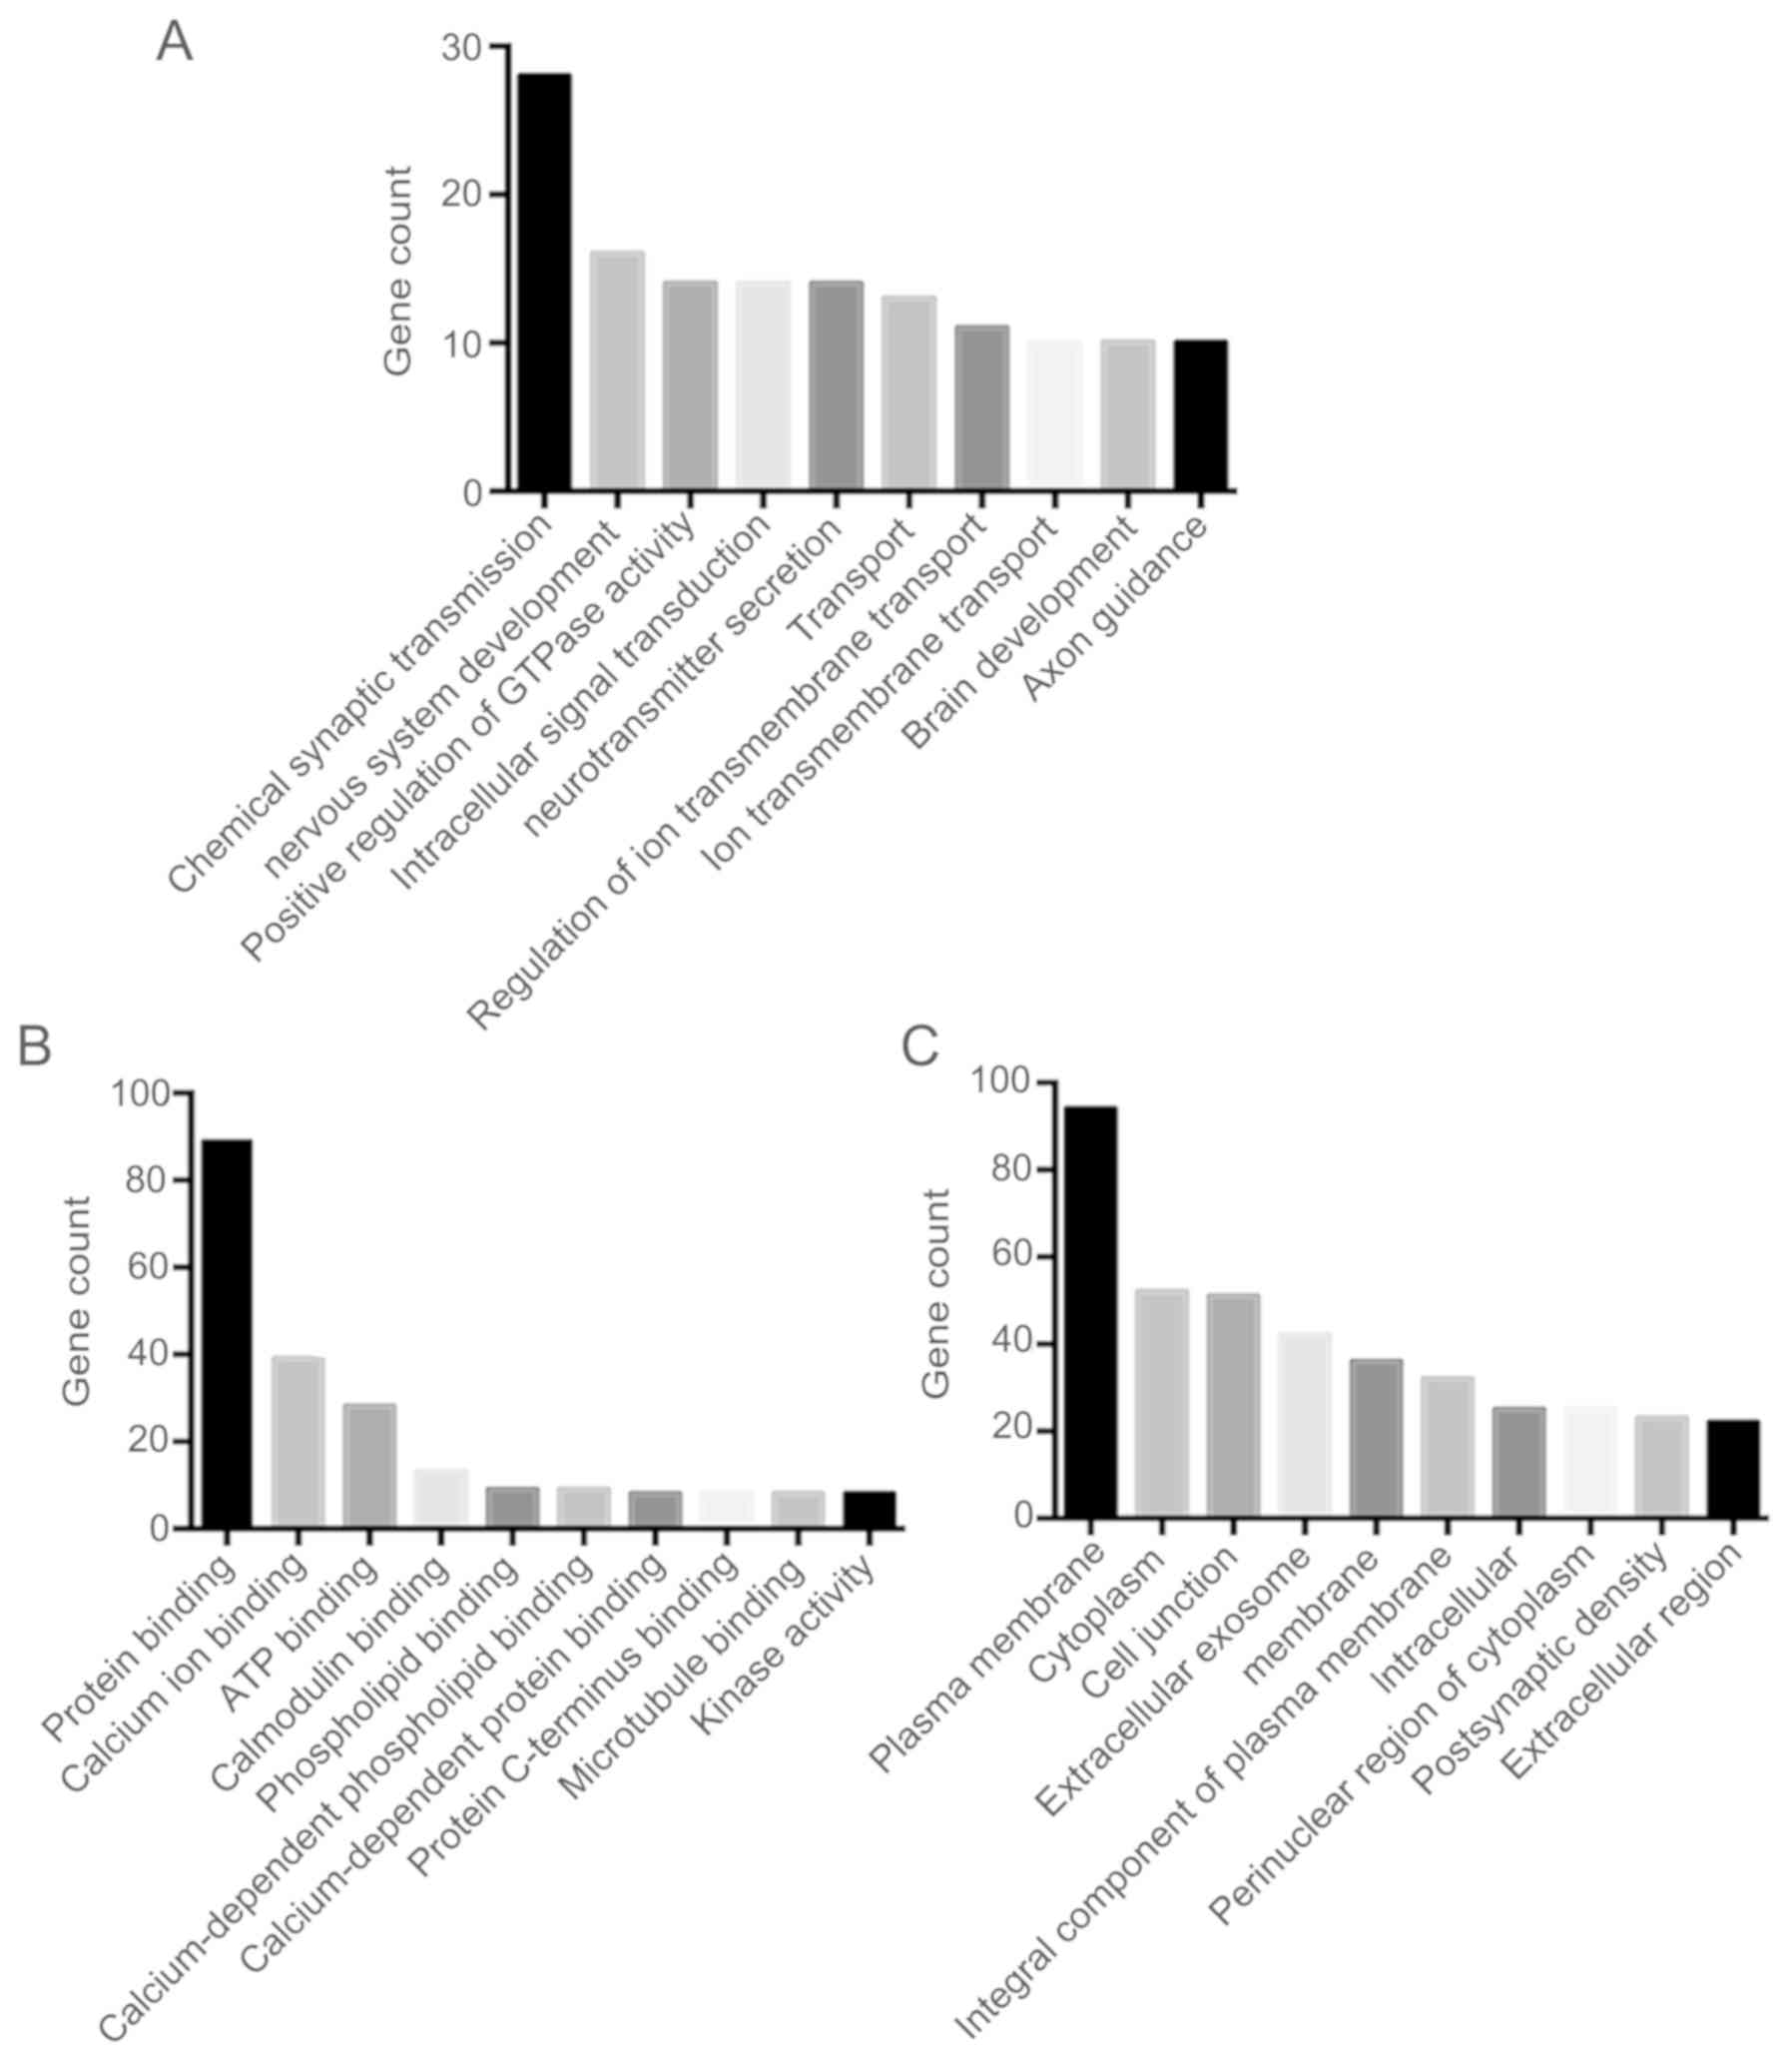
DEGs GO analysis in GBM
Following DEGs GO analysis using DAVID software, the
DEGs were sub-classified into three functional groups including the
cellular component group, the molecular function group and the
biological process group (Fig. 2).
The top 10 significantly enriched GO terms in each of the three
groups were then determined (Fig.
2). In the biological process group, upregulated genes were
involved in chemical synaptic transmission and nervous system
development, and the downregulated genes were involved in cell
adhesion, cell division, the positive regulation of gene expression
and the innate immune response (Table
II). In the molecular function group, the calcium ion binding
GO term enriched both overexpressed and downregulated genes, which
indicate that the molecular function of calcium binding may serve
vital roles in the development of GBM. In addition, overexpressed
genes were also involved in ATP binding, whilst downregulated genes
were also involved in calcium and receptor binding (Table II). In the cellular component group,
upregulated genes mainly included proteins integral to the plasma
membrane and cell junction, while downregulated genes included
those in the cytoplasm, extracellular exosomes and membrane
(Table II). These results
demonstrated that most of the DEGs were closely correlated with
chemical synaptic transmission, protein binding, and plasma
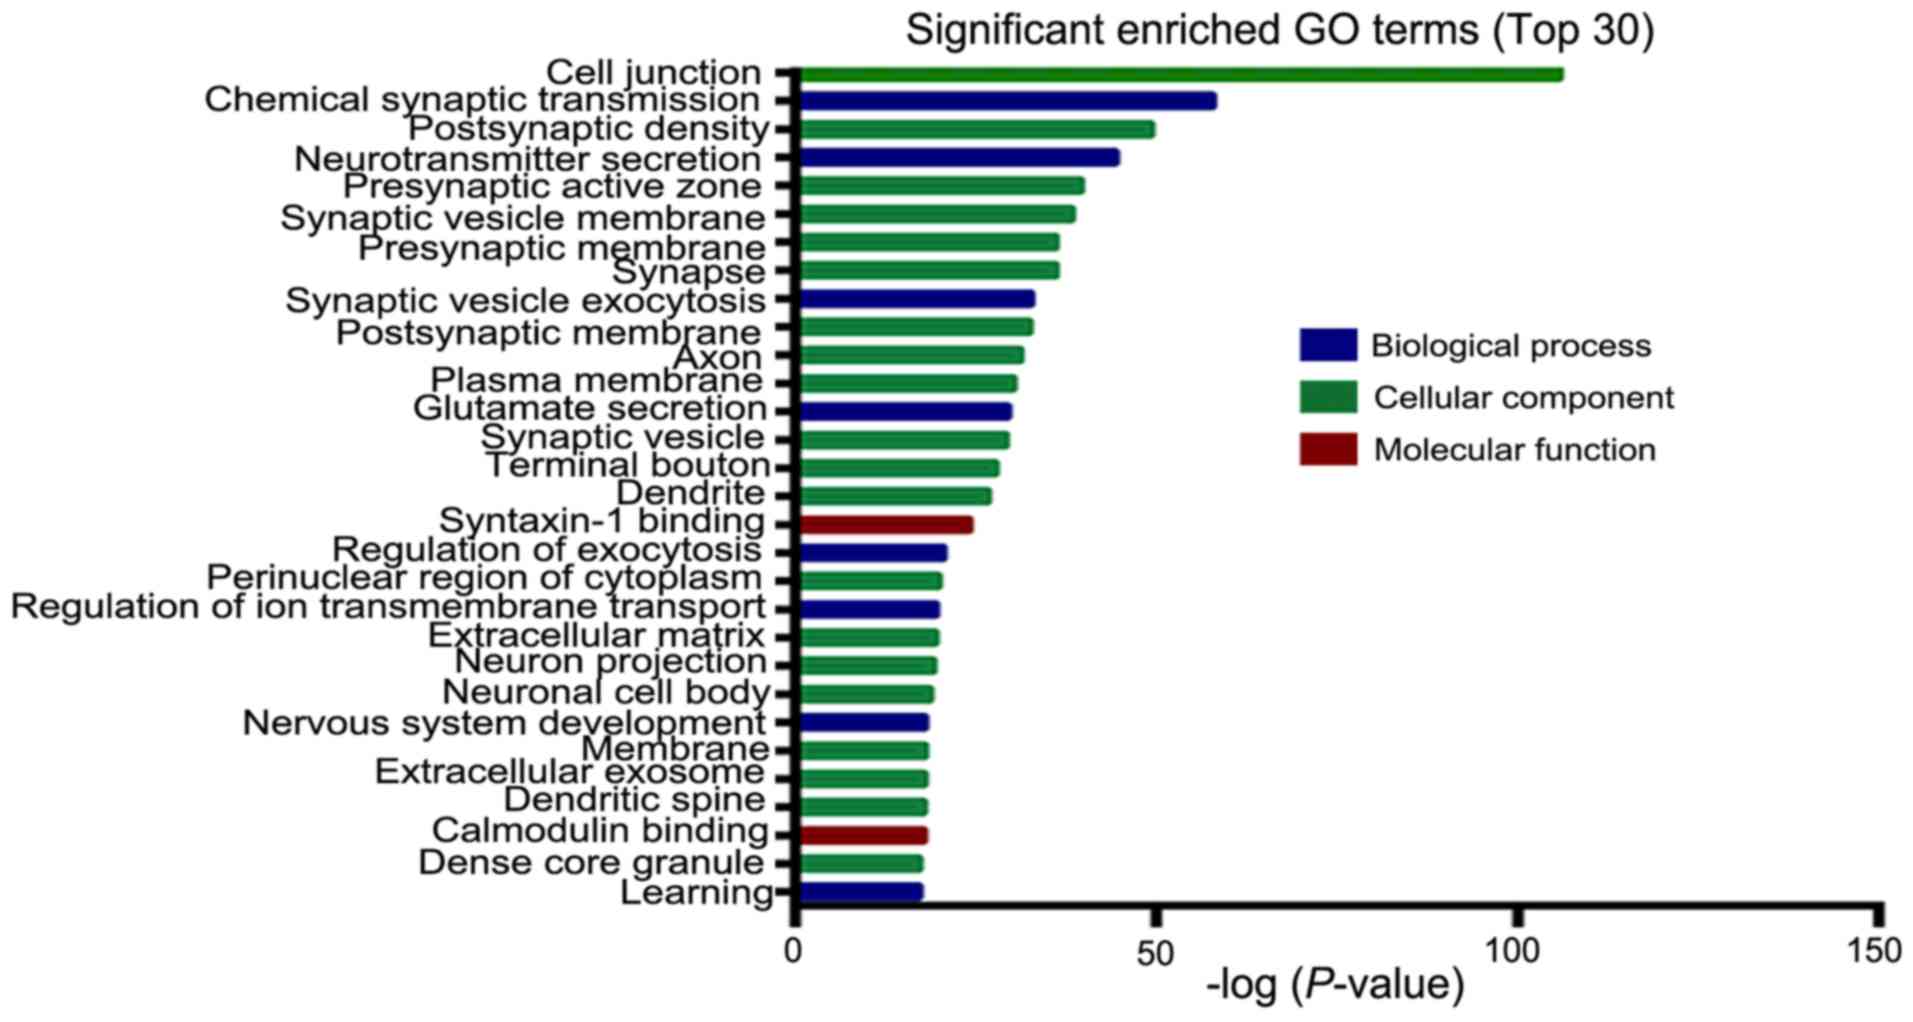
membrane. Significantly enriched GO terms containing the largest
number of DEGs in GBM are listed in Table III. As shown in Fig. 3, in the biological process group, the
most significant enriched GO term is chemical synaptic
transmission. In the cellular component group, the most significant
enriched GO term is cell junction. In the molecular function group,
the most significant enriched GO term is syntaxin-1 binding.
| Table II.The top 3 significantly enriched GO
terms in Glioblastoma stratified by different functional groups of
GO analysis. |
Table II.
The top 3 significantly enriched GO
terms in Glioblastoma stratified by different functional groups of
GO analysis.
| Term | Description | Count | P-value |
|---|
| Upregulated |
|
GO:0007268 (biological
process) | Chemical synaptic
transmission | 28 |
4.30×10⁻¹⁸ |
|
GO:0007269 (biological
process) | Nervous system
development | 14 |
5.00×10⁻¹⁴ |
|
GO:0007269 (biological
process) | Synaptic vesicle
exocytosis | 9 |
1.70×10⁻¹⁰ |
|
GO:0005886 (cellular
component) | Plasma
membrane | 94 |
8.92×10⁻¹⁰ |
|
GO:0030054 (cellular
component) | Cell junction | 51 |
1.60×10⁻³² |
|
GO:0005887 (cellular
component) | Integral component
of plasma membrane | 32 |
1.80×10⁻³ |
|
GO:0048786 (cellular
component) | Presynaptic active
zone | 11 |
1.40×10⁻¹² |
|
GO:0005524 (molecular
function) | ATP binding | 28 |
3.50×10⁻² |
|
GO:0005509 (molecular
function) | Calcium ion
binding | 24 |
3.60×10⁻⁵ |
|
GO:0005516 (molecular
function) | Calmodulin
binding | 13 |
4.90×10⁻⁶ |
| Downregulated |
|
GO:0007155 (biological
process) | Cell adhesion | 10 |
7.76×10⁻³ |
|
GO:0051301 (biological
process) | Cell division | 9 |
4.90×10⁻³ |
|
GO:0010628 (biological
process) | Positive regulation
of gene expression | 8 |
3.60×10⁻³ |
|
GO:0005737 (cellular
component) | Cytoplasm | 52 |
8.35×10⁻³ |
|
GO:0070062 (cellular
component) | Extracellular
exosome | 42 |
4.50×10⁻⁶ |
|
GO:0016020 (cellular
component) | Membrane | 26 |
4.50×10⁻⁶ |
|
GO:0005515 (molecular
function) | protein
binding | 89 |
2.10×10⁻⁵ |
|
GO:0005509 (molecular
function) | Calcium ion
binding | 15 |
8.60×10⁻⁴ |
|
GO:0005102 (molecular
function) | Receptor
binding | 8 |
1.60×10⁻² |
| Table III.Significantly enriched GO terms that
contain the largest number of differentially expressed genes in
glioblastoma. |
Table III.
Significantly enriched GO terms that
contain the largest number of differentially expressed genes in
glioblastoma.
| Term | Description | Count | P-value |
|---|
|
|---|
| A,
Upregulated |
|---|
| GO:0007268
(biological process) | Chemical synaptic
transmission | 28 |
4.30×10⁻¹⁸ |
| GO:0005524
(molecular function) | ATP binding | 28 |
3.50×10⁻² |
| GO:0005886
(cellular component) | Plasma
membrane | 94 |
8.92×10⁻¹⁰ |
|
| B,
Downregulated |
|
| GO:0007155
(biological process) | Cell adhesion | 10 |
7.76×10⁻³ |
| GO:0005515
(molecular function) | Protein
binding | 89 |
2.10×10⁻⁵ |
| GO:0005737
(cellular component) | Cytoplasm | 52 |
8.35×10⁻³ |
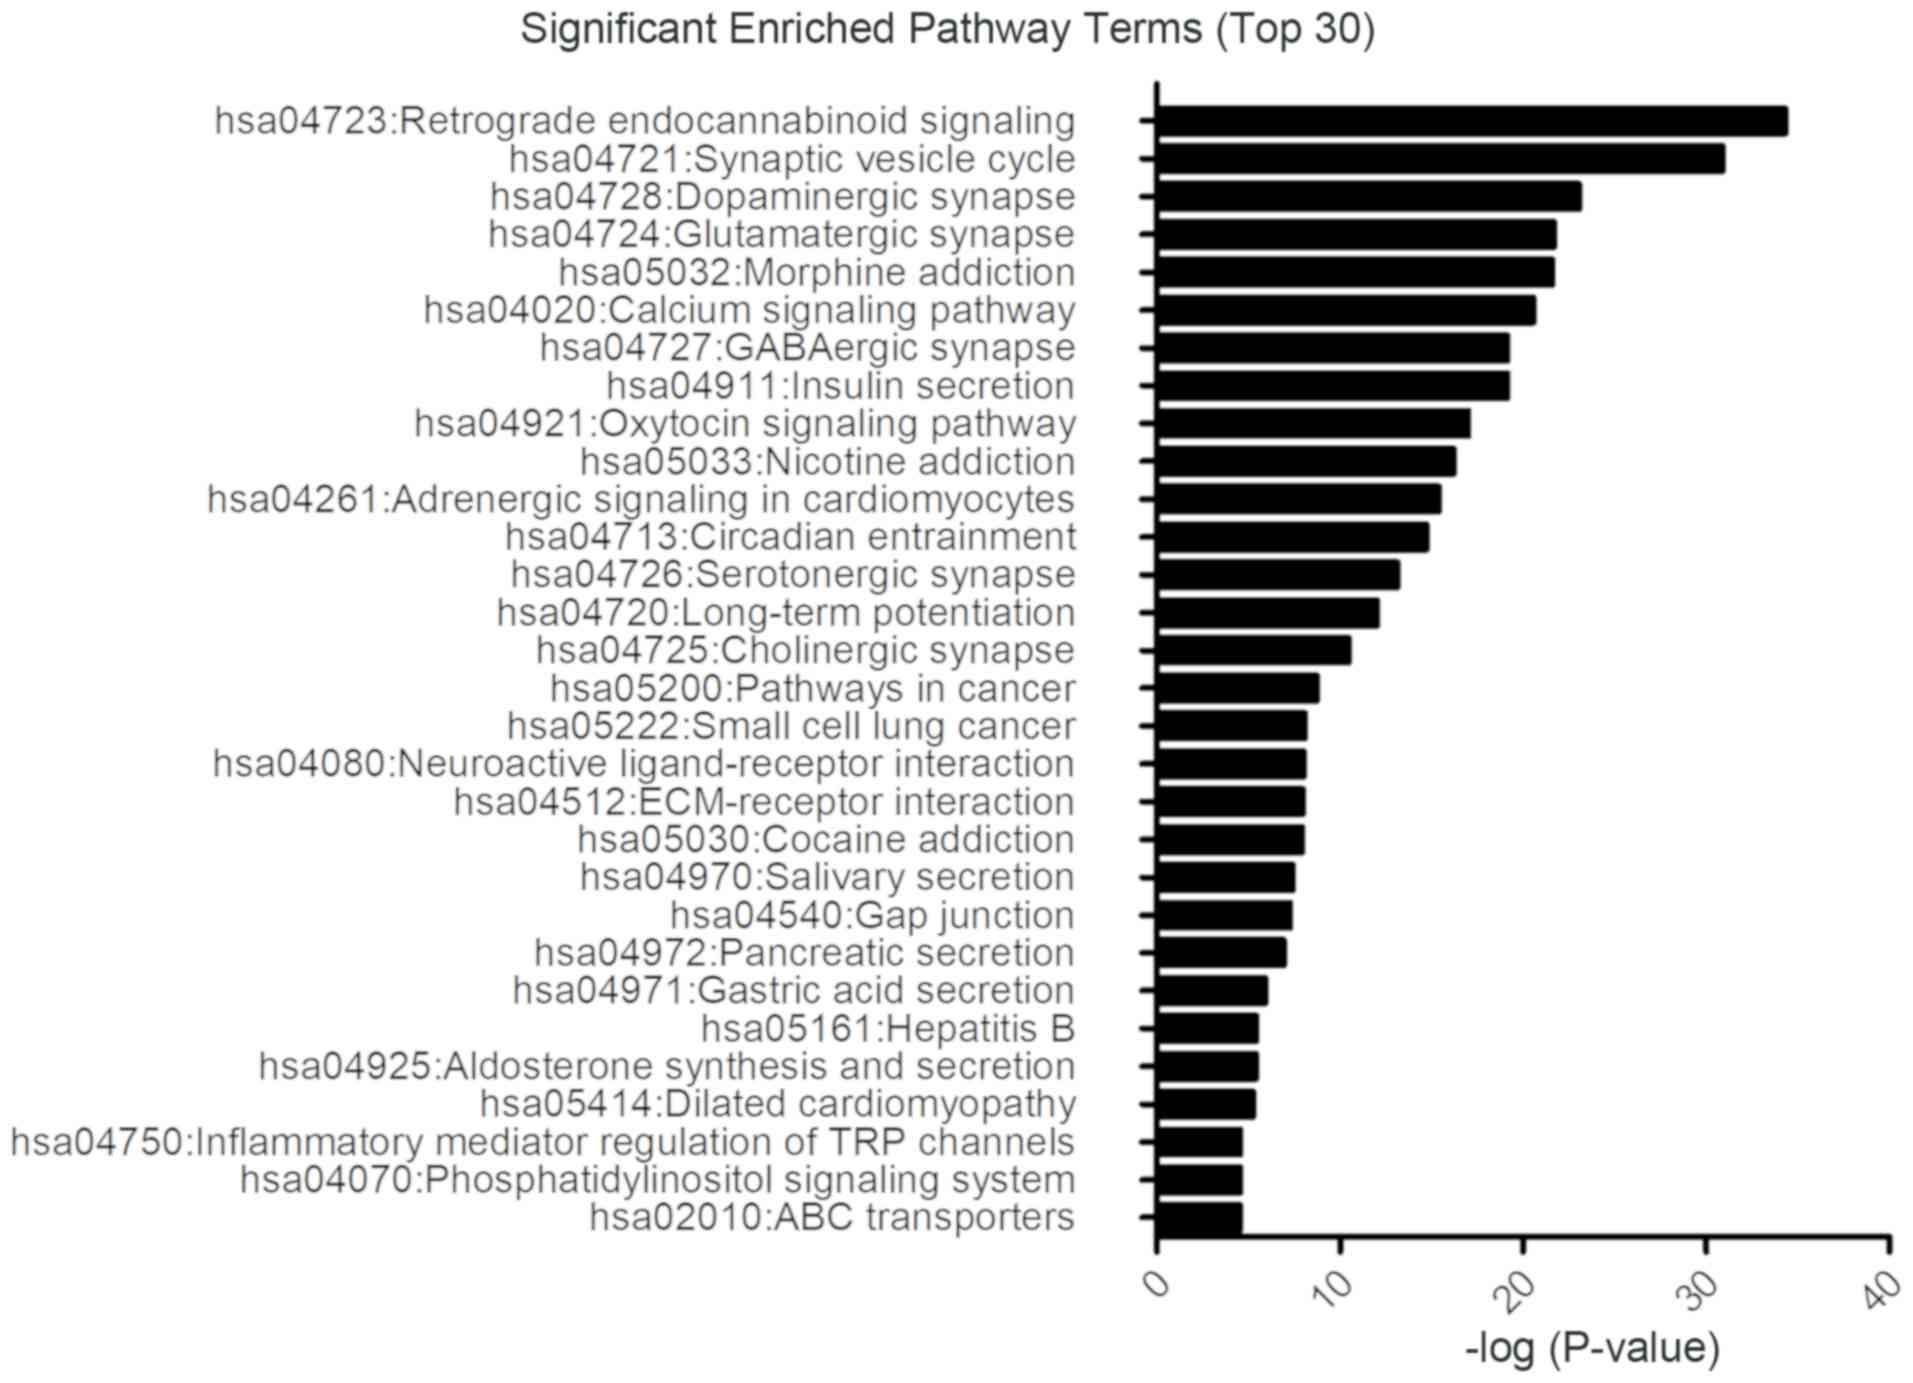
Signaling pathway enrichment
analysis
DAVID tools were used to perform DEGs functional and
signaling pathway enrichment analyses. The DEGs including both
upregulated and downregulated genes associated with glioblastoma
were significantly enriched in signaling pathways involing
retrograde endocannabinoid signaling, synaptic vesicle cycle, and
dopaminergic synapse (Fig. 4). In
particular, as shown in Table IV,
the upregulated genes were mainly enriched in retrograde
endocannabinoid signaling and calcium signaling pathways, whilst
downregulated genes were mainly associated with pathways in cancer
and the phosphatidylinositol 4,5-bisphosphate 3-kinase/RAC-α
serine/threonine-protein kinase signaling pathway.
| Table IV.Signaling pathway enrichment analysis
of DEGs function in glioblastoma. |
Table IV.
Signaling pathway enrichment analysis
of DEGs function in glioblastoma.
| Pathway | Name | Gene count | P-value | Genes |
|---|
|
|---|
| A, Upregulated
DEG |
|---|
| hsa04723 | Retrograde
endocannabinoid signaling | 15 |
4.65×10⁻¹¹ | GABRG1, GABRA1,
GABRB2, ADCY5, GABRA5, RIMS1, GRM1, KCNJ3, ITPR1, PRKCB, GRM5,
SLC17A7, KCNJ9, GNG3, CACNA1B |
| hsa04020 | Calcium signaling
pathway | 14 |
6.51×10⁻⁷ | SLC8A2, GRIN2A,
GRM1, ITPR1, PRKCB, GRM5, GNAL, ATP2B2, ATP2B3, PDE1A, RYR2,
CACNA1E, CAMK2A, CACNA1B |
| hsa04728 | Dopaminergic
synapse | 13 |
1.13×10⁻⁷ | GNAL, KCNJ9, KIF5A,
ADCY5, KIF5C, GRIN2A, GNG3, CAMK2A, KCNJ3, PPP2R2C, ITPR1, PRKCB,
CACNA1B |
| hsa04721 | Synaptic vesicle
cycle | 12 |
4.98×10⁻¹° | SLC17A7, RAB3A,
SYT1, CPLX2, CPLX1, STXBP1, VAMP2, UNC13C, RIMS1, SNAP25, UNC13A,
CACNA1B |
| hsa04724 | Glutamatergic
synapse | 11 |
2.97×10⁻⁷ | SLC17A7, GRM5,
GRM3, ADCY5, DLG4, GRIN2A, GNG3, GRM1, KCNJ3, ITPR1, SHANK3,
PRKCB |
| hsa04921 | Oxytocin signaling
pathway | 12 |
7.64×10⁻⁶ | KCNJ9, CACNG8,
ADCY5, RYR2, CACNG3, CACNA2D2, CAMK2A, KCNJ3, ITPR1, PRKCB, CAMKK2,
CAMK1D |
| hsa05032 | Morphine
addiction | 11 |
3.13×10⁻⁷ | GABRG1, GABRA1,
KCNJ9, GABRB2, ADCY5, PDE1A, GABRA5, GNG3, KCNJ3, PRKCB,
CACNA1B |
| hsa04261 | Adrenergic
signaling in cardiomyocytes | 11 |
2.35×10⁻⁵ | ATP2B2, ATP2B3,
CACNG8, ADCY5, PPP1R1A, RYR2, CACNG3, RAPGEF4, CACNA2D2, CAMK2A,
PPP2R2C |
| hsa04080 | Neuroactive
ligand-receptor interaction | 11 |
3.89×10⁻³ | GRM5, GABRG1, GRM3,
GABRA1, RXFP1, GABRB2, GABRA5, GRIN2A, VIPR1, NTSR2, GRM1 |
|
| B, Downregulated
DEG |
|
| hsa05200 | Pathways in
cancer | 10 |
2.36×10⁻³ | GNAI3, COL4A1,
TGFBR1, CKS2, LAMC1, GNG12, MMP2, CDK2, FN1, F2R |
| hsa04151 | PI3K-Akt signaling
pathway | 7 |
4.36×10⁻² | COL4A1, TNC, LAMC1,
GNG12, CDK2, FN1, F2R |
| hsa05222 | Small cell lung
cancer | 5 |
3.68×10⁻³ | COL4A1, CKS2,
LAMC1, CDK2, FN1 |
| hsa04512 | Extracellular
matrix-receptor interaction | 5 |
4.01×10⁻³ | COL4A1, CD44, TNC,
LAMC1, FN1 |
| hsa05161 | Hepatitis B | 5 |
2.31×10⁻² | DDX58, TGFBR1,
MAP3K1, PCNA, CDK2 |
| hsa02010 | ATP-binding
cassette transporters | 3 |
4.30×10⁻² | TAP1, ABCA1,
ABCB7 |
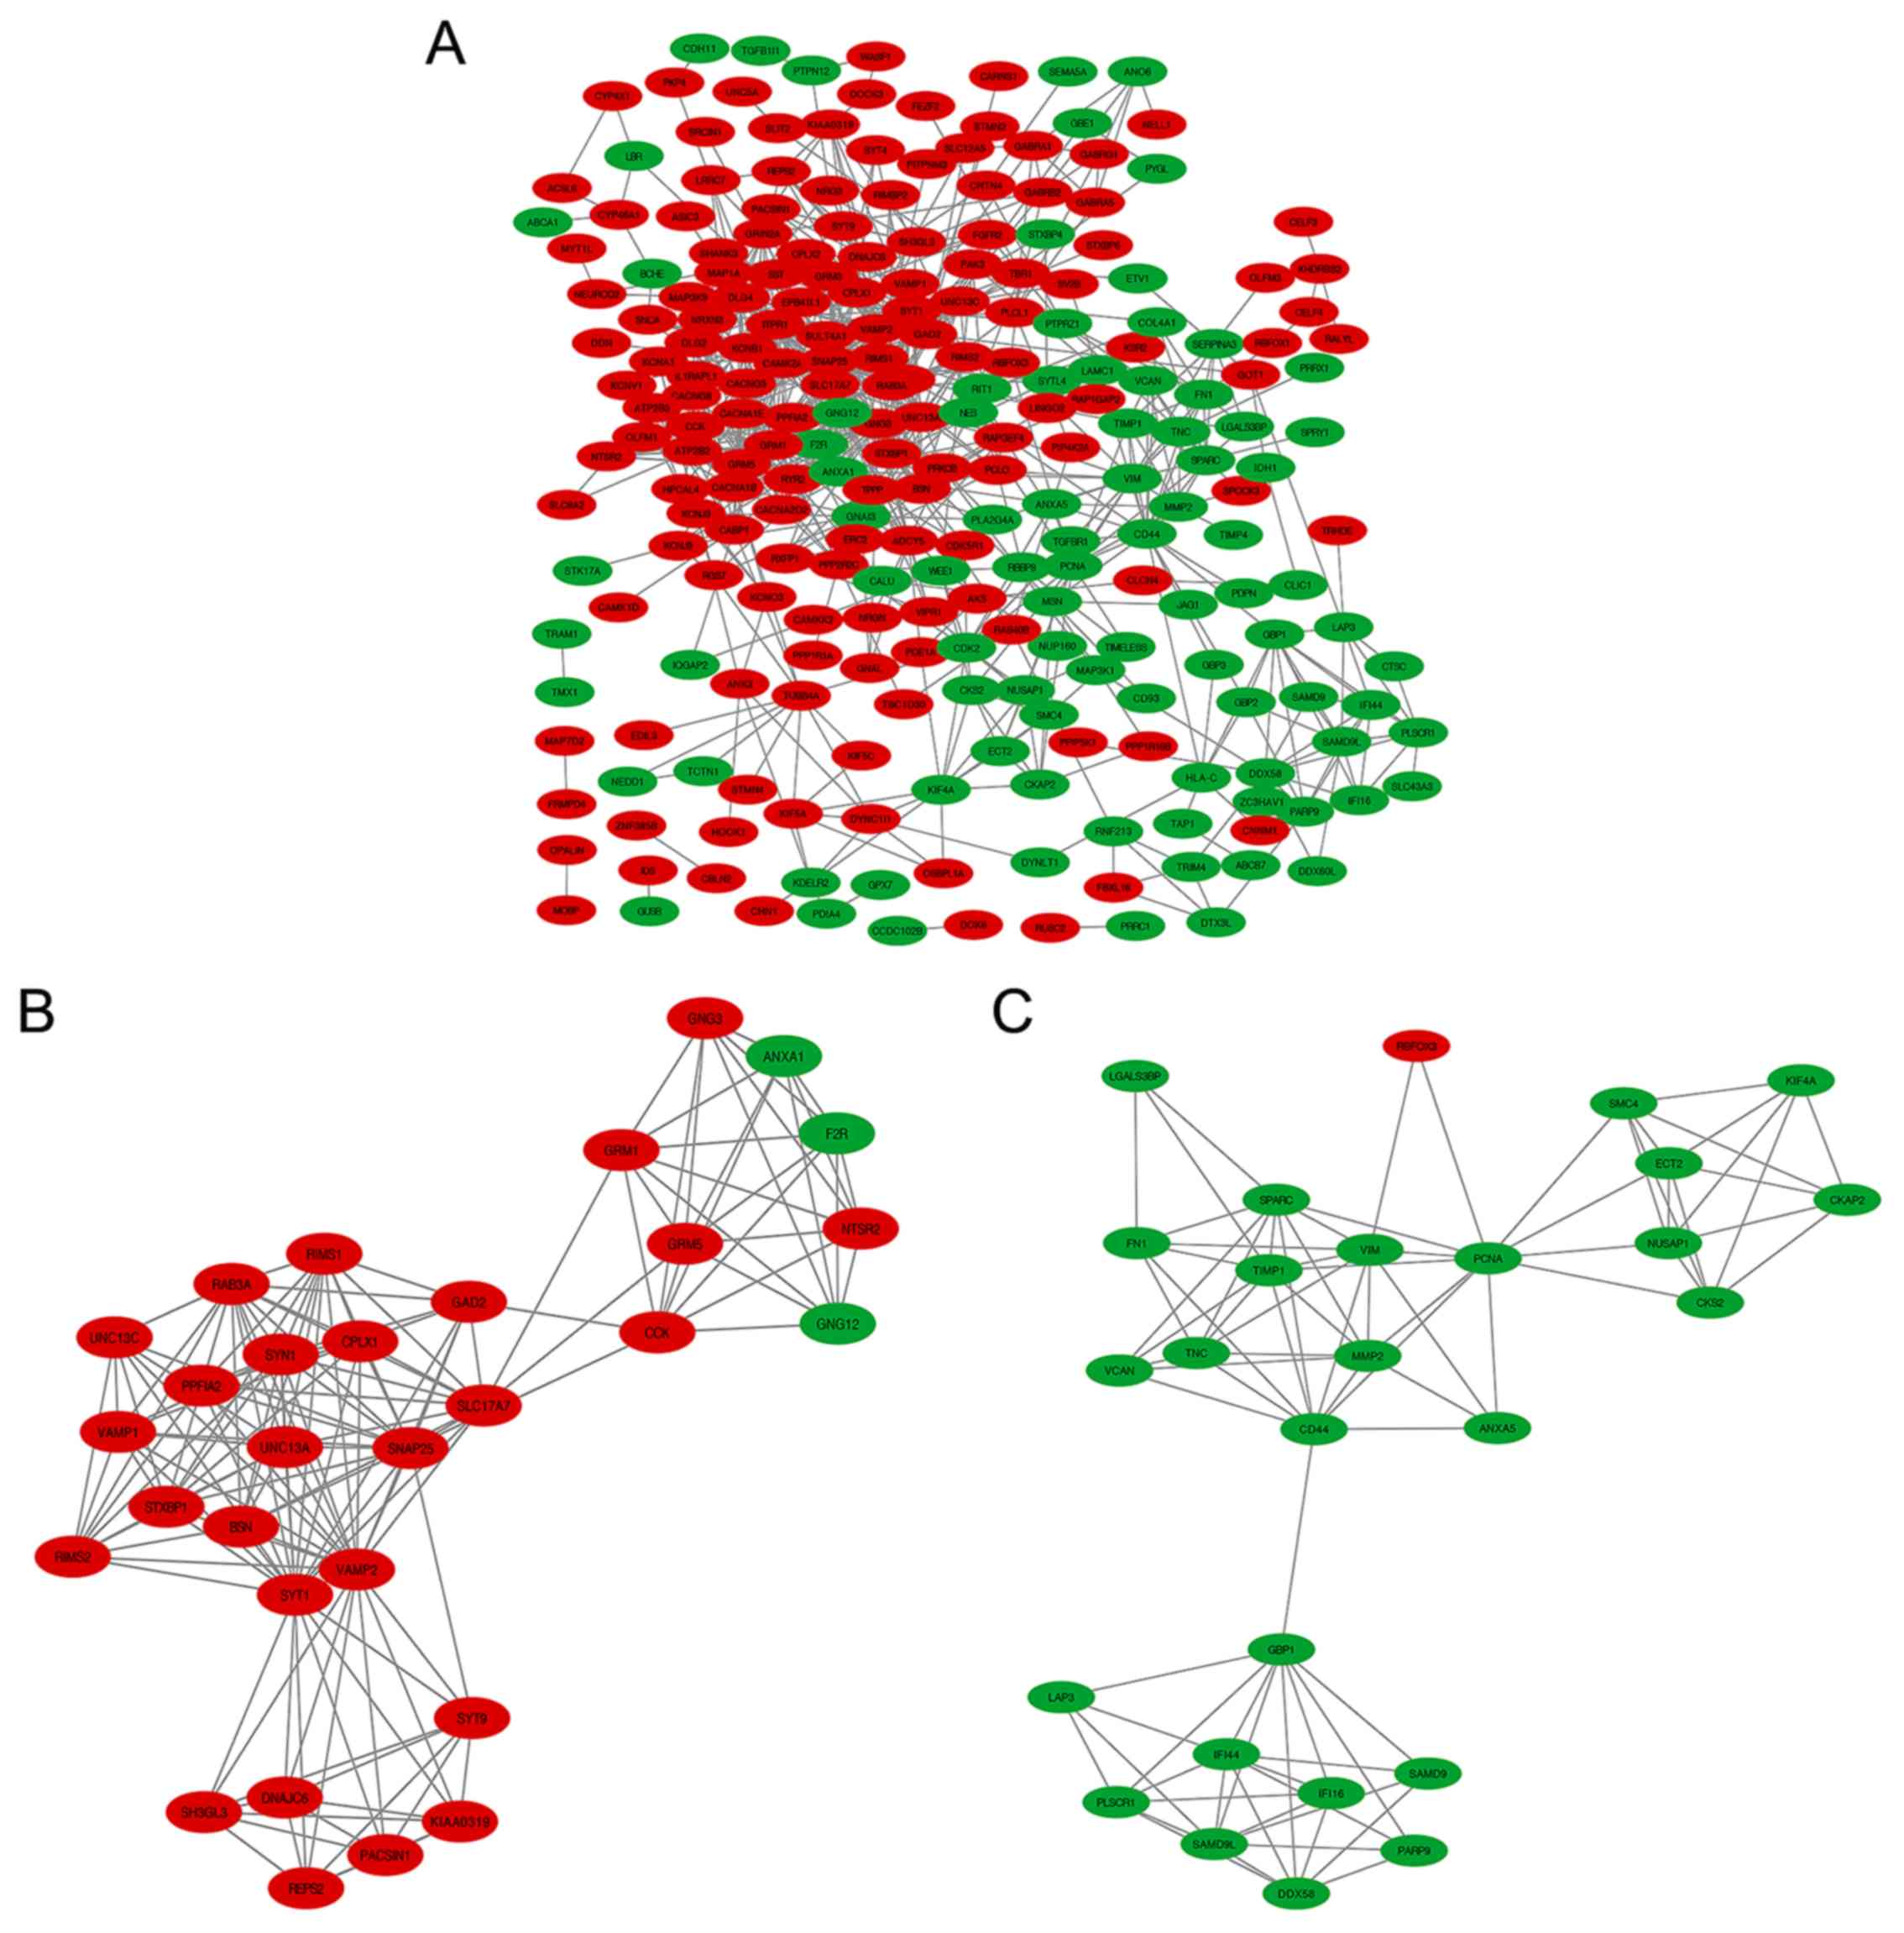
Identification of key candidate genes
and pathways using DEGs PPI network and module analysis
Using Cytoscape software and the STRING database
(34,35), 245 DEGs, including 92 downregulated
genes and 153 upregulated genes out of 378, were filtered into the
DEGs PPI network complex containing 245 nodes and 741 edges
(Fig. 5A). Another 133 genes out of
the 378 commonly altered DEGs failed to fall into the DEGs PPI
network. The identification of 35 hub genes among 245 nodes was
successfully achieved by filtering nodes with >11 degrees (also
known as interactions or connections; Table I). Additionally, the 10 most vital
nodes with >11 degrees were DLG4, SYT1, SNAP251, VAMP2, CACNA1B,
SYN1, GNG3, GNG12, CD44 and GNAI3. Based on the degree of
importance, two significant modules in the PPI network complex were
collected for further analysis using the MCODE plugin. GO and
pathway enrichment analyses revealed that 30 nodes and 152 edges
existed in Module 1 (Fig. 5B and
Table V), which were mainly
associated with neurotransmitter secretion, plasma membrane,
syntaxin-1 binding and the synaptic vesicle cycle. In addition,
Module 2 included 27 nodes and 86 edges (Fig. 5C and Table
V), mainly associated with extracellular matrix (ECM)
organization, cytoplasm, protein binding and ECM-receptor
interaction.
| Table V.GO and pathway enrichment analysis of
Module 1 and Module 2 gene functions. |
Table V.
GO and pathway enrichment analysis of
Module 1 and Module 2 gene functions.
| Term | Description | Count | P-value |
|---|
| A, Module 1 |
|
GO:0007269 (biological
process) | Neurotransmitter
secretion | 11 |
4.99×10⁻¹⁹ |
|
GO:0005886 (cellular
component) | Plasma
membrane | 19 |
5.79×10⁻⁶ |
|
GO:0017075 (molecular
function) | Syntaxin-1
binding | 6 |
8.77×10⁻¹¹ |
|
hsa04721 (KEGG pathway) | Synaptic vesicle
cycle | 10 |
3.74×10⁻¹⁴ |
|
| B, Module 2 |
|
|
GO:0030198 (biological
process) | ECM
organization | 5 |
1.88×10⁻⁴ |
|
GO:0005737 (cellular
component) | Cytoplasm | 17 |
4.80×10⁻⁴ |
|
GO:0005515 (molecular
function) | Protein
binding | 20 |
2.38×10⁻³ |
|
hsa04512 (KEGG pathway) | ECM-receptor
interaction | 3 |
6.60×10⁻³ |
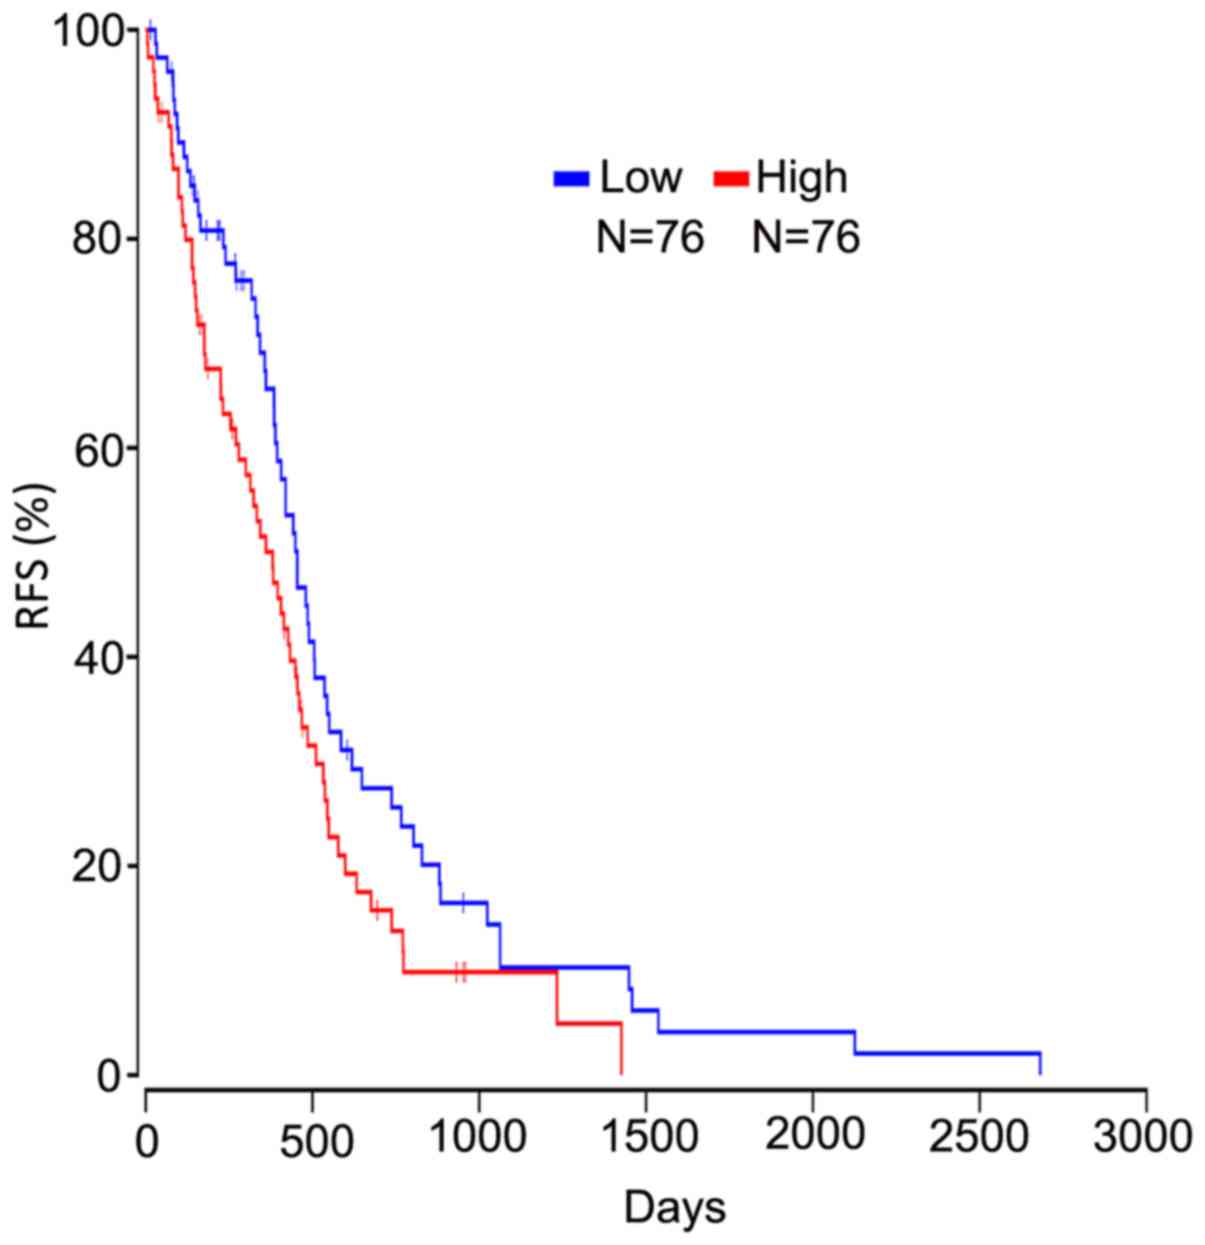
Survival analysis of hub genes
Based on the OncoLnc database, it was demonstrated
that high calcium-binding protein 1 (CABP1) expression was
negatively associated with the RFS of patients with GBM (Fig. 6).
Validation of the DEGs in the TCGA
dataset
To confirm the reliability of the identified DEGs
from the 3 datasets, the TCGA GBM dataset was downloaded and
analyzed using the same strategy used in the current study. A total
of 195 of the 240 upregulated genes identified in the present study
were also overexpressed in the TCGA GBM dataset, whilst 123 of the
138 downregulated genes identified in the current study were also
downregulated in the TCGA GBM dataset (data not shown). The total
consistency of the up- and downregulated genes was 84.13%,
suggesting that the results of the identified candidate genes are
reliable.
Discussion
In the current study, a total of 378 genes were
identified, including 240 upregulated genes and 138 downregulated
genes. Almost all the DEGs obtained in the training set were
verified by the validation set. The GO biological process analysis
revealed that the upregulated DEGs were significantly associated
with chemical synaptic transmission and nervous system development,
while downregulated DEGs were significantly associated with cell
adhesion, cell division, positive regulation of gene expression and
the innate immune response. The onset and progression of GBM are
associated with a complex network of cellular components, molecular
functions and biological processes (38,39). For
chemical synaptic transmission, available data demonstrated that
neurotransmitters can influence the proliferation, quiescence and
differentiation status of central nervous system-resident cells
(40). Furthermore, the disruption
of cell adhesion and the cell cycle were demonstrated to often be
involved in the development of GBM (41). A study also revealed that the
expression of pro-inflammatory and suppressive cytokines associated
with the innate immune response changed significantly (42).
Among the DEGs, two co-expression modules comprising
30 and 27 genes, respectively, and 35 hub genes were identified
using Cytoscape MCODE. Module 1 was associated with
neurotransmitter secretion, plasma membrane, syntaxin-1 binding and
the synaptic vesicle cycle, while Module 2 was associated with ECM
organization, cytoplasm, protein binding and ECM-receptor
interaction. Following identification of the hub genes,
Kaplan-Meier analysis of hub genes revealed that increased
expression of CABP1 was negatively associated with RFS. Therefore,
CABP1 may be a key gene, and its associated biological processes
may be a crucial mechanism of GBM progression. Additionally, all
enriched GO terms and Kyoto Encyclopedia of Genes and Genomes
(KEGG) pathways may participate in mechanisms underlying GBM
occurrence and progression, thus further study is required.
CABP1 is a protein-coding gene located on chromosome
12q24.31 (43). The protein encoded
by this gene can regulate the gating of L-type Ca2+
channels by inhibiting calcium-dependent inactivation via the
voltage-dependent L-type calcium channel subunit-α1C to control
neurotransmitter release, gene expression, muscle contraction,
apoptosis, and disease processes (44). In addition, CABP1 can regulate the
calcium-dependent activity of inositol 1,4,5-triphosphate
receptors, P/Q-type voltage-gated calcium channels and the
transient receptor potential channel, short transient receptor
potential channel 5 (43). A study
identified that CABP1 is involved in drug refractory epilepsy due
to mesial temporal sclerosis, providing important insight into the
understanding of the genomic basis of the condition (45). CABP1 was observed to be significantly
upregulated during P. berghei infection (46). One study also demonstrated the
importance of CABP1 in modulating stimulus-secretion coupling in
excitable cells, and the ability of CABP1 to inhibit
Ca2+ currents and exocytosis in bovine chromaffin cells
(47). Thus, it is speculated that
CABP1 works as a Ca2+-dependent regulator in GBM and may
help to predict the prognosis of patients with GBM. However, CABP1
has rarely been studied in the field of oncology. Certain studies
have demonstrated that aberrant CABP1 expression was associated
with adenoma risk, particularly for multiple/advanced adenomas
(44,48,49). In
addition, Zhang et al (50)
previously reported that CABP1 is upregulated in glioblastoma
tissues compared with normal brain tissues. Using Cox regression
analysis and log-rank test, CABP1 was identified to be one of the
top six DEGs associated with GBM prognosis, where high CABP1
expression is negatively correlated with overall patient survival.
However, the molecular underlying the role of CABP1 in the
development and progression of GBM remains unknown. To the best of
our knowledge, no previous study has investigated CABP1 in GBM.
In the present study, three datasets generated from
Turkish, Swiss and American patients were used to represent three
subsets of worldwide populations. Certain genes and small
non-coding RNA molecules exhibit abnormal expression patterns in
GBM (6). However, genes and
biomarkers from different races vary widely (51), which may account for the low
consistency of the DEGs from the three datasets.
To conclude, the current study identified a total of
378 DEGs. Among them, two co-expression modules and 35 hub genes
were identified. The enriched GO terms and KEGG pathways may be
closely associated with GBM occurrence. CABP1 may be a key gene
associated with the prognosis of GBM. Altogether, these data
introduced CABP1 as a good candidate for experimental studies into
GBM. However, clinical experiments are urgently needed to evaluate
the molecular role of CABP1 in GBM progression, as well as its
specificity and sensitivity as a biomarker of GBM. Therefore, the
molecular mechanisms and clinical applications of these genes and
pathways require exploration in future studies.
Acknowledgements
The authors would like to thank Dr Sajan Pandey,
Department of Neurosurgery, Shanghai Tenth People's Hospital,
Tongji University School of Medicine (Shanghai, China) for his
technical help and writing assistance.
Funding
The current study was supported by a grant given to
Professor Liang Gao from the Health and Family Planning Commission
(grant no. 03.02.16.001).
Availability of data and material
The datasets generated and/or analyzed during the
current study are available in the NCBI-Gene Expression Omnibus
(NCBI-GEO; http://www.ncbi.nlm.nih.gov/geo) database.
Authors' contributions
DC and LG conceived and designed the study. LL, XM,
XD, TJ, PH, RW and HQ collected the data and performed data
analysis. DC, XL and LL interpreted the result. LL and XL were
major contributors in writing the manuscript. LG and XL revised the
paper. All authors read and approved the final manuscript.
Ethics approval and consent to
participate
The local ethics committee of Shanghai Tenth
People's Hospital provided the ethical approval for the study.
Patient consent for publication
Not applicable.
Competing interests
The authors declare that they have no competing
interests.
Glossary
Abbreviations
Abbreviations:
|
GBM
|
glioblastoma
|
|
DEGs
|
differentially expressed genes
|
|
PPI
|
protein-protein interaction
network
|
|
HGGs
|
high-grade gliomas
|
|
DIPG
|
diffuse intrinsic pontine glioma
|
|
GO
|
Gene Ontology
|
|
RFS
|
relapse-free survival
|
References
|
1
|
Wen WS, Hu SL, Ai Z, Mou L, Lu JM and Li
S: Methylated of genes behaving as potential biomarkers in
evaluating malignant degree of glioblastoma. J Cell Physiol.
232:3622–3630. 2017. View Article : Google Scholar : PubMed/NCBI
|
|
2
|
Yano S, Miwa S, Kishimoto H, Toneri M,
Hiroshima Y, Yamamoto M, Bouvet M, Urata Y, Tazawa H, Kagawa S, et
al: Experimental curative fluorescence-guided surgery of highly
invasive glioblastoma multiforme selectively labeled with a
killer-reporter adenovirus. Mol Ther. 23:1182–1188. 2015.
View Article : Google Scholar : PubMed/NCBI
|
|
3
|
Stupp R, Taillibert S, Kanner A, Read W,
Steinberg D, Lhermitte B, Toms S, Idbaih A, Ahluwalia MS, Fink K,
et al: Effect of tumor-treating fields plus maintenance
temozolomide vs maintenance temozolomide alone on survival in
patients with glioblastoma: A randomized clinical trial. JAMA.
318:2306–2316. 2017. View Article : Google Scholar : PubMed/NCBI
|
|
4
|
Stupp R, Mason WP, van den Bent MJ, Weller
M, Fisher B, Taphoorn MJ, Belanger K, Brandes AA, Marosi C, Bogdahn
U, et al: Radiotherapy plus concomitant and adjuvant temozolomide
for glioblastoma. N Engl J Med. 352:987–996. 2005. View Article : Google Scholar : PubMed/NCBI
|
|
5
|
Ostrom QT, Bauchet L, Davis FG, Deltour I,
Fisher JL, Langer CE, Pekmezci M, Schwartzbaum JA, Turner MC, Walsh
KM, et al: The epidemiology of glioma in adults: A ‘state of the
science’ review. Neuro Oncol. 16:896–913. 2014. View Article : Google Scholar : PubMed/NCBI
|
|
6
|
Zeng T, Li L, Zhou Y and Gao L: Exploring
long noncoding RNAs in glioblastoma: Regulatory mechanisms and
clinical potentials. Int J Genomics. 2018:28959582018. View Article : Google Scholar : PubMed/NCBI
|
|
7
|
Filbin MG and Suvà ML: Gliomas genomics
and epigenomics: Arriving at the start and knowing it for the first
time. Annu Rev Pathol. 11:497–521. 2016. View Article : Google Scholar : PubMed/NCBI
|
|
8
|
Stupp R, Hegi ME, Gilbert MR and
Chakravarti A: Chemoradiotherapy in malignant glioma: Standard of
care and future directions. J Clin Oncol. 25:4127–4136. 2007.
View Article : Google Scholar : PubMed/NCBI
|
|
9
|
Delgado-López PD and Corrales-García EM:
Survival in glioblastoma: A review on the impact of treatment
modalities. Clin Transl Oncol. 18:1062–1071. 2016. View Article : Google Scholar : PubMed/NCBI
|
|
10
|
Lim M, Xia Y, Bettegowda C and Weller M:
Current state of immunotherapy for glioblastoma. Nat Rev Clin
Oncol. 15:422–442. 2018. View Article : Google Scholar : PubMed/NCBI
|
|
11
|
Chinot OL, Wick W, Mason W, Henriksson R,
Saran F, Nishikawa R, Carpentier AF, Hoang-Xuan K, Kavan P, Cernea
D, et al: Bevacizumab plus radiotherapy-temozolomide for newly
diagnosed glioblastoma. N Engl J Med. 370:709–722. 2014. View Article : Google Scholar : PubMed/NCBI
|
|
12
|
Furnari FB, Cloughesy TF, Cavenee WK and
Mischel PS: Heterogeneity of epidermal growth factor receptor
signalling networks in glioblastoma. Nat Rev Cancer. 15:302–310.
2015. View
Article : Google Scholar : PubMed/NCBI
|
|
13
|
Ludwig K and Kornblum HI: Molecular
markers in glioma. J Neurooncol. 134:505–512. 2017. View Article : Google Scholar : PubMed/NCBI
|
|
14
|
Yan Y, Xu Z, Li Z, Sun L and Gong Z: An
insight into the increasing role of LncRNAs in the pathogenesis of
gliomas. Front Mol Neurosci. 10:532017. View Article : Google Scholar : PubMed/NCBI
|
|
15
|
Sturm D, Bender S, Jones DT, Lichter P,
Grill J, Becher O, Hawkins C, Majewski J, Jones C, Costello JF, et
al: Paediatric and adult glioblastoma: Multiform (epi)genomic
culprits emerge. Nat Rev Cancer. 14:92–107. 2014. View Article : Google Scholar : PubMed/NCBI
|
|
16
|
Vogelstein B, Papadopoulos N, Velculescu
VE, Zhou S, Diaz LA Jr and Kinzler KW: Cancer genome landscapes.
Science. 339:1546–1558. 2013. View Article : Google Scholar : PubMed/NCBI
|
|
17
|
Long H, Liang C, Zhang X, Fang L, Wang G,
Qi S, Huo H and Song Y: Prediction and analysis of key genes in
glioblastoma based on bioinformatics. Biomed Res Int.
2017:76531012017. View Article : Google Scholar : PubMed/NCBI
|
|
18
|
Huang SW, Ali ND, Zhong L and Shi J:
MicroRNAs as biomarkers for human glioblastoma: Progress and
potential. Acta Pharmacol Sin. 39:1405–1413. 2018. View Article : Google Scholar : PubMed/NCBI
|
|
19
|
Tan SY, Sandanaraj E, Tang C and Ang BT:
Biobanking: An important resource for precision medicine in
glioblastoma. Adv Exp Med Biol. 951:47–56. 2016. View Article : Google Scholar : PubMed/NCBI
|
|
20
|
Guo Y, Bao Y, Ma M and Yang W:
Identification of key candidate genes and pathways in colorectal
cancer by integrated bioinformatical analysis. Int J Mol Sci.
18:E7222017. View Article : Google Scholar : PubMed/NCBI
|
|
21
|
Tanwar MK, Gilbert MR and Holland EC: Gene
expression microarray analysis reveals YKL-40 to be a potential
serum marker for malignant character in human glioma. Cancer Res.
62:4364–4368. 2002.PubMed/NCBI
|
|
22
|
Kunkle B, Yoo C and Roy D: Discovering
gene-environment interactions in glioblastoma through a
comprehensive data integration bioinformatics method.
Neurotoxicology. 35:1–14. 2013. View Article : Google Scholar : PubMed/NCBI
|
|
23
|
Li W, Li K, Zhao L and Zou H:
Bioinformatics analysis reveals disturbance mechanism of MAPK
signaling pathway and cell cycle in Glioblastoma multiforme. Gene.
547:346–350. 2014. View Article : Google Scholar : PubMed/NCBI
|
|
24
|
Griesinger AM, Birks DK, Donson AM, Amani
V, Hoffman LM, Waziri A, Wang M, Handler MH and Foreman NK:
Characterization of distinct immunophenotypes across pediatric
brain tumor types. J Immunol. 191:4880–4888. 2013. View Article : Google Scholar : PubMed/NCBI
|
|
25
|
Gulluoglu S, Tuysuz EC, Sahin M, Kuskucu
A, Kaan Yaltirik C, Ture U, Kucukkaraduman B, Akbar MW, Gure AO,
Bayrak OF and Dalan AB: Simultaneous miRNA and mRNA transcriptome
profiling of glioblastoma samples reveals a novel set of OncomiR
candidates and their target genes. Brain Res. 1700:199–210. 2018.
View Article : Google Scholar : PubMed/NCBI
|
|
26
|
Bady P, Diserens AC, Castella V, Kalt S,
Heinimann K, Hamou MF, Delorenzi M and Hegi ME: DNA fingerprinting
of glioma cell lines and considerations on similarity measurements.
Neuro Oncol. 14:701–711. 2012. View Article : Google Scholar : PubMed/NCBI
|
|
27
|
Sciuscio D, Diserens AC, van Dommelen K,
Martinet D, Jones G, Janzer RC, Pollo C, Hamou MF, Kaina B, Stupp
R, et al: Extent and patterns of MGMT promoter methylation in
glioblastoma- and respective glioblastoma-derived spheres. Clin
Cancer Res. 17:255–266. 2011. View Article : Google Scholar : PubMed/NCBI
|
|
28
|
Barrett T, Wilhite SE, Ledoux P,
Evangelista C, Kim IF, Tomashevsky M, Marshall KA, Phillippy KH,
Sherman PM, Holko M, et al: NCBI GEO: Archive for functional
genomics data sets-update. Nucleic Acids Res. 41:D991–D995. 2013.
View Article : Google Scholar : PubMed/NCBI
|
|
29
|
He WQ, Gu JW, Li CY, Kuang YQ, Kong B,
Cheng L, Zhang JH, Cheng JM and Ma Y: The PPI network and clusters
analysis in glioblastoma. Eur Rev Med Pharmacol Sci. 19:4784–4790.
2015.PubMed/NCBI
|
|
30
|
Li Y, Min W, Li M, Han G, Dai D, Zhang L,
Chen X, Wang X, Zhang Y, Yue Z and Liu J: Identification of hub
genes and regulatory factors of glioblastoma multiforme subgroups
by RNA-seq data analysis. Int J Mol Med. 38:1170–1178. 2016.
View Article : Google Scholar : PubMed/NCBI
|
|
31
|
Wei B, Wang L, Du C, Hu G, Wang L, Jin Y
and Kong D: Identification of differentially expressed genes
regulated by transcription factors in glioblastomas by
bioinformatics analysis. Mol Med Rep. 11:2548–2554. 2015.
View Article : Google Scholar : PubMed/NCBI
|
|
32
|
Huang da W, Sherman BT and Lempicki RA:
Systematic and integrative analysis of large gene lists using DAVID
bioinformatics resources. Nat Protoc. 4:44–57. 2009. View Article : Google Scholar : PubMed/NCBI
|
|
33
|
Huang da W, Sherman BT and Lempicki RA:
Bioinformatics enrichment tools: Paths toward the comprehensive
functional analysis of large gene lists. Nucleic Acids Res.
37:1–13. 2009. View Article : Google Scholar : PubMed/NCBI
|
|
34
|
Franceschini A, Szklarczyk D, Frankild S,
Kuhn M, Simonovic M, Roth A, Lin J, Minguez P, Bork P, von Mering C
and Jensen LJ: STRING v9.1: Protein-protein interaction networks,
with increased coverage and integration. Nucleic Acids Res.
41:D808–D815. 2013. View Article : Google Scholar : PubMed/NCBI
|
|
35
|
Chen WJ, Tang RX, He RQ, Li DY, Liang L,
Zeng JH, Hu XH, Ma J, Li SK and Chen G: Clinical roles of the
aberrantly expressed lncRNAs in lung squamous cell carcinoma: A
study based on RNA-sequencing and microarray data mining.
Oncotarget. 8:61282–61304. 2017.PubMed/NCBI
|
|
36
|
Scardoni G, Petterlini M and Laudanna C:
Analyzing biological network parameters with CentiScaPe.
Bioinformatics. 25:2857–2859. 2009. View Article : Google Scholar : PubMed/NCBI
|
|
37
|
Anaya J: OncoLnc: Linking TCGA survival
data to mRNAs, miRNAs, and lncRNAs. Peer J Computer Sci. 2:e672016.
View Article : Google Scholar
|
|
38
|
Iser IC, Pereira MB, Lenz G and Wink MR:
The epithelial- to-mesenchymal transition-like process in
glioblastoma: An updated systematic review and in silico
investigation. Med Res Rev. 37:271–313. 2017. View Article : Google Scholar : PubMed/NCBI
|
|
39
|
Alshabi AM, Vastrad B, Shaikh IA and
Vastrad C: Identification of crucial candidate genes and pathways
in glioblastoma multiform by bioinformatics analysis. Biomolecules.
9:E2012019. View Article : Google Scholar : PubMed/NCBI
|
|
40
|
Caragher SP, Hall RR, Ahsan R and Ahmed
AU: Monoamines in glioblastoma: Complex biology with therapeutic
potential. Neuro Oncol. 20:1014–1025. 2018. View Article : Google Scholar : PubMed/NCBI
|
|
41
|
Cheng YC, Tsai WC, Sung YC, Chang HH and
Chen Y: Interference with PSMB4 expression exerts an anti-tumor
effect by decreasing the invasion and proliferation of human
glioblastoma cells. Cell Physiol Biochem. 45:819–831. 2018.
View Article : Google Scholar : PubMed/NCBI
|
|
42
|
Turkowski K, Brandenburg S, Mueller A,
Kremenetskaia I, Bungert AD, Blank A, Felsenstein M and Vajkoczy P:
VEGF as a modulator of the innate immune response in glioblastoma.
Glia. 66:161–174. 2018. View Article : Google Scholar : PubMed/NCBI
|
|
43
|
Li C, Chan J, Haeseleer F, Mikoshiba K,
Palczewski K, Ikura M and Ames JB: Structural insights into
Ca2+-dependent regulation of inositol
1,4,5-trisphosphate receptors by CaBP1. J Biol Chem. 284:2472–2481.
2009. View Article : Google Scholar : PubMed/NCBI
|
|
44
|
Oz S, Tsemakhovich V, Christel CJ, Lee A
and Dascal N: CaBP1 regulates voltage-dependent inactivation and
activation of Ca(V)1.2 (L-type) calcium channels. J Biol Chem.
286:13945–13953. 2011. View Article : Google Scholar : PubMed/NCBI
|
|
45
|
Dixit AB, Banerjee J, Srivastava A,
Tripathi M, Sarkar C, Kakkar A, Jain M and Chandra PS: RNA-seq
analysis of hippocampal tissues reveals novel candidate genes for
drug refractory epilepsy in patients with MTLE-HS. Genomics.
107:178–188. 2016. View Article : Google Scholar : PubMed/NCBI
|
|
46
|
Mubaraki MA, Hafiz TA, Al-Quraishy S and
Dkhil MA: Oxidative stress and genes regulation of cerebral malaria
upon Zizyphus spina-christi treatment in a murine model. Microb
Pathog. 107:69–74. 2017. View Article : Google Scholar : PubMed/NCBI
|
|
47
|
Chen ML, Chen YC, Peng IW, Kang RL, Wu MP,
Cheng PW, Shih PY, Lu LL, Yang CC and Pan CY: Ca2+
binding protein-1 inhibits Ca2+ currents and exocytosis in bovine
chromaffin cells. J Biomed Sci. 15:169–181. 2008. View Article : Google Scholar : PubMed/NCBI
|
|
48
|
Zhao J, Zhu X, Shrubsole MJ, Ness RM,
Hibler EA, Cai Q, Long J, Chen Z, Jiang M, Kabagambe EK, et al:
Interactions between calcium intake and polymorphisms in genes
essential for calcium reabsorption and risk of colorectal neoplasia
in a two-phase study. Mol Carcinog. 56:2258–2266. 2017. View Article : Google Scholar : PubMed/NCBI
|
|
49
|
Sun P, Shrubsole MJ, Ness RM, Cai Q, Long
J, Edwards T, Chen Z, Zhu X, Deng X, Luo J, et al: Calcium intake,
CABP1 polymorphisms, and the risk of colorectal adenoma: Results
from Tennessee Colorectal Polyp Study. Cancer Res. 71 (Suppl
8):S37632011.
|
|
50
|
Zhang Y, Xu J and Zhu X: A 63 signature
genes prediction system is effective for glioblastoma prognosis.
Int J Mol Med. 41:2070–2078. 2018.PubMed/NCBI
|
|
51
|
Delfino KR, Serão NV, Southey BR and
Rodriguez-Zas SL: Therapy-, gender- and race-specific microRNA
markers, target genes and networks related to glioblastoma
recurrence and survival. Cancer Genomics Proteomics. 8:173–183.
2011.PubMed/NCBI
|