Introduction
Diabetes places a continuous burden on public health
worldwide, partially attributable to the global rise in obesity and
a sedentary lifestyle. Its prevalence in adults has doubled in the
past 35 years. An estimated 3.7 million deaths were caused by
diabetes, or its associated complications, in 2012, and it is
estimated by the World Health Organization (WHO) to become the 7th
leading cause of mortality by 2030 (1). Type 2 diabetes mellitus (T2DM) accounts
for the majority of cases, and is also an independent risk factor
for macrovascular complications, including cardiovascular disease
(CVD), particularly for females (2).
CVD is the leading cause of morbidity and mortality for individuals
with diabetes and results in 30% of all deaths, with this figure
expected to increase in the next 10 years (2,3).
Although the underlying mechanisms through which diabetes increases
the likelihood of CVD remain to be fully elucidated, abundant
evidence has assured an association between these two factors,
beginning with the Framingham study (1). Of note, eliminating obesity and
unhealthy diets, in addition to increasing physical activity can
prevent ~80% of heart disease, stroke, and diabetes mellitus
(2). Therefore, it is essential to
identify patients with an elevated risk of CVD, and individuals who
present with CVD may also benefit from early intervention to avoid
recurrences. The present study aimed to identify a marker linked to
the progression of diabetes and distinguish individuals with T2DM
with an elevated risk for CVD.
Sphingolipids are a class of lipids sharing a
backbone of sphingoid bases, which have diverse effects on
diabetes, cancer and CVD at the intra- and extracellular level.
Sphingoanine (Sa) is produced by the conjugation of the amino acid
serine with the fatty acid palmitoyl coenzyme A (CoA) in the
presence of a rate-limiting enzyme (serine palmitoyl transferase;
SPT), and is then further converted into dihydroceramide. After
dehydrogenation, the key intermediate of the sphingolipid
biosynthetic pathway, ceramide (Cer), is formed. Once Cer is
transferred from the endoplasmic reticulum to the Golgi complex by
specialized carrier proteins, different types of complex
sphingolipids are generated, including sphingomyelin (SM), lactosyl
ceramides (LacCer), sphingosine (So) and sphingosine-1-phosphate
(So1P). It has been indicated that sphingolipids have a role in
glucose homeostasis and metabolic disorders (4). In diabetic patients, an accumulation of
adipose sphingolipids compared with that in body mass index
(BMI)-matched non-diabetic individuals was detected (5,6).
Saturated fatty acids, including palmitate, may stimulate the
aforementioned sphingolipid biosynthetic pathway, which partly
explains why increased sphingolipid levels were observed in
patients with metabolic syndrome and obesity (7). Furthermore, upregulation of Cer is
associated with insulin resistance, as a reversal of insulin
resistance was achieved when SPT was inhibited in a murine model of
obesity (8). It was underscored that
conversion of the elevated Cer to So1P is critical to improving
insulin resistance and cardiac dysfunction (9). So1P also has important roles in
vasoconstriction and vasorelaxation through different endothelial
cell receptors, and appears to be involved in thrombosis and
hemostasis (10). An inverse
association between atherosclerotic disease and So1P has been
validated in humans (11). Another
member of the sphingolipid family, plasma SM, was reported to be
correlated with CVD, although this has not been widely confirmed.
Of note, the current knowledge of sphingolipid metabolism in the
field of diabetes and CVD is limited.
Therefore, the present study aimed to explore
sphingolipid metabolism during the progression of T2DM, and to
investigate whether sphingolipids may serve as biomarkers for the
progression of diabetes and as indicators for an elevated risk of
CVD in patients with diabetes.
Materials and methods
Subjects
A total of 408 Chinese patients admitted to the
First Affiliated Hospital of Xi'an Jiaotong University (Xi'an,
China) between January 2016 and January 2017 were recruited to
investigate the sphingolipid metabolite profiles (mean age at
recruitment, 47.1; 60.4% males). The different groups were matched
for age, sex and BMI. The exclusion criteria were liver or kidney
failure and coagulant disorders. A total of 69 patients who had
these disorders or missing laboratory/clinical data were excluded.
Thus, the final study population consisted of 202 patients with
T2DM, 25 individuals with pre-diabetes (pre-DM) and 112 healthy
controls who underwent a yearly health examination (all patients
were aged 18–80 years). Peripheral blood samples were drawn at the
initial medical examination, in the morning after a fast of at
least 8 h, and immediately stored at −80°C until the sphingolipid
measurements were performed. To rule out the potential influence of
platelet activity, sex, age and BMI on the concentration of
sphingolipids, participants were instructed not to smoke, perform
any intensive physical activity or take any medication, including
aspirin, prior to blood collection. The cohort was sex-, age- and
BMI-matched. The present study complied with the Declaration of
Helsinki and was approved by the Ethics Committees of the First
Affiliated Hospital of Xi'an Jiaotong University (Xi'an, China).
The participants enrolled in the study provided written informed
consent.
Diagnostic criteria
A waist circumference (WC) ≥90 cm in males and ≥85
cm in females is defined as central obesity according to the
guidelines of the Chinese Joint Committee for Developing Chinese
Guidelines (12). According to the
Working Group on Obesity in China, 24 kg/m2≤BMI<28
kg/m2 and BMI≥28 kg/m2 are considered as
overweight and obesity, respectively (13). T2DM was diagnosed if any of the
following criteria were satisfied: i) Fasting plasma glucose (FPG)
≥7.0 mmol/l; ii) 2 h plasma glucose (2hPG) ≥11.1 mmol/l; iii)
glycated hemoglobin (HbA1c) level ≥6.5%; iv) random plasma glucose
≥11.1 mmol/l plus symptoms of hyperglycemia; v) T2DM diagnosed
previously. Pre-DM was defined as follows: FPG ≥5.6–6.9 mmol/l or
2hPG 7.8–11.0 mmol/l or HbA1c 5.7–6.4%. In the present study,
diabetes-associated cardiovascular complications referred to
ischemic heart disease, either newly diagnosed on admission or
already noted in medical records, excluding stroke and peripheral
disease. Hypertension was defined as systolic blood pressure
>140 mmHg, diastolic blood pressure >90 mmHg, or
self-reported use of anti-hypertensive medication. Cigarette
smoking was defined as the consumption of at least 100 cigarettes
in a patient's lifetime.
Clinical parameters
Blood pressure, WC, hip circumference (HC), body
weight and body height were measured by a trained physician,
following the standard protocol set by the WHO. The values of these
parameters were averaged from three measurements. The BMI was
calculated as weight over height squared (kg/m2). Body
fat (BF) was estimated by using the Clínica Universidad de
Navarra-Body Adiposity Estimator equation (14) and validated in a large population.
BF%=−44.988+(0.503 × age)+(10.689 × sex)+(3.172 × BMI)-(0.026 ×
BMI2)+(0.181 × BMI × sex)-(0.02 × BMI × age)-(0.005
×BMI2 × sex)+(0.00021 × BMI2 × age), where
male=0 and female=1 for sex, and age was entered in years. The
cut-off points for BF in the present study were as follows: BF
tertile 1, <28.31%; BF tertile 2, 28.31–34.18%; BF tertile 3,
>34.18%. The lean mass index (LMI) was calculated as follows:
LMI=(1-BF) × BMI. As there is still no reference of the LMI for the
Chinese population, the cut-off points for three equal groups in
the final study population were calculated (tertile 1, <15.91
kg/m2; tertile 2, 15.91–18.22 kg/m2; tertile
3, >18.22 kg/m2). HbA1c, high- and low-density
lipoprotein cholesterol, triglycerides (TG), total cholesterol and
uric acid were assessed by the clinical laboratory of the First
Affiliated Hospital of Xi'an Jiaotong University (Xi'an, China)
according to the standardized assay protocols.
Extraction and measurement of
sphingolipids
Blood samples were centrifuged at 200 × g for 10 min
at 4°C. Serum was aliquoted in 1.5-ml tubes and stored at −80°C
until sphingolipid assays were performed. Sphingolipid measurements
were performed according to a previously published protocol
(15). A total of 40 µl serum was
extracted using methanol/chloroform (17:83). Subsequently, Cer,
GluCer, LacCer, SM, Sa, Sa1P, So, So1P and each internal standard
(Avanti Polar Lipids) were analyzed by high-performance liquid
chromatography-tandem mass spectrometry.
Statistical analysis
Continuous data are presented as the mean ± standard
deviation. The Student's t-test and Kruskal-Wallis test were
applied to compare parameters between two groups and among multiple
groups, respectively. Categorical variables are expressed as the
frequency and percentage, and the Chi-square test, or Fisher's
exact test when appropriate, were used. Univariate and multivariate
logistic regression model analyses were performed to identify the
relevant sphingolipid metabolites in patients with T2DM.
Receiver-operator characteristic (ROC) curve analysis was applied
for certain sphingolipid metabolites in order to determine the
predictive ability for patients at higher risk of CVD. The ROC
curves displayed the sensitivity vs. 1-specificity values, and the
area under the ROC curve was provided. Two-sided P-values of
<0.05 were considered to indicate statistical significance.
Statistical analysis was performed with SPSS statistical software
25.0 (IBM Corp.). Scatter plots were created using GraphPad Prism
6.0 (GraphPad Software, Inc.).
Results
Serum sphingolipidomic analyses in
healthy controls
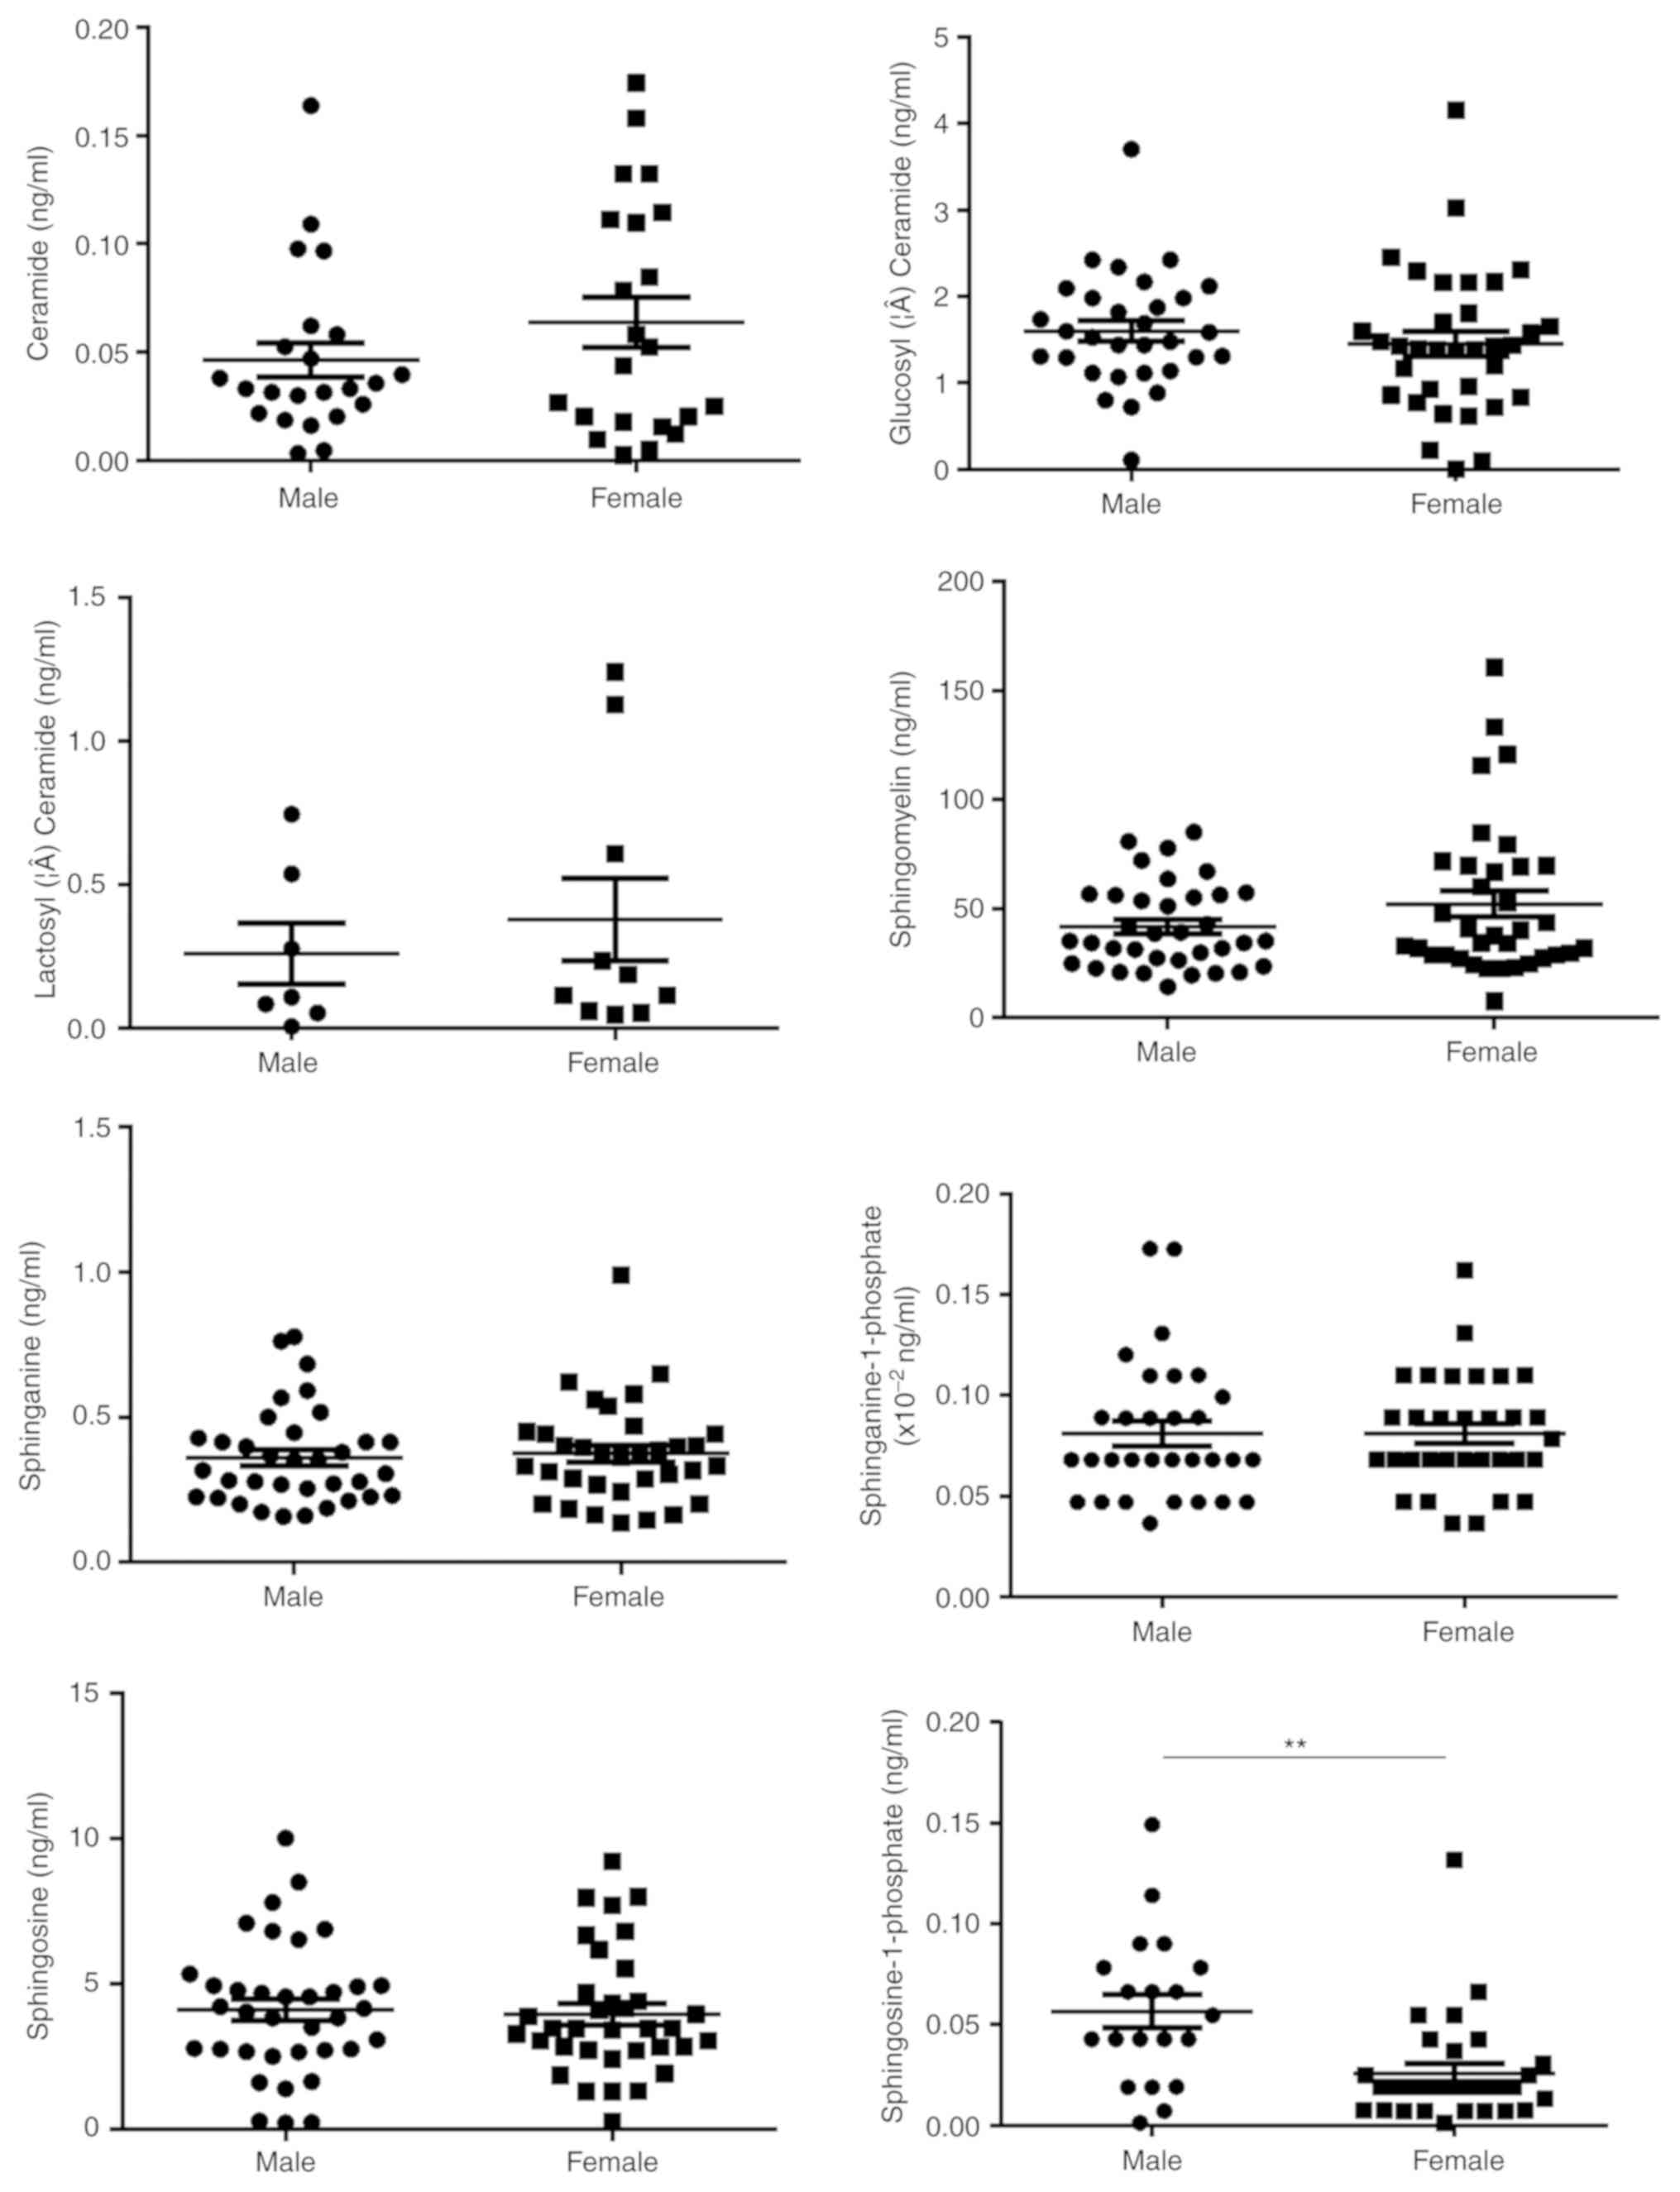
Sex, age and body composition have been previously
reported to be associated with certain sphingolipids, including So
and Cer, in various diseases. Therefore, the effects of age, sex
and four parameters commonly used to represent the body
composition, i.e. central obesity, BMI, LMI and BF, on the
concentration of serum sphingolipids were analyzed in 112 healthy
controls to rule out any potential confounding factors. These
patients were 22–76 years of age (mean age, 45.7±12.9 years)
without either hypertension or dyslipidemia, and about half of them
were females (Table SI). In
addition, a significant association between So1P and sex was
identified (Fig. 1). Serum So1P in
male participants was about two times as high as that in female
patients (So1P in males; 5.67±0.08×10⁻² ng/ml; and in
females, 2.57±0.05×10⁻² ng/ml; P<0.01). However, no
significant differences were observed in serum sphingolipids
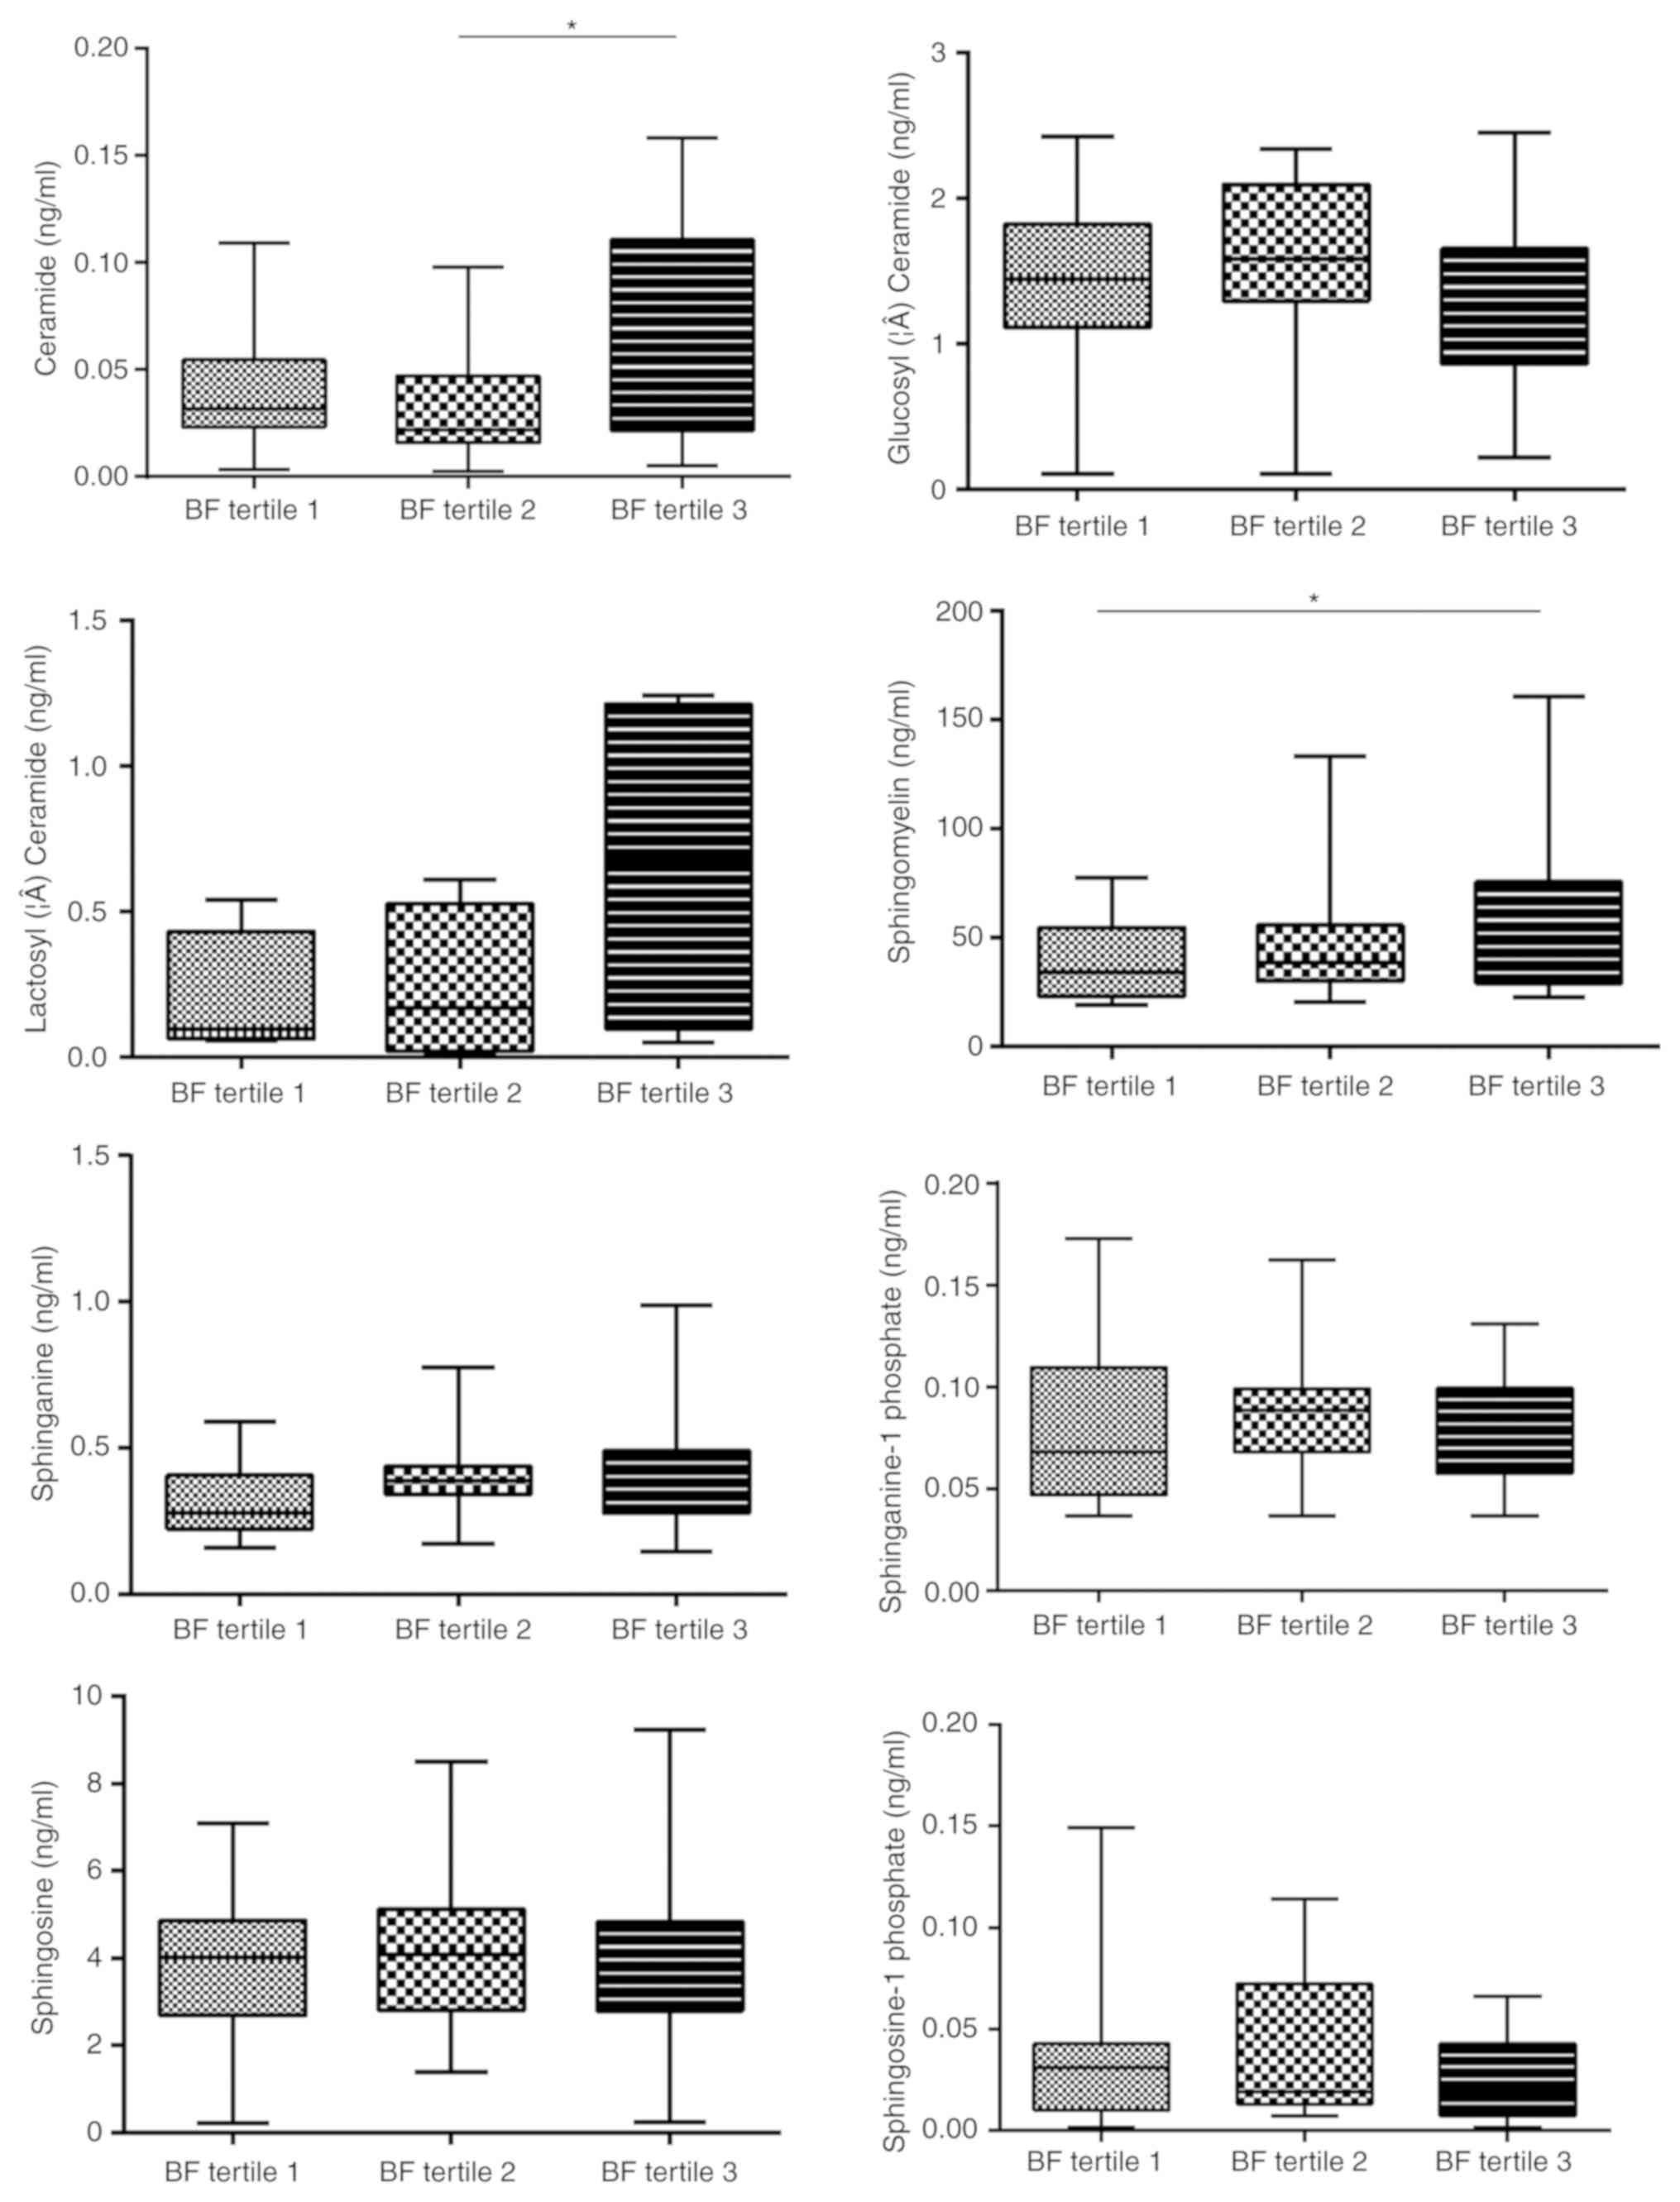
between the different age groups in the healthy controls (Fig. S1). The BMI was not associated with
the serum concentration of the 8 analyte sphingolipids (Fig. S2). BF was significantly associated
not only with Cer (tertile 1, 4.26±3.03×10⁻² ng/ml;
tertile 2, 3.26±2.57×10⁻² ng/ml; tertile 3,
6.56±5.04×10⁻² ng/ml; P<0.05, tertile 2 vs. 3), but
also with SM (tertile 1, 37.39±16.87 ng/ml; tertile 2, 46.85±24.84
ng/ml; tertile 3, 59.69±37.27 ng/ml; P<0.05, tertile 1 vs. 3;
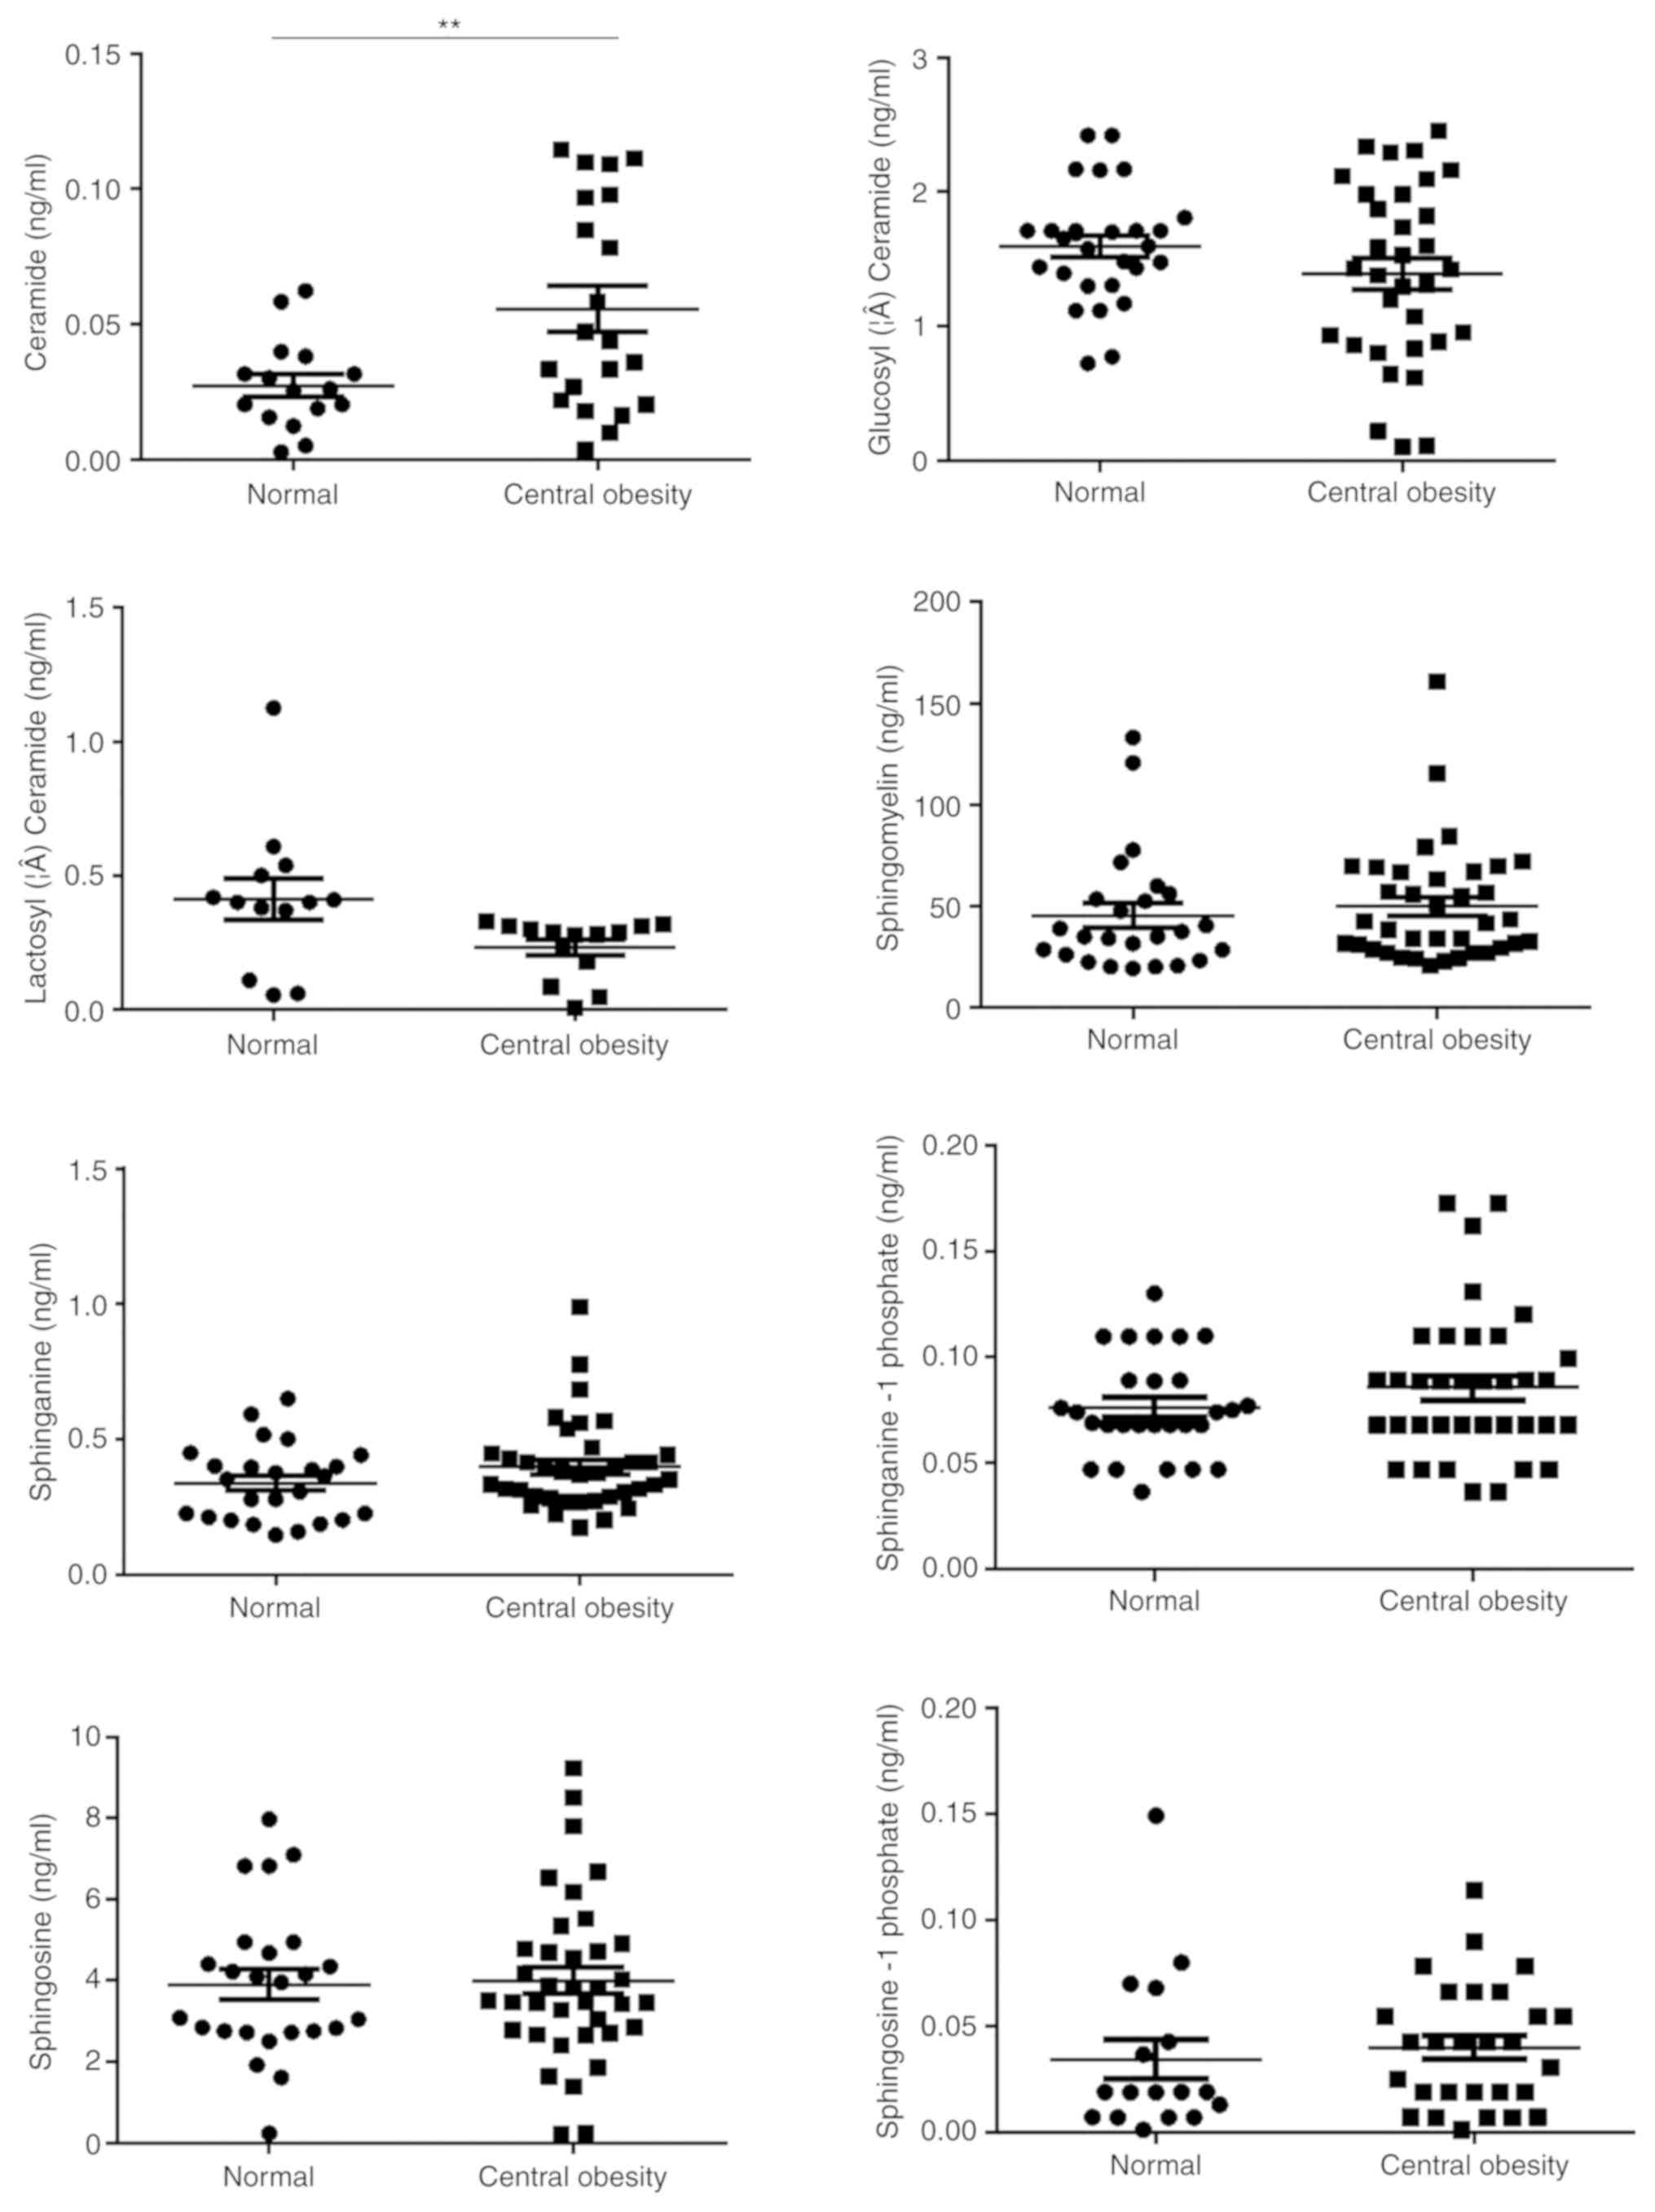
Fig. 2). Furthermore, Cer was
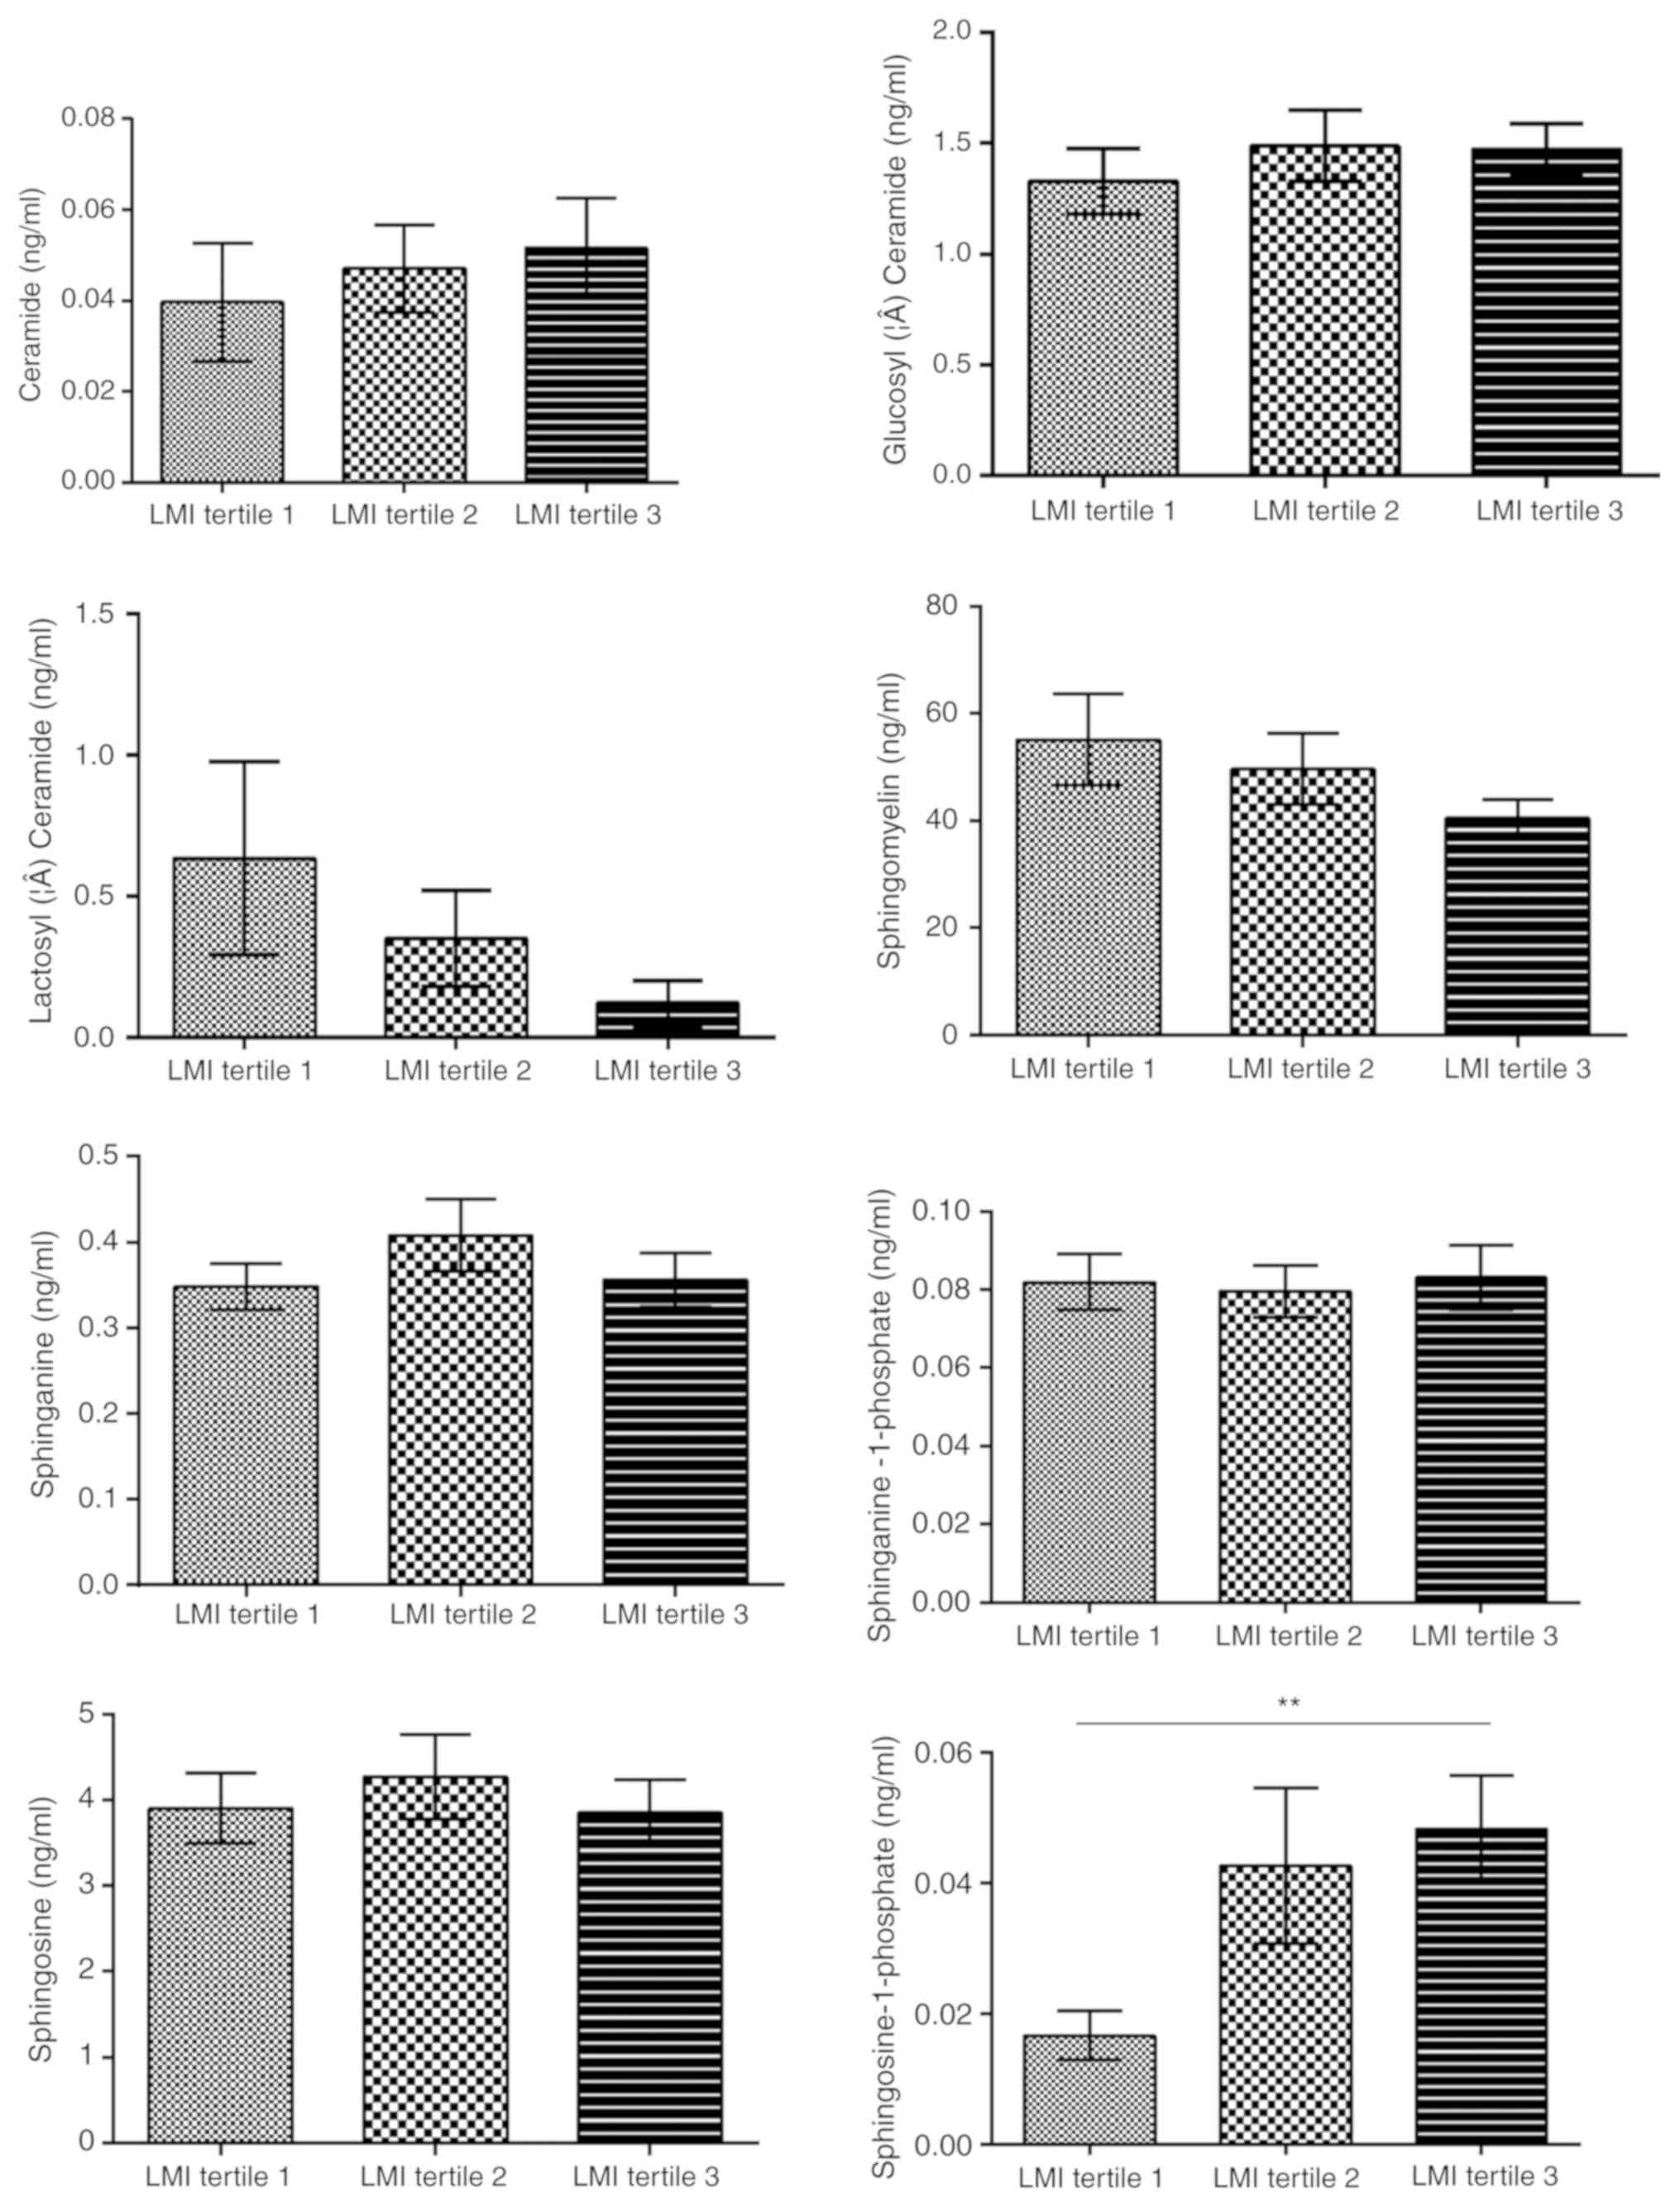
associated with central obesity (P<0.01; Fig. 3) and LMI was positively associated
with So1P (tertile 1, 1.67±1.44×10⁻² ng/ml; tertile 2,
4.27±3.94×10⁻² ng/ml; tertile 3,
4.82±3.26×10⁻² ng/ml; P<0.01, tertile 1 vs. 3;
Fig. 4).
Alterations of serum sphingolipid
metabolites during the progression of T2DM
Next, the serum concentrations of sphingolipid
metabolites in three groups of sex- and body composition
parameter-matched participants were assessed. Table I presents the clinical
characteristics of the study subjects. The patients with pre-DM and
DM had higher HbA1c, FPG and TG levels compared with those of the
healthy controls. There were no significant differences in BMI, BF,
TC and LDL-C among the three groups, there was a clear graphical
‘U’ shape change in the concentrations of GluCer, SM and Sa during
the development from a healthy condition to pre-DM and finally to
T2DM (Fig. 5). Concentrations of
these three metabolites were always the lowest in patients with
pre-DM, and slightly increased in patients with T2DM, while they
were highest in the healthy controls, except for GluCer. GluCer was
higher in T2DM group compared with healthy controls (P<0.01) and
pre-DM (P<0.05). So1P levels in the healthy controls were higher
compared with T2DM (P<0.001) and pre-DM (P<0.01). Sa levels
in the healthy controls were higher compared with T2DM (P<0.01)
and pre-DM (P<0.001). SM (P<0.01) and So (P<0.05) levels
were higher in the healthy controls compared with T2DM (Fig. 5). Of note, So1P was also highest in
the healthy controls, but gradually decreased as the disease
proceeded instead of exhibiting the ‘U’ shape change. This suggests
that these metabolites, particularly So1P, may be associated with
the progression of T2DM and may serve as biomarkers for evaluating
the severity of T2DM.
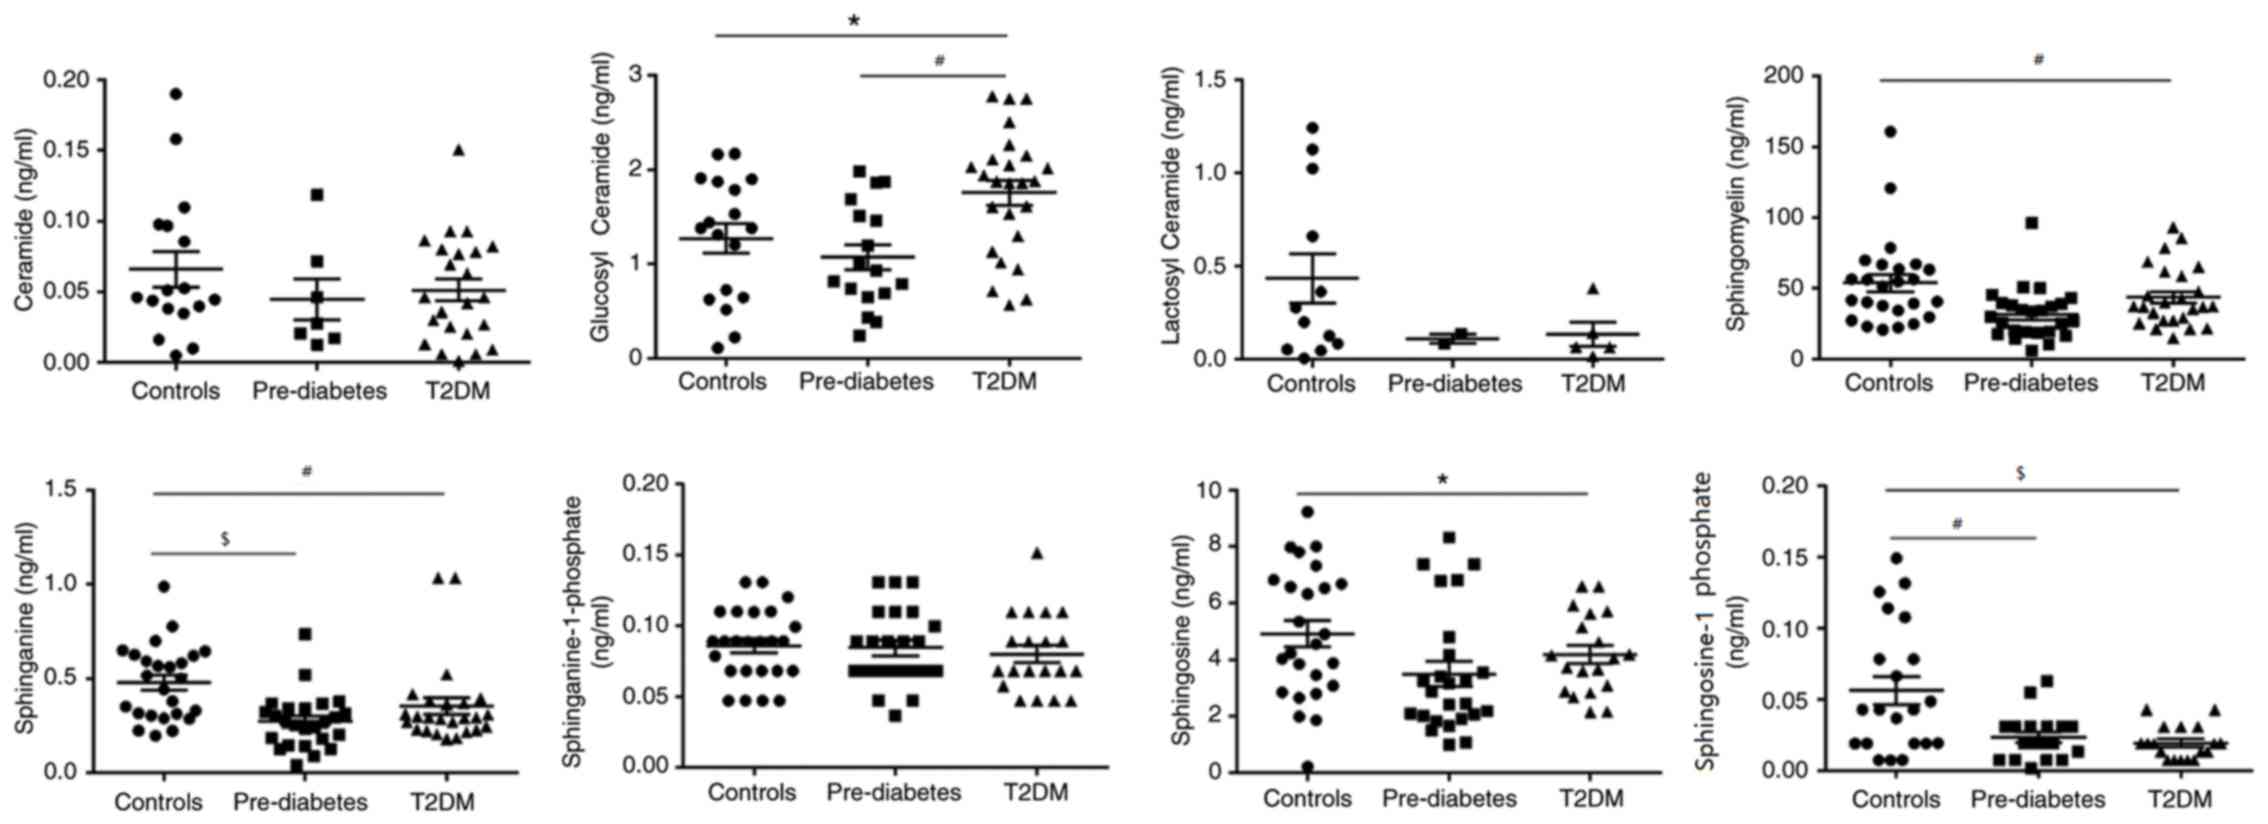 | Figure 5.Dynamic changes in the sphingolipid
metabolic profile during progression from a healthy condition to
Pre-DM, and then to T2DM. Glucosyl ceramide, #P<0.01,
T2DM vs. Pre-DM and *P<0.05, T2DM vs. Controls; sphingosine-1
phosphate, $P<0.001, Controls vs. T2DM and
#P<0.01, Controls vs. Pre-DM; sphinganine,
#P<0.01, Controls vs. T2DM, and
$P<0.001, Controls vs. Pre-DM; sphingomyelin,
#P<0.01, Controls vs. T2DM; and Sphingosine,
*P<0.05, Controls vs. T2DM. DM, diabetes mellitus; T2DM, type 2
DM. |
 | Table I.Baseline characteristics and plasma
sphingolipid metabolite levels of the sex- and body
composition-matched study population. |
Table I.
Baseline characteristics and plasma
sphingolipid metabolite levels of the sex- and body
composition-matched study population.
| Item | Reference
range | Controls
(n=25) | Pre-DM (n=25) | T2DM (n=25) | P-value |
|---|
| Female sex (%) |
| 16 (64.0%) | 16 (64.0%) | 16 (64.0%) | 0.999 |
| Age (years) |
| 43.80±10.65 | 44.24±13.57 | 48.76±11.70 | 0.335 |
| Cigarette smoking
(%) |
| 24 | 28 | 28 | 0.934 |
| Duration of DM
(years) |
|
|
| 7.57±5.93 |
|
| BF (%) |
| 28.73±8.39 | 29.62±6.13 | 30.71±7.76 | 0.652 |
| LMI
(kg/m2) |
| 18.06±1.82 | 18.12±1.96 | 18.14±1.83 | 0.982 |
| BMI
(kg/m2) |
| 24.62±6.30 | 26.01±4.07 | 26.43±3.37 | 0.380 |
| WC (cm) |
| 88.17±8.66 | 87.04±9.52 | 96.12±9.63 | 0.126 |
| HC (cm) |
| 98.67±6.24 | 100.25±7.30 | 95.35±7.78 | 0.501 |
| Central
obesitya (%) |
| 54.2 | 73.9 | 75.0 | 0.255 |
| SBP (mmHg) | 90–140 | 116.08±14.49 | 117.32±13.37 | 127.95±17.41 | 0.156 |
| DBP (mmHg) | 60–90 | 81.22±14.26 | 79.50±10.12 | 75.62±18.04 | 0.430 |
| HbA1c (%) | 4–6 | 5.12±0.31 | 5.63±0.43 | 8.99±1.25 | <0.001 |
| FPG (mmol/l) | 3.9–6.1 | 5.26±2.20 | 5.68±0.68 | 10.69±5.05 | <0.001 |
| UA (µmol/l) | 150–420 | 333.00±80.44 | 430.50±74.66 | 299.95±99.32 | 0.153 |
| HDL-C (mmol/l) | 1.16–1.42 | 1.31±0.34 | 1.22±0.57 | 1.01±0.45 | 0.062 |
| LDL-C (mmol/l) | 2.07–3.10 | 2.68±0.96 | 2.79±0.99 | 2.56±0.76 | 0.685 |
| TG (mmol/l) | 0.56–1.47 | 1.71±1.07 | 1.59±0.73 | 3.29±2.08 | 0.008 |
| TC (mmol/l) | 3.1–5.69 | 4.57±1.20 | 4.45±1.23 | 4.51±1.03 | 0.952 |
| Cer
(×10−2 ng/ml) |
| 6.60±5.14 | 4.48±5.12 | 5.12±3.76 | 0.372 |
| GluCer (ng/ml) |
| 1.27±0.65 | 1.07±0.56 | 1.75±0.64 | 0.002 |
| LacCer (ng/ml) |
| 0.43±0.46 | 0.11±0.04 | 0.14±0.15 | 0.279 |
| SM (ng/ml) |
| 53.81±31.56 | 31.61±18.15 | 43.56±21.32 | 0.007 |
| Sa (ng/ml) |
| 0.48±0.20 | 0.35±0.22 | 0.35±0.22 | 0.001 |
| So (ng/ml) |
| 4.92±2.32 | 3.49±2.17 | 4.18±1.42 | 0.056 |
| Sa1P
(×10−2 ng/ml) |
| 8.59±2.54 | 8.43±2.69 | 7.99±2.78 | 0.747 |
| So1P
(×10−2 ng/ml) |
| 5.62±4.54 | 2.34±1.64 | 1.93±1.12 | <0.001 |
So1P and Sa act as biomarkers for the
severity of diabetes
Evaluation of complications is a method for
assessing the severity of T2DM with a long-term view. Therefore,
one cohort of T2DM patients without any diabetes-associated
complications and another cohort of T2DM patients with
cardiovascular complications, who were sex- and body dimension
parameter (BMI, BF, LMI and central obesity) -matched, were
recruited. The baseline characteristics of the 85 patients included
in the two groups are presented in Table II. There was no significant
difference between the groups in terms of sex, BMI, BF, LMI or
central obesity; only blood pressure and FPG were significantly
different. As expected, SM, Sa, So1P and So were significantly
decreased in T2DM patients with cardiovascular complications
compared with those in T2DM patients without cardiovascular
complications (P=0.01, P<0.001, P<0.05 and P<0.05,
respectively; Table III). To
exclude potential confounding factors, these four metabolites were
included in subsequent univariate and multivariate logistic
regression analyses, which indicated that Sa and So1P were
independent variables for distinguishing between T2DM with and
without cardiovascular complications (P<0.05 and P<0.05,
respectively; Table III).
| Table II.Anthropometric data and concentration
of sphingolipids in diabetic patients with or without
cardiovascular complications. |
Table II.
Anthropometric data and concentration
of sphingolipids in diabetic patients with or without
cardiovascular complications.
| Item | T2DM (n=53) | T2DM+CVD
(n=30) | P-value |
|---|
| Females/males | 39/14 | 22/8 | 0.999 |
| Age (years) | 52.6±15.83 | 58.77±13.28 | 0.075 |
| BF (%) | 27.61±6.89 | 29.21±8.04 | 0.341 |
| LMI
(kg/m2) | 17.65±2.19 | 17.63±2.23 | 0.955 |
| BMI
(kg/m2) | 24.56±3.71 | 25.16±4.07 | 0.498 |
| WC (cm) | 93.24±9.52 | 90.70±9.35 | 0.353 |
| HC (cm) | 97.87±14.99 | 94.35±7.64 | 0.323 |
| Central obesity
(%) | 68.80 | 60.00 | 0.577 |
| SBP (mmHg) | 128.51±15.53 | 153.07±13.49 | <0.001 |
| DBP (mmHg) | 77.79±10.13 | 189.55±19.97 | <0.001 |
| HbA1c (%) | 9.47±11.14 | 6.55±0.97 | 0.171 |
| FPG (mmol/l) | 9.40±4.49 | 6.18±2.39 | <0.001 |
| 2hPG (mmol/l) | 15.54±5.04 | 14.62±23.41 | 0.861 |
| CO (l/min) | 4.83±0.44 | 4.38±0.58 | <0.001 |
| EF (%) | 64.45±3.72 | 58.07±2.81 | <0.001 |
| Cer
(×10−2 ng/ml) | 5.06±4.67 | 4.02±2.79 | 0.386 |
| GluCer (ng/ml) | 1.52±0.65 | 1.42±0.53 | 0.333 |
| LacCer (ng/ml) | 0.13±0.65 | 0.12±0.15 | 0.801 |
| SM (ng/ml) | 38.69±17.80 | 28.55±14.49 | 0.010 |
| Sa (ng/ml) | 0.31±0.13 | 0.20±0.07 | <0.001 |
| So (ng/ml) | 4.28±1.58 | 3.08±1.27 | 0.023 |
| Sa1P
(×10−2 ng/ml) | 7.25±1.77 | 6.40±2.04 | 0.028 |
| So1P
(×10−2 ng/ml) | 2.56±1.72 | 0.85±0.44 | 0.024 |
| Table III.ORs of potential sphingolipid
biomarkers for T2DM with cardiovascular complications. |
Table III.
ORs of potential sphingolipid
biomarkers for T2DM with cardiovascular complications.
|
|
| Unadjusted |
| Adjusted |
|---|
|
|
|
|
|
|
|---|
| Substance | β |
P-valuea | OR | 95% CI | β |
P-valueb | OR | 95% CI |
|---|
| SM | −0.025 | 0.015 | 0.975 | 0.925–0.991 | 0.003 | 0.116 | 1.003 | 0.999–1.009 |
| Sa | −0.014 | <0.001 | 0.986 | 0.979–0.994 | −0.023 | 0.027 | 0.977 | 0.957–0.997 |
| So | 0 | 0.027 | 1.000 | 0.999–1.000 | 0.001 | 0.311 | 1.001 | 0.999–1.002 |
| So1P | −0.170 | 0.018 | 0.844 | 0.733–0.971 | −0.263 | 0.045 | 0.769 | 0.549–0.995 |
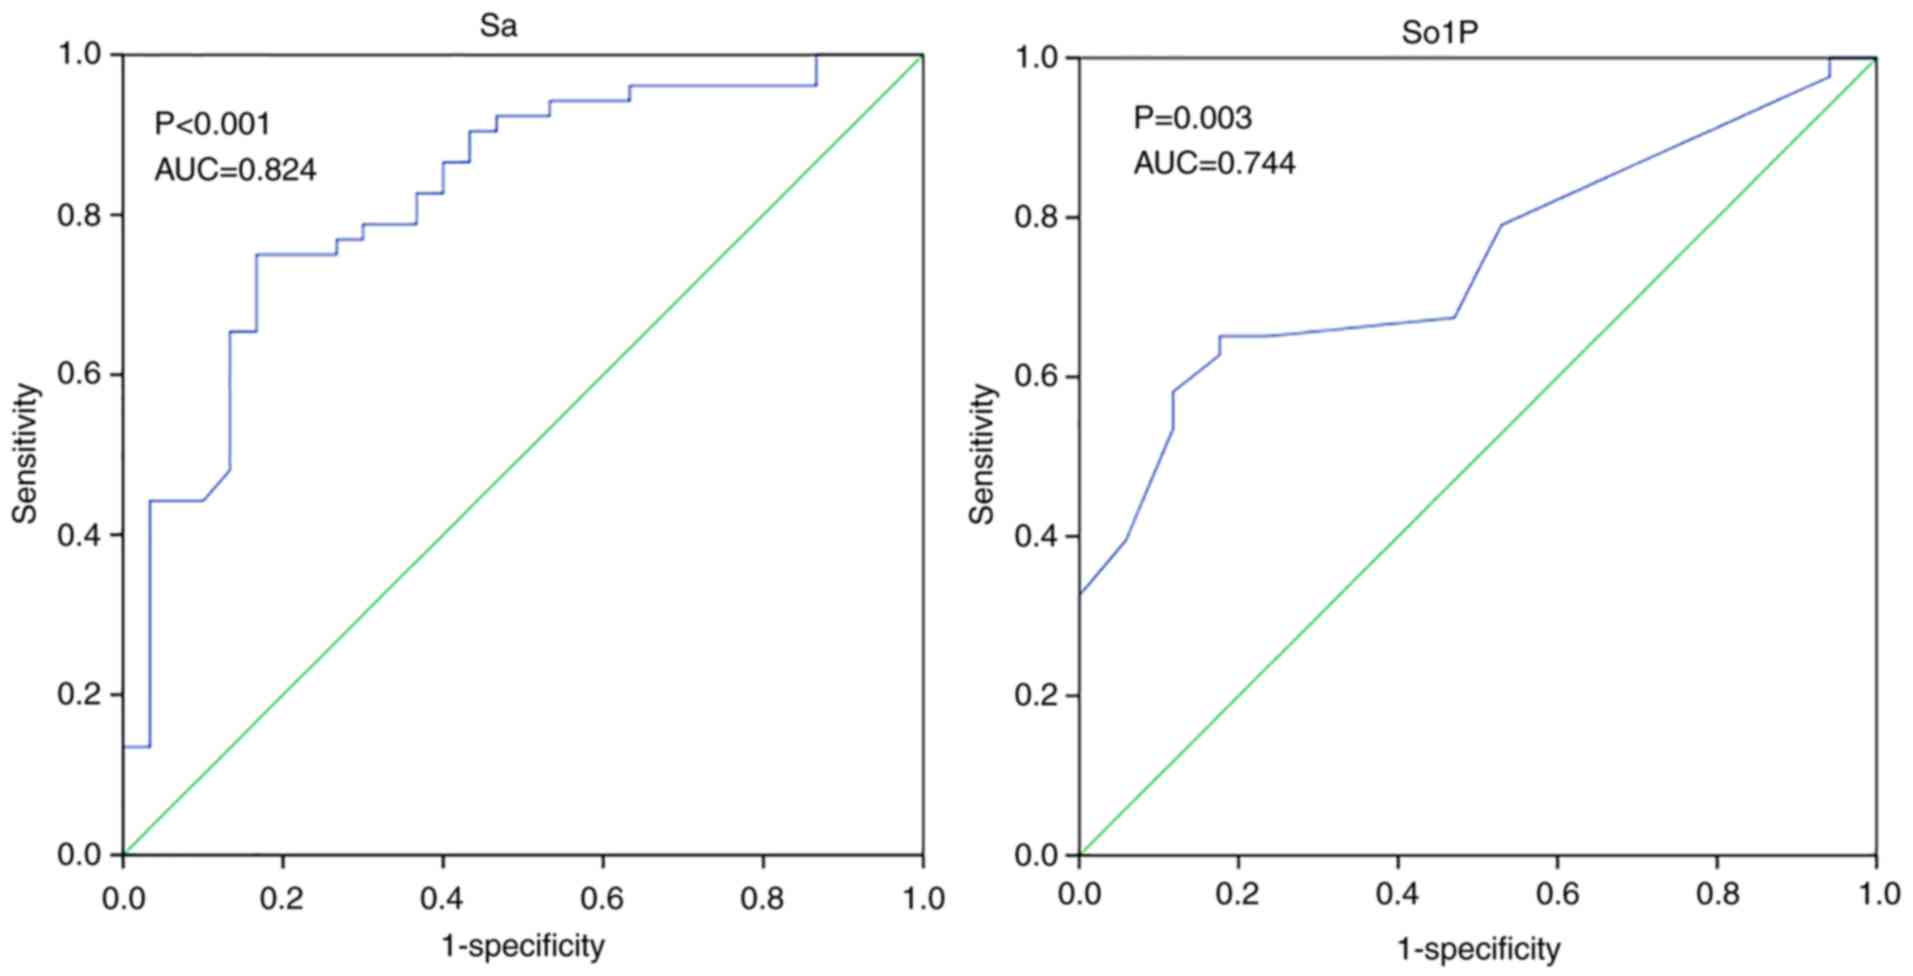
ROC analysis was also used to evaluate the
diagnostic performance of Sa and So1P in the differentiation
between simple T2DM and T2DM with cardiovascular complications
(Fig. 6). Similar results were
observed in So1P and Sa, the area under the ROC curve (AUC) for
So1P was 0.744 (P=0.003), whilst the AUC for Sa was 0.824
(P<0.001). This suggest that Sa and So1P may be able to
significantly distinguish patients with an elevated risk of
cardiovascular complications among patients with T2DM. Another
relatively short-term index for evaluating the management of T2DM
is HbA1c. A cohort of 94 T2DM patients stratified by HbA1c was
recruited. The subjects were mostly middle-aged and had similar
lipid profiles whilst HC and BF showed significant differences
among groups (P<0.05; Table IV).
Significant alterations in So1P were identified among diabetic
patients with different glucose managements as stratified by HbA1c
levels (P=0.05, HbA1c>9% vs. HbA1c<7%; Fig. S3). To conclude, So1P and Sa were
able to identify patients with an elevated risk of cardiovascular
complications among T2DM patients So1P was also significantly
associated with the progression from pre-DM to T2DM.
| Table IV.Baseline characteristics of T2DM
population stratified by HbA1c. |
Table IV.
Baseline characteristics of T2DM
population stratified by HbA1c.
|
|
| HbA1c (%) |
|
|---|
|
|
|
|
|
|---|
| Item | Total | >9 | 7–9 | <7 | P-value |
|---|
| N | 94 | 31 | 31 | 32 |
|
| Female sex (%) | 61 (64.9%) | 24 (77.4%) | 16 (51.6%) | 21 (65.6%) | 0.103 |
| Age (years) | 54.62±14.13 | 50.48±11.00 | 54.97±15.51 | 58.28±14.79 | 0.089 |
| BF (%) | 29.14±7.41 | 26.17±6.04 | 31.84±7.94 | 29.31±7.20 | 0.010 |
| LMI
(kg/m2) | 17.33±2.05 | 17.58±1.83 | 17.29±2.04 | 17.15±2.28 | 0.707 |
| BMI
(kg/m2) | 24.65±3.42 | 23.92±2.79 | 25.53±3.08 | 24.49±4.10 | 0.172 |
| WC (cm) | 93.20±10.70 | 90.03±10.00 | 95.07±10.03 | 94.35±11.81 | 0.382 |
| HC (cm) | 97.73±15.24 | 89.40±23.03 | 102.07±7.13 | 101.26±7.13 | 0.033 |
| Central obesity
(%) | 70.2 | 60.0 | 80.0 | 70.6 | 0.488 |
| SBP (mmHg) | 129.65±17.70 | 126.59±15.16 | 129.57±16.14 | 132.70±21.29 | 0.419 |
| DBP (mmHg) | 79.01±11.69 | 79.48±12.88 | 79.00±9.95 | 78.57±12.46 | 0.957 |
| HbA1c (%) | 8.63±2.27 | 11.17±1.91 | 8.35±0.43 | 6.51±0.60 | <0.001 |
| FPG (mmol/l) | 9.43±4.41 | 13.02±4.36 | 8.35±0.43 | 6.46±0.60 | <0.001 |
| UA (µmol/l) | 311.38±84.10 | 298.30±70.40 | 340.47±99.20 | 296.00±78.96 | 0.130 |
| HDL-C (mmol/l) | 0.95±0.34 | 1.00±0.27 | 0.89±0.44 | 0.96±0.27 | 0.417 |
| LDL-C (mmol/l) | 2.59±0.92 | 2.57±0.97 | 2.59±0.89 | 2.61±0.93 | 0.989 |
| TG (mmol/l) | 2.32±2.25 | 1.97±1.25 | 1.90±1.37 | 3.11±3.36 | 0.068 |
| TC (mmol/l) | 4.36±1.10 | 4.24±1.12 | 4.27±1.12 | 4.57±1.08 | 0.462 |
Discussion
Several studies in mouse models and humans have
linked sphingolipid metabolites with metabolic disorders (16,17) and
atherosclerosis (18,19). However, to date, the sphingolipid
profile of diabetic patients with CVD has remained to be
investigated. Thus, the present study was designed to explore
alterations in the serum sphingolipids profile in patients with
pre-DM, T2DM and healthy controls in order to identify potential
novel biomarkers for the early diagnosis of patients with T2DM at
an elevated risk for cardiovascular complications. In the present
study, 8 major sphingolipid metabolites, namely SM, So, Sa, So1P,
Sa1P, Cer, GluCer and LacCer, which occur in the metabolic pathway
of sphingolipids, were measured (20). The major results of the present study
were as follows: i) In healthy controls, several serum
sphingolipids were significantly associated with sex but not with
age. In terms of body measurements, the LMI, central obesity and
BF, but not the BMI, were associated with sphingolipids; ii) So1P
was significantly correlated with the progression from pre-DM to
T2DM; iii) So1P and Sa were indicated to be biomarkers for diabetic
patients at an elevated risk for cardiovascular complications.
Cer has been confirmed to be involved in the
pathogenesis of DM, and is elevated in adipocyte tissues and
skeletal muscle of obese humans (21) and C57BL/6J mice on a high-fat diet.
This effect was rescued in CerS6-deficient mice (22). In accordance with prior experiments,
the present study indicated that Cer was significantly associated
with BF and central obesity; in other words, Cer accumulated in
individuals with obesity. However, this trend was not significant
in terms of BMI and LMI, which may be due to the different methods
used to reflect the body composition, while the association between
Cer and obesity is consolidated.
So1P is well known for its bioactive properties,
namely its pro-cell survival, anti-apoptotic, immune cell
trafficking, glucose homeostasis-promoting and anti-inflammatory
effects. The potential protective role of So1P is being
increasingly recognized in the fields of coronary artery disease
and diabetes, as well as associated complications, including
diabetic nephropathy (23). In the
present study, So1P was not only positively associated with the LMI
but also with sex. A noteworthy phenomenon is that the So1P
concentration in the male controls was two times higher than in the
matched female counterparts, but So1P was not associated with age.
Consistent results have been reported in the different setting of
Alzheimer's disease and the sex-dependent role of So1P has been
indicated in certain diseases (24).
Females and males have different levels of risk for developing
certain diseases. Regarding T2DM, healthy male adults appear to be
more susceptible to this disease compared to healthy females who
have reached menopause; however, following the onset of DM, the
risk for diabetes-associated stroke was elevated in females
relative to that in males (25,26). To
date, the mechanism for this reversal effect has remained elusive,
and it is indicated that sphingolipids, particularly So1P, may be
involved in the aforementioned risk alteration due to its
sex-dependent role and its fluctuations during diabetes
progression. Further cohort studies focusing on dynamic So1P
variations are required to validate this hypothesis.
In the present study, three groups (patients with
T2DM, pre-DM, and age-, sex- and body composition-matched healthy
volunteers) were analyzed to screen the potential significant
variables involved in the development of diabetes. Compared with
those in the matched healthy controls, the serum levels of GluCer,
SM, Sa and So were significantly decreased in pre-DM and DM
patients, but remained higher in DM patients compared with those in
pre-DM patients. This alteration graphically presented as a ‘U’
shape change during the progression of diabetes. These results were
in line with several other studies. SM accumulation was identified
in the glomeruli of diabetic mice and elevated in the serum of
young obese adults (27).
Furthermore, increases in adipocyte GluCer were indicated to hinder
insulin signaling (28). While a
previous study reported that Sa was elevated in T2DM patients
compared with that in healthy controls (29), the opposite result was observed in
the present study. The size of the study population, the type of
blood sample and sex distribution may partially contribute to this
controversial observation.
Most importantly, So1P was inversely associated with
the progression of diabetes. It gradually decreased in patients
with pre-DM compared with that in the controls, and decreased
further in diabetic patients. It is rational to expect that the
protective effect of So1P ceases when individuals progress from
pre-DM to diabetes. The underlying mechanism may in part be that
So1P regulates the maturation and function of pancreatic β-cells
(30). So1P phosphatases, which
partly control intracellular So1P metabolism, were recently
identified to be critical for β-cell endoplasmic reticulum stress,
which may further cause β-cell dysfunction and accelerate the
development of diabetes (31).
It has been established that So1P influences cell
behavior and several human diseases, including diabetes, obesity
and CVD, at the cytosolic and the nuclear level. Aberration of
sphingolipids in human blood samples was confirmed and linked to
future cardiovascular events (32).
In this context, the present aimed to determine whether So1P may
serve as a biomarker for predicting the severity of diabetes.
Multivariate regression analysis was applied, revealing that So1P
and Sa were two independent variables that were significantly
different between diabetic patients and diabetic patients with CVD.
ROC analysis also indicated that they were able to differentiate
between diabetic patients with CVD and those without cardiovascular
complications. However, So1P was not associated with glucose
control reflected by HbA1c. Thus, it may be proposed that So1P is a
biomarker for evaluating the risk of developing diabetes-associated
CVD in patients with T2DM.
Inflammation may explain the strong association
between CVD and T2DM. Evidence has been presented for the
involvement of So1P in the modulation of regulatory T cells, which
are essential for inflammatory and autoimmune diseases (33). In addition, infiltration of
CD8+ T cells and macrophages, which have a role in the
initiation and formation of atherosclerotic plaques and even the
fate of unstable plaques, may result from So1P-mediated signaling
(34). Conversely, So1P signaling is
directly involved in vascular development through the
Rho/Rho-associated protein kinase and PI3K/AKT pathways (35,36).
Compared with So1P, Sa is relatively poorly investigated in the
fields of diabetes and CVD. Thus, there is a demand for further
studies into the mechanism of Sa in the progression of T2DM.
In terms of limitations, the present study is a
single-center study and the cohort is relatively small. Further
study on the roles of So1P alterations, specifically in females and
males with diabetes and diabetes-associated cardiovascular disease,
is required to validate the mechanism of the risk. It remains
elusive whether So1P is associated with the duration of diabetes
and severity of atherosclerosis in diabetic patients. Studies using
larger cohorts with more detailed stage stratification may improve
the current knowledge regarding sphingolipids in diabetes.
In conclusion, the present study indicated that the
serum levels of So1P, SM, Sa and So are significantly decreased in
patients with pre-DM and diabetes compared with those in healthy
controls. So1P is significantly correlated with the progression of
T2DM, and, along with Sa, represents a potential biomarker for
predicting an elevated risk of cardiovascular complications.
Supplementary Material
Supporting Data
Acknowledgements
The authors appreciate the help of Dr Xiaoli Yao
(Department of Endocrinology, The First Affiliated Hospital of
Xi'an Jiaotong University, Xi'an, China) for helpful suggestions
and review of the manuscript.
Funding
The current study was supported by grants from the
National Science Foundation of China (grant no. 81500690 to YW),
the First Affiliated Hospital of Xi'an Jiaotong University (grant
no. 2013YK20), the Clinical Research Award of the First Affiliated
Hospital of Xi'an Jiaotong University (grant no.
XJTU1AF-CRF-2016-016) and the Chinese Medical Association (grant
no. 13040470432).
Availability of data and materials
The datasets used and/or analyzed during the present
study are available from the corresponding author on reasonable
request.
Authors' contributions
JS, MH and YW performed the experiments and analyzed
the data; JS and BS designed and supervised the study; JS drafted
the manuscript. YH and XZ collected the data and performed the
statistical analyses. JS and BS interpreted the data. All authors
read and approved the final manuscript.
Ethics approval and consent to
participate
The present study complied with the Declaration of
Helsinki and was approved by the Ethics Committees of the First
Affiliated Hospital of Xi'an Jiaotong University (Xi'an, China).
Participants enrolled in the present study were given the consent
form and provided written informed consent.
Patient consent for publication
Not applicable.
Competing interests
The authors declare that they have no competing
interests.
References
|
1
|
Mathers CD and Loncar D: Projections of
global mortality and burden of disease from 2002 to 2030. PLoS Med.
3:e4422006. View Article : Google Scholar : PubMed/NCBI
|
|
2
|
Wong ND: Epidemiological studies of CHD
and the evolution of preventive cardiology. Nat Rev Cardiol.
11:276–289. 2014. View Article : Google Scholar : PubMed/NCBI
|
|
3
|
American Diabetes Association: 10.
Cardiovascular disease and risk management: Standards of Medical
Care in Diabete-2019. Diabetes Care. 42 (Suppl 1):S103–S123. 2019.
View Article : Google Scholar : PubMed/NCBI
|
|
4
|
Tonks KT, Coster AC, Christopher MJ,
Chaudhuri R, Xu A, Gagnon-Bartsch J, Chisholm DJ, James DE, Meikle
PJ, Greenfield JR and Samocha-Bonet D: Skeletal muscle and plasma
lipidomic signatures of insulin resistance and overweight/obesity
in humans. Obesity (Silver Spring). 24:908–916. 2016. View Article : Google Scholar : PubMed/NCBI
|
|
5
|
Chaurasia B, Kaddai VA, Lancaster GI,
Henstridge DC, Sriram S, Galam DL, Gopalan V, Prakash KN, Velan SS,
Bulchand S, et al: Adipocyte ceramides regulate subcutaneous
adipose browning, inflammation, and metabolism. Cell Metab.
24:820–834. 2016. View Article : Google Scholar : PubMed/NCBI
|
|
6
|
Meikle PJ and Summers SA: Sphingolipids
and phospholipids in insulin resistance and related metabolic
disorders. Nat Rev Endocrinol. 13:79–91. 2017. View Article : Google Scholar : PubMed/NCBI
|
|
7
|
Samad F, Badeanlou L, Shah C and Yang G:
Adipose tissue and ceramide biosynthesis in the pathogenesis of
obesity. Adv Exp Med Biol. 721:67–86. 2011. View Article : Google Scholar : PubMed/NCBI
|
|
8
|
Holland WL, Bikman BT, Wang LP, Yuguang G,
Sargent KM, Bulchand S, Knotts TA, Shui G, Clegg DJ, Wenk MR, et
al: Lipid-induced insulin resistance mediated by the
proinflammatory receptor TLR4 requires saturated fatty acid-induced
ceramide biosynthesis in mice. J Clin Invest. 121:1858–1870. 2011.
View Article : Google Scholar : PubMed/NCBI
|
|
9
|
Holland WL, Miller RA, Wang ZV, Sun K,
Barth BM, Bui HH, Davis KE, Bikman BT, Halberg N, Rutkowski JM, et
al: Receptor-mediated activation of ceramidase activity initiates
the pleiotropic actions of adiponectin. Nat Med. 17:55–63. 2011.
View Article : Google Scholar : PubMed/NCBI
|
|
10
|
Rauch BH: Sphingosine 1-phosphate as a
link between blood coagulation and inflammation. Cell Physiol
Biochem. 34:185–96. 2014. View Article : Google Scholar : PubMed/NCBI
|
|
11
|
Soltau I, Mudersbach E, Geissen M,
Schwedhelm E, Winkler MS, Geffken M, Peine S, Schoen G, Debus ES,
Larena-Avellaneda A and Daum G: Serum-sphingosine-1-phosphate
concentrations are inversely associated with atherosclerotic
diseases in humans. PLoS One. 11:e01683022016. View Article : Google Scholar : PubMed/NCBI
|
|
12
|
Joint Committee for Developing Chinese
guidelines on Prevention and Treatment of Dyslipidemia in Adults, .
Chinese guidelines on prevention and treatment of dyslipidemia in
adults. Zhonghua Xin Xue Guan Bing Za Zhi. 35:390–419. 2007.(In
Chinese). PubMed/NCBI
|
|
13
|
Zhou BF; Cooperative Meta-Analysis Group
of the Working Group on Obesity in China, : Predictive values of
body mass index and waist circumference for risk factors of certain
related diseases in Chinese adults-study on optimal cut-off points
of body mass index and waist circumference in Chinese adults.
Biomed Environ Sci. 15:83–96. 2002.PubMed/NCBI
|
|
14
|
Gómez-Ambrosi J, Silva C, Catalán V,
Rodríguez A, Galofré JC, Escalada J, Valentí V, Rotellar F, Romero
S, Ramírez B, et al: Clinical usefulness of a new equation for
estimating body fat. Diabetes Care. 35:383–388. 2012. View Article : Google Scholar : PubMed/NCBI
|
|
15
|
Grammatikos G, Schoell N, Ferreirós N, Bon
D, Herrmann E, Farnik H, Köberle V, Piiper A, Zeuzem S,
Kronenberger B, et al: Serum sphingolipidomic analyses reveal an
upregulation of C16-ceramide and sphingosine-1-phosphate in
hepatocellular carcinoma. Oncotarget. 7:18095–18105. 2016.
View Article : Google Scholar : PubMed/NCBI
|
|
16
|
Haus JM, Kashyap SR, Kasumov T, Zhang R,
Kelly KR, Defronzo RA and Kirwan JP: Plasma ceramides are elevated
in obese subjects with Type 2 diabetes and correlate with the
severity of insulin resistance. Diabetes. 58:337–343. 2009.
View Article : Google Scholar : PubMed/NCBI
|
|
17
|
Yaghobian D, Don AS, Yaghobian S, Chen X,
Pollock CA and Saad S: Increased sphingosine 1-phosphate mediates
inflammation and fibrosis in tubular injury in diabetic
nephropathy. Clin Exp Pharmacol Physiol. 43:56–66. 2016. View Article : Google Scholar : PubMed/NCBI
|
|
18
|
Egom EE, Mamas MA, Chacko S, Stringer SE,
Charlton-Menys V, El-Omar M, Chirico D, Clarke B, Neyses L,
Cruickshank JK, et al: Serum sphingolipids level as a novel
potential marker for early detection of human myocardial ischaemic
injury. Front Physiol. 4:1302013. View Article : Google Scholar : PubMed/NCBI
|
|
19
|
Sasset L, Zhang Y, Dunn TM and Di Lorenzo
A: Sphingolipid de novo biosynthesis: A rheostat of cardiovascular
homeostasis. Trends Endocrinol Metab. 27:807–819. 2016. View Article : Google Scholar : PubMed/NCBI
|
|
20
|
Mi S, Zhao YY, Dielschneider RF, Gibson SB
and Curtis JM: An LC/MS/MS method for the simultaneous
determination of individual sphingolipid species in B cells. J
Chromatogr B Analyt Technol Biomed Life Sci. 1031:50–60. 2016.
View Article : Google Scholar : PubMed/NCBI
|
|
21
|
Turpin SM, Nicholls HT, Willmes DM,
Mourier A, Brodesser S, Wunderlich CM, Mauer J, Xu E, Hammerschmidt
P, Brönneke HS, et al: Obesity-induced CerS6-dependent C16:0
ceramide production promotes weight gain and glucose intolerance.
Cell Metab. 20:678–686. 2014. View Article : Google Scholar : PubMed/NCBI
|
|
22
|
Boini KM, Zhang C, Xia M, Poklis JL and Li
PL: Role of sphingolipid mediator ceramide in obesity and renal
injury in mice fed a high-fat diet. J Pharmacol Exp Ther.
334:839–846. 2010. View Article : Google Scholar : PubMed/NCBI
|
|
23
|
Awad AS, Rouse MD, Khutsishvili K, Huang
L, Bolton WK, Lynch KR and Okusa MD: Chronic sphingosine
1-phosphate 1 receptor activation attenuates early-stage diabetic
nephropathy independent of lymphocytes. Kidney Int. 79:1090–1098.
2011. View Article : Google Scholar : PubMed/NCBI
|
|
24
|
Mielke MM, Haughey NJ, Han D, An Y,
Bandaru VVR, Lyketsos CG, Ferrucci L and Resnick SM: The
association between plasma ceramides and sphingomyelins and risk of
Alzheimer's disease differs by sex and APOE in the baltimore
longitudinal study of aging. J Alzheimers Dis. 60:819–828. 2017.
View Article : Google Scholar : PubMed/NCBI
|
|
25
|
Gale EA and Gillespie KM: Diabetes and
sex. Diabetologia. 44:3–15. 2001. View Article : Google Scholar : PubMed/NCBI
|
|
26
|
Peters SA, Huxley RR and Woodward M:
Diabetes as a risk factor for stroke in women compared with men: A
systematic review and meta-analysis of 64 cohorts, including
775,385 individuals and 12,539 strokes. Lancet. 383:1973–1980.
2014. View Article : Google Scholar : PubMed/NCBI
|
|
27
|
Miyamoto S, Hsu CC, Hamm G, Darshi M,
Diamond-Stanic M, Declèves AE, Slater L, Pennathur S, Stauber J,
Dorrestein PC and Sharma K: Mass spectrometry imaging reveals
elevated glomerular ATP/AMP in diabetes/obesity and identifies
sphingomyelin as a possible mediator. EBioMedicine. 7:121–134.
2016. View Article : Google Scholar : PubMed/NCBI
|
|
28
|
Chavez JA, Siddique MM, Wang ST, Ching J,
Shayman JA and Summers SA: Ceramides and glucosylceramides are
independent antagonists of insulin signaling. J Biol Chem.
289:723–734. 2014. View Article : Google Scholar : PubMed/NCBI
|
|
29
|
Górska M, Dobrzyń A and Baranowski M:
Concentrations of sphingosine and sphinganine in plasma of patients
with Type 2 diabetes. Med Sci Monit. 11:CR35–CR38. 2005.PubMed/NCBI
|
|
30
|
Rütti S, Ehses JA, Sibler RA, Prazak R,
Rohrer L, Georgopoulos S, Meier DT, Niclauss N, Berney T, Donath MY
and von Eckardstein A: Low- and high-density lipoproteins modulate
function, apoptosis, and proliferation of primary human and murine
pancreatic beta-cells. Endocrinology. 150:4521–4530. 2009.
View Article : Google Scholar : PubMed/NCBI
|
|
31
|
Taguchi Y, Allende ML, Mizukami H, Cook
EK, Gavrilova O, Tuymetova G, Clarke BA, Chen W, Olivera A and
Proia RL: Sphingosine-1-phosphate phosphatase 2 regulates
pancreatic islet beta-cell endoplasmic reticulum stress and
proliferation. J Biol Chem. 291:12029–12038. 2016. View Article : Google Scholar : PubMed/NCBI
|
|
32
|
Alshehry ZH, Mundra PA, Barlow CK, Mellett
NA, Wong G, McConville MJ, Simes J, Tonkin AM, Sullivan DR, Barnes
EH, et al: Plasma lipidomic profiles improve on traditional risk
factors for the prediction of cardiovascular events in type 2
diabetes mellitus. Circulation. 134:1637–1650. 2016. View Article : Google Scholar : PubMed/NCBI
|
|
33
|
Liu G, Yang K, Burns S, Shrestha S and Chi
H: The S1P (1)-mTOR axis directs the reciprocal differentiation of
T (H)1 and T (reg) cells. Nat Immunol. 11:1047–1056. 2010.
View Article : Google Scholar : PubMed/NCBI
|
|
34
|
Nishimura S, Manabe I, Nagasaki M, Eto K,
Yamashita H, Ohsugi M, Otsu M, Hara K, Ueki K, Sugiura S, et al:
CD8+ effector T cells contribute to macrophage
recruitment and adipose tissue inflammation in obesity. Nat Med.
15:914–920. 2009. View
Article : Google Scholar : PubMed/NCBI
|
|
35
|
Murakami A, Takasugi H, Ohnuma S, Koide Y,
Sakurai A, Takeda S, Hasegawa T, Sasamori J, Konno T, Hayashi K, et
al: Sphingosine 1-phosphate (S1P) regulates vascular contraction
via S1P3 receptor: Investigation based on a new S1P3 receptor
antagonist. Mol Pharmacol. 77:704–713. 2010. View Article : Google Scholar : PubMed/NCBI
|
|
36
|
Nofer JR, van der Giet M, Tölle M,
Wolinska I, von Wnuck Lipinski K, Baba HA, Tietge UJ, Gödecke A,
Ishii I, Kleuser B, et al: HDL induces NO-dependent vasorelaxation
via the lysophospholipid receptor S1P3. J Clin Invest. 113:569–581.
2004. View Article : Google Scholar : PubMed/NCBI
|