Introduction
All over the world, ~40,000 organ transplants are
performed per annum, among which kidney transplants are the most
common procedure (1); however, most
of the transplanted kidneys gradually develop functional failure
within 10 years (2). In solid organ
transplantation, chronic low-grade inflammation is thought to
participate in chronic allograft dysfunction (CAD), the leading
cause of late renal allograft dysfunction (3). Atherosclerosis, as one of the
conditions associated with chronic low-grade inflammation, promotes
the progression of CAD (4).
In 1993, the potential of circulating procalcitonin
(PCT) as a biomarker for severe systemic inflammation, infection
and sepsis was first suggested (5).
Later studies have indicated that elevated PCT may be observed in
patients with chronic kidney disease (CKD), regardless of the
presence of any infection (6,7). A
previous study identified a negative association between the
baseline value of PCT and renal function in CKD patients (8). Low-grade inflammatory responses or a
micro-inflammatory state in CKD patients are thought to cause an
increase in pro-inflammatory metabolites and stimulation of the
immune system, leading to increased release of inflammatory
mediators and PCT entering the blood circulation. van Ree et
al (4) reported that PCT may
reflect chronic low-grade inflammation in a non-infected state that
persists in the transplanted kidneys. In their study, the endpoint
of the renal event was graft failure, return to dialysis,
retransplantation or death, while mild to moderate-stage CAD was
not among the items assessed. In addition, the levels of PCT after
the acute phase of infection were not followed up.
Besides creatinine clearance and proteinuria,
certain biomarkers are available to predict mild to moderate CAD of
KTRs and clinicians are exploring novel non-invasive methods for
entirely or partially replacing renal allograft biopsy for
diagnosis of CAD. The aim of the present study was to assess the
potential predictive value of circulating PCT concentrations for
CAD in KTRs. Due to the high prevalence of infection in the KTRs
who received long-term immunosuppressive agents compared with that
in healthy subjects, patients with severe infections were therefore
excluded. in the present study.
Materials and methods
General information
The present study was approved by the Ethics
Committee of The Third Affiliated Hospital of Soochow University
(Changzhou, China). A total of 92 KTRs from the Department of
Nephrology, the Third Affiliated Hospital of Soochow University in
Changzhou, P.R. China, were followed up after kidney transplant
between March 2014 and September 2017, by collecting the data
retrospectively. All medical records were anonymous and all
patients provided written informed consent. The subjects that met
the inclusion criteria were adults (>18 years of age) who had
undergone kidney transplantation more than a year prior to their
inclusion in this present study. Patients who had undergone major
surgery in the past 5 years or had severe cardiogenic and/or
hypovolemic shock (2 cases), severe infection (2 cases), graft loss
(returning to dialysis, retransplantation or death, 0 cases) and
incomplete medical records (1 case) were excluded. There was no
clinical evidence of acute allograft rejection. Finally, a total of
87 KTRs aged 47±14 years (range, 23–77 years) were enrolled in the
present study, including 66 males and 21 females. They were divided
into a CAD group (n=42) and a non-CAD group (n=45). The KTRs were
treated with triple immunosuppressive regimens, including a
glucocorticoid, mycophenolic acid and calcineurin inhibitor.
Diagnosis
The definition of CAD was based on the Kidney
Disease Improving Global Outcomes guidelines, specifically an
estimated glomerular filtration rate (eGFR) <40 ml/min and/or
proteinuria >500 mg/day (9). The
Modification of Diet in Renal Disease Study formula was used to
calculate the eGFR (10).
Observation indicators
The basic information of each patient was carefully
recorded, including age, sex, weight, height, medical history
(years after kidney transplantation, complications and infections),
vital signs immediately after admission (temperature, heart rate
and respiratory rate) and inflammatory markers, including white
blood cells (WBC; reference range, 4–10×109 cells/l),
neutrophil percentage (N%; reference range, 40–75%), PCT and
C-reactive protein (CRP; reference range, 0–10.0 mg/l). A Sysmex
XN9000 (Hyogo) was used for normal blood tests. A Cobas8000 (Roche)
was used to determine PCT with reference range of 0.021–0.500
ng/ml. An AU5800 (Beckman Coulter) was used to determine further
biochemical indicators, including alanine aminotransferase (ALT;
u/l), aspartate aminotransferase (AST; u/l), fasting blood glucose
(FBG; mmol/l), creatinine (µmol/l), urea nitrogen (mmol/l), uric
acid (µmol/l), triglyceride (TG; mmol/l), high-density lipoprotein
(HDL; mmol/l), low-density lipoprotein (LDL; mmol/l) and
lipoprotein(a) [Lp(a), mg/l]. Blood samples were measured within 24
h of admission and collected prior to the use of antibiotics.
Statistical analysis
SPSS 13.0 statistical software (SPSS, Inc.) was used
for statistical analysis of all data. The Kolmogorov-Smirnov test
was used to assess normality of distribution. Measurement data with
a normal distribution are expressed as the mean ± standard
deviation. The median (first and third quartile) was used to
represent measurement data with a non-normal distribution. Count
data are expressed as n (%). The independent samples t-test was
used to compare data between two groups with a normal distribution.
The Mann-Whitney U test was used to compare data between two groups
with a non-normal distribution. The χ2-test was used for
comparison of rates. The comparison between the diagnostic
efficiencies of the different indicators was based on the receiver
operating characteristic curve (ROC) analysis and area under the
curve (AUC). The sensitivity and specificity were calculated and
the cut-off value was determined using the Youden index. Univariate
and multivariate binary logistic regression analysis was used to
calculate odds ratios (ORs) with 95% CI for the association of
various parameters with the risk of CAD. P<0.05 was considered
to indicate statistical significance.
Results
Clinical features of KTRs in the CAD
and non-CAD group
The clinical features of KTRs in CAD and non-CAD
group are listed in Table I.
Compared with the non-CAD group, the CAD group had a higher ratio
of male patients (P=0.010), a lower body mass index (BMI; P=0.041),
a larger amount of years after transplantation (P<0.001), a
higher serum concentration of PCT, N% and Lp(a) (P=0.001–0.004) and
a lower serum concentration of AST, HDL and LDL (P=0.001–0.044). No
differences between the two groups were identified in terms of age,
frequency of local infection, location of infection, comorbidities,
CRP, WBC, ALT, FBG and TG (all P>0.05).
 | Table I.Clinical characteristics of KTRs in
the CAD and non-CAD groups. |
Table I.
Clinical characteristics of KTRs in
the CAD and non-CAD groups.
| Characteristic | Reference ranges | Non-CAD (n=45) | CAD (n=42) |
t/χ2/Z | P-value |
|---|
| Age (years) | – | 44±16a | 50±10a | 1.888 | 0.063 |
| Male gender | – | 29
(64.4)b | 37
(88.1)b | 6.636 | 0.010 |
| BMI
(kg/m2) | – |
21.99±3.27a |
20.50±3.35a | 2.076 | 0.041 |
| Time after
transplantation (years) | – | 6±5a | 11±5a | 3.847 | <0.001 |
| Local infection | – | 22
(48.9)b | 22
(52.4)b | 0.106 | 0.745 |
| Infection
location |
|
|
|
|
|
|
Respiratory tract | – | 10
(22.2)b | 15
(35.7)b | 1.931 | 0.165 |
| Urinary
tract | – | 8 (17.8)b | 4 (9.5)b | 0.647 | 0.421 |
|
Gastrointestinal tract | – | 4 (8.9)b | 4 (9.5)b | 0.000 | 0.786 |
| Comorbidities |
|
|
|
|
|
| Diabetes
mellitus | – | 2 (4.4)b | 8 (19.0)b | 3.232 | 0.072 |
|
Hypertension | – | 5 (11.1)b | 2 (4.8)b | 0.481 | 0.488 |
| Coronary
heart disease | – | 0 (0.0)b | 0 (0.0)b | – | – |
|
Stroke | – | 0 (0.0)b | 1 (2.4)b | – | 0.483 |
| Laboratory
parameters |
|
|
|
|
|
| PCT
(ng/ml) | 0.021–0.500 | 0.059 (0.041,
0.076)c | 0.250 (0.163,
0.644)c | 3.221 | 0.001 |
| CRP
(mg/l) | 0–10.0 | 5.0 (3.9,
6.8)c | 6.1 (4.4,
8.0)c | 1.444 | 0.149 |
| WBC
(×109/l) | 4–10 | 7.47 (5.81,
9.68)c | 6.79 (5.33,
8.66)c | 1.688 | 0.091 |
| N% | 40–75 | 66.2 (53.3,
74.1)c | 74.8 (68.0,
80.9)c | 3.054 | 0.002 |
| ALT
(u/l) | 9–50 | 20 (13,
25)c | 13 (7,
24)c | 1.296 | 0.195 |
| AST
(u/l) | 15–40 | 17 (15,
21)c | 14 (12,
19)c | 2.010 | 0.044 |
| FBG
(mmol/l) | 3.90–6.10 | 4.51 (4.00,
5.08)c | 5.01 (4.18,
5.82)c | 1.939 | 0.052 |
| TG
(mmol/l) | 0.70–2.02 | 1.48 (1.04,
2.16)c | 1.30 (0.89,
2.30)c | 0.080 | 0.936 |
| HDL
(mmol/l) | 0.79–2.00 | 1.40 (1.05,
1.53)c | 1.01 (0.78,
1.20)c | 4.132 | <0.001 |
| LDL
(mmol/l) | 1.50–3.36 | 2.08 (1.72,
2.36)c | 1.57 (1.18,
1.91)c | 3.317 | 0.001 |
| Lp(a)
(mg/l) | 0–300 | 48 (27,
103)c | 121 (73,
239)c | 2.861 | 0.004 |
Comparison of inflammatory markers
between infected and non-infected patients
Among the 87 KTRs, 44 cases (49.4%) had an infection
and 43 cases (50.6%) were without infection. No difference between
the infected and non-infected patients was identified in terms of
PCT, WBC and N% (all P>0.05), but the CRP in the infection group
was significantly higher (P=0.045; Table II).
| Table II.Comparison of inflammatory markers in
the non-infection and local infection groups. |
Table II.
Comparison of inflammatory markers in
the non-infection and local infection groups.
| Characteristic | Non-infection
(n=43) | Local infection
(n=44) | Z | P-value |
|---|
| PCT (ng/ml) | 0.071 (0.046,
0.162)a | 0.187 (0.058,
0.419)a | 1.123 | 0.261 |
| CRP (mg/l) | 4.9 (3.9,
6.6)a | 6.1 (4.9,
8.8)a | 2.008 | 0.045 |
| WBC
(×109/l) | 7.04 (5.57,
9.58)a | 7.18 (5.35,
9.11)a | 0.228 | 0.820 |
| N% | 68.7 (58.1,
75.3)a | 73.5 (59.1,
81.7)a | 1.749 | 0.080 |
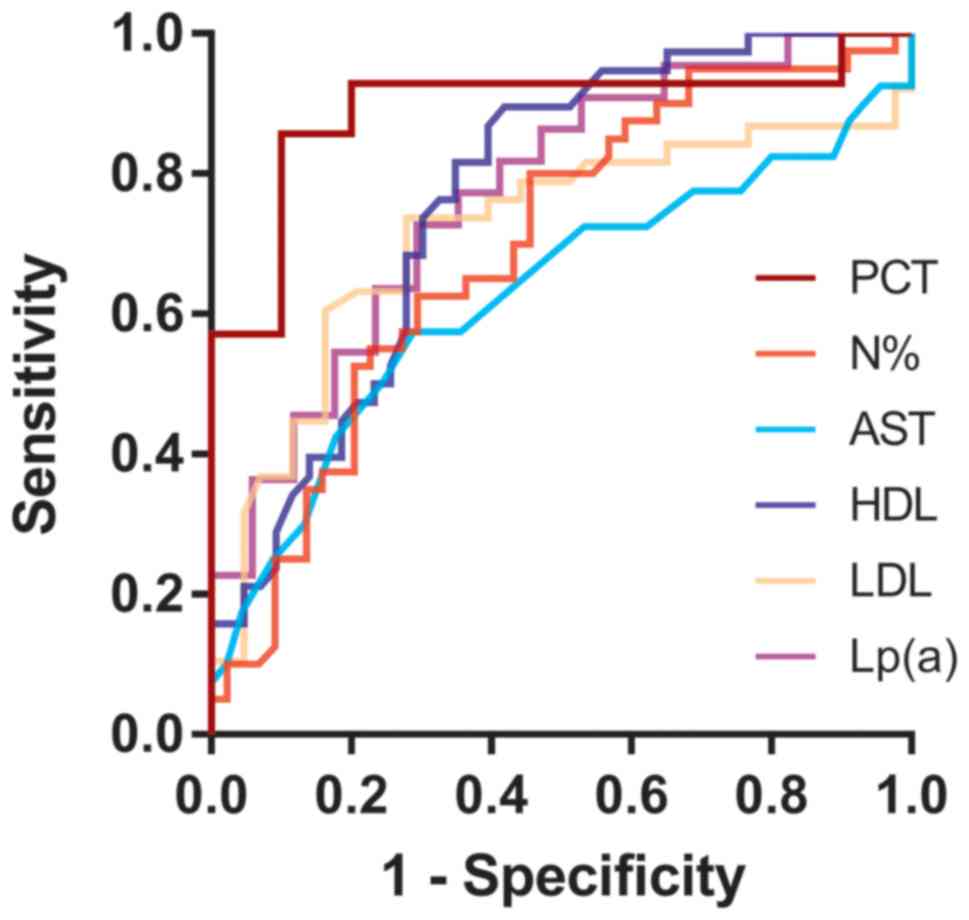
ROC curves of potential biomarkers for
predicting CAD in KTRs
ROC curve analysis indicated that the CRP and WBC
were not able to predict CAD in KTRs (P>0.05; the P-value is the
probability that the observed sample AUC is found when, in fact,
the true AUC is 0.5). The ability of PCT, N%, AST, HDL, LDL and
Lp(a) to predict CAD in KTRs was demonstrated in Table III. Among these, PCT had the
largest AUC (0.893), with a sensitivity of 85.7% and a specificity
of 90.0% at the best cut-off value (0.086 ng/ml), followed by
Lp(a), HDL and LDL; N% and AST had lower AUC (0.694 and 0.626,
respectively) (Fig. 1).
| Table III.Predictive accuracy of various
parameters for chronic allograft dysfunction in kidney transplant
recipients determined by receiver operating characteristics curve
analysis. |
Table III.
Predictive accuracy of various
parameters for chronic allograft dysfunction in kidney transplant
recipients determined by receiver operating characteristics curve
analysis.
| Parameter | AUC | P-value | Cut-off value | Sensitivity
(%) | Specificity
(%) |
|---|
| PCT (ng/ml) | 0.893 | <0.001 | >0.086 | 85.7 | 90.0 |
| N% | 0.694 | 0.001 | >67.1 | 80.0 | 54.5 |
| AST (u/l) | 0.626 | 0.045 | ≤15 | 57.5 | 71.1 |
| HDL (mmol/l) | 0.767 | <0.001 | ≤1.27 | 89.5 | 58.1 |
| LDL (mmol/l) | 0.715 | 0.001 | ≤1.82 | 73.7 | 72.1 |
| Lp(a) (mg/l) | 0.770 | <0.001 | >83 | 72.7 | 70.6 |
Logistic regression analysis of CAD in
patients after kidney transplantation
To determine the predictive value of PCT regarding
CAD under exclusion of the interaction with other inflammatory
indicators, logistic regression analysis was performed. The cohort
of KTRs was stratified into two groups based on the serum PCT
levels at the best cut-off value (0.086 ng/ml). CAD was regarded as
the dependent variable, while gender, BMI, years after
transplantation, PCT, N% AST, HDL, LDL and Lp(a) were taken as
independent variables (Table IV).
The results indicated that elevated PCT was a unique independent
risk factor for CAD in KTRs (OR=40.500, 95%CI=3.093–530.293,
P=0.005).
| Table IV.Univariate and multivariate logistic
regression analysis of chronic allograft dysfunction in kidney
transplant recipients. |
Table IV.
Univariate and multivariate logistic
regression analysis of chronic allograft dysfunction in kidney
transplant recipients.
|
| Univariate | Multivariate |
|---|
|
|
|
|
|---|
| Factor | OR (95% CI) | P-value | OR (95% CI) | P-value |
|---|
| Age (years) | 1.030
(0.998–1.063) | 0.069 |
|
|
| Male gender | 4.083
(1.338–12.459) | 0.013 | 1.030
(0.060–17.788) | 0.984 |
| BMI
(kg/m2) | 0.871
(0.761–0.997) | 0.045 | 1.006
(0.661–1.531) | 0.978 |
| Years after
transplantation | 1.169
(1.069–1.280) | 0.001 | 1.164
(0.900–1.505) | 0.248 |
| Diabetes
mellitus | 5.059
(1.008–25.396) | 0.049 | 2.074
(0.383–11.226) | 0.397 |
| PCT (>0.086
ng/ml)a | 54.000
(4.211–692.484) | 0.002 | 40.500
(3.093–530.293) | 0.005 |
| WBC
(×109/l) | 0.863
(0.725–1.027) | 0.096 |
|
|
| N%
(>67.1)a | 4.800
(1.809–12.737) | 0.002 | 0.175
(0.002–16.428) | 0.452 |
| AST (≤15
u/l)a | 3.330
(1.355–8.185) | 0.009 | 2.205
(0.065–74.753) | 0.660 |
| HDL (≤1.27
mmol/l)a | 11.806
(3.555–39.203) | <0.001 | 7.467
(0.201–276.716) | 0.275 |
| LDL (≤1.82
mmol/l)a | 7.233
(2.708–19.322) | <0.001 | 7.594
(0.317–181.925) | 0.211 |
| LP(a) (>83
mg/l)a | 6.400
(1.573–26.034) | 0.010 | 9.364
(0.312–281.445) | 0.198 |
Discussion
Renal transplantation is considered a unique optimum
therapy for patients with end-stage renal disease (ESRD). Despite
the tremendous improvement in short-term renal allograft survival,
long-term graft survival is limited, as most of KTRs fail within 10
years after transplantation. CAD is a complex process with multiple
factors and is closely linked to progressive renal fibrosis and
tubular atrophy.
CAD remains the leading cause of late graft failure
(11). In the present study, the
ratio of males in the CAD group was higher, which means that males
may be more likely to have poor renal transplant outcome than
females. The reasons may include more frequent acute rejection due
to a higher likelihood of human leukocyte antigen mismatch, no
advantage in hormones and complex immunological processes, as well
as worse compliance to immunosuppressants (12).
Obesity and increased BMI are considered to be
accompanied by an elevated incidence of renal allograft
insufficiency or CAD (13,14). However, the present results were not
comparable with this, as the proportion of obese and overweight
subjects in the CAD and the non-CAD group was very low. The lower
BMI in the CAD vs. the non-CAD group of the present study may in
part be explained by the distribution characteristics of the
nutritional status of the subjects. Chronic inflammation, which is
common in patients with uremia, is linked with malnutrition,
resulting in a novel concept named malnutrition-inflammation
complex syndrome, which was suggested to be independently
associated with increased mortality risk and adverse transplant
outcome (15).
The most noteworthy observation of the present study
is the independent predictive value of serum PCT levels regarding
the risk of progression to CAD in KTR patients. There are three
reasonable explanations for this: i) The relatively high serum PCT
level may reflect the activity of chronic low-grade inflammation in
renal allograft rejection, which indirectly reflects the tendency
of future progression to renal failure (16). Stimulated renal parenchymal cells may
directly release PCT into the circulation in response to this
sustained inflammatory response. Furthermore, indirectly, renal
tissue also releases cytokines into the bloodstream, which induces
an increase in chronic low-grade production and induces other
tissues, possibly including adipose tissue, to release PCT into the
circulatory pool (17,18). ii) Proteinuria may be one of the
mechanisms that link increased PCT concentration and CAD. van Ree
et al (4) suggested that high
levels of PCT, which may predict renal allograft failure, reflects
the release of PCT by renal parenchymal cells into the circulation,
and it is a feedback to the infiltration and activation of renal
macrophages associated with proteinuria. iii) The same study
indicated that PCT predicted non-proteinuric graft failure in KTRs,
which may be due to the cascade of macrophage activity and
interstitial inflammation being completely activated, even if the
urinary protein level of renal tubular epithelial cells has not yet
reached the upper limit of the reabsorption capacity, indicating
PCT may be an earlier biomarker in the progression of CAD than
proteinuria. Furthermore, the lower limit of the plasma PCT
concentration for predicting the risk of CAD was 0.086 ng/ml, which
is well below that of the presence of infection detected with the
method of the present study. Therefore, an ultrasensitive assay is
required to detect the PCT concentration.
Chronic rejection specifically refers to the
progressive loss function of the transplanted kidney, the
pathogenesis of which shares identical pathways with
atherosclerosis (19). Lp(a),
similar to other biomarkers of lipid metabolism, is a
genetically-determined and forceful risk factor for atherosclerosis
contributing to cardiovascular events (CVEs) (20). Increased Lp(a) levels, also
considered a prototype candidate for the uremic toxin, are present
in patients with CKD, including those with ESRD on dialysis
(21–23). In the present study, among all lipid
analysis indicators, Lp(a) was the most effective in predicting CAD
of KTRs, as the AUC was the largest. Therefore, Lp(a) may be
superior to HDL and LDL in predicting CAD. However, the mechanism
of lipid metabolism affecting the progress of CAD remains to be
fully elucidated. There are two hypothesized mechanisms of action.
The former mechanism is that of the pathogenesis of endothelial
dysfunction and macrovascular and small-vessel disease, which is
composed of pro-inflammatory and pro-thrombotic properties of
Lp(a), and in addition, oxidized phospholipids may lead to
inflammatory reactions in cells and tissues. The strongest data
supporting the latter hypothesis come from a temporal evaluation of
Lp(a) levels with a decline of >35% in patients after renal
transplantation (22). The latter
mechanism is the decreased renal scavenging capability of Lp(a) in
patients with renal failure, which has been demonstrated by the
distribution difference of the plasma Lp(a) concentration in renal
arteries and veins and by the urine apolipoprotein A fragments
(22). Such a negative correlation
between Lp(a) levels and renal function, triggering a vicious
circle, leads to CVEs even in patients with early renal impairment
(22,24).
Based on a previous study, the predictive efficiency
of PCT in local infection of CKD patients is not as good as that of
traditional inflammatory biomarkers (e.g. CRP), yet it has a
significant advantage in predicting sepsis (8). Similarly, in the present study, PCT was
not able to identify local infection in renal transplant
recipients. Thus, it may be speculated that in septic KTRs, PCT may
principally participate in the systemic inflammatory response
syndrome due to severe infection, while Lp(a) may be a more useful
biomarker to predict CAD progression. Whether Lp(a) may be used as
a valuable index for CAD in septic KTRs remains to be further
explored.
Unlike previous studies, the present study did not
exclude KTRs with focal infection, considering the high prevalence
of infection due to the long-term use of immunosuppressive drugs.
Of note, the levels of inflammatory markers, including PCT, N% and
WBC, exhibited no statistically significant difference between the
infection and non-infection subgroups, suggesting that these
inflammatory markers are not able to predict focal infection in
KTRs. Combined with the results of a recent study (8), as a by-conclusion of the present study,
it may be suggested that PCT cannot predict local infection in CKD
patients and KTRs with or without CAD.
The present study had a few limitations: i) It was
limited by its retrospective nature; ii) given the small sample
size, the conclusions require further confirmation by a
larger-sample survey; iii) the study was a single-center study with
selection bias; iv) KTRs with severe infection, a common
complication contributing to poor prognosis regarding graft
survival, were not included in the study; v) the mechanism of lipid
metabolism affecting the progress of CAD remains elusive.
In conclusion, PCT was proved to be a unique
independent risk factor of CAD in KTRs. However, PCT, WBC and N%
cannot predict local infection in KTRs except CRP. Therefore, even
in KTRs with local infection, elevated PCT may still be a potential
indicator for poor prognosis regarding renal graft survival.
Acknowledgements
Not applicable.
Funding
The present study was funded by the Fifth-phase
Research Project Funding Program for the ‘333 Project’ in Jiangsu
Province (grant no. BRA 2017116), the Science and Technology Bureau
Supporting Project in Changzhou City (grant no. CE 20175030) and
Health Top-notch Personnel in Changzhou City (grant no. KY
201757).
Availability of data and materials
The datasets used and/or analyzed during the current
study are available from the corresponding author on reasonable
request.
Authors' contributions
JY and YS conceived of the study, and drafted the
manuscript. LJ and DX carried out the experiments. YS participated
in the design of the study and performed the statistical analysis.
All authors read and approved the final manuscript.
Ethics approval and consent to
participate
The present study was approved by the Ethics
Committee of the Third Affiliated Hospital of Soochow University
(Changzhou, China) and all patients signed informed consent
forms.
Patient consent for publication
Not applicable.
Competing interests
The authors declare that they have no competing
interests.
References
|
1
|
Yu XY, Wang Y, Zhong H, Dou QL, Song YL
and Wen H: Diagnostic value of serum procalcitonin in solid organ
transplant recipients: A systematic review and meta-analysis.
Transplant Proc. 46:26–32. 2014. View Article : Google Scholar : PubMed/NCBI
|
|
2
|
Bhatti AB and Usman M: Chronic renal
transplant rejection and possible anti-proliferative drug targets.
Cureus. 7:e3762015.PubMed/NCBI
|
|
3
|
Kreis HA and Ponticelli C: Causes of late
renal allograft loss: Chronic allograft dysfunction, death, and
other factors. Transplantation. 71 (Suppl 11):SS5–SS9.
2001.PubMed/NCBI
|
|
4
|
van Ree RM, de Vries AP, Oterdoom LH,
Seelen MA, Gansevoort RT, Schouten JP, Struck J, Navis G, Gans RO,
van der Heide JJ, et al: Plasma procalcitonin is an independent
predictor of graft failure late after renal transplantation.
Transplantation. 88:279–287. 2009. View Article : Google Scholar : PubMed/NCBI
|
|
5
|
Sager R, Kutz A, Mueller B and Schuetz P:
Procalcitonin-guided diagnosis and antibiotic stewardship
revisited. BMC Med. 15:152017. View Article : Google Scholar : PubMed/NCBI
|
|
6
|
Dumea R, Siriopol D, Hogas S, Mititiuc I
and Covic A: Procalcitonin: Diagnostic value in systemic infections
in chronic kidney disease or renal transplant patients. Int Urol
Nephrol. 46:461–468. 2014. View Article : Google Scholar : PubMed/NCBI
|
|
7
|
Grace E and Turner RM: Use of
procalcitonin in patients with various degrees of chronic kidney
disease including renal replacement therapy. Clin Infect Dis.
59:1761–1767. 2014. View Article : Google Scholar : PubMed/NCBI
|
|
8
|
Sun Y, Jiang L and Shao X: Predictive
value of procalcitonin for diagnosis of infections in patients with
chronic kidney disease: A comparison with traditional inflammatory
markers C-reactive protein, white blood cell count, and neutrophil
percentage. Int Urol Nephrol. 49:2205–2216. 2017. View Article : Google Scholar : PubMed/NCBI
|
|
9
|
Kidney Disease: Improving Global Outcomes
(KDIGO) Transplant Work Group: KDIGO clinical practice guideline
for the care of kidney transplant recipients. Am J Transplant. 9
(Suppl 3):S1–S155. 2009. View Article : Google Scholar
|
|
10
|
National Kidney Foundation, . K/DOQI
clinical practice guidelines for chronic kidney disease:
Evaluation, classification, and stratification. Am J kidney Dis. 39
(2 Suppl 1):S1–S266. 2002.PubMed/NCBI
|
|
11
|
Kaplan B: Overcoming barriers to long-term
graft survival. Am J Kidney Dis. 47 (4 Suppl 2):S52–S64. 2006.
View Article : Google Scholar : PubMed/NCBI
|
|
12
|
Chen PD, Tsai MK, Lee CY, Yang CY, Hu RH,
Lee PH and Lai HS: Gender differences in renal transplant graft
survival. J Formos Med Assoc. 112:783–788. 2013. View Article : Google Scholar : PubMed/NCBI
|
|
13
|
Grosso G, Corona D, Mistretta A, Zerbo D,
Sinagra N, Giaquinta A, Caglià P, Amodeo C, Leonardi A, Gula R, et
al: The role of obesity in kidney transplantation outcome.
Transplant Proc. 44:1864–1868. 2012. View Article : Google Scholar : PubMed/NCBI
|
|
14
|
Papalia T, Greco R, Lofaro D, Maestripieri
S, Mancuso D and Bonofiglio R: Impact of body mass index on graft
loss in normal and overweight patients: Retrospective analysis of
206 renal transplants. Clin Transplant. 24:E241–E246. 2010.
View Article : Google Scholar : PubMed/NCBI
|
|
15
|
Molnar MZ, Czira ME, Rudas A, Ujszaszi A,
Lindner A, Fornadi K, Kiss I, Remport A, Novak M, Kennedy SH, et
al: Association of the malnutrition-inflammation score with
clinical outcomes in kidney transplant recipients. Am J Kidney Dis.
58:101–108. 2011. View Article : Google Scholar : PubMed/NCBI
|
|
16
|
Vazquez MA, Jeyarajah DR, Kielar ML and Lu
CY: Long-term outcomes of renal transplantation: A result of the
original endowment of the donor kidney and the inflammatory
response to both alloantigens and injury. Curr Opin Nephrol
Hypertens. 9:643–648. 2000. View Article : Google Scholar : PubMed/NCBI
|
|
17
|
Becker KL, Nylén ES, White JC, Müller B
and Snider RH Jr: Clinical review 167: Procalcitonin and the
calcitonin gene family of peptides in inflammation, infection, and
sepsis: A journey from calcitonin back to its precursors. J Clin
Endocrinol Metab. 89:1512–1525. 2004. View Article : Google Scholar : PubMed/NCBI
|
|
18
|
Becker KL, Snider R and Nylen ES:
Procalcitonin assay in systemic inflammation, infection, and
sepsis: Clinical utility and limitations. Crit Care Med.
36:941–952. 2008. View Article : Google Scholar : PubMed/NCBI
|
|
19
|
Wahn F, Daniel V, Kronenberg F, Opelz G,
Michalk DV and Querfeld U: Impact of apolipoprotein(a) phenotypes
on long-term renal transplant survival. J Am Soc Nephrol.
12:1052–1058. 2001.PubMed/NCBI
|
|
20
|
Kronenberg F: Human genetics and the
causal role of lipoprotein(a) for various diseases. Cardiovasc
Drugs Ther. 30:87–100. 2016. View Article : Google Scholar : PubMed/NCBI
|
|
21
|
Florens N, Calzada C, Lyasko E, Juillard L
and Soulage CO: Modified lipids and lipoproteins in chronic kidney
disease: A new class of uremic toxins. Toxins (Basel). 8:E3762016.
View Article : Google Scholar : PubMed/NCBI
|
|
22
|
Kronenberg F: Causes and consequences of
lipoprotein(a) abnormalities in kidney disease. Clin Exp Nephrol.
18:234–237. 2014. View Article : Google Scholar : PubMed/NCBI
|
|
23
|
Barter P: Lipoprotein metabolism and CKD:
Overview. Clin Exp Nephrol. 18:243–246. 2014. View Article : Google Scholar : PubMed/NCBI
|
|
24
|
Catena C, Colussi G, Nait F, Pezzutto F,
Martinis F and Sechi LA: Early renal failure as a cardiovascular
disease: Focus on lipoprotein(a) and prothrombotic state. World J
Nephrol. 4:374–378. 2015. View Article : Google Scholar : PubMed/NCBI
|