Introduction
Hepatitis B surface antigen (HBsAg) is one of the
most important pathogen markers and provides direct evidence of
hepatitis B virus (HBV) infection. Detection of low serum HBsAg
levels has important clinical and epidemiological significance.
Certain patients with HBV infection have been reported to have low
serum HBsAg levels (1–5) with confirmed nucleic acid replication
(6–8), a result that poses new challenges for
the prevention and treatment of hepatitis B. These phenomena have
drawn attention from clinicians, laboratory diagnostic experts,
epidemiologists and molecular biologists (9–15).
It is widely accepted that the level of HBsAg and
HBV DNA decreases progressively from the immune-tolerant to the low
replicative phase. This phenomenon is thought to be associated with
anti-viral therapy or the occurrence of complex host-virus
interactions during the natural course of HBV infection (16,13). The
clinical outcome of HBV-infected patients with low-level HBsAg is
usually more satisfactory (17,18). A
retrospective cohort study by Li et al (19) indicated that interferon treatment
results in HBsAg loss and seroconversion in inactive HBsAg carriers
with serum HBsAg levels <100 IU/ml and undetectable levels of
HBV DNA (<100 IU/ml). Seto et al (20) reported on the results of a large
case-control study regarding the predictability of HBsAg levels
three years prior to HBsAg seroclearance; it was indicated that
serum HBsAg <200 IU/ml and a 0.5-log reduction in HBsAg were
predictive of HBsAg seroclearance within three years of follow-up.
However, the kinetics of HBsAg levels preceding spontaneous HBsAg
seroclearance have not been fully investigated, and there are few
reports on the clinical characteristics or association between HBV
DNA and HBV markers in populations with low HBsAg levels (6,7). The
present study aimed to investigate the clinical features and
association of persistent low-level HBsAg in a population of
patients with HBV infection who underwent a physical examination.
The results have important clinical significance regarding the
accumulation of clinical, virological and molecular epidemiological
data and the prevention of HBV transmission, particularly in the
HBV-infected population with low HBsAg levels.
Materials and methods
Sample collection
Prior to enrollment, each participant provided
written informed consent to participate in the study. The study was
approved by the Medical Ethics Committee of the 117th Hospital of
the PLA under protocol no. PLA-117-20160518. A total of 45,256
adults (age range, 18–74 years; mean age: 45.96±12.98 years)
consisting of 28,959 males (age range, 18–73 years; mean age,
45.64±12.77 years) and 16,297 females (age range, 19–74 years; mean
age, 46.45±13.32 years) received physical examinations at our
hospital between June 2014 and June 2016. The chemiluminescence
immunoassay (CMIA), an Architect i2000 analyzer (Abbott Core
Laboratory) and the matching HBsAg kits (cat. no. 6C36-32) for
HBsAg screening were used. Subsequently, HBsAg-positive serum
samples from 2,544 subjects with HBV infection were included in the
study. The subjects with low-level HBsAg (<10 IU/ml) received at
least three follow-up examinations within 3–12 months (once every
three months) to distinguish them from patients in the early stages
of HBV infection, those with acute HBV infection, and those who had
short-term or transient low HBsAg levels due to being in the
recovery stage of the HBsAg/anti-HBs transition. A low HBsAg level
in patients with HBV infection was defined as the absence of an
HBsAg level ≥10 IU/ml during the entire follow-up period of the
study. None of the patients had received any anti-viral drugs or
treatment for liver protection, aminotransferase activity reduction
or immunomodulation within six months prior to serum collection.
The specimens collected were preserved at −70°C.
Determination of clinical laboratory
parameters
Clinical laboratory and demographic parameters,
including age, sex, albumin (ALB), total bilirubin (TBil), alanine
aminotransferase (ALT), aspartate aminotransferase (AST), blood
platelets (PLT), HBsAg, antibody against HBsAg (anti-HBs),
hepatitis Be antigen (HBeAg), antibody against HBeAg (anti-HBe),
antibody against hepatitis B core antigen (anti-HBc) and HBV DNA,
were determined and recorded at the time of physical examination.
The AST-to-platelet ratio (APRI) was calculated. Biochemical tests
were performed using an Architect C8000 analyzer (Abbott Core
Laboratory), and PLT was determined with an XE2100 blood analyzer
(Sysmex). Serum HBV DNA was measured using the StepOne Plus
Real-Time PCR System (Applied Biosystems; Thermo Fisher Scientific,
Inc.). HBV and other serum markers were measured using the
Architect i2000 (Abbott Core Laboratory) and the Maglumi 4000
(Shenzhen New Industries Biomedical Engineering Co., Ltd.)
according to the manufacturer's protocol. HBV DNA >30 IU/ml,
HBsAg >0.05 IU/ml, anti-HBs >10 mIU/ml, HBeAg >1.0 S/CO
(defined as sample relative light unit/relative cut-off light
unit), anti-HBe <1.0 S/CO or anti-HBc >1.0 S/CO indicated
positive results. If the HBsAg value measured in the Architect
i2000 analyzer was >250 IU/ml, the sample was diluted to the
measurable range (<250 IU/ml) in normal saline.
To verify the accuracy and consistency of the
quantitative measurement of HBsAg levels, another CMIA was
performed on 100 randomly selected HBsAg-positive specimens using a
Maglumi 4000 analyzer and the matching HBsAg kits (cat. no.
130210001M). The neutralization test was used to confirm the
results indicating low-level HBsAg levels. Confirmation of HBsAg
using the neutralization test was performed as follows: First, 100
µl of the collected HBsAg-positive serum sample was added to two
sample tubes. Subsequently, either 100 µl of anti-HBs (1,000 IU/ml;
Acon Biotech; for measurement) or 100 µl normal saline (as a
control) was added; the samples were mixed well and incubated in a
37°C water bath for 30 min, followed by determination of HBsAg
using the CMIA method. If [(control value-measurement
value)/control value] ≥50%, the original serum was considered
HBsAg-positive; otherwise, the original serum was considered to be
a false-positive for HBsAg.
Extraction and detection of HBV
DNA
HBV DNA was extracted from patients' sera using the
NP968 nucleic acid extraction system and a nucleic acid extraction
kit (TianLong Science and Technology Co., Ltd) with slight
modifications to the routine and enrichment methods. In brief, in
the routine method, the 96-well plates for HBV DNA extraction were
placed in the NP968 nucleic acid extraction system, and 200 µl of
the serum samples and 20 µl of trypsin were added to the first
column. The magnetic bars were moved from the second column (with
immunomagnetic beads) to the first column, followed by lysis at
90°C for 15 min. Subsequently, the magnetic bars were moved from
the first column wells to the 3rd column and then to the 4th
column; the wells in each column were then washed for 2 min at
85°C. Finally, the magnetic bars were placed into the wells of the
fifth column, followed by elution at 85°C for 5 min in an elution
volume of 100 µl. The magnetic bars were removed, and the magnetic
beads were discarded. A total of 100 µl of eluent (i.e., HBV DNA
extract) was collected for real-time quantitative fluorometric
detection of HBV DNA, according to the manufacturer's protocol of
HBV DNA fluorescence quantitative detection reagent kit [ACON
Biotech (Hangzhou) co., Ltd.] and an ABI StepOnePlus™ real-time PCR
system (Applied Biosystems; Thermo Fisher Scientific, Inc.).
Additionally, only difference between the enrichment method and
routine method was that 500 µl serum samples and 50 µl trypsin were
added to the first column in the first stage (Slight
modifications). The remaining HBV DNA extract was stored at −70°C.
In the assessment of the results, levels of ≥30 IU/ml were
considered HBV DNA-positive. In addition, HBV DNA was extracted
from the low-level HBsAg group using the enrichment method. The
enrichment method utilized 500 µl of the serum samples and 50 µl of
trypsin; the remaining steps were identical to those of the routine
method.
Sequencing of HBV gene S
The HBV gene S was examined in all 97 cases in the
low-level HBsAg group and in 100 randomly selected cases from the
high-level HBsAg group, the members of which were positive for HBV
DNA by the routine method. The HBV gene S was amplified using the
nested PCR method as described in the literature (21). The positive PCR product was
recovered, purified and sent to Sangon Biotech Co., Ltd. for
sequencing. The primers used for amplification included a pair of
outer primers for amplification, including forward,
5′-ACCWTATWCYTGGGAACAA-3′, nucleotide (nt) positions 2,819-2,837;
and reverse, 5′-TCAGCAAAYACTYGGCA-3′, nt 1,190-1,174 and two pairs
of inner primers, Ia forward, 5′ACCWTATWCYTGGGAACAA-3′, nt
2,819-2,837; and reverse, 5′-GAYGAYGGGATGGGAATACA-3′, nt 617–598
and Ib forward, 5′-GACTYGTGGTGGACTTCTC-3′, nt: 251–269; and
reverse, 5′-TCAGCAAAYACTYGGCA-3′, nt 1,190-1,174. The PCR
amplification reaction mixture contained 5 µl 5X KAPA2G buffer A, 5
µl 5X KAPA enhancer, 0.1 µl of KAPA2G RobustHotStart DNA
polymerase, 0.5 µl of 10 µM dNTP Mix (TaKaRa Bio, Inc.), 1 µl of a
10M solution of each primer, 3 µl DNA template and water for PCR to
fill up to a final volume of 25 µl in each 25 µl reaction tube. The
first round of amplification included: Pre-denaturation at 95°C for
3 min; followed by five cycles of denaturation at 95°C for 30 sec,
annealing at 57 to 53°C for 30 sec (a temperature decrease of 1°C
per cycle) and extension at 72°C for 30 sec; followed by 30 cycles
of denaturation at 95°C for 30 sec, annealing at 53°C for 30 sec
and extension at 72°C for 30 sec; and a final extension at 72°C for
2 min. The PCR products from the first round of amplification were
used as the DNA template in the second round of amplification,
which was performed using the same amplification conditions and
reaction system as in the first round. The primers used for
amplification were also used as the primers for sequencing. The
information obtained from sequencing was assembled using the
subprogram SeqMan of Lasergene software (Version 7.1.0; DNAstar,
Inc.) followed by a comparison of the sequences using BLAST
(https://blast.ncbi.nlm.nih.gov/Blast.cgi) (22).
Genotype and serotype analysis
MEGA v6.0 software (23) was used to compare and splice the S
gene. The neighbor joining method was used for the homologous
analysis of the sequences obtained from sequencing and the
reference sequences of the genotypes downloaded from GenBank
(24): A (GenBank accession nos,
AF090842 and X02763), B (GenBank accession nos, AB033554, AF100309
and D00329), C (GenBank accession nos, AB014381, AY123041 and
X04615), D (GenBank accession nos, M32138, X65259 and X85254), E
(GenBank accession nos, AB032431 and X75657), F (GenBank accession
nos, X69798, AB036910, AF223965), G (GenBank accession nos,
AB064310, AF160501 and AF405706), and H (GenBank accession nos,
AY090454, AY090457 and AY090460) (considered to be the same
genotype when homology to the S gene was ≥96%) (25). Serotypes were determined based on the
expression of amino acids at specific sites in the sequence of the
S gene according to the literature (26).
Grouping
According to the HBsAg levels measured and using 10
IU/ml as the cut-off value (3,6,7), a total of 2,544 subjects were grouped
into a low-level HBsAg group (<10 IU/ml) and a high-level HBsAg
group (≥10 IU/ml) (3,6,7). The
high-level HBsAg group was further subdivided into three groups
based on cut-off values, 100 IU/ml (19,20) and
200 IU/ml (16,20); the three groups included a ≥10–100
IU/ml group, a ≥100–200 IU/ml group and a ≥200 IU/ml group.
Patients with HBV infection were classified into six
serological pattern groups based on the presence of specific HBV
serological markers (HBsAg, anti-HBs, HBeAg, anti-HBe and
anti-HBc). For convenience, HBV-M1, -M2, -M3, -M4, -M5 and -M6 were
used to represent the HBsAg/HBeAg/anti-HBc-positive,
HBsAg/anti-HBe/anti-HBc-positive, HBsAg/anti-HBc-positive,
HBsAg/HBeAg/anti-HBe/anti-HBc-positive,
HBsAg/anti-HBs/HBeAg/anti-HBc-positive, and HBsAg/anti-
HBs/anti-HBe/anti-HBc-positive serotype, respectively.
According to the laboratory test results for ALT and
clinical diagnostic criteria (27–30), the
patients with HBV infection were divided into asymptomatic carriers
of HBV (ASC) and chronic HBV infection (CHB). ASCs is defined as
HBsAg positivity for >6 months, low or undetectable serum HBV
DNA levels and normal serum ALT levels (<40 IU/ml); CHBs is
defined as HBsAg positivity for >6 months, abnormal or
persistently elevated ALT (ALT≥40 IU/ml) and/or concomitant
clinical manifestations of fatigue, nausea, abdominal distention,
liver pain.
Using 10 years of age as the intergroup interval,
the patients with HBV infection were divided into five age groups
as follows: <30, ≥30-40, ≥40-50, ≥50–60 and ≥60 years of
age.
Statistical analysis
The measurement data are expressed as the mean ±
standard deviation or median (quartiles), and the count data are
expressed as n (%). The prevalence of positivity for HBsAg and HBV
DNA, and the composition ratios of the different groups were
compared using the Chi-squared test. The means of the different
groups were compared based on the distribution types using the
corresponding t-test or analysis of variance (ANOVA) for data with
equal variances (assumed and not assumed), while the
Student-Newman-Keuls (SNK)-q test was used to compare data among
multiple groups, and the Mann-Whitney-U test and Kruskal-Wallis
H-test were used for non-parametric data of two groups and multiple
groups, respectively. Associations of HBV DNA, HBsAg and APRI with
age, HBV markers and liver function indexes were analyzed using
linear or logistic regression. A stepwise logistic regression model
was used to test the association between outcome variables and
associated factors whereby the variables with P<0.1 on
univariate analysis were subjected to multivariate logistic
regression analysis. Plots were prepared using GraphPad Prism 6 for
Windows (GraphPad Software, Inc.). Analysis of the data was
performed using SPSS 12.01 for Windows. P<0.05 was considered to
indicate a statistically significant difference.
Results
HBsAg measurement and
verification
To verify the accuracy of HBsAg determination, 100
of the 2,544 HBsAg-positive specimens were randomly selected and
tested using a Maglumi 4000 analyzer and the supporting HBsAg kits;
the results of this measurement were compared with the results
obtained using the Architect i2000 analyzer and the matching HBsAg
kits. The results indicated that the correlation between the two
instruments was satisfactory [correlation coefficient (r)=0.985;
P<0.05]; furthermore, the r-value obtained for HBsAg <10
IU/ml was 0.991. To ensure the comparability of the results for
HBsAg in the present study, the samples were grouped based on the
quantitative results obtained using the Architect i2000 analyzer
and the matching HBsAg kits.
HBsAg-positive prevalence in the
cohort that underwent physical examination
Of the 45,256 subjects who underwent physical
examination, 2,544 (5.62%) were detected positive for HBsAg; of
these 2,544 cases, 1,663 were male (1,663/28,959, 5.74%) and 881
were female (881/16,297, 5.41%). The number of cases with low-level
HBsAg confirmed by the neutralization test was 392, accounting for
0.87% of the 45,256 cases in the physical examination population
(392/45,256) and 15.41% of the 2,544 HBsAg-positive cases
(392/2,544; Table I). There were no
significant differences between the sexes in mean age or
HBsAg-positive prevalence (P>0.05), but differences were
identified in the prevalence of HBsAg positivity among different
HBsAg level groups and age groups (P<0.05; Tables I and II). In addition, the HBsAg-positive
prevalence exhibited a tendency to increase with age in the
low-level HBsAg group according to linear regression (P<0.05;
Table I; Fig. 1A). Furthermore, an increase in the
prevalence of HBsAg positivity in the distribution prior to 50
years of age and a decrease after 50 years of age was observed in
the high-level HBsAg group (Fig.
1B). The lower prevalence of HBsAg positivity in patients aged
<30 years in the high-level HBsAg group is likely to be linked
to the implementation of an HBV vaccination program in China in
1992 (31). In addition, the lower
prevalence of HBsAg in patients >50 years of age in the
high-level HBsAg group may be associated with spontaneous HBsAg
seroclearance; the levels of HBsAg and HBV DNA gradually decrease
with age due to host-virus interactions (natural clearance phase)
(32).
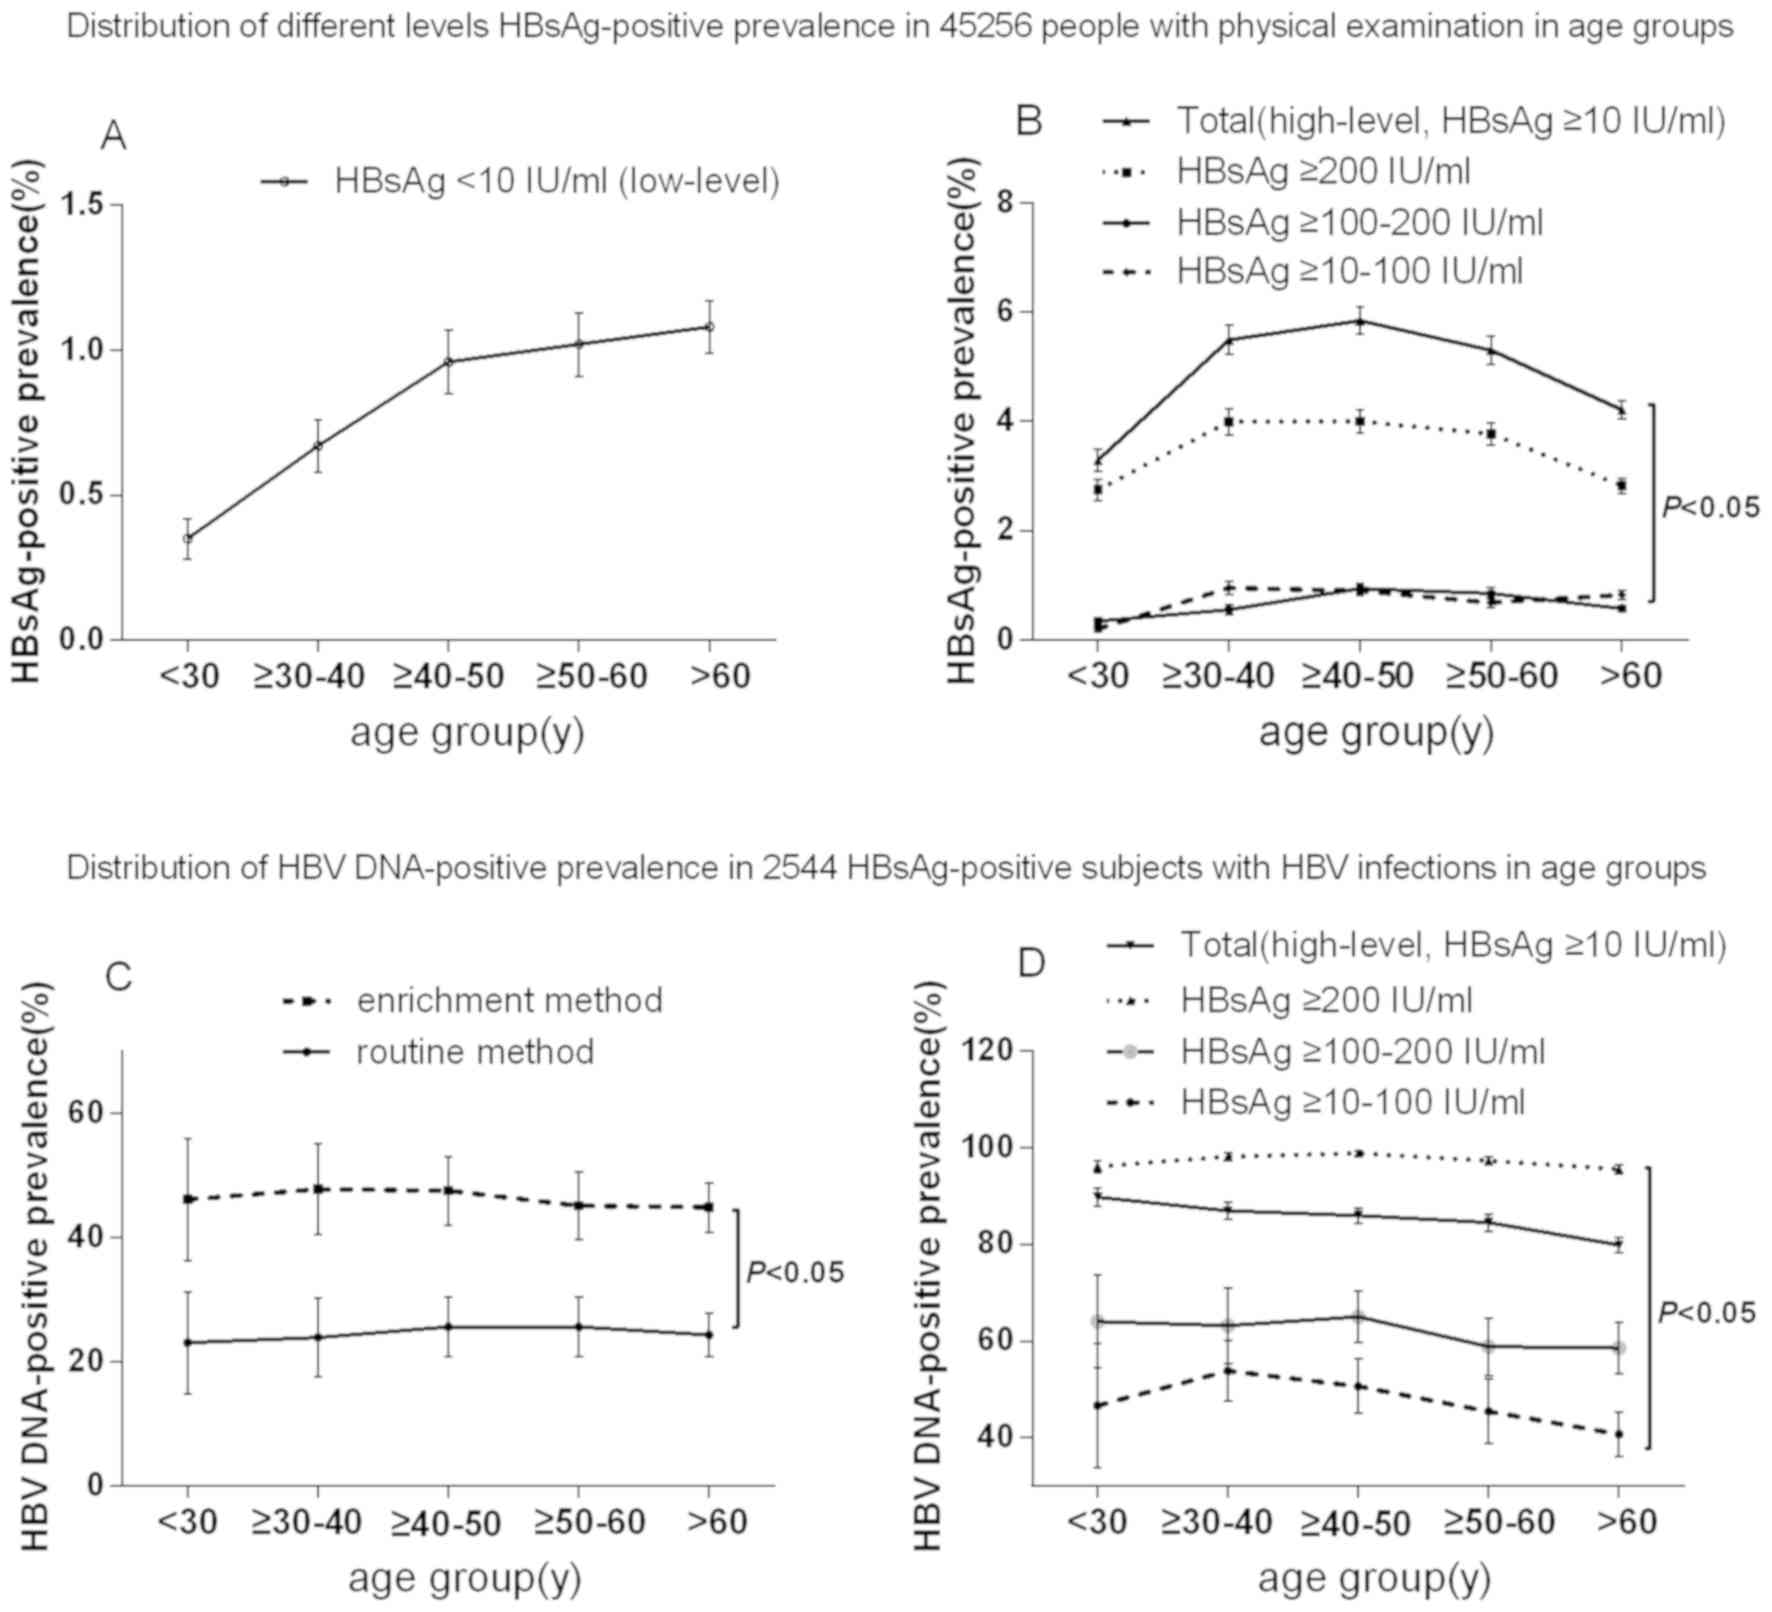 | Figure 1.Distribution of the prevalence of
different level HBsAg positivity and HBV DNA positivity in
HBsAg-level groups according to age in a physical examination
population. (A) Prevalence of HBsAg positivity in the low-level
HBsAg group according to age in a physical examination population.
(B) Prevalence of different levels of HBsAg positivity in the
high-level HBsAg groups (≥10-100, ≥100–200 or ≥200 IU/ml and total
group) according to age in a physical examination population.
P<0.05, ≥10–100 IU/ml group vs. ≥100–200 group, ≥10–100 IU/ml
group vs. ≥200 IU/ml group and ≥10–100 IU/ml group vs. ≥200 IU/ml
group. (C) Prevalence of HBV DNA positivity in the low-level HBsAg
group according to age in a physical examination population.
P<0.05, enrichment method group vs. routine method group. (D)
Prevalence of HBV DNA positivity in the high-level HBsAg group
(≥10-100, ≥100–200 or ≥200 IU/ml, and total group) according to age
in a physical examination population. P<0.05, ≥10–100 IU/ml
group vs. ≥100–200 group, ≥10–100 IU/ml group vs. ≥200 IU/ml group
and ≥10–100 IU/ml group vs. ≥200 IU/ml group. HBV, hepatitis B
virus; HBsAg, hepatitis B surface antigen; y, years. |
 | Table I.Distribution of HBsAg-positive
prevalence in all 45,256 individuals and in 2,544 HBsAg-positive
subjects. |
Table I.
Distribution of HBsAg-positive
prevalence in all 45,256 individuals and in 2,544 HBsAg-positive
subjects.
| A, HBsAg-positive
rate of all subjects |
|---|
|
|---|
|
|
| Group by HBsAg
level (IU/ml) |
|
|---|
|
|
|
|
|
|---|
| Group | n | <10 | ≥10–100 | ≥100–200 | ≥200 | Total | P-value |
|---|
| Sex |
|
Male | 28,959 | 260 (0.90) | 208 (0.72) | 197 (0.68) | 998 (3.45) | 1663 (5.74) | <0.05 |
|
Female | 16,297 | 132 (0.81) | 122 (0.75) | 96 (0.59) | 531 (3.26) | 881 (5.41) | <0.05 |
| P-value |
| >0.05 | >0.05 | >0.05 | >0.05 | >0.05 |
|
| Age (years) |
|
<30 | 7,429 | 26 (0.35) | 15 (0.20) | 25 (0.34) | 204 (2.75) | 270 (3.63) | <0.05 |
|
≥30–40 | 6,866 | 46 (0.67) | 65 (0.95) | 38 (0.55) | 274 (3.99) | 423 (6.16) | <0.05 |
|
≥40–50 | 8,542 | 82 (0.96) | 77 (0.90) | 80 (0.94) | 342 (4.00) | 581 (6.80) | <0.05 |
|
≥50–60 | 8,039 | 82 (1.02) | 55 (0.68) | 68 (0.85) | 303 (3.77) | 508 (6.32) | <0.05 |
|
≥60 | 14,381 | 156 (1.08) | 118 (0.82) | 82 (0.57) | 406 (2.82) | 762 (5.30) | <0.05 |
|
P-value |
|
<0.05a | <0.05 | <0.05 | <0.05 | <0.05 |
|
| Total | 45,256 | 392 (0.87) | 330 (0.73) | 293 (0.65) | 1,529 (3.38) | 2,544 (5.62) | <0.05 |
|
| B, HBV
DNA-positive rate in HBsAg-positive subjects |
|
|
|
| Group by HBsAg
level (IU/ml) |
|
|
|
|
|
|
| Group | n | <10 | ≥10-100 |
≥100-200 | ≥200 | Total | P-value |
|
| Sex |
|
Male | 1,663 | 61 (23.46) | 99 (47.60) | 117 (59.39) | 978 (98.00) | 1,255 (75.47) | <0.05 |
|
Female | 881 | 36 (27.27) | 55 (45.08) | 63 (65.63) | 508 (95.67) | 662 (75.14) | <0.05 |
| P-value |
| >0.05 | >0.05 | >0.05 | >0.05 | >0.05 |
|
| Age (years) |
|
<30 | 270 | 6 (23.08) | 7 (46.67) | 16 (64.00) | 196 (96.08) | 225 (83.33) | <0.05 |
|
≥30–40 | 423 | 11 (23.91) | 35 (53.85) | 24 (63.16) | 269 (98.18) | 339 (80.14) | <0.05 |
|
≥40–50 | 581 | 21 (25.61) | 39 (50.65) | 52 (65.00) | 338 (98.83) | 450 (77.45) | <0.05 |
|
≥50–60 | 508 | 21 (25.61) | 25 (45.45) | 40 (58.82) | 295 (97.36) | 381 (75.00) | <0.05 |
|
≥60 | 762 | 38 (24.36) | 48 (40.68) | 48 (58.54) | 388 (95.57) | 522 (68.50) | <0.05 |
|
P-value |
| >0.05 | >0.05 | >0.05 | >0.05 |
<0.05b |
|
| Total | 2,544 | 97 (24.74) | 154 (46.67) | 180 (61.43) | 1,486 (97.19) | 1,917 (75.35) | <0.05 |
| Table II.Clinical laboratory parameters of
2,544 HBsAg-positive subjects with HBV infection. |
Table II.
Clinical laboratory parameters of
2,544 HBsAg-positive subjects with HBV infection.
|
| Clinical type |
|
|---|
|
|
|
|
|---|
| Parameter | ASC (n=2,093)
≥10–100 | CHB (n=451)
≥200 | Total | P-value |
|---|
| Age (years) |
|
Male | 45.02±12.34
(n=1,539) | 43.18±12.31
(n=124) | 44.87±12.36
(n=1,663) | <0.05 |
|
Female | 46.85±13.14
(n=827) | 42.05±9.84
(n=54) | 46.29±13.02
(n=881) | <0.05 |
|
P-value | >0.05 | >0.05 | >0.05 |
|
| Liver function |
| ALB
(mean ± SD, 64~83 g/l) | 47.04±2.83 | 43.28±1.80 | 45.39±3.07 | <0.05 |
| ALT
[median (Q1, Q3), <40 U/l] | 26 (20, 31) | 66 (54, 118) | 39 (23, 66) | <0.05 |
| AST
[median (Q1, Q3), <40 U/l] | 23 (19, 27) | 41 (38, 80) | 29 (22, 41) | <0.05 |
| PLT
(mean ± SD, 125~350×109/l) | 210.17±41.99 | 187.59±28.45 | 200.26±38.22 | <0.05 |
| TBil
(Mean ± SD, 3.42~20.52 µmol/l) | 16.66±6.60 | 21.03±10.55 | 18.58±8.80 | <0.05 |
| Fibrosis index
APRI | 0.12 (0.09,
0.18) | 0.24 (0.22,
0.42) | 0.16 (0.10,
0.24) | <0.05 |
| Virological
result |
| HBsAg
[median (Q1, Q3), <0.05 IU/ml] | 631.12 | 3,957.50 | 807.51 | <0.05 |
|
| (52.40,
3,376.50) | (1,288.95,
1,5775.50) | (60.90,
3,871.75) |
|
|
Anti-HBs [median (Q1, Q3),
<10 mIU/ml] | 0.22 (0.00,
0.95) | 0.11 (0.00,
0.63) | 0.21 (0.00,
0.93) | <0.05 |
| HBeAg
[median (Q1, Q3), <1.0 S/CO] | 0.39 (0.34,
0.48) | 0.49 (0.38,
371.90) | 0.39 (0.34,
0.59) | <0.05 |
|
Anti-HBe [median (Q1, Q3),
>1.01 S/CO] | 0.01 (0.01,
0.79) | 0.18 (0.01,
35.20) | 0.01 (0.01,
1.08) | <0.05 |
|
Anti-HBc (mean ± SD, <1.0
S/CO) | 12.59±2.51 | 11.87±2.35 | 12.38±2.51 | >0.05 |
| HBV
DNAa [median (Q1, Q3),
log10 IU/ml] | 2.88 (0.00,
4.04) | 6.99 (3.82,
7.97) | 3.03 (0.00,
4.57) | <0.05 |
HBV DNA-positive prevalence and
clinical laboratory parameters in 2,544 cases of HBV infection
Of the 2,544 HBsAg-positive subjects, 2,093 were ASC
and 451 had CHB. The male-to-female ratio was ~1.9:1 (Table I). There were no significant
differences in the HBV DNA-positive prevalence between the sexes or
among age groups (P>0.05; Fig. 1C and
D). However, differences in the HBV DNA-positive prevalence
were noted among the different HBsAg level groups (P<0.05;
Tables I and II), and the HBV DNA-positive prevalence in
the low-level HBsAg group determined using the routine method was
lower than the prevalence determined using the enrichment method
(P<0.05; Fig. 1C). Except for
anti-HBc, all of the clinical laboratory parameters of the 2,544
cases of HBV infection exhibited statistically significant
differences between ASC and CHB (P<0.05; Table II).
When the clinical laboratory parameters were
analyzed with stratification by sex, statistically significant
differences in the mean values of HBeAg (male, 122.90±349.76 S/CO;
female, 125.62±383.38 S/CO), anti-HBc (male, 12.77±2.21 S/CO;
female, 12.19±2.94 S/CO) and mean log values of HBV DNA (male,
3.08±2.84 IU/ml; female: 2.77±2.94 IU/ml) between the two sexes
became apparent (P<0.05). These differences may be linked to the
presence of different HBV markers, serological patterns and
clinical types in the two sexes and may therefore not be clinically
meaningful (data not shown).
Distribution of serological patterns
and clinical types among the 2,544 cases of HBV infection
The subjects were grouped based on an HBsAg
threshold level of 10 IU/ml. In the low-level HBsAg group, the
major serological pattern was HBV-M2
(HBsAg/anti-HBe/anti-HBc-positive; 372/392, 94.90%) and the major
clinical type was ASC (384/392, 97.95%). In the high-level HBsAg
group, the major serological patterns were HBV-M2
(HBsAg/anti-HBe/anti-HBc-positive; 1,627/2,152, 75.60%) and HBV-M1
(HBsAg/HBeAg/anti-HBc-positive; 433/2,152, 20.12%), and the ratios
of the clinical types ASC and CHB were (1,709/2,152, 79.41%) and
(443/2,152, 20.59%) respectively (Table III). There were no significant
differences in the major serological patterns and the major
clinical types between the different HBsAg level groups (<10,
≥10–100 and ≥100–200 IU/ml; P>0.05; Fig. 2A vs. 2B vs. 2C),
whereas there were significant differences in the major serological
patterns and major clinical types between the three groups (<10,
≥10–100 and ≥100–200 IU/ml) and HBsAg ≥100–200 IU/ml group
(P<0.05, Fig. 2A-C vs. 2D).
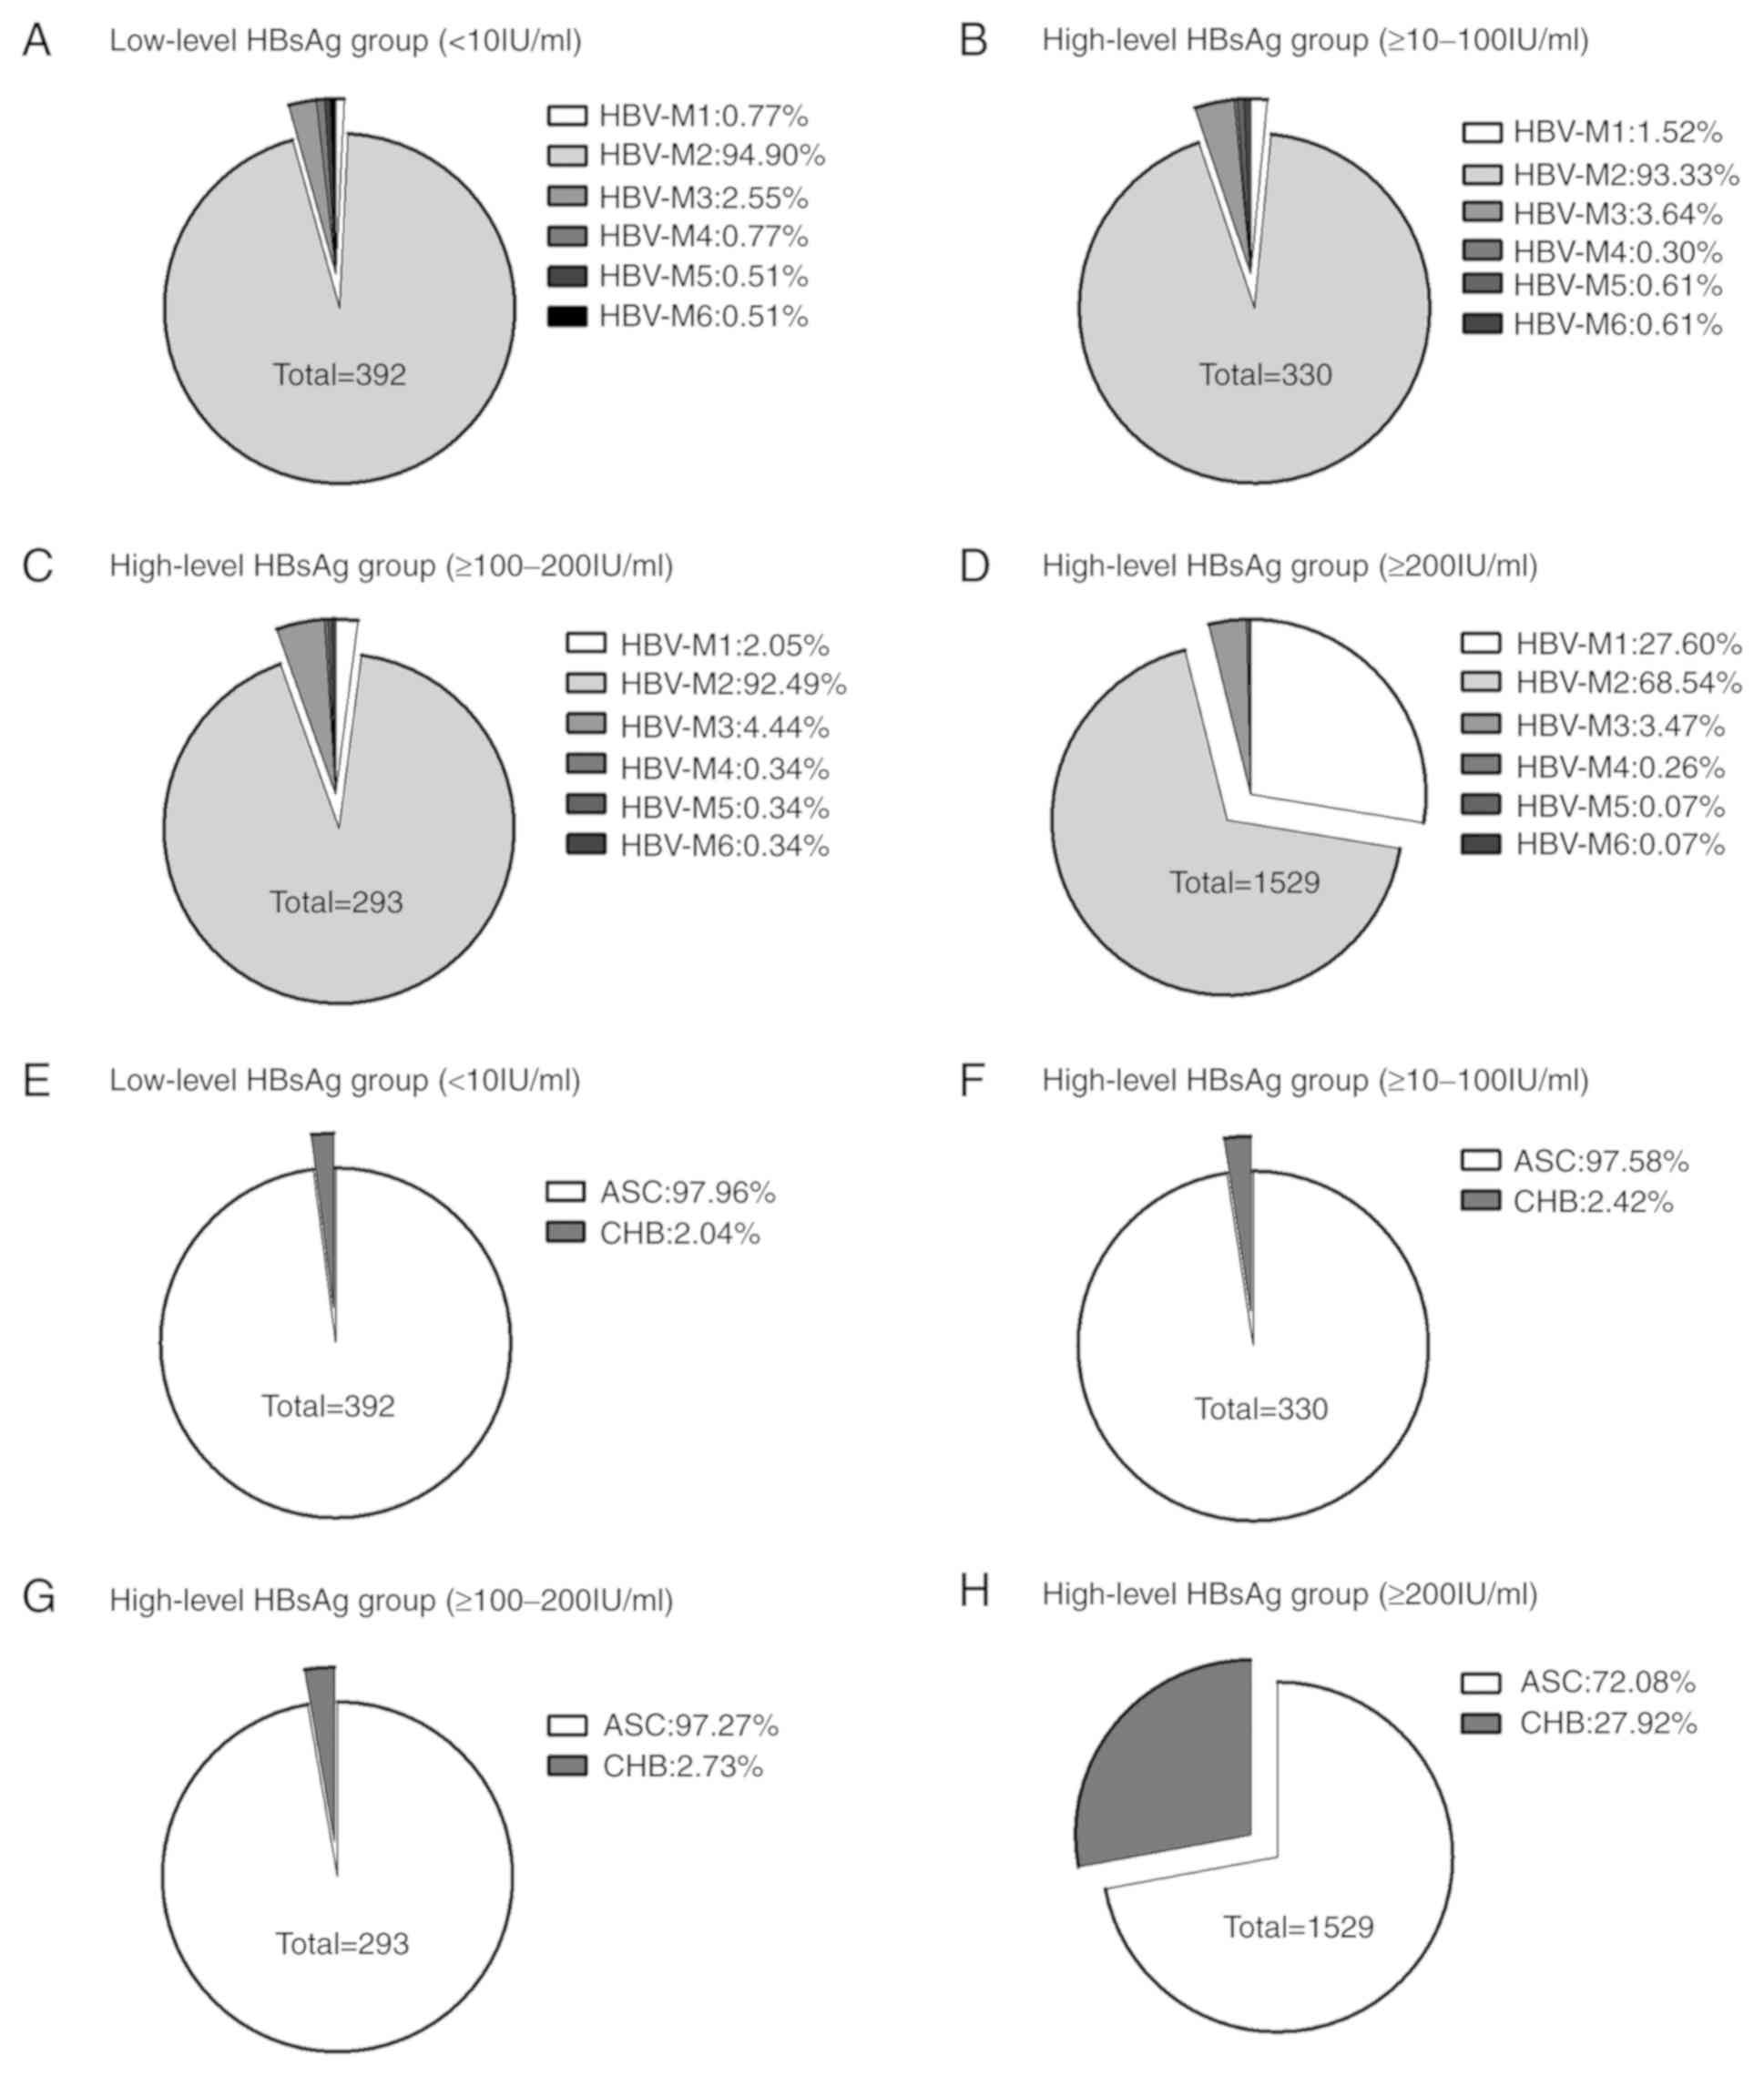 | Figure 2.Proportions of patients with specific
HBV serological patterns and clinical types in the HBsAg level
groups. (A) Distribution of different serological patterns of HBV
in low-level HBsAg group (<10 IU/ml). (B) Distribution of
different serological patterns of HBV in high-level HBsAg group
(≥10–100 IU/ml). (C) Distribution of different serological patterns
of HBV in high-level HBsAg group (≥100–200 IU/ml). (D) Distribution
of different serological patterns of HBV in high-level HBsAg group
(≥200 IU/ml). (E) Distribution of different clinical types of HBV
in low-level HBsAg group (<10 IU/ml). (F) Distribution of
different clinical types of HBV in high-level HBsAg group (≥10–100
IU/ml). (G) Distribution of different clinical types of HBV in
high-level HBsAg group (≥100–200 IU/ml). (H) Distribution of
different clinical types of HBV in high-level HBsAg group (≥200
IU/ml). There were no significant differences in the major
serological patterns and the major clinical types between the
different HBsAg level groups (<10, ≥10–100 and ≥100–200 IU/ml;
P>0.05; Fig. 2A vs. 2B vs. 2C),
but there were significant differences in the major serological
patterns and the major clinical types between the three groups
(<10, ≥10–100 and ≥100–200 IU/ml) and HBsAg ≥100–200 IU/ml
group. P<0.05, Fig. 2A, B, C vs.
2D. For convenience, HBV-M1, -M2,
-M3, -M4, -M5 and -M6 were used to represent
HBsAg/HBeAg/anti-HBc-positive, HBsAg/anti-HBe/anti-HBc-positive,
HBsAg/anti-HBc-positive, HBsAg/HBeAg/anti-HBe/anti-HBc-positive,
HBsAg/anti-HBs/HBeAg/anti-HBc-positive and
HBsAg/anti-HBs/anti-HBe/anti-HBc-positive, respectively. HBV,
hepatitis B virus; HBsAg, hepatitis B surface antigen; anti-HBs,
antibody against HBsAg; HBeAg, hepatitis B e antigen; anti-HBe,
antibody against HBeAg; anti-HBc, antibody against hepatitis B core
antigen; ASC, asymptomatic HBV carriers; CHB, chronic HBV
infection. |
| Table III.Distribution of serological patterns
and clinical types in 2,544 subjects with chronic HBV infection in
two groups. |
Table III.
Distribution of serological patterns
and clinical types in 2,544 subjects with chronic HBV infection in
two groups.
| A, Low-level HBsAg
group (n=392) |
|---|
|
|---|
|
|
| HBsAg-positive
(n) | HBV DNA-positive
(n) |
|---|
|
|
|
|
|
|---|
| Classification | Age (years) | Male (%) | Female (%) | Total | Male | Female | Total |
|---|
| Serological pattern
(n, %) |
| HBV-M1 (3,
0.77) |
56.00±15.72a | 3 (0.77) | 0 (0) | 3d | 3 (3) | 0 (0) | 3 (3) |
| HBV-M2 (372,
94.90) |
55.37±16.23a | 244 (62.24) | 128 (32.65) | 372d | 52 (117) | 38 (51) | 90
(168)e |
| HBV-M3 (10,
2.55) | 58.48±9.78 | 7 (1.79) | 3 (0.77) | 10 | 3 (4) | 0 (1) | 3 (5) |
| HBV-M4 (3,
0.77) | 55.11±13.25 | 2 (0.51) | 1 (0.26) | 3 | 0 (1) | 0 (1) | 0 (2) |
| HBV-M5 (2,
0.51) | 49.00±12.73 | 2 (0.51) | 0 (0) | 2 | 1 (1) | 0 (0) | 1 (1) |
| HBV-M6 (2,
0.51) | 50.50±3.54 | 2 (0.51) | 0 (0) | 2 | 0 (1) | 0 (0) | 0 (1) |
| Clinical type (n,
%) |
| ASC (384,
97.95) |
54.99±16.43a | 253 (64.54) | 131 (33.42) | 384d | 55 (122) | 38 (52) | 93
(174)e |
| CHB (8, 2.05) | 51.36±22.95 | 7 (1.79) | 1 (0.26) | 8e | 4 (5) | 0 (1) | 4 (6) |
| Total |
54.98±16.28a | 260
(66.33)b | 132
(33.67)b |
392e | 59 (127) | 39 (53) | 97
(180)e |
|
| B, High-level
HBsAg group (n=2,152) |
|
|
|
| HBsAg-positive
(n) | HBV DNA-positive
(n) |
|
|
|
|
|
|
Classification | Age
(years) | Male
(%) | Female
(%) | Total | Male | Female | Total |
|
| Serological pattern
(n, %) |
| HBV-M1 (433,
20.12) | 39.13±9.87 | 297 (13.80) | 136 (6.32) | 433 | 297 | 136 | 433 |
| HBV-M2 (1,627,
75.60) |
45.02±10.84b | 1,048 (48.70) | 579 (26.91) | 1,627 | 873 | 456 | 1,329 |
| HBV-M3 (78,
3.62) |
45.29±10.75b | 47 (2.18) | 31 (1.44) | 78 | 29 | 21 | 50 |
| HBV-M4 (6,
0.28) | 42.54±15.16 | 5 (0.23) | 1 (0.05) | 6 | 3 | 1 | 4 |
| HBV-M5 (4,
0.19) | 43.78±14.51 | 3 (0.14) | 1 (0.05) | 4 | 2 | 0 | 2 |
| HBV-M6 (4,
0.19) | 44.11±15.34 | 3 (0.14) | 1 (0.05) | 4 | 2 | 0 | 2 |
| Clinical type (n,
%) |
| ASC (1,709,
79.41) |
43.97±10.85b | 1,098 (51.02) | 611 (28.39) | 1,709 | 904 | 4,774 | 1,381 |
| CHB (443,
20.59) |
41.79±11.54c | 305 (14.17) | 138 (6.41) | 443 | 302 | 137 | 439 |
| Total | 43.63±10.97 | 1,403 (65.20) | 749 (34.80) | 2,15 | 1,206 | 614 | 1,820 |
As presented in Table
III, the mean age of the patients with the major serological
patterns and the major clinical types in the low-level HBsAg group,
as well as the mean age of the entire low-level HBsAg group, were
higher than the mean age of the patients in the high-level HBsAg
group (P<0.05). In addition, in the high-level HBsAg group, the
mean age of the patients with the serological pattern HBV-M1 was
lower than that of the patients with the HBV-M2 and HBV-M3 patterns
and the clinical subtype ASC (P<0.05). The positive prevalence
of HBsAg and HBV DNA (determined by the routine method and the
enrichment method) was lower, and the proportions of HBV-M2 and ASC
were higher in the low-level HBsAg group than in the high-level
HBsAg group (P<0.05). However, no significant differences were
determined in the gender distribution of the HBsAg-positive and HBV
DNA-positive patients with the routine method or the enrichment
method among the major serological patterns and clinical types in
the high- and low-level HBsAg groups (P>0.05; Table III).
Comparison and association analysis of
HBV DNA with HBV markers of the major serological patterns and
clinical types
After grouping the subjects based on their HBsAg
levels (<10, ≥10-100, ≥100–200 and ≥200 IU/ml), ANOVA or
non-parametric tests were used to analyze the differences in major
serological patterns and clinical types in the different HBsAg
level groups. The mean values of log HBV DNA, HBsAg, HBeAg and
anti-HBc of ASC patients and patients with the serological pattern
HBV-M2 in the low-level HBsAg group were lower than those in the
high-level HBsAg group (P<0.05; Table IV), whereas the mean levels of
anti-HBs and anti-HBe in the low-level HBsAg group were higher than
those in the high-level HBsAg group (P<0.05; Table IV). In the high-level HBsAg group,
there were significant differences in the mean values of HBV
markers and age for patients with the serological pattern HBV-M1
among serological patterns and between clinical types (P<0.05;
Table IV).
| Table IV.HBV DNA and HBV markers for major
serological patterns and clinical types in the two
groupsa. |
Table IV.
HBV DNA and HBV markers for major
serological patterns and clinical types in the two
groupsa.
| A, Low-level
HBsAgb |
|---|
|
|---|
| Item | HBV DNA
(Log10IU/ml) | HBsAg (IU/ml) | Anti-HBs
(mIU/ml) | HBeAg (S/CO) | Anti-HBe
(S/CO) | Anti-HBc
(S/CO) |
|---|
| HBV-M2 (n=372) | 0 (0, 2.81)h | 1.44 (0.38,
4.56)i | 0.24 (0, 1.79) |
0.33±0.04j | 0.01 (0.01,
0.03) |
11.38±1.76k |
| ASC(n=384) | 0 (0,
2.82)d | 1.46 (0.38,
4.69)e | 0.24 (0, 1.85) |
0.33±0.04f | 0.01 (0.01,
0.06) |
11.23±2.06g |
|
| B, High-level
HBsAgc |
|
| Item | HBV DNA
(Log10IU/ml) | HBsAg
(IU/ml) | Anti-HBs
(mIU/ml) | HBeAg
(S/CO) | Anti-HBe
(S/CO) | Anti-HBc
(S/CO) |
|
| HBV-M1 (n=433) | 6.69±2.11 | 5,605.00 (1,720.50,
31,935.96) | 0.06 (0, 0.84) | 543.28 (51.81,
1,000.73) | 33.01±24.11 | 11.49±2.24 |
| HBV-M2
(n=1,627) | 2.81 (0, 3.73) | 746.93 (160.11,
3,379.25) | 0.27 (0.01,
0.83) | 0.39±0.11 | 0.01 (0.01,
0.02) | 13.52±2.28 |
| HBV-M3 (n=78) | 0 (0,3.15) | 794.71 (68.38,
1,775.31) | 0 (0, 0.10) | 0.68±0.22 | 1.49±0.26 | 10.34±2.25 |
| ASC (n=1,709) | 3.05 (0,4.45) | 1,071.00 (216.16,
4,051.50) | 0.21 (0, 0.83) | 0.41 (0.35,
0.79) | 0.01 (0.01,
1.43) | 12.77±2.47 |
| CHB (n=443) | 6.21±2.15 | 4,135.73 (1,448.85,
16,134.25) | 0.08 (0, 0.58) | 0.48 (0.38,
524.90) | 0.17 (0.01,
36.91) | 11.88±2.36 |
The association of HBV DNA positivity with the HBV
markers for patients with the serological pattern HBV-M1, M2 and M3
were analyzed using logistic regression in the high-level and
low-level HBsAg groups (Table V).
The HBV DNA-positive prevalence was associated with HBsAg of
serological HBV-M2 only in the low-level HBsAg group (OR: 1.30; 95%
CI: 1.15–1.47; P<0.05) and was associated with anti-HBs,
anti-HBe and/or anti-HBc of the HBV-M2, HBV-M1 and HBV-M3
serological patterns in the high level HBsAg group (P<0.05). The
HBV DNA-positive prevalence was not associated with age or HBeAg in
either the low- or the high-level HBsAg group (P>0.05; data not
shown).
| Table V.Analysis of the association of HBV
DNA with age and HBV markers of the serological pattern
HBV-M2a,b. |
Table V.
Analysis of the association of HBV
DNA with age and HBV markers of the serological pattern
HBV-M2a,b.
|
Group/category/associated variables | B | Wald
χ2 | P-value | OR (95% CI) |
|---|
| Low-level
HBsAg |
| HBV-M2
(HBsA g<10 IU/ml) |
|
HBsAg | 0.26 | 17.07 | <0.05 | 1.30
(1.15–1.47) |
| High-level
HBsAg |
| HBV-M2
(HBsAg ≥10–100 IU/ml) |
|
Anti-HBc | 0.49 | 12.18 | <0.05 | 1.62
(1.24–2.13) |
| HBV-M2
(HBsAg ≥100–200 IU/ml) |
|
Anti-HBc | 0.12 | 11.28 | <0.05 | 1.16
(1.05–1.28) |
| HBV-M2
(HBsAg ≥200 IU/ml) |
|
Anti-HBe | 1.51 | 6.99 | <0.05 | 4.52
(1.48–13.83) |
|
Anti-HBc | 0.18 | 15.25 | <0.05 | 1.20
(1.11–1.30) |
| HBV-M2
(HBsAg ≥10–100 IU/ml) |
|
Anti-HBs | 0.14 | 5.23 | <0.05 | 1.15
(1.02–1.30) |
|
Anti-HBe | 0.98 | 4.14 | <0.05 | 2.67
(1.04–6.88) |
|
Anti-HBc | 0.21 | 29.17 | <0.05 | 1.23
(1.14–1.33) |
| HBV-M1
(HBsAg ≥10–100 IU/ml)c |
|
Anti-HBs | 0.13 | 2.43 | <0.05 | 0.13
(0.03–0.24) |
|
Anti-HBe | 0.04 | 4.72 | <0.05 | 0.04
(0.02–0.05) |
| HBV-M3
(HBsAg ≥10–100 IU/ml)d |
|
Anti-HBs | 1.19 | 2.51 | <0.05 | 1.18
(0.23–2.15) |
Comparison and association analysis of
APRI with HBsAg, HBV DNA and liver function
The 1,980 cases of ASC in the high-level HBsAg group
were divided into three subgroups based on their HBsAg levels
(≥10-100, ≥100–200 and ≥200 IU/ml). With the exception of HBV DNA
and age in subjects with ASC, there were no statistically
significant differences in APRI, ALT, AST, PLT, TBil or ALB among
the HBsAg level groups (<10, ≥10-100, ≥100–200 and ≥200 IU/ml)
according the SNK-q test (P>0.05) or the Kruskal-Wallis H-test
(P>0.05; Table VI).
| Table VI.Clinical laboratory parameters for
ASC patients. |
Table VI.
Clinical laboratory parameters for
ASC patients.
|
| HBsAg level group
(IU/ml) (n=2,093) |
|
|---|
|
|
|
|
|---|
| Laboratory
parameter | <10 (n=384) | ≥10–100
(n=275) | ≥100–200
(n=236) | ≥200 (n=1,198) | Total | P-value |
|---|
| Age (years) | 54.99±16.43 | 49.06±11.63 | 43.61±7.63 | 42.69±10.68 | 45.65±12.69 | >0.05 |
| HBsAg (IU/ml) | 1.54 (0.38,
4.82) | 41.64
(24.99,61.01) | 147.45
(128.78,165.10) | 1,974.70 (694.89,
5,610.50) | 631.38 (52.70,
3,382.00) | <0.05 |
| HBV DNA
(log10 IU/ml) | 0 (0, 2.92) | 0 (0, 3.53) | 3.33 (0, 3.68) | 3.12 (0, 5.15) | 2.88 (0, 4.04) | >0.05 |
| ALB (g/l) | 47.07±2.50 | 47.94±2.39 | 46.21±3.26 | 47.01±2.96 | 47.04±2.83 | >0.05 |
| ALT (U/l) | 24.92±7.73 | 24.33±8.29 | 27.22±8.18 | 25.87±8.88 | 25.68±8.39 | >0.05 |
| AST (U/l) | 22.58±4.66 | 21.78±4.44 | 26.11±4.78 | 23.44±6.14 | 23.42±5.57 | >0.05 |
| PLT (109/l) | 205.17±32.52 | 198.33±46.23 | 213.89±55.70 | 213.59±41.10 | 210.17±41.99 | >0.05 |
| TBil (µmol/l) | 17.73±5.60 | 16.20±4.08 | 15.58±5.29 | 16.69±7.67 | 16.66±6.60 | >0.05 |
| APRI | 0.11±0.03 | 0.12±0.04 | 0.13±0.06 | 0.12±0.05 | 0.12±0.05 | >0.05 |
Results of serotype and genotype tests
in the low-level and high-level HBsAg groups
The S gene sequencing success rate in the low-level
HBsAg group (78.35%, 76/97) was lower than that in the high-level
HBsAg group (94.0%, 94/100; P<0.05). The major serotype of the
low-level HBsAg group was adw (85.53%, 65/76) and the major
genotype was B (89.47%, 68/76). There were statistically
significant differences between the low-level and high-level HBsAg
groups in the distribution of serotypes and genotypes (P<0.05;
Table VII).
| Table VII.Serotypes and genotypes (determined
by sequencing) in the low-level and high-level HBsAg groups. |
Table VII.
Serotypes and genotypes (determined
by sequencing) in the low-level and high-level HBsAg groups.
|
|
| Serotype (%) | Genotype (%) |
|---|
|
|
|
|
|
|---|
| Group | Sequencing success
(%) | adr | adw | ayw | B | C |
|---|
| Low-level HBsAg
(n=97) | 76 (78.35) | 8 (10.53) | 65 (85.53) | 3 (3.95) | 68 (89.47) | 8 (10.53) |
| High-level HBsAg
(n=100) | 94 (94.00) | 37 (39.36) | 55 (58.51) | 2 (2.13) | 52 (55.32) | 42 (44.68) |
| χ2 | 10.20 | 18.02 |
|
| 23.61 |
|
| P-value | <0.05 | <0.05 |
|
| <0.05 |
|
Discussion
China is among the countries with the highest
prevalence of HBV infection. HBV infection in China is mainly
caused by perinatal or early childhood transmission (33). Since the launching of a nationwide
HBV vaccination program for neonates by the National Health and
Family Planning Commission of the P.R. China in 1992, significant
progress has been made in the control of the HBV epidemic. The
prevalence of HBsAg was reduced to 2.1% among all children (born
during the period of 1992–2001) and to 1.0% among children born
after 1999. Universal HBV vaccination of infants has led to a
marked decrease in HBV epidemiology, with the prevalence of HBsAg
positivity declining from 9.75% in 1992 to 7.18% in 2006 (31,34). The
results of the present study indicated that the prevalence of HBsAg
positivity in adults was 5.62%; this lower rate may be mainly due
to the popularization of HBV vaccination (31), the widespread use of clinical
anti-viral drugs (35) and the
application of sensitive diagnostic reagents (3,36–38). It
was revealed that patients with HBV infection and low HBsAg levels
accounted for 15.41% (392/2,544) of the total HBsAg-positive
population (2,544 patients) and that the HBsAg-positive prevalence
demonstrated a tendency to increase with age based on logistic
regression analysis (OR: 1.232; 95% CI: 1.15–1.33; P<0.05) and
linear-by-linear association (P<0.05). The male-to-female ratio
was ~1.9:1 for low-level HBsAg patients; this was similar to the
ratio in the high-level HBsAg group, but the average age of the
low-level HBsAg group (54.98±16.28 years) was higher than that of
the high-level HBsAg group (43.63±10.97 years). In the low-level
HBsAg group, the major serological pattern and clinical type were
HBV-M1 (94.90%) and ASC (97.95%), respectively. HBV DNA had a
low-level of replication and the positive prevalence of HBV DNA
detection by the routine method and the enrichment method was
27.74% (97/392) and 45.92% (180/392), respectively. There were no
significant differences among the age groups in the different HBsAg
level groups (P>0.05). The HBV DNA-positive prevalence was
associated with HBsAg of the serological pattern HBV-M2 only in the
low-level HBsAg group (OR: 1.30; 95% CI: 1.15–1.47; P<0.05). The
hepatic fibrosis index APRI was not associated with age, HBsAg, HBV
DNA or liver function index in ASC patients in the low-level HBsAg
group (P>0.05). Serotype adw (85.53%) and genotype B (89.47%)
were prevalent in the low-level HBsAg group.
In the present study, HBsAg <10 IU/ml was
selected as the cut-off value for defining a low-level HBsAg
population. The major reason for this is as follows: Since the late
1990s, our group has been continuously engaged in the study of
HBV-infected populations with low-level HBsAg. At that time, the
standard HBsAg serum concentrations of 2 ng/ml (critical level), 5
ng/ml (low-level) and 400 ng/ml (high-level) were provided by the
Center of Clinical Laboratory, Ministry of Public Health, China
(standard substance no. 9807). In 2002, our group performed a study
on the distribution of HBV infection with low-level HBsAg (<5
ng/ml) in a Chinese population (3).
Based on the results, the HBsAg standard serum level of 5 ng/ml was
adopted as a basis for defining a population with low-level HBsAg.
In fact, the low-level HBsAg standard serum concentration of 5
ng/ml is equivalent to 0.80 Abs (ELISA), 72S/N (Microparticle
Enzyme Immunoassay, MEIA) and 10 IU/ml (CMIA) (3,6,7,33). To
ensure the comparability of the study results, an HBsAg level of 10
IU/ml was always used as the low-level threshold for grouping.
It is known that the fibrosis status of HBsAg
carriers affects their clinical outcome. HBV infection may cause
liver fibrosis, leading to cirrhosis and hepatocellular carcinoma.
In the present study, the fibrosis status of ASCs with low-level
HBsAg was assessed by determining the APRI. The results indicated
that the APRI was not associated with age, HBsAg level, log HBV DNA
or liver function index in ASCs with low-level HBsAg (P>0.05),
but that it was associated with age (B: 0.09; 95% CI: 0.05–0.14,
P<0.05) in ASCs with high-level HBsAg. APRI was associated with
log HBsAg (B: −0.59; 95% CI: −0.89–0.33, P<0.05), age (B: 0.05;
95% CI: 0.03–0.09, P<0.05) and ALB (B: −0.11; 95% CI:
−0.19–0.07, P<0.05) in CHB patients with high-level HBsAg. It is
indicated that the level of HBsAg in CHB patients gradually
decreases with the aggravation of liver inflammation and fibrosis,
as also reported by Zhong et al (39). In ASCs with low-level HBsAg,
spontaneous clearance of HBsAg is common (16), whereas spontaneous clearance of HBsAg
in ASCs with high-level HBsAg was between CHB patients with
high-level HBsAg and ASC with low-level HBsAg. Such cases may
develop into ASCs with spontaneous clearance of HBsAg or they may
develop into cases of CHB (40).
A previous study by our group reported that low
HBsAg levels were not associated with low HBV DNA replication
(6); however, this may be due the
fact that the Abbott AXSYM immunoassay analyzer used at that time
had a low accuracy to quantify HBsAg (qualitative kit with an HBsAg
units of S/N), and PCR primarily had a low sensitivity for the
quantification of low-level HBV DNA (<1,000 copies/ml) (41). With enhanced capabilities for the
detection of HBV markers and HBV DNA, low HBsAg (<0.05 IU/ml)
and HBV DNA (nucleic acids extracted using immunomagnetic beads,
<30 IU/ml), low-level analytes may be accurately quantified
(42,43). In the present study, a routine method
and an enrichment method were used to perform HBV DNA extraction
and measurement in the low-level HBsAg group, yielding positive
percentages of 24.74% (97/392) and 45.92% (180/392), respectively.
These prevalences are higher than those reported in the literature
for the routine method (10.3%) and the enrichment method (34.6%)
(44). Therefore, the present
re-assessment of the low-level HBsAg population contributes
relevant clinical, epidemiological and molecular biological
information.
The low-level HBsAg population may be classified as
a single serological pattern (HBsAg/anti-HBe/anti-HBc-positive) or
as ASCs according to the clinical classification used. These
patients are in an inactive state according to their HBV infection
history (26,27). The present results indicated that in
the low-level HBsAg group, the major serological pattern was HBV-M2
(HBsAg/anti-HBe/anti-HBc-positive) (94.90%) and the major clinical
type was ASC (97.95%), while in the high-level HBsAg group, the
major serological pattern and the major clinical type were still
HBV-M2 (75.60%) and ASC (79.41%). A previous study reported
significant positive correlations between the HBsAg and HBeAg
levels, and between the HBsAg and HBV DNA levels. This may be the
major reason for the prevalence of HBV-M2 and ASC in the low-level
HBsAg group (45). In the present
study, a detailed analysis of multiple aspects of the clinical
characteristics of the low-level HBsAg population was performed
(HBsAg level, serological pattern, clinical type, sex and age
grouping). Further characteristics of this population regarding the
serological pattern, genotype and nucleic acid sequences will be
presented in a subsequent study.
The occurrence of low-level HBsAg may be the result
of the natural clearance of chronic infection in certain
populations (38,39). However, preliminary analyses in
previous studies by our group provided other possible explanations
(6,7). The presence of low-level HBsAg
populations in which an overwhelming majority of infected persons
are in the inactive state or asymptomatic cannot be entirely
attributed to mutations in the S gene. The function of the entire
HBV genome may affect HBsAg expression, resulting in a low total
HBsAg concentration, or alternatively, the individual's immune
system may not be able to completely remove HBsAg and its immune
complex after HBV infection; thus, HBsAg may be maintained at a
low-level over a long period of time. This phenomenon would be
expected to induce a certain degree of immune tolerance. Therefore,
systematic research on low-level HBsAg populations has important
clinical and epidemiological significance for the improvement of
HBV serological marker detection, clarification of the mechanism of
the production of low-level HBsAg, examination of the ability to
overcome immune tolerance and eliminate HBV infection, and
prevention of HBV transmission.
Acknowledgements
Not applicable.
Funding
The present study was supported by the Medical
Science Foundation of Nanjing Military Command (grant no. 12 MA117)
and the Natural Science Foundation of Zhejiang Province (grant no.
Y15H200001).
Availability of data and materials
The datasets used and/or analyzed during the present
study are available from the corresponding author on reasonable
request.
Authors' contributions
JC participated in the project design and research,
performed the statistical analysis, and was responsible for
drafting and revision of the manuscript. XXJ participated in the
project design and coordination, assisted in writing the manuscript
and helped with the statistical analysis. DWC was responsible for
sample collection. YZD performed the virological analysis and
helped with the drafting of the manuscript. XJX performed the
molecular genetic analysis and sample collection. HJZ, CGS and FHC
performed the virological analysis and sample collection and
participated in performing the statistical analysis. All authors
read and approved the final manuscript.
Ethics approval and consent to
participate
Prior to enrolment, all patients provided their
written informed consent to participate in the study. The study was
approved by the medical ethics committee of the hospital (the 117th
Hospital of the PLA; protocol no. PLA-117-20160518).
Patient consent for publication
Not applicable.
Competing interests
The authors declare that they have no competing
interests.
Glossary
Abbreviations
Abbreviations:
|
HBV
|
hepatitis B virus
|
|
HBsAg
|
hepatitis B surface antigen
|
|
APRI
|
AST-to-platelet ratio
|
|
CMIA
|
chemiluminescence immunoassay
|
|
ALB
|
albumin
|
|
ALT
|
alanine aminotransferase
|
|
AST
|
aspartate aminotransferase
|
|
PLT
|
blood platelets
|
|
TBil
|
total bilirubin
|
|
ASC
|
asymptomatic HBV carriers
|
|
CHB
|
chronic hepatitis B virus
infection
|
|
anti-HBs
|
antibody against HBsAg
|
|
HBeAg
|
hepatitis Be antigen
|
|
Anti-HBe
|
antibody against HBeAg
|
|
anti-HBc
|
antibody against hepatitis B core
antigen
|
References
|
1
|
Couroucée AM, Drouet J, LeMarrec N, Drouet
A and Soulier JP: Blood donors positive for HBsAg and negative for
anti-HBc antibody. Vox Sang. 49:26–33. 1985. View Article : Google Scholar : PubMed/NCBI
|
|
2
|
Raafat A, Yates P, Sellers F, Munro H and
Dow B: Benefit of dynamic over static incubation in the detection
of a low-level HBsAg (chronic carrier) bone donor. Vox Sang.
74:56–58. 1998. View Article : Google Scholar : PubMed/NCBI
|
|
3
|
Chen Y and Wu W: Determination of low
level HBsAg in serum by microparticle enzyme immunoassay.
Hepatobiliary Pancreat Dis Int. 1:262–264. 2002.PubMed/NCBI
|
|
4
|
Satoh K, Iwata-Takakura A, Yoshikawa A,
Gotanda Y, Tanaka T, Yamaguchi T and Mizoguchi H: A new method of
concentrating hepatitis B virus (HBV) DNA and HBV surface antigen:
An application of the method to the detection of occult HBV
infection. Vox Sang. 95:174–180. 2008. View Article : Google Scholar : PubMed/NCBI
|
|
5
|
Fei CR, Ye AQ and Zhang J: Evaluation of
different methods in determination of low level HBsAg. Zhejiang Da
Xue Xue Bao Yi Xue Ban. 40:436–439. 2011.(In Chinese). PubMed/NCBI
|
|
6
|
Cheng J, Sun CG, Chen Y, Dai YZ, Xu ZL,
Sun GZ and Li XJ: Molecular analysis on chronic hepatitis B
patients with low level HBsAg. Chin J Lab Med. 32:1128–1132.
2009.
|
|
7
|
Cheng J, Sun CG, Chen Y, Xu ZL, Wang GZ,
Sun GZ and Li XJ: Analysis on clinical features and immunity in
chronic hepatitis B virus infected patients with low-level HBsAg.
Afr J Microbiol Res. 4:547–550. 2010.
|
|
8
|
Jeffery-Smith A, Hubb J, Oliver A and Tong
CY: An apparent low level of hepatitis B surface antigen (HBsAg) in
the presence of significant viral replication. J ClinVirol.
77:111–114. 2016.
|
|
9
|
Li JM: Attention to the confirmative tests
of weak reactive samples should be paid in serological testing for
infectious diseases. Chin J Lab Med. 29:577–580. 2006.(In
Chinese).
|
|
10
|
Ozdil B, Cosar AM, Akkiz H, Sandikci MU
and Kece C: Negative correlation between viral load and HBsAg
levels in chronic HBV-infected patients. Arch Virol. 154:1451–1455.
2009. View Article : Google Scholar : PubMed/NCBI
|
|
11
|
De Gascun CF, Fraher M, Crean M, Connell J
and Hall WW: The importance of being earnest: Following up a low
level hepatitis B surface antigen (HBsAg) result. J ClinVirol.
49:79–81. 2010.
|
|
12
|
Tseng TC, Liu CJ, Yang HC, Su TH, Wang CC,
Chen CL, Hsu CA, Kuo SF, Liu CH, Chen PJ, et al: Serum hepatitis B
surface antigen levels help predict disease progression in patients
with low hepatitis B virus loads. Hepatology. 57:441–450. 2013.
View Article : Google Scholar : PubMed/NCBI
|
|
13
|
Martinot-Peignoux M, Lapalus M, Asselah T
and Marcellin P: HBsAg quantification: Useful for monitoring
natural history and treatment outcome. Liver Int. 34:97–107. 2014.
View Article : Google Scholar : PubMed/NCBI
|
|
14
|
Huang G, Lau WY, Zhou WP, Shen F, Pan ZY,
Yuan SX and Wu MC: Prediction of hepatocellular carcinoma
recurrence in patients with low hepatitis B virus DNA levels and
high preoperative hepatitis B surface antigen levels. JAMA Surg.
149:519–527. 2014. View Article : Google Scholar : PubMed/NCBI
|
|
15
|
Yang XH and Shi XF: Significance of HBsAg
quantification in guiding clinical treatment of chronic hepatitis
B. Zhonghua Gan Zang Bing Za Zhi. 24:317–320. 2016.(In Chinese).
PubMed/NCBI
|
|
16
|
Chen YC: Hepatitis B surface antigen
(HBsAg) levels in the prediction of spontaneous HBsAg
seroclearance. Hepatology. 57:16752013. View Article : Google Scholar : PubMed/NCBI
|
|
17
|
Liu J, Yang HI, Lee MH, Jen CL,
Batrla-Utermann R, Lu SN, Wang LY, You SL and Chen CJ: Serum levels
of hepatitis B surface antigen and DNA can predict inactive
carriers with low risk of disease progression. Hepatology.
64:381–389. 2016. View Article : Google Scholar : PubMed/NCBI
|
|
18
|
Liu L, Liu CY, Wang L and Liu YH: Analysis
of pathological changes and related factors of liver tissue in
patients with low level HBsAg. Zhonghua Gan Zang Bing Za Zhi.
25:526–528. 2017.(In Chinese). PubMed/NCBI
|
|
19
|
Li MH, Xie Y, Zhang L, Lu Y, Shen G, Wu
SL, Chang M, Mu CQ, Hu LP, Hua WH, et al: Hepatitis B surface
antigen clearance in inactive hepatitis B surface antigen carriers
treated with peginterferon alfa-2a. World J Hepatol. 8:637–643.
2016. View Article : Google Scholar : PubMed/NCBI
|
|
20
|
Seto WK, Wong DK, Fung J, Hung IF, Fong
DY, Yuen JC, Tong T, Lai CL and Yuen MF: A large case-control study
on the predictability of hepatitis B surface antigen levels three
years before hepatitis B surface antigen seroclearance. Hepatology.
56:812–819. 2012. View Article : Google Scholar : PubMed/NCBI
|
|
21
|
Chook JB, Teo WL, Ngeow YF, Tee KK, Ng KP
and Mohamed R: Universal primers for detection and sequencing of
hepatitis B virus genomes across genotypes A to G. J Clin
Microbiol. 53:1831–1835. 2015. View Article : Google Scholar : PubMed/NCBI
|
|
22
|
Hatazawa Y, Yano Y, Okada R, Tanahashi T,
Hayashi H, Hirano H, Minami A, Kawano Y, Tanaka M, Fukumoto T, et
al: Quasispecies variant of pre-S/S gene in HBV-related
hepatocellular carcinoma with HBs antigen positive and occult
infection. Infect Agent Cancer. 13:72018. View Article : Google Scholar : PubMed/NCBI
|
|
23
|
Tamura K, Stecher G, Peterson D, Filipski
A and Kumar S: MEGA6: Molecular evolutionary genetics analysis
version 6.0. Mol Biol Evol. 30:2725–2729. 2013. View Article : Google Scholar : PubMed/NCBI
|
|
24
|
Liao H, Liu Y, Chen J, Ding W, Li X, Xu Z,
Yang Y, Chen R, Si L, Xu X, et al: Characterization of hepatitis B
virus (HBV) preS/S gene mutations in blood donors with occult HBV
infection in the baoji area of north china. Transfusion.
57:857–866. 2017. View Article : Google Scholar : PubMed/NCBI
|
|
25
|
Tong S and Revill P: Overview of hepatitis
B viral replication and genetic variability. J Hepatol. 64 (1
Suppl):S4–S16. 2016. View Article : Google Scholar : PubMed/NCBI
|
|
26
|
Norder H, Couroucé AM, Coursaget P,
Echevarria JM, Lee SD, Mushahwar IK, Robertson BH, Locarnini S and
Magnius LO: Genetic diversity of hepatitis B virus strains derived
worldwide: Genotypes, subgenotypes, and HBsAg subtypes.
Intervirology. 47:289–309. 2004. View Article : Google Scholar : PubMed/NCBI
|
|
27
|
Chinese Society of Hepatology, Chinese
Medical Association; Chinese Society of Infectious Diseases,
Chinese Medical Association, ; Hou JL and lai W: The guideline of
prevention and treatment for chronic hepatitis B: A 2015 update.
Zhonghua Gan Zang Bing Za Zhi. 23:888–905. 2015.(In Chinese).
PubMed/NCBI
|
|
28
|
WHO Guidelines Approved by the Guidelines
Review Committee, . Guidelines for the prevention-care and
treatment of persons with chronic hepatitis B infection. Geneva:
World Health Organization; 2015
|
|
29
|
Kumar M, Sarin SK, Hissar S, Pande C,
Sakhuja P, Sharma BC, Chauhan R and Bose S: Virologic and
histologic features of chronic hepatitis B virus-infected
asymptomatic patients with persistently normal ALT.
Gastroenterology. 134:1376–1384. 2008. View Article : Google Scholar : PubMed/NCBI
|
|
30
|
Yin J, Xie J, Liu S, Zhang H, Han L, Lu W,
Shen Q, Xu G, Dong H, Shen J, et al: Association between the
various mutations in viral core promoter region to different stages
of hepatitis B, ranging of asymptomatic carrier state to
hepatocellular carcinoma. Am J Gastroenterol. 106:81–92. 2011.
View Article : Google Scholar : PubMed/NCBI
|
|
31
|
Liang X, Bi S, Yang W, Wang L, Cui G, Cui
F, Zhang Y, Liu J, Gong X, Chen Y, et al: Evaluation of the impact
of hepatitis B vaccination among children born during 1992–2005 in
china. J Infect Dis. 200:39–47. 2009. View
Article : Google Scholar : PubMed/NCBI
|
|
32
|
Mendy ME, McConkey SJ, Sande van der MA,
Crozier S, Kaye S, Jeffries D, Hall AJ and Whittle HC: Changes in
viral load and HBsAg and HBeAg status with age in HBV chronic
carriers in the gambia. Virol J. 16:492008. View Article : Google Scholar
|
|
33
|
Zheng H, Wang FZ, Zhang GM, Miao N, Sun XJ
and Cui FQ: The epidemiological characteristics of HBV
susceptibility in 1–29 years old young people in china in 2006 and
2014: Based on the national sero-survey data analysis. Zhonghua Yu
Fang Yi Xue Za Zhi. 51:581–586. 2017.(In Chinese; Abstract
available in Chinese from the publisher). PubMed/NCBI
|
|
34
|
Cui Y and Jia J: Update on epidemiology of
hepatitis B and C in China. J Gastroenterol Hepatol. 28:7–10. 2013.
View Article : Google Scholar : PubMed/NCBI
|
|
35
|
Goyal A and Murray JM: The impact of
vaccination and antiviral therapy on hepatitis B and hepatitis D
epidemiology. PLoS One. 9:e1101432014. View Article : Google Scholar : PubMed/NCBI
|
|
36
|
Chen Y, Wu W, Li LJ, Lou B, Zhang J and
Fan J: Comparison of the results for three automated immunoassay
systems in determining serum HBV markers. Clin Chim Acta.
372:129–133. 2006. View Article : Google Scholar : PubMed/NCBI
|
|
37
|
Louisirirotchanakul S, Khupulsup K,
Akraekthalin S, Chan KP, Saw S, Aw TC, Cho DH, Shin MG and Lim J:
Comparison of the technical and clinical performance of the
ElecsysHBsAg II assay with the architect, axSym, and advia centaur
HBsAg screening assays. J Med Virol. 82:755–762. 2010. View Article : Google Scholar : PubMed/NCBI
|
|
38
|
Krawczyk A, Hintze C, Ackermann J,
Goitowski B, Trippler M, Grüner N, Neumann-Fraune M, Verheyen J and
Fiedler M: Clinical performance of the novel DiaSorin LIAISON((R))
XL murex: HBsAg quant, HCV-Ab, HIV-Ab/Ag assays. J Clin Virol.
59:44–49. 2014. View Article : Google Scholar : PubMed/NCBI
|
|
39
|
Zhong LH, Jiang YM, Lou GQ, Yu XL, Liu H,
Guo JC, Zhu MF and Xun YH: The relationship between serum HBsAg
levels and liver inflammation and fibrosis in patients with chronic
hepatitis B. Zhonghua Shi Yan He Lin Chuang Bing Du Xue Za Zhi.
27:92–94. 2013.(In Chinese). PubMed/NCBI
|
|
40
|
Liu J, Yang HI, Lee MH, Lu SN, Jen CL,
Wang LY, You SL, Iloeje UH and Chen CJ; REVEAL-HBV Study Group, :
Incidence and determinants of spontaneous hepatitis B surface
antigen seroclearance: A community-based follow-up study.
Gastroenterology. 139:474–482. 2010. View Article : Google Scholar : PubMed/NCBI
|
|
41
|
Karagoz E, Tanoglu A and Turhan V:
Correlation between hepatitis B surface antigen titers and HBV DNA
levels: What about the parameters affecting this correlation? Saudi
J Gastroenterol. 20:742014. View Article : Google Scholar : PubMed/NCBI
|
|
42
|
Karagoz E, Selek MB, Tanoglu A, Hatipoglu
M, Ulcay A and Turhan V: Comparison of the ElecsysHBsAg II assay
and the architect assay for quantification of hepatitis B surface
antigen in patients with chronic hepatitis B. Infez Med.
24:287–292. 2016.PubMed/NCBI
|
|
43
|
Karra VK, Chowdhury SJ, Ruttala R,
Polipalli SK and Kar P: Clinical significance of quantitative
HBsAgtitres and its correlation with HBV DNA levels in the natural
history of hepatitis B virus infection. J Clin Exp Hepatol.
6:209–215. 2016. View Article : Google Scholar : PubMed/NCBI
|
|
44
|
Wang T, Dai Y, Lu W, Zhou H, Chen Y, Xu X,
Sun C and Cheng J: An epidemiological survey of HBV infection and
low-level HBsAg in military camps in eastern China. Medicine
(Baltimore). 97:e122012018. View Article : Google Scholar : PubMed/NCBI
|
|
45
|
Zeng DW, Liu YR, Dong J, Zhu YY, Li YB,
Chen J, Zheng Q and Jiang JJ: Serum HBsAg and HBeAg levels are
associated with liver pathological stages in the immune clearance
phase of hepatitis B virus chronic infection. Mol Med Rep.
11:3465–3472. 2015. View Article : Google Scholar : PubMed/NCBI
|


