Introduction
Methotrexate (MTX) is one of the most commonly used
drugs for maintenance therapy in multiple diseases such as cancer
(including colon, breast and lung cancer), autoimmune diseases,
acute lymphocytic leukemia, rheumatoid arthritis and ectopic
pregnancy (1–5). In cancer treatment, Rajagopalan et
al (6) reported that MTX
functions by inhibiting dihydrofolate reductase, whereas in acute
lymphocytic leukemia, MTX exerts its effects through the
interaction with folic acid (7).
These results suggested that MTX may exhibit different functional
mechanisms in different diseases. Colon carcinoma is one of the
most common types of cancer in the United States of America and
worldwide (8). Multiple treatment
methods including chemotherapy, radiotherapy and surgery are used
in the treatment of colon cancer (9–11). MTX
treatment or combined MTX treatment contributes an important part
in chemotherapy in colon cancer (12). Therefore, the mechanism of MTX
function in colon cancer is a challenging yet important question in
the treatment of colon cancer.
MicroRNAs (miRNAs) are short RNAs that contain ~22
nucleotides and regulate ~30% of human genes by targeting their
3′-untranslated region (3′UTR), which serve essential regulatory
roles in the tumorigenesis and tumor development of multiple types
of cancer, including colon cancer (13). Several studies have described the
function of MTX in the treatment of colon cancer (14,15) or
protein targets of MTX in colon cancer; however, a limited number
of reports focused on the mechanism of MTX effects at the
co-expressed protein, miRNA and network levels.
The present study aimed to investigate the mRNA and
miRNA profiles of colon carcinoma using HT29-derived cell lines to
explore the MTX-associated mechanisms of action in colon carcinoma.
miR-770-5p and its target gene home domain-interacting protein
kinase 1 (HIPK1) were identified, and their role in the MTX
resistance in colon cancer was studied.
Materials and methods
Cell culture
The human colorectal adenocarcinoma HT-29 cell line
was purchased from the Cell Bank of Type Culture Collection of
Chinese Academy of Sciences. HT-29 MTX-resistant cells were
successfully established from the parental HT-29 cell line by
exposing HT-29 cells to gradually increasing concentrations of MTX
(Sigma-Aldrich; Merck KGaA). HT-29 MTX-resistant cells were first
adapted to grow in the presence of 1×10⁻⁸ mol/l MTX. MTX
treatment was then performed by exposure to stepwise increasing
concentrations of MTX for 6 months. MTX-resistant clones were
maintained with 10−6 mol/l MTX. The half-maximal
inhibitory concentration (IC50) of MTX in WT HT-29 cells
was 3.1×10⁻⁸ and 1.0×10⁻⁵ mol/l in the
MTX-resistant HT-29 cells.
HT-29 cells and HT-29 MTX-resistant cells were
cultured in RPMI-1640 (Gibco; Thermo Fisher Scientific, Inc.)
medium containing 10% fetal bovine serum (HyClone; GE Healthcare
Life Sciences), 2 mM L-glutamine, 10 ng/ml epidermal growth factor
(Shanghai PrimeGene Bio-Tech Co., Ltd.), 100 U/ml penicillin and
100 µg/ml streptomycin (Invitrogen; Thermo Fisher Scientific, Inc.)
at 37°C with 5% CO2. The medium of HT-29 MTX-resistant
cells contained 1 µg/ml MTX.
miRNA and mRNA co-expression
analysis
Cells from 3 separate cultures of both the HT-29 MTX
sensitive and MTX resistant cell lines were selected for gene and
miRNA expression profile analysis. Microarray data were downloaded
from the Gene Expression Omnibus (GEO) database (http://www.ncbi.nlm.nih.gov/geo), which comprised
6 RNA microarray samples (GSE11440) and 6 miRNA microarray samples
(GSE28547). Data were downloaded and pre-processed, and
differentially expressed genes (DEGs) and miRNAs were identified
using R software (https://www.r-project.org). The Limma package in R was
used for differential gene and miRNA expression analysis (16). Genes and miRNAs were considered
differentially expressed if their |log[fold change (FC)]|>1.2
and adjusted P<0.05. Probes corresponding to multiple genes were
removed from the analysis results. When multiple probes
corresponded to the same gene, average values were calculated.
To evaluate the co-expression between mRNAs and
miRNAs, Pearson correlation coefficient in R software was used.
miRNA-mRNA expression pairs with correlation values <-0.9 were
used for further analysis, since miRNAs usually serve a negative
regulatory role on mRNAs. miRNA target information was downloaded
from miRTarBase database (download date, February 17th, 2016)
(17). Cytoscape software (version
3.2.0; http://cytoscape.org/) (18) was used for miRNA-mRNA co-expression
network analysis. The network work of each gene was calculated by
counting the numbers of upstream genes and downstream genes, which
were expressed in the form of in-degree and out-degree.
Prediction of miR-770-5ptarget
genes
To search for the targets of miR-770-5p, miRanda
(http://www.mocrorna.org) (19), TargetScan (http://www.targetscan.org/) (20) and miRWalk (http://mirwalk.uni-hd.de/) (21) online databases were used. The genes
identified in ≥2 databases were considered as targets of DE
miRNAs.
Transfection with synthesized
oligonucleotides
miRNA mimics, miRNA inhibitor and negative control
miRNA oligonucleotides of miR-770-5p were obtained from Guangzhou
RiboBio Co. Ltd. The sequences were: miR-770-5p mimic,
5′-UCCAGUACCACGUGUCAGGGCCA-3′; miR-NC mimic,
5′-UCGCUUGGUGCAGGUCGGGAA-3; miR-770-5p inhibitor,
5′-UGGCCCUGACACGUGGUACUGGA-3′; and miR-NC inhibitor,
5′-CAGUACUUUUGUGUAGUACAA-3′. The small interfering RNAs (siRNAs)
targeting HIPK1 (genOFF™ h-HIPK1_1999A; cat. no. SIGS0004714-1)
were synthesized by Guangzhou RiboBio Co. Ltd. HT-29 cells were
cultured to ~70% confluence and transfected with the indicated RNAs
using Lipofectamine® 2000 (Invitrogen; Thermo Fisher
Scientific, Inc.) at a final concentration of 100 nM. Cells were
subjected to subsequent experimentation 24 h following
transfection.
Construction of the reporter vector
and site-directed mutagenesis
The 3′UTR of HIPK1 was amplified from HT-29 cell
cDNA by PCR. Total RNA was extracted from HT-29 cells using
TRIzol® reagent (Invitrogen; Thermo Fisher Scientific,
Inc.). cDNA was synthesized by using M-MLV Reverse Transcriptase
(Promega Corporation) with random primers and dNTPs (Promega
Corporation). The temperature protocol for the reverse
transcription reaction consisted of cDNA synthesis at 37°C for 60
min and termination at 80°C for 2 min. qPCR was subsequently
performed with GoTaq® Greeen Master Mix (Promega
Corporation). Primers for the amplification of HIPK1 3′UTR were as
follows: Wild type (WT) forward,
5′-AATCTCGAGGAGGAGTCAAGCCAATATTAAAT-3′ and reverse,
5′-TAAGCGGCCGCTATGGGCAGGAATGTC-3′; mutant forward,
5′-AATCTCGAGGAGGAGTCAAGCCAATATTAAAT-3′ and reverse,
5′-TAAGCGGCCGCAATGTCCCCATCCATCCACTTTTCTAC-3′. The reaction
conditions were as follows: Initial denaturation at 95°C for 5 min,
followed by 30 cycles of 95°C for 30 sec and 60°C for 30 sec, and
final extension at 72°C for 10 min. The amplified products were
cloned into the XhoI and NotI sites of the psiCHECK-2
plasmid (Promega Corporation).
Dual luciferase reporter assay
Luciferase reporter assays were performed using the
psiCHECK2-3′UTR vector. Cells were cultured to ~70% confluence in
48-well plates and co-transfected with psiCHECK2-3′UTR + miR-770-5p
mimics or control mimics using Lipofectamine® 2000 for
24 h followed by the luciferase reporter assay using the Dual
Luciferase Assay System (Promega Corporation). Renilla
luciferase activity was normalized to firefly luciferase activity.
Cell lysates were subjected to luciferase activity measurement
according to the manufacturer's instructions.
RNA extraction and semi-quantitative
reverse transcription- polymerase chain reaction
Total RNA was extracted from cultured cells using
TRIzol® reagent (Invitrogen; Thermo Fisher Scientific,
Inc.). For detection of HIPK1 mRNA, cDNA was synthesized using
M-MLV Reverse Transcriptase (Promega Corporation) with random
primers (Promega Corporation). The temperature protocol for the
reverse transcription reaction consisted of cDNA synthesis at 37°C
for 60 min and termination at 80°C for 2 min. qPCR amplification
was subsequently performed with GoTaq® Green Master Mix
(Promega Corporation) using the following primers: HIPK1 forward,
5′-GCATCCTTTCCCGCCTAAGA-3′ and reverse,
5′-TACATGTGAACCCTCCGATTG-3′; GAPDH forward,
5′-AGCCTTCTCCATGGTGGTGAA-3′ and reverse,
5′-ATCACCATCTTCCAGGAGCGA-3′. The reaction conditions were as
follows: Initial denaturation at 95°C for 2 min, followed by 30
cycles 95°C for 20 sec and 60°C for 30 sec, and final extension at
72°C for 30 sec. The PCR products were subsequently subjected to
0.5 µg/ml ethidium bromide-containing 1% agarose gel
electrophoresis. The products were visualized using a digital gel
image processing system (Tanon 6200 Luminescent Imaging
Workstation; Tanon Science and Technology Co., Ltd.).
Semi-quantitative-PCR bands results were further analyzed using the
Image-Pro Plus 6.0 software (Media Cybernetics, Inc.).
Western blot analysis
Cells were lysed using RIPA lysis buffer
(Sigma-Aldrich; Merck KGaA) supplemented with protease inhibitor
(Invitrogen; Thermo Fisher Scientific, Inc.). The protein
concentration was then determined using a Bicinchoninic Acid
protein assay kit (Beyotime Institute of Biotechnology). Total
proteins (20–50 µg) were subjected to 10% sodiumdodecy1
sulfate-polyacrylamide gel electrophoresis and then transferred
onto Immobilon P membranes. The membranes were blocked with TBS
supplemented with 5% non-fat dry milk and 0.1% Tween-20 for 1 hat
room temperature prior to incubation with primary antibodies
against GAPDH (cat. no. HPA061280; 1:1,000; Sigma-Aldrich; Merck
KGaA) and HIPK1 (cat. no. ab90103; 1:1,000; Abcam) at 4°C
overnight. Following incubation with horseradish
peroxidase-conjugated secondary antibody (cat. no. A0208; 1:500;
Beyotime Institute of Biotechnology) at room temperature for 1 h,
and electrochemiluminescene western blot substrate (Beyotime
Institute of Biotechnology) was used for the detection of protein
expression. Densitometric analyzes of the protein bands were
performed using the Image-Pro Plus 6.0 software (Media Cybernetics,
Inc.).
Cell proliferation assay
To examine cell proliferative ability, cells were
seeded at the density of 2,000 cells/well and transfected with the
indicated RNAs for 24 h as aforementioned. Cell proliferation was
evaluated using a Cell Counting Kit-8 (CCK-8) assay. Briefly, each
well was supplemented with 10 µl CCK-8 reagent and incubated at
37°C for 4 h. Optical density was measured at 490 nm for each
well.
Statistical analysis
All in vitro experiments were performed in
triplicate and the data presented were representative of 3
independent experiments. Numerical data are presented as mean ±
standard deviation. The Student's t-test was used for the
statistical evaluation of the difference between two groups, and
one-way analysis of variance with appropriate Bonferroni post-hoc
test was performed for comparisons among ≥3 variables. Statistical
analysis was performed using SPSS v.16.0 (SPSS, Inc.) statistical
software. P<0.05 was considered to indicate a statistically
significant difference.
Results
Differential mRNA and miRNA expression
profiles in MTX-sensitive vs. MTX-resistant HT29-derived colorectal
adenocarcinoma cell lines
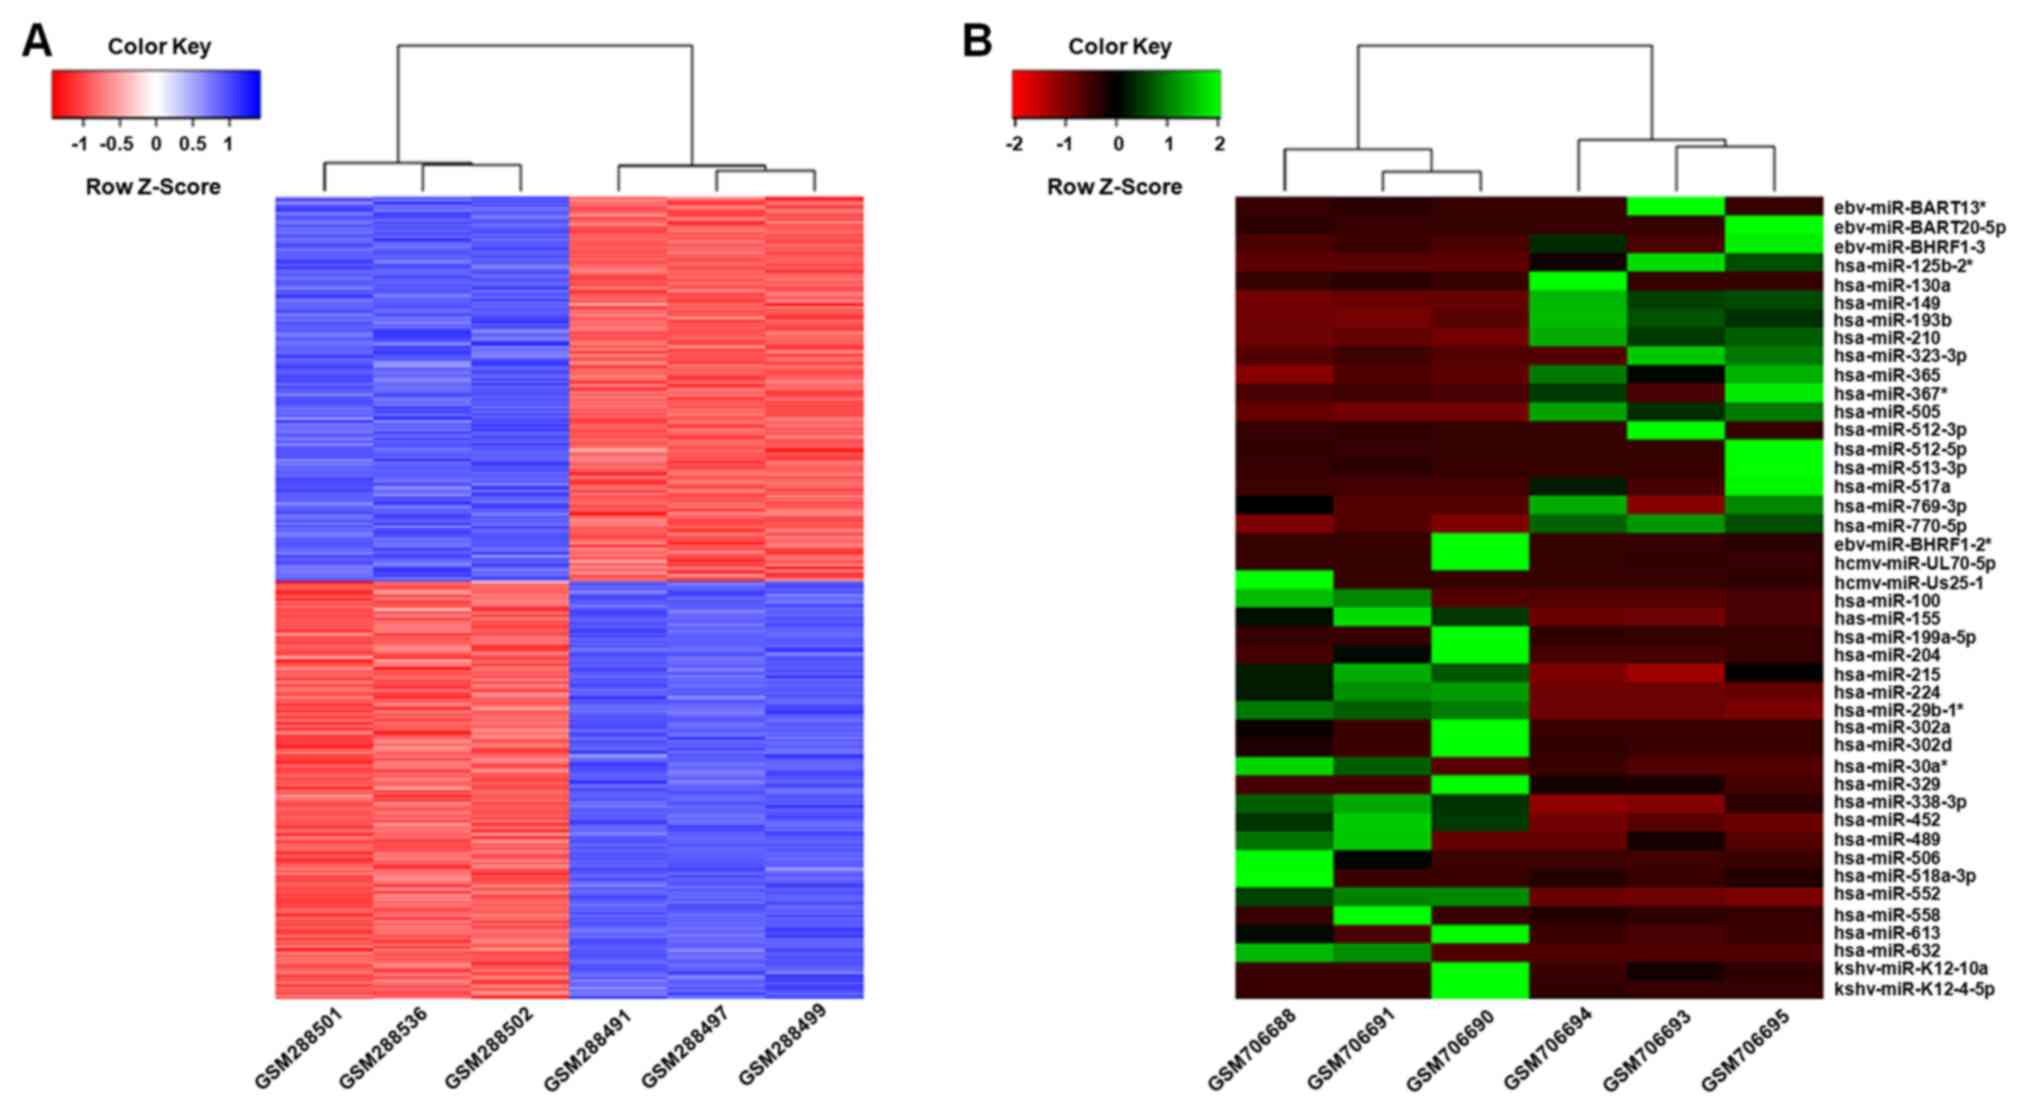
To explore the genes and miRNAs associated with MTX
treatment in colorectal adenocarcinoma cell lines, DEGs and miRNAs
between 3 MTX-sensitive and 3 MTX-resistant cell lines were
determined. A total of 641 genes and 35 miRNAs were differentially
expressed between MTX-sensitive and MTX-resistant cell lines,
including 305 up-regulated and 336 down-regulated genes (Fig. 1; Tables
I and II; Table SI), and 15 upregulated and 20
downregulated miRNAs (Tables III
and IV; Table SI).
 | Table I.Top 10 upregulated DE genes (adjusted
P<0.05) for MTX-resistant vs. MTX-sensitive cell lines as ranked
by FC. |
Table I.
Top 10 upregulated DE genes (adjusted
P<0.05) for MTX-resistant vs. MTX-sensitive cell lines as ranked
by FC.
| Gene symbol | Genename | logFC | P-value | adj.P-val |
|---|
| HAPLN1 | Hyaluronan and
proteoglycan link protein 1 | 7.22 |
1.95×10⁻⁴ |
2.49×10⁻² |
| IGFBP7 | Insulin-like growth
factor binding protein 7 | 6.86 |
1.31×10⁻⁶ |
8.27×10⁻³ |
| EDIL3 | EGF-like repeats
and discoidin I-like domains 3 | 6.36 |
2.32×10⁴ |
2.80×10⁻² |
| ATP6AP1L | ATPase, H+
transporting, lysosomal accessory protein 1-like | 5.85 |
1.76×10⁻⁶ |
8.61×10⁻³ |
| CYBRD1 | Cytochrome b
reductase 1 | 5.55 |
1.24×10⁻⁵ |
1.13×10⁻² |
| GNG2 | G protein subunit
gamma 2 | 5.30 |
1.23×10⁻⁵ |
1.13×10⁻² |
| CD37 | CD37 molecule | 5.14 |
2.00×10⁻⁴ |
2.79×10⁻² |
| RASSF8 | Ras association
domain family member 8 | 4.57 |
1.38×10⁻⁴ |
2.54×10⁻² |
| SOX8 | SRY (sex
determining region Y)-box 8 | 4.49 |
2.10×10⁻⁴ |
2.82×10⁻² |
| PPP1R14C | Protein phosphatase
1 regulatory inhibitor subunit 14C | 4.47 |
1.12×10⁻⁴ |
2.37×10⁻² |
| Table II.Top 10 down-regulated differentially
expressed genes (adjusted P<0.05) for MTX-resistant vs.
MTX-sensitive cell lines as ranked by FC. |
Table II.
Top 10 down-regulated differentially
expressed genes (adjusted P<0.05) for MTX-resistant vs.
MTX-sensitive cell lines as ranked by FC.
| Gene symbol | Gene name | logFC | P-value | adj. P-val |
|---|
| IFI27 | Interferon,
alpha-inducible protein 27 | −10.37 |
9.70×10⁻⁸ |
5.30×10⁻³ |
| BST2 | Bone marrow stromal
cell antigen 2 | −9.02 |
5.81×10⁻⁷ |
7.94×10⁻³ |
| PRSS1 | Serine protease
1 | −7.62 |
1.98×10⁻⁶ |
8.61×10⁻³ |
| ARMCX4 | Armadillo repeat
containing X-linked 4 | −6.62 |
1.05×10⁻⁶ |
8.61×10⁻³ |
| PSMB9 | Proteasome
subunitbeta 9 | −6.55 |
6.20×10⁻⁴ |
4.31×10⁻² |
| NETO2 | Neuropilin and
tolloid-like 2 | −6.51 |
4.08×10⁻⁴ |
3.46×10⁻² |
| MX1 | MX dynamin like
GTPase 1 | −6.50 |
7.50×10⁻⁴ |
4.58×10⁻² |
| PDZK1IP1 | PDZK1 interacting
protein 1 | −6.14 |
3.63×10⁻⁴ |
2.55×10⁻² |
| PLIN2 | Perilipin 2 | −5.88 |
6.93×10⁻⁴ |
4.50×10⁻² |
| IFITM1 | Interferon induced
transmembrane protein 1 | −5.84 |
2.08×10⁻⁵ |
1.33×10⁻² |
| Table III.Top 10 upregulated differentially
expressed microRNAs (P<0.05) for MTX-resistant vs. MTX-sensitive
cell lines as ranked by FC. |
Table III.
Top 10 upregulated differentially
expressed microRNAs (P<0.05) for MTX-resistant vs. MTX-sensitive
cell lines as ranked by FC.
| ID | adj. P-val | P-value | logFC | Organism |
|---|
| hsa-miR-512-5p | 0.49 |
1.07×10⁻² | 8.75 | Homo
sapiens |
| hsa-miR-512-3p | 0.57 |
3.08×10⁻² | 5.65 | Homo
sapiens |
| hsa-miR-130a | 0.57 |
3.63×10⁻² | 5.26 | Homo
sapiens |
|
hsa-miR-513a-3p | 0.57 |
3.89×10⁻² | 5.11 | Homo
sapiens |
| hsa-miR-125b-2 | 0.49 |
1.04×10⁻² | 4.68 | Homo
sapiens |
| hsa-miR-517a | 0.57 |
2.65×10⁻² | 4.46 | Homo
sapiens |
| Table IV.Top 10 down-regulated differentially
expressed microRNAs (P<0.05) for MTX-resistant vs. MTX-sensitive
cell lines as ranked by FC. |
Table IV.
Top 10 down-regulated differentially
expressed microRNAs (P<0.05) for MTX-resistant vs. MTX-sensitive
cell lines as ranked by FC.
| ID | adj. P-val | P-value | logFC | Organism |
|---|
|
hsa-miR-199a-5p | 0.49 |
9.38×10⁻³ | −9.21 | Homo
sapiens |
| hsa-miR-632 | 0.31 |
4.19×10⁻³ | −6.31 | Homo
sapiens |
| hsa-miR-204 | 0.57 |
3.27×10⁻³ | −6.08 | Homo
sapiens |
| hsa-miR-506 | 0.57 |
2.38×10⁻² | −5.09 | Homo
sapiens |
| hsa-miR-302d | 0.57 |
4.72×10⁻² | −4.86 | Homo
sapiens |
| hsa-miR-302a | 0.57 |
4.30×10⁻² | −4.87 | Homo
sapiens |
Differentially expressed
miRNA-associated co-expressed genes and target gene networks
To further understand the function of the
differentially expressed miRNAs in the effects of MTX in colon
carcinoma, the co-expression and target information between
differentially expressed miRNAs and DEGs was determined. A total of
12 miRNAs and 690 genes were identified to be negatively
co-expressed (Table SII). In the
miRNA-mRNA co-expression network, all 12 identified miRNAs were
human miRNAs and were divided into two co-expression groups of 5
and 7 miRNAs. The top 5 miRNAs with the highest number of
connections in the network were Homo
sapiens(hsa)-miR-770-5p, hsa-miR-29b-1, hsa-miR-552,
hsa-miR-505 and hsa-miR-224, whereas the top 5 genes with the
highest number of connections were Rho GTPase activating protein
24, armadillo repeat containing X-linked 4, epithelial stromal
interaction 1, hyaluronan and proteoglycan link protein 1 and Major
histocompatibility complex, class I, B (Table SIII). miR-770-5p and its target gene
were identified in the miRNA-mRNA co-expression network, which
suggested that this miRNA and its target were co-expressed and
highly associated with MTX treatment.
miR-770-5p decreases drug sensitivity
of HT-29 cells to MTX
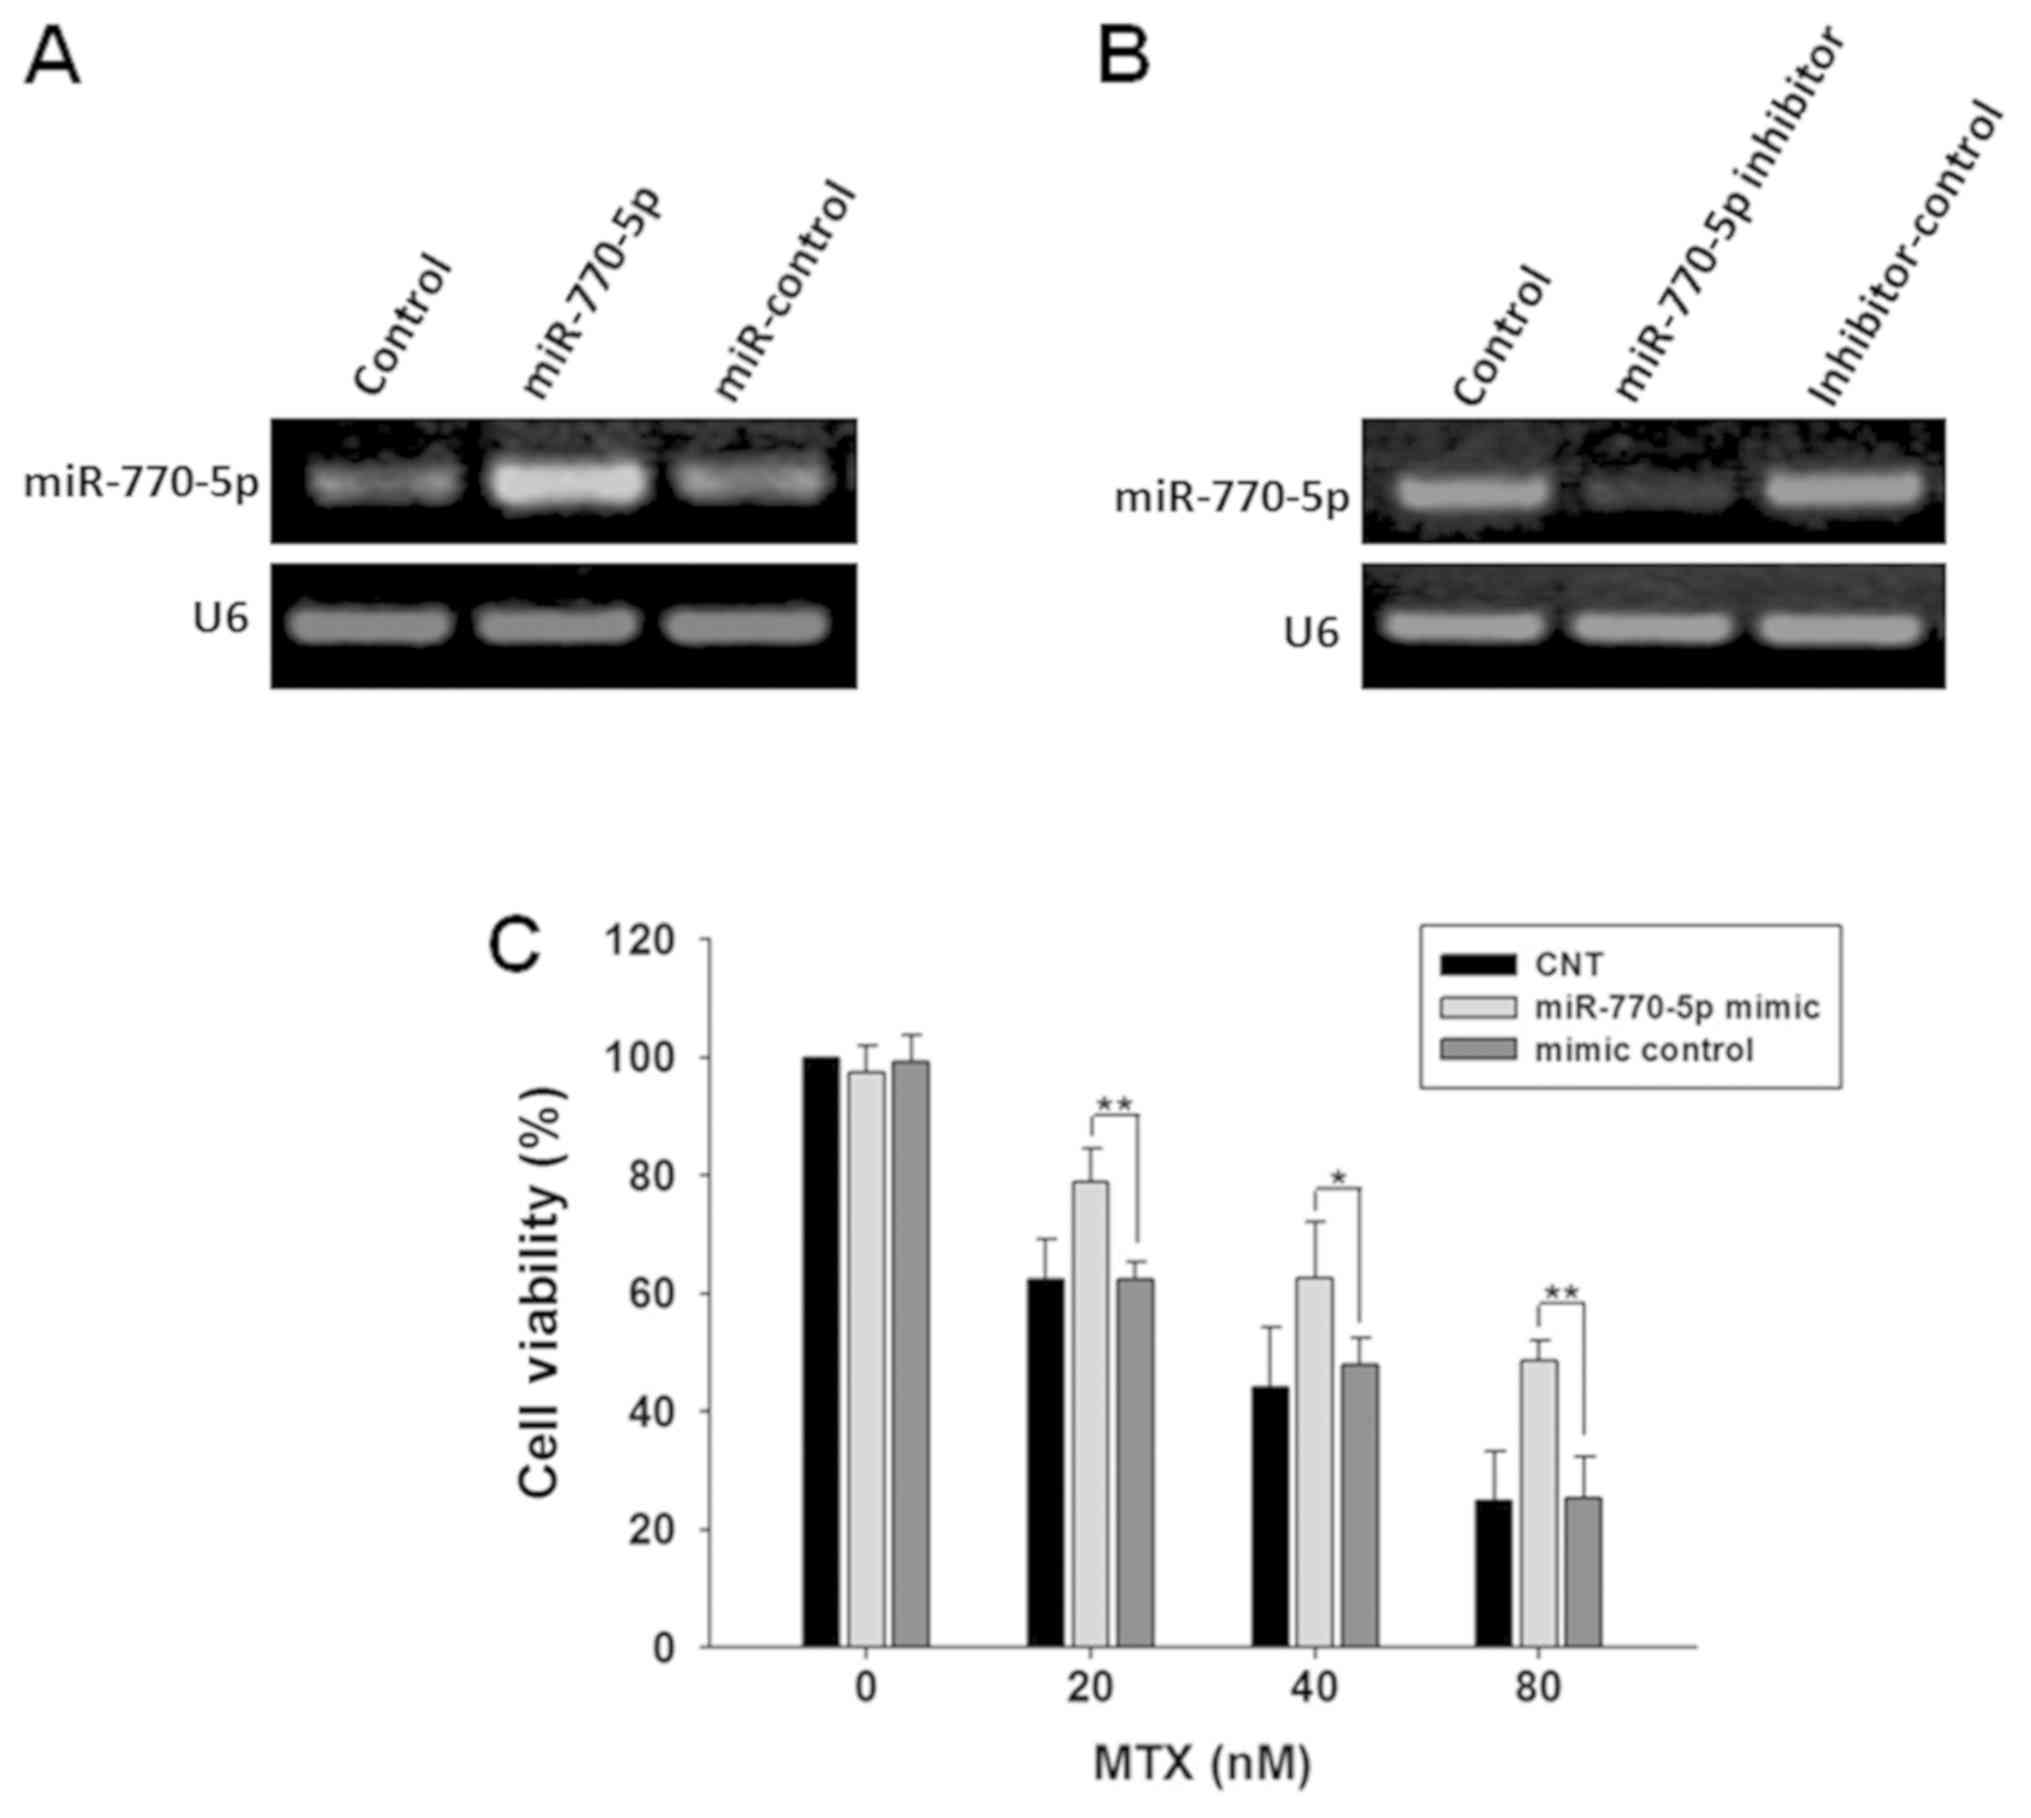
Cells were transfected with miR-770-5p mimic or
miR-770-5p inhibitor, respectively. Delivery of miR-770-5p mimic
significantly increased the expression level of miR-770-5p, whereas
the introduction of the miR-770-5p inhibitor decreased miR-770-5p
expression compared with their corresponding RNA-transfected
control cells (Fig. 2A and B). The
viability of HT-29 cells transfected with miR-770-5p mimic to
methotrexate was measured using a CCK-8 assay. The results
demonstrated that the viability of HT-29 cells transfected with
miR-770-5p mimic treated with MTX was significantly increased
compared with that in the control group, suggesting that
overexpression of miR-770-5p significantly decreased the
sensitivity of HT-29 cells to MTX (Fig.
2C).
HIPK1 is a direct target of miR-770-5p
in HT-29
Through computational analysis, the 3′UTR of HIPK1
mRNA was identified to contain binding sites for miR-770-5p.
Position 2,359-2,365 of HIPK1 3′UTR was predicted to contain the
binding site of the miR-770-5p seed sequence (Fig. 3A). The direct interaction between
miR-770-5p and HIPK1 mRNA was determined using a dual luciferase
reporter assay. A dual luciferase reporter vector containing the
3′UTR of HIPK1 was introduced into HT-29 cells for detection of
luciferase activity. The results demonstrated that the luciferase
activity was significantly decreased in the experimental group
transfected with miR-770-5p (P<0.01; Fig. 3B). To verify the specificity of the
interaction between miR-770-5p and HIPK1 mRNA, a luciferase
reporter vector encoding HIPK1 3′UTR with specific base pair
mutations at 42–58 was constructed, and luciferase activity was
measured in HT-29 cells. No significant difference in luciferase
activity was observed in the experimental group transfected with
the mutated HIPK1 3′UTR reporter plasmid (P>0.05; Fig. 3B). These results indicated that
miR-770-5p specifically bound the 3′UTR of HIPK1 mRNA.
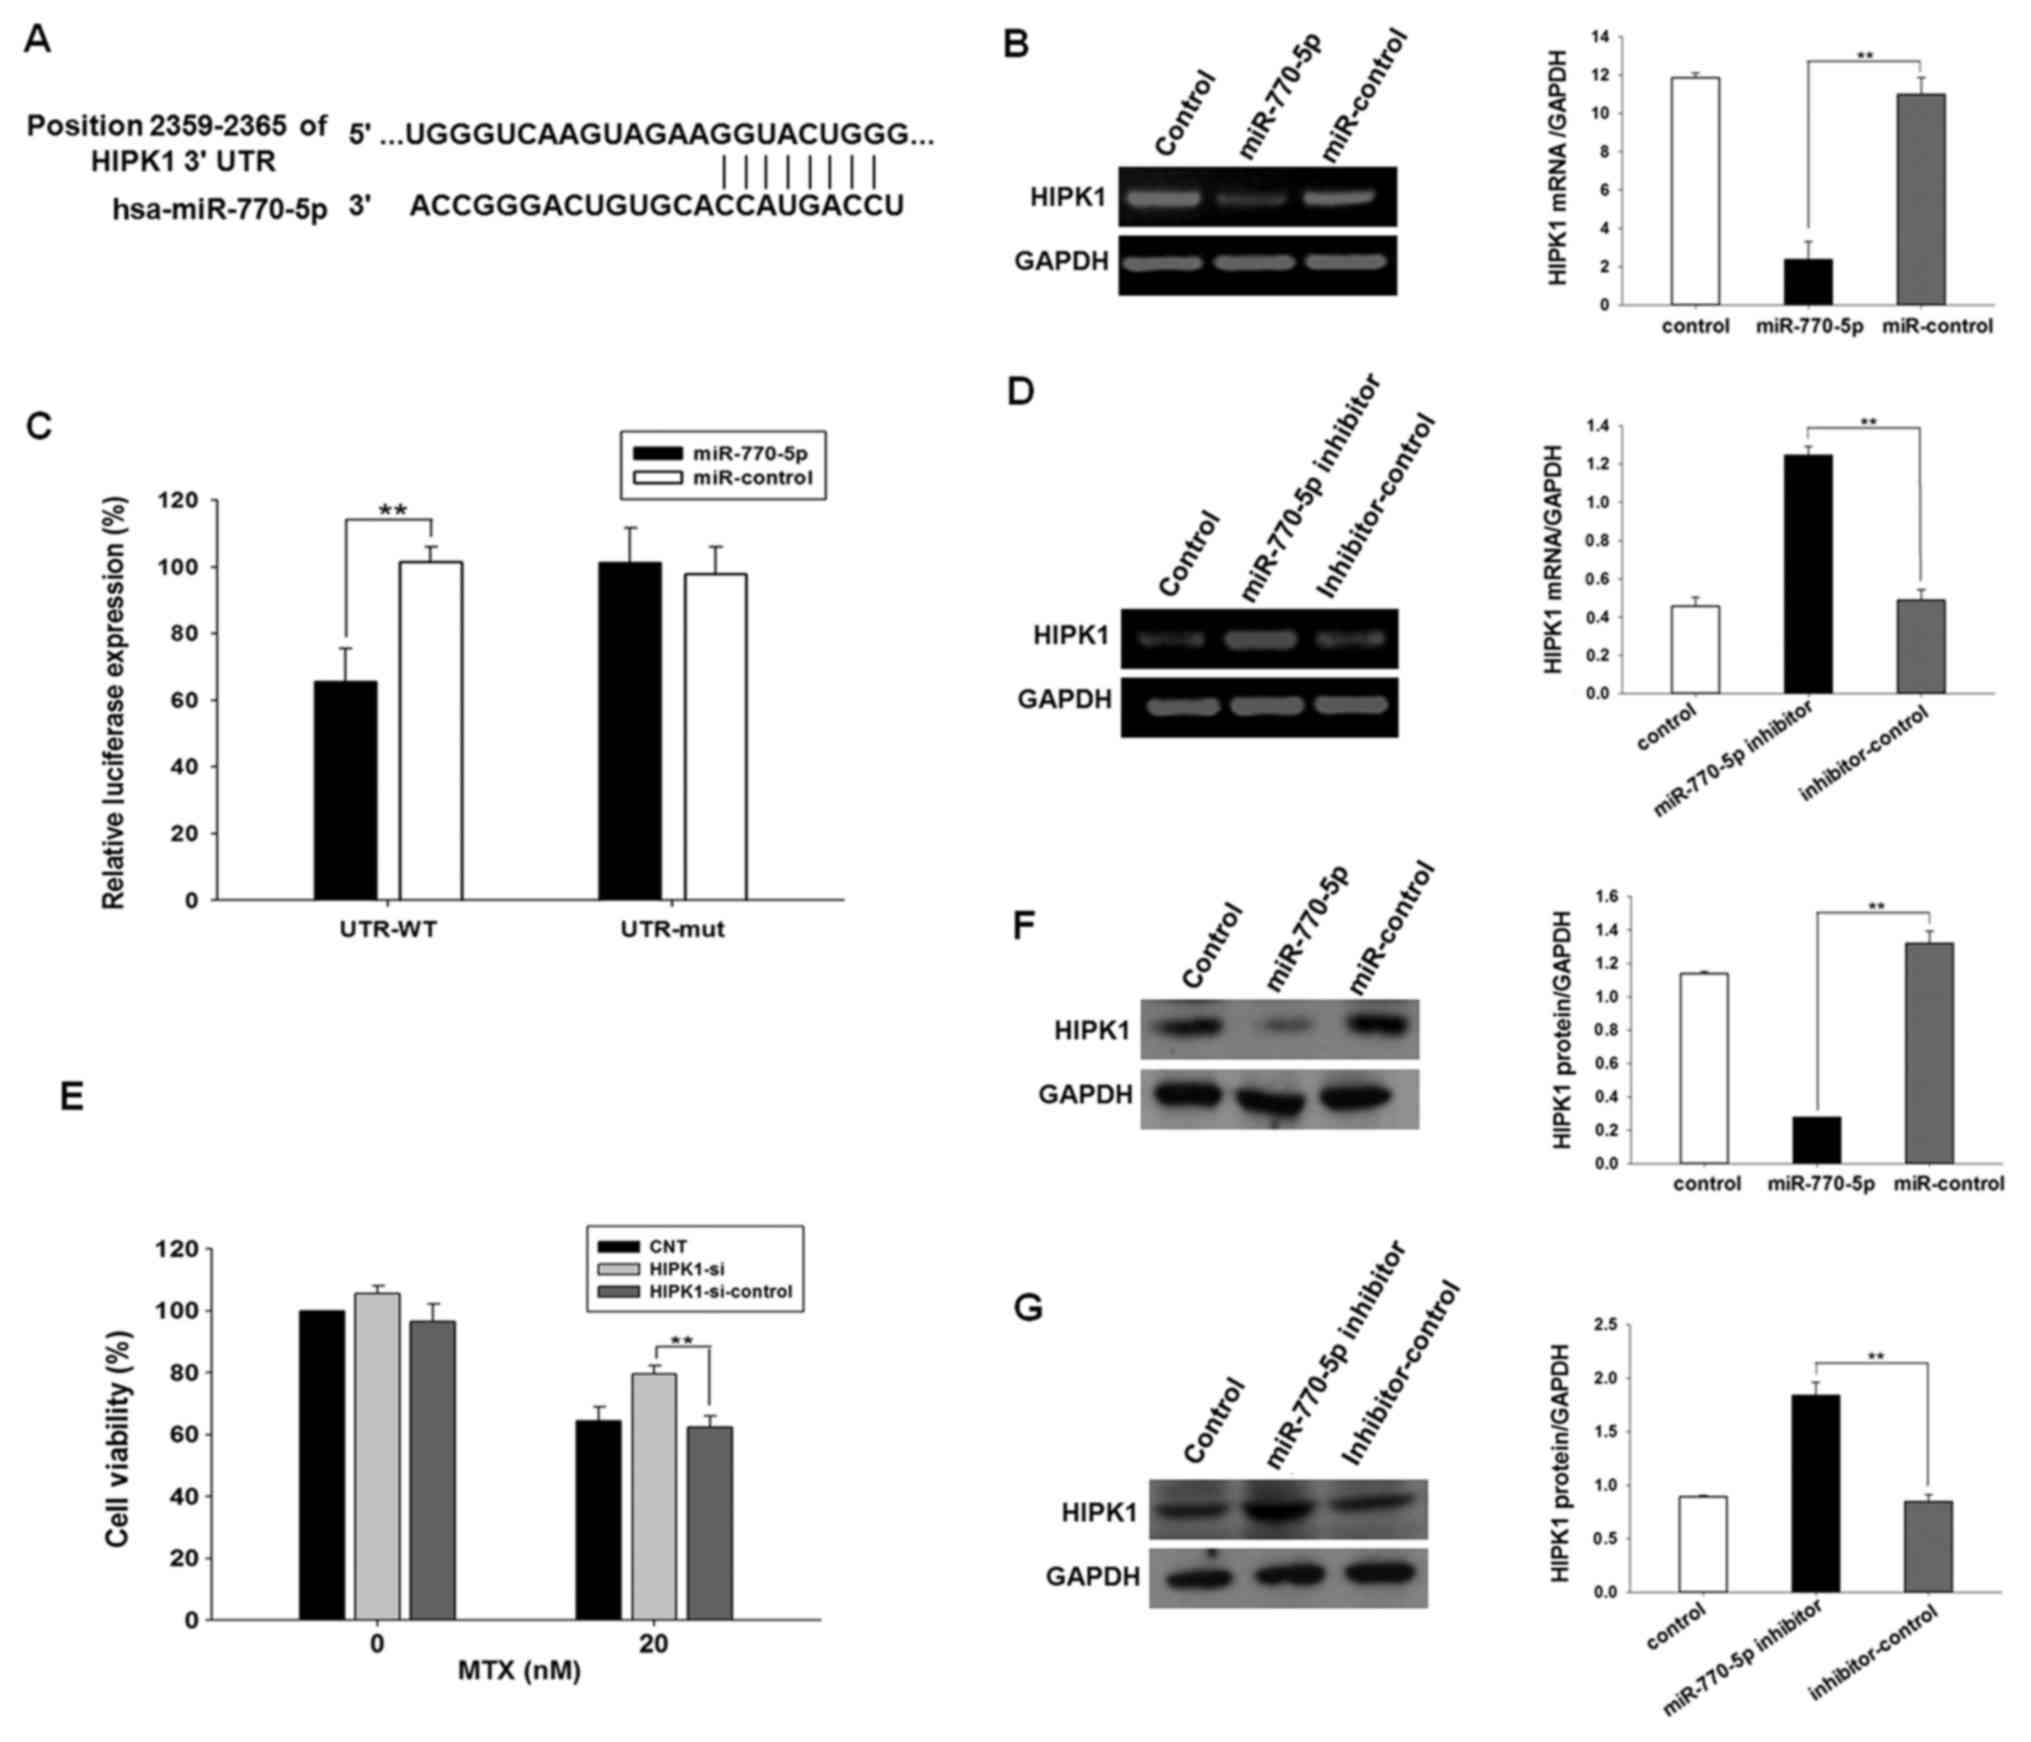 | Figure 3.miR-770-5p downregulates endogenous
HIPK1 expression in HT-29 cells. (A) Sites at 2,359-2,365 of the
HIPK1 3′UTR were predicted to be the potential binding sites of
miR-770-5p by the MiRanda, MiRwalk, and TargetScan software. (B)
PCR results of the measurement of HIPK1 mRNA expression in HT-29
cells transfected with miR-770-5p mimics or mimic control. (C)
Luciferase activity detected in miR-770-5p-transfected HT-29 cells
co-transfected with psiCHECK2-3′UTR or psiCHECK2-3′UTR-mutation.
(D) PCR results of the measurement of HIPK1 mRNA expression in
HT-29 cells transfected with miR-770-5p inhibitors or inhibitor
control. (E) HT-29 cells were transfected with siRNA targeting
HIPK1 or siRNA control for 24 h and treated with MTX for 5 days.
Cell viability was detected by Cell Counting Kit-8 assay. (F)
Western blot analysis of the protein expression levels of HIPK1 in
HT-29 cells transfected with miR-770-5p mimics or mimic control.
(G) Western blot analysis of the protein expression levels of HIPK1
in HT-29 cells transfected with miR-770-5p inhibitors or inhibitor
control. Results are presented as the mean ± standard deviation.
s**P<0.01. MTX, methotrexate; 3′UTR, 3′-untranslated
region; HIPK1, homeodomain-interacting protein kinase 1; siRNA,
small interfering RNA; miR, microRNA; WT, wild type; mut, mutant;
hsa, Homo sapiens; CNT, control untreated. |
miR-770-5p downregulates endogenous
HIPK1 expression in HT-29
To investigate the regulation of endogenous HIPK1
expression by miR-770-5p in HT-29 cells, the mRNA and protein
expression levels of HIPK1 were analyzed by semi-quantitative PCR
and western blot analysis Compared with the negative control group,
an ~80% decrease in HIPK1 mRNA levels and an 80% decrease in HIPK1
protein levels were observed when HT-29 cells were transfected with
the miR-770-5p mimic (P<0.01; Fig. 3C
and E). By contrast, the expression levels of HIPK1 mRNA and
protein were increased by 2.6- and 2.2-fold, respectively, when
HT-29 cells were transfected with miR-770-5p inhibitor (P<0.01;
Fig. 3D and F). Although the number
of templates used was consistent, the digital gel image processing
system (Tanon) has an automatic exposure function, which
automatically adjusted the brightest bands to a certain fixed
value. Therefore, the mRNA expression levels of HIPK1 in control
and inhibitor-control would look different between the two groups
of data. These data suggested that endogenous HIPK1 expression was
negatively regulated by miR-770-5p in HT-29 cells.
Downregulation of the miR-770-5p
target gene decreases the sensitivity of HT-29 cells to MTX
HIPK1 siRNA was transfected into HT-29 cells, and
the CCK-8 assay was used to detect the sensitivity of cells to MTX.
The results demonstrated that the sensitivity of HT-29 cells
transfected with HIPK1 siRNA to MTX was significantly decreased
compared with that of the control group (Fig. 3G).
Discussion
The present study focused on the miRNAs and mRNAs
associated with MTX treatment in the colorectal adenocarcinoma HT29
cell line and identified miRNAs and their co-expressed genes that
were associated with MTX sensitivity. Zhang et al (22) previously demonstrated that miR-770-5p
was upregulated in the in vitro model of diabetic
nephropathy (DN) and that it may promote the development of DN by
regulating podocyte apoptosis through targeting tp53 regulated
inhibitor of apoptosis 1. Another previous study revealed that
miR-770 inhibits glioma cell proliferation and induces apoptosis
through the suppression of the Wnt/β-catenin signaling pathway by
targeting cyclin-dependent kinase 8, suggesting that miR-770 may
serve a crucial role in glioma progression and may be used as a
potential novel target for glioma therapy (23). A recent study demonstrated that when
the expression of mir-770-5p is inhibited, cell radiosensitivity is
decreased, which suggested that miR-770-5p may be a useful
therapeutic target miRNA that sensitizes tumors to radiation
through negative regulation of PBK (24). In addition, miR-770-5p expression is
decreased in patients with platinum-resistant malignancies, whereas
the overexpression of miR-770-5p in vitro decreased the
survival rate of chemoresistant cell lines following cisplatin
treatment; suggesting that miR-770-5p may therefore be a useful
biomarker for predicting chemosensitivity to cisplatin in patients
with ovarian cancer and improve the selection of effective
personalized treatment strategies (25). These 2 studies suggested that
miR-770-5p may serve a crucial role in the drug resistance of
tumors, which is consistent with the results of the present study.
The present study demonstrated that has-miR-770-5p and its target
gene HIPK1 were highly associated with MTX treatment in
HT-29-resistant cells, suggesting that it may serve a role in
modulating drug resistance. Therefore, miR-770-5p was overexpressed
using miRNA mimics in HT29 cells, and the sensitivity of HT-29
cells to MTX was significantly decreased.
miRNAs serve an important role in energy
homeostasis, particularly in intestinal homeostasis regulation,
cell cycle, apoptosis, cell migration, proliferation and neuron
function (26–28). A recent study investigated the
functional involvement of maternally expressed 3 (MEG3) and its
intron miR-770-5p in Hirschsprung's disease (HSCR) progression and
identified the mechanism of pathophysiological roles and the
potential association between long non-coding (lnc)RNA MEG3 and
miR-770-5p, indicating that the lncRNA MEG3/miR-770-5p/SLIT-ROBO
Rho GTPase-activating protein 1 pathway may serve important roles
in the pathogenesis of HSCR (29).
However, there are a limited number of studies on the role of
miR-770 in colon cancer. HIPK is one of the 4 members of a closely
associated serine/threonine kinase family with similar structure
and function (HIPK1 to 4). HIPK1 regulates the activity of a broad
range of transcription factors (30–33). Rey
et al (34) identified that
HIPK1 is significantly overexpressed in colorectal cancer and the
level of HIPK1 gradually decreased as tumor stage progressed.
However, the role of HIPK1 in colon cancer HT-29 cell resistance to
MTX remains unclear. In the present study, the knockdown of HIPK1
in HT-29 cells significantly decreased the sensitivity of cells to
MTX, indicating that HIPK1 may serve an important role in colon
cancer HT-29 cell resistance to MTX.
In conclusion, the present study demonstrated the
regulatory association between miR-770-5p and HIPK1 in colorectal
adenocarcinoma cells and demonstrated that miR-770-5p may regulate
cell sensitivity to MTX, suggesting that the miR-770-5p-HIPK1
regulatory axis may serve an important role in colorectal
adenocarcinoma cell MTX resistance.
Supplementary Material
Supporting Data
Acknowledgements
Not applicable.
Funding
No funding was received.
Availability of data and materials
All data generated or analyzed during this study are
included in this published article.
Authors' contributions
DZ, YL and PS conceived and designed the
experiments. DZ and YL performed the experiments. PS analyzed the
data. DZ, YL and PS wrote the paper. All authors approved the final
version of the manuscript.
Ethics approval and consent to
participate
Not applicable.
Patient consent for publication
Not applicable.
Competing interests
The authors declare that they have no competing
interests.
References
|
1
|
Mol F, Mol BW, Ankum WM, van der Veen F
and Hajenius PJ: Current evidence on surgery, systemic methotrexate
and expectant management in the treatment of tubal ectopic
pregnancy: A systematic review and meta-analysis. Hum Reprod
Update. 14:309–319. 2008. View Article : Google Scholar : PubMed/NCBI
|
|
2
|
Herfarth HH, Long MD and Isaacs KL:
Methotrexate: Underused and ignored? Dig Dis. 30 (Suppl
3):S112–S118. 2012. View Article : Google Scholar
|
|
3
|
Cronstein BN: Low-dose methotrexate: A
mainstay in the treatment of rheumatoid arthritis. Pharmacol Rev.
57:163–172. 2005. View Article : Google Scholar : PubMed/NCBI
|
|
4
|
Tisman G and Wu SJ: Effectiveness of
intermediate-dose methotrexate and high-dose 5-fluorouracil as
sequential combination chemotherapy in refractory breast cancer and
as primary therapy in metastatic adenocarcinoma of the colon.
Cancer Treat Rep. 64:829–835. 1980.PubMed/NCBI
|
|
5
|
Bleyer WA: Methotrexate: Clinical
pharmacology, current status and therapeutic guidelines. Cancer
Treat Rev. 4:87–101. 1977. View Article : Google Scholar : PubMed/NCBI
|
|
6
|
Rajagopalan PT, Zhang Z, McCourt L, Dwyer
M, Benkovic SJ and Hammes GG: Interaction of dihydrofolate
reductase with methotrexate: Ensemble and single-molecule kinetics.
Proc Natl Acad Sci USA. 99:13481–13486. 2002. View Article : Google Scholar : PubMed/NCBI
|
|
7
|
Morgan SL, Baggott JE, Vaughn WH, Young
PK, Austin JV, Krumdieck CL and Alarcón GS: The effect of folic
acid supplementation on the toxicity of low-dose methotrexate in
patients with rheumatoid arthritis. Arthritis Rheum. 33:9–18. 1990.
View Article : Google Scholar : PubMed/NCBI
|
|
8
|
Siegel RL, Miller KD and Jemal A: Cancer
statistics, 2015. CA Cancer J Clin. 65:5–29. 2015. View Article : Google Scholar : PubMed/NCBI
|
|
9
|
Schrag D, Cramer LD, Bach PB and Begg CB:
Age and adjuvant chemotherapy use after surgery for stage III colon
cancer. J Natl Cancer Inst. 93:850–857. 2001. View Article : Google Scholar : PubMed/NCBI
|
|
10
|
Cammà C, Giunta M, Fiorica F, Pagliaro L,
Craxì A and Cottone M: Preoperative radiotherapy for resectable
rectal cancer: A meta-analysis. JAMA. 284:1008–1015. 2000.
View Article : Google Scholar : PubMed/NCBI
|
|
11
|
Nelson H, Petrelli N, Carlin A, Couture J,
Fleshman J, Guillem J, Miedema B, Ota D and Sargent D; National
Cancer Institute Expert Panel, : Guidelines 2000 for colon and
rectal cancer surgery. J Natl Cancer Inst. 93:583–596. 2001.
View Article : Google Scholar : PubMed/NCBI
|
|
12
|
Marsh JC, Bertino JR, Katz KH, Davis CA,
Durivage HJ, Rome LS, Richards F II, Capizzi RL, Farber LR,
Pasquale DN, et al: The influence of drug interval on the effect of
methotrexate and fluorouracil in the treatment of advanced
colorectal cancer. J Clin Oncol. 9:371–380. 1991. View Article : Google Scholar : PubMed/NCBI
|
|
13
|
Cai Y, Yu X, Hu S and Yu J: A brief review
on the mechanisms of miRNA regulation. Genomics Proteomics
Bioinformatics. 7:147–154. 2009. View Article : Google Scholar : PubMed/NCBI
|
|
14
|
Weber G, Ichikawa S, Nagai M and Natsumeda
Y: Azidothymidine inhibition of thymidine kinase and synergistic
cytotoxicity with methotrexate and 5-fluorouracil in rat hepatoma
and human colon cancer cells. Cancer Commun. 2:129–133. 1990.
View Article : Google Scholar : PubMed/NCBI
|
|
15
|
Van Mouwerik TJ, Pangallo CA, Willson JK
and Fischer PH: Augmentation of methotrexate cytotoxicity in human
colon cancer cells achieved through inhibition of thymidine salvage
by dipyridamole. Biochem Pharmacol. 36:809–814. 1987. View Article : Google Scholar : PubMed/NCBI
|
|
16
|
Ritchie ME, Phipson B, Wu D, Hu Y, Law CW,
Shi W and Smyth GK: Limma powers differential expression analyses
for RNA-sequencing and microarray studies. Nucleic Acids Res.
43:e472015. View Article : Google Scholar : PubMed/NCBI
|
|
17
|
Hsu SD, Lin FM, Wu WY, Liang C, Huang WC,
Chan WL, Tsai WT, Chen GZ, Lee CJ, Chiu CM, et al: miRTarBase: A
database curates experimentally validated microRNA-target
interactions. Nucleic Acids Res. 39((Database Issue)): D163–D169.
2011. View Article : Google Scholar : PubMed/NCBI
|
|
18
|
Shannon P, Markiel A, Ozier O, Baliga NS,
Wang JT, Ramage D, Amin N, Schwikowski B and Ideker T: Cytoscape: A
software environment for integrated models of biomolecular
interaction networks. Genome Res. 11:2498–5504. 2003. View Article : Google Scholar
|
|
19
|
John B, Enright AJ, Aravin A, Tuschl T,
Sander C and Marks DS: Human MicroRNA targets. PLoS Biol.
2:e3632004. View Article : Google Scholar : PubMed/NCBI
|
|
20
|
Lewis BP, Burge CB and Bartel DP:
Conserved seed pairing, often flanked by adenosines, indicates that
thousands of human genes are microRNA targets. Cell. 120:15–20.
2005. View Article : Google Scholar : PubMed/NCBI
|
|
21
|
Dweep H, Sticht C, Pandey P and Gretz N:
miRWalk-database: Prediction of possible miRNA binding sites by
‘walking’ the genes of three genomes. J Biomed Inform. 44:839–847.
2011. View Article : Google Scholar : PubMed/NCBI
|
|
22
|
Zhang SZ, Qiu XJ, Dong SS, Zhou LN, Zhu Y,
Wang MD and Jin LW: MicroRNA-770-5p is involved in the development
of diabetic nephropathy through regulating podocyte apoptosis by
targeting TP53 regulated inhibitor of apoptosis 1. Eur Rev Med
Pharmacol Sci. 23:1248–1256. 2019.PubMed/NCBI
|
|
23
|
Zhang JF, Zhang JS, Zhao ZH, Yang PB, Ji
SF, Li N, Shi QD, Tan J, Xu X, Xu CB and Zhao LY: MicroRNA-770
affects proliferation and cell cycle transition by directly
targeting CDK8 in glioma. Cancer Cell Int. 18:1952018. View Article : Google Scholar : PubMed/NCBI
|
|
24
|
Lee HC, Her NG, Kang D, Jung SH, Shin J,
Lee M, Bae IH, Kim YN, Park HJ, Ko YG and Lee JS:
Radiation-inducible miR-770-5p sensitizes tumors to radiation
through direct targeting of PDZ-binding kinase. Cell Death Dis.
8:e26932017. View Article : Google Scholar : PubMed/NCBI
|
|
25
|
Zhao H, Yu X, Ding Y, Zhao J, Wang G, Wu
X, Jiang J, Peng C, Guo GZ and Cui S: MiR-770-5p inhibits cisplatin
chemoresistance in human ovarian cancer by targeting ERCC2.
Oncotarget. 7:53254–53268. 2016.PubMed/NCBI
|
|
26
|
Belcheva A: MicroRNAs at the epicenter of
intestinal homeostasis. Bioessays. 39:2017. View Article : Google Scholar : PubMed/NCBI
|
|
27
|
Song H, Xu W, Song J, Liang Y, Fu W, Zhu
XC, Li C, Peng JS and Zheng JN: Overexpression of Lin28 inhibits
the proliferation, migration and cell cycle progression and induces
apoptosis of BGC-823 gastric cancer cells. Oncol Rep. 33:997–1003.
2015. View Article : Google Scholar : PubMed/NCBI
|
|
28
|
Im HI and Kenny PJ: MicroRNAs in neuronal
function and dysfunction. Trends Neurosci. 35:325–334. 2012.
View Article : Google Scholar : PubMed/NCBI
|
|
29
|
Li H, Li B, Zhu D, Xie H, Du C, Xia Y and
Tang W: Downregulation of lncRNA MEG3 and miR-770-5p inhibit cell
migration and proliferation in Hirschsprung's disease. Oncotarget.
8:69722–69730. 2017.PubMed/NCBI
|
|
30
|
Choi CY, Kim YH, Kim YO, Park SJ, Kim EA,
Riemenschneider W, Gajewski K, Schulz RA and Kim Y: Phosphorylation
by the DHIPK2 protein kinase modulates the corepressor activity of
Groucho. J Biol Chem. 280:21427–21436. 2005. View Article : Google Scholar : PubMed/NCBI
|
|
31
|
Kim YH, Choi CY, Lee SJ, Conti MA and Kim
Y: Homeodomain-interacting protein kinases, a novel family of
co-repressors for homeodomain transcription factors. J Biol Chem.
273:25875–25879. 1998. View Article : Google Scholar : PubMed/NCBI
|
|
32
|
Sung KS, Go YY, Ahn JH, Kim YH, Kim Y and
Choi CY: Differential interactions of the homeodomain-interacting
protein kinase 2 (HIPK2) by phosphorylation-dependent sumoylation.
FEBS Lett. 579:3001–3008. 2005. View Article : Google Scholar : PubMed/NCBI
|
|
33
|
Zhang Q, Yoshimatsu Y, Hildebrand J,
Frisch SM and Goodman RH: Homeodomain interacting protein kinase 2
promotes apoptosis by downregulating the transcriptional
corepressor CtBP. Cell. 115:177–186. 2003. View Article : Google Scholar : PubMed/NCBI
|
|
34
|
Rey C, Soubeyran I, Mahouche I, Pedeboscq
S, Bessede A, Ichas F, De Giorgi F and Lartigue L: HIPK1 drives p53
activation to limit colorectal cancer cell growth. Cell Cycle.
12:1879–1891. 2013. View
Article : Google Scholar : PubMed/NCBI
|