Introduction
Non-alcoholic fatty liver disease (NAFLD), a kind of
metabolic stress-induced liver function damage, is a syndrome of
the excessive deposition of fat in hepatocytes, apart from that
caused by alcohol (1). With changes
in diet and living habit, it has become the most common liver
disease around the world, the global prevalence rate of which is as
high as 26%, seriously affecting people's health (2). Most NAFLD patients are not aware of
clinical signs, and only a small number of patients have persistent
or intermittent self-induced fatigue, dyspepsia and other symptoms.
Due to the non-specific symptom its diagnosis is difficult.
Therefore, it is often found through routine physical examination
(3).
The main cause of NAFLD is closely related to
insulin resistance and genetic susceptibility. Patients with
metabolic syndrome, diabetes, obesity and dyslipidemia are the
high-risk populations (4).
25-Hydroxyvitamin D [25(OH)D] is the main form of human vitamin D.
Vitamin D, a sterol derivative that is synthesized by ultraviolet
radiation from the body, can also be supplemented by food (5). Being a fat-soluble vitamin, it is
closely related to the maintenance of the health, and growth and
development of the body (6). 25(OH)D
is the conversion of vitamin D from the hydroxylation of liver,
closely associated with vitamin D deficiency. The level of serum
25(OH)D in the body can reflect whether the body lacks vitamins
(7). The study of Della Corte et
al (8) reported that the lack of
25(OH)D may be an important cause of insulin resistance in NAFLD
patients. Its action mechanism on blood glucose can affect the
function of islet cells by directly or indirectly acting on islet β
cells (9). Therefore, in order to
prevent and treat NAFLD, it is crucial to timely ingest active
vitamin D. In this study, the expression levels of blood glucose,
blood lipid and serum 25(OH)D in NAFLD and the correlation between
the severity of NAFLD and 25(OH)D were investigated.
Patients and methods
Patient data
A retrospective analysis was performed on 385 NAFLD
patients admitted to the Zhongshan Hospital Affiliated to Xiamen
University (Xiamen, China) from January 2015 to December 2017 and
347 healthy people with physical examination. There were 385 NAFLD
patients in the NAFLD group, including 237 males and 148 females,
aged from 22 to 76 years, with an average age of 43.57±5.75 years.
In total 347 healthy people with physical examination were in the
control group, including 219 males and 128 females, aged 19 to 71
years, with an average age of 41.64±6.16 years. Inclusion criteria:
Pathological section diagnosis met the criteria for fatty liver
disease, and the pathological change of NAFLD was evaluated
according to the NASH Clinical Research Network Pathology Society
(NASH-CRN) assessment protocol (10); having complete records; no history of
drinking or alcohol content in male <140 g per week, in female
<70 g; no relevant treatment in other hospitals. Exclusion
criteria: Patients with viral hepatitis, alcoholic liver disease,
drug-induced hepatitis and hepatolenticular degeneration; patients
during pregnancy and lactation; patients suffering from total
parenteral nutrition and autoimmunity that can cause fatty liver
disease; patients with other severe diseases or tumors; patients
with communication impairment or cognitive dysfunction.
This study was approved by the Ethics Committee of
Zhongshan Hospital Affiliated to Xiamen University. Patients who
participated in this research had complete clinical data. All
subjects and their family members signed an informed consent form
and cooperated with medical staff to complete relevant medical
treatments.
Methods
The height and weight of patients in the two groups
were measured, and the body mass index (BMI) was calculated.
Fasting venous blood was extracted to determine blood lipid, blood
glucose and 25(OH)D. The indicator levels were compared and
analyzed. Patients fasted for 12 h. The venous blood was extracted,
and was placed at room temperature for 30 min. Serum was
centrifuged at 1,500 × g at 4°C for 10 min (Shanghai Pudong Tianben
Centrifugal Machinery Co., Ltd.). The detection of fasting blood
glucose (FPG), fasting proinsulin (FPI), triglyceride (TG), total
cholesterol (TC) and low-density lipoprotein cholesterol (LDL-C)
was performed using an automatic biochemical analyzer (American
Beckman Coulter Co., Ltd.) detection of glycosylated hemoglobin
(HbA1c) using glycosylated hemoglobin analyzer (Jiangsu Odikang
Medical Technology). Enzyme linked immunosorbent assay (ELISA) was
performed to detect 25(OH)D in strict accordance to the human 25
hydroxyvitamin D [25(OH)D] ELISA assay kit (Shanghai Guandao
Biological Engineering Co., Ltd.; GD-E003266861).
Degree criteria for CT diagnosis
Mild, CT liver/spleen ratio of patients ≤1.0 but
>0.7; moderate, CT liver/spleen ratio of patients ≤0.7 but
>0.5; severe, CT liver/spleen ratio of patients ≤0.5 (11).
Statistical analysis
SPSS 17.4 (Beijing Boyizhixun Information Technology
Co., Ltd.) software system was used for statistical analysis, and
the basic enumeration data of patients were expressed as percentage
(%), and tested using χ2. The expressions of BMI, FPG,
FPI, HbA1c, TG, TC, LDL-C and 25(OH)D levels were expressed as
standard deviation of mean ± SD. The t-test was used for difference
between two groups, one-way ANOVA followed by LSD for comparison of
multiple groups, Spearman's correlation analysis for correlation
between the degree of patients in the NAFLD group and the level of
25(OH)D, and logistic regression analysis for risk factors.
P<0.05, was considered statistically significant.
Results
Comparison of clinical data of
patients
In order to make the experimental results accurate
and credible, the sex, age, smoking and food habit of patients in
the two groups were compared. There was no significant difference
in them (P>0.05), indicating that the two groups are comparable
(Table I).
 | Table I.Basic data of patients in the NAFLD
group and the control group [n(%)]. |
Table I.
Basic data of patients in the NAFLD
group and the control group [n(%)].
| Variables | NAFLD group
(n=385) | Control group
(n=347) | χ2
value | P-value |
|---|
| Sex |
|
| 0.188 | 0.665 |
| Male | 237 (61.56) | 219 (63.11) |
|
|
|
Female | 148 (38.44) | 128 (36.89) |
|
|
| Age (years) |
|
| 0.001 | 0.972 |
|
<30 | 197 (51.17) | 178 (51.30) |
|
|
| ≥30 | 188 (48.83) | 169 (48.70) |
|
|
| Smoking |
|
| 0.038 | 0.846 |
| Yes | 218 (56.62) | 194 (55.91) |
|
|
| No | 167 (43.38) | 153 (44.09) |
|
|
| Food habit |
|
| 0.489 | 0.484 |
| Low
fiber | 274 (71.17) | 255 (73.49) |
|
|
| High
fiber | 111 (28.83) | 92 (26.51) |
|
|
| Pathological
diagnostic classification |
|
| – | – |
| Simple
fatty liver disease | 163 (42.34) | – |
|
|
| NASH | 127 (32.99) | – |
|
|
|
NASH-related cirrhosis | 95 (24.68) | – |
|
|
| Degree of CT
diagnosis |
|
| – | – |
| Mild | 191 (49.61) | – |
|
|
|
Moderate | 128 (33.25) | – |
|
|
|
Severe | 66 (17.14) | – |
|
|
Changes in expression of BMI and blood
glucose levels between the NAFLD group and the control group
The levels of BMI, FPG, FPI and HbA1c of patients in
the NAFLD group were significantly higher than those in the control
group (P<0.05). The levels of BMI, FPG, FPI and HbA1c in the
mild NAFLD group were significantly lower than those in the
moderate and severe NAFLD groups (P<0.05), while the levels of
BMI, FPG, FPI and HbA1c in the moderate NAFLD group were
significantly lower than those in the severe NAFLD group
(P<0.05) (Table II).
| Table II.Expression of BMI, FPG, FPI and HbA1c
levels. |
Table II.
Expression of BMI, FPG, FPI and HbA1c
levels.
| Variables | Control group
(n=347) | Mild NAFLD group
(n=191) | Moderate NAFLD
group (n=128) | Severe NAFLD group
(n=66) | F-value | P-value |
|---|
| BMI
(kg/m2) | 21.2±0.9 |
22.4±3.6a |
23.5±3.9a,b |
24.8±3.5a–c | 45.070 | <0.001 |
| FPG (mmol/l) | 5.16±0.28 |
6.28±1.48a |
7.44±1.75a,b |
8.62±1.83a–c | 221.600 | <0.001 |
| FPI (pmol/l) | 6.58±1.31 |
7.03±1.42a |
8.48±1.74a,b |
9.34±1.81a–c | 99.630 | <0.001 |
| HbA1c (%) | 5.21±0.47 | 5.27±0.51 |
7.45±0.88a,b |
8.64±0.85a–c | 933.900 | 0.026 |
Changes in expression of blood lipid
and 25(OH)D levels between the NAFLD group and the control
group
The levels of TG, TC and LDL-C of patients in the
NAFLD group of patients were significantly higher than those in the
control group, with a statistically significant difference
(P<0.05). The level of 25(OH)D in the NAFLD group was lower than
that in the control group (P<0.05). TG, TC and LDL-C levels were
significantly lower in the mild NAFLD group than in the moderate
and severe NAFLD groups (P<0.05), while 25(OH)D level in the
mild NAFLD group was significantly higher than that in the moderate
and severe NAFLD groups (P<0.05). The levels of TG, TC and LDL-C
in the moderate NAFLD group were significantly lower than those in
the severe NAFLD group (P<0.05), while the level of 25(OH)D in
the moderate NAFLD group was significantly higher than that in the
severe NAFLD group (P<0.05) (Table
III).
| Table III.Expression of TG, TC, LDL-C and
25(OH)D levels. |
Table III.
Expression of TG, TC, LDL-C and
25(OH)D levels.
| Variables | Control group
(n=347) | Mild NAFLD group
(n=191) | Moderate NAFLD
group (n=128) | Severe NAFLD group
(n=66) | F-value | P-value |
|---|
| TG (mmol/l) | 1.38±0.63 |
1.50±0.66a |
1.88±0.699a,b |
2.15±0.65a–c | 37.790 | <0.001 |
| LDL-C (mmol/l) | 2.81±0.41 |
3.17±0.74a |
3.29±1.019a |
3.63±1.24a–c | 32.350 | <0.001 |
| TG (mmol/l) | 1.28±0.63 |
1.49±0.68a |
1.54±0.73a |
1.67±0.75a,b | 10.080 | <0.001 |
| TC (mmol/l) | 3.67±0.28 |
4.51±0.34a |
4.87±0.45a,b |
5.15±0.52a–c | 609.600 | <0.001 |
| LDL-C (mmol/l) | 2.41±0.22 |
2.63±0.25a |
2.86±0.33a,b |
3.35±0.37a–c | 273.100 | <0.001 |
| 25(OH)D
(nmol/l) | 19.62±3.07 |
17.23±2.61a |
15.47±2.38a,b |
13.83±2.26a–c | 127.400 | <0.001 |
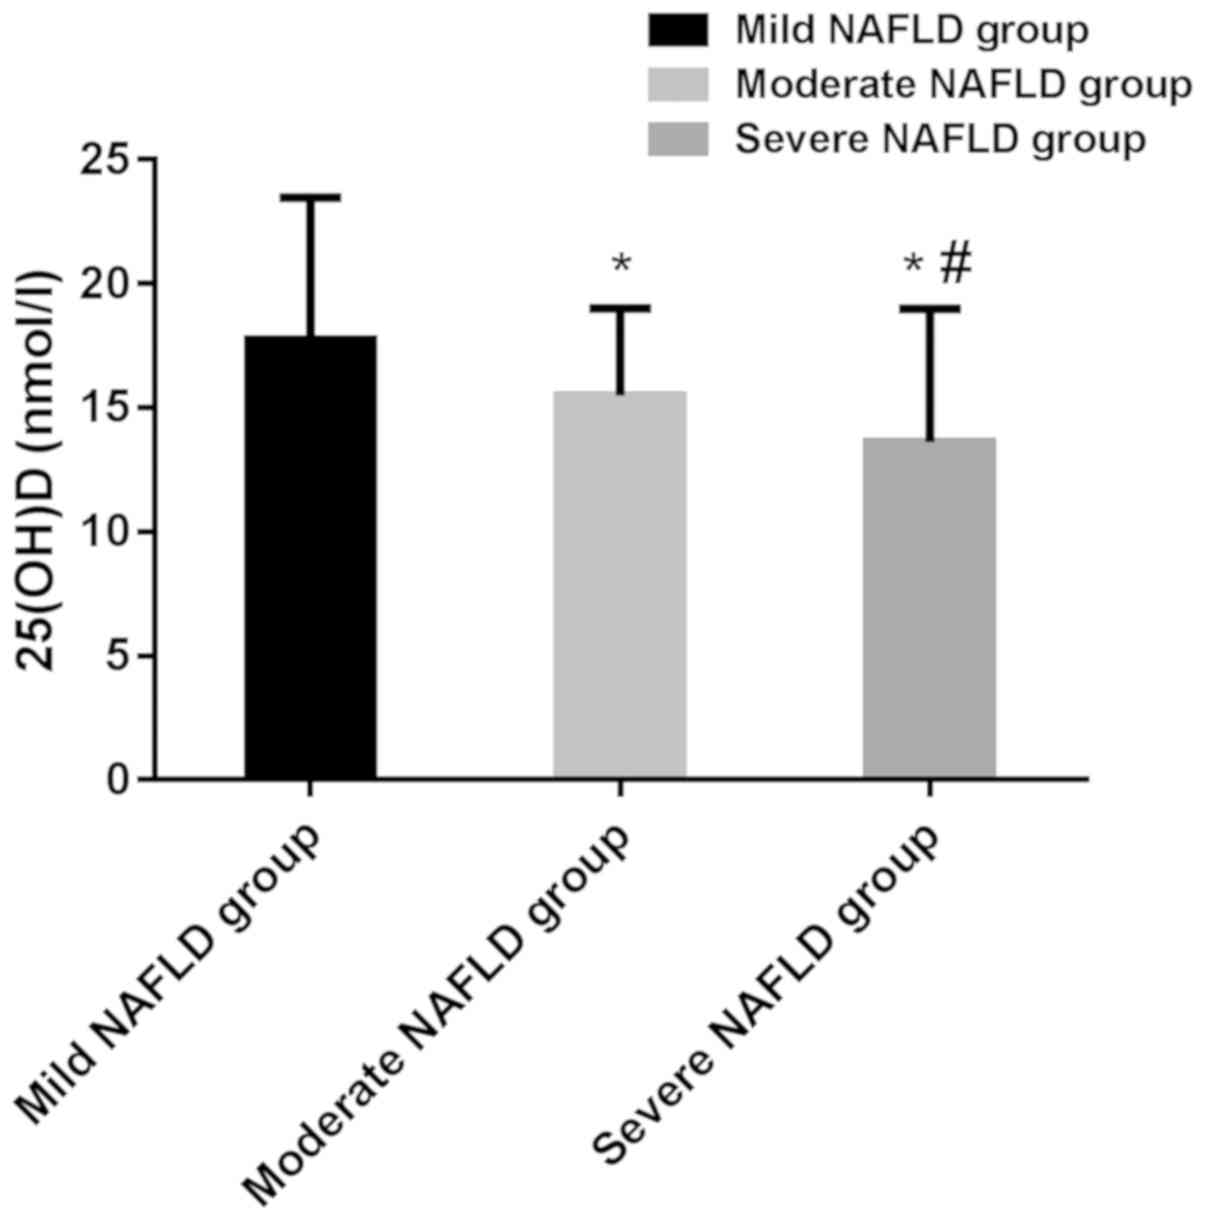
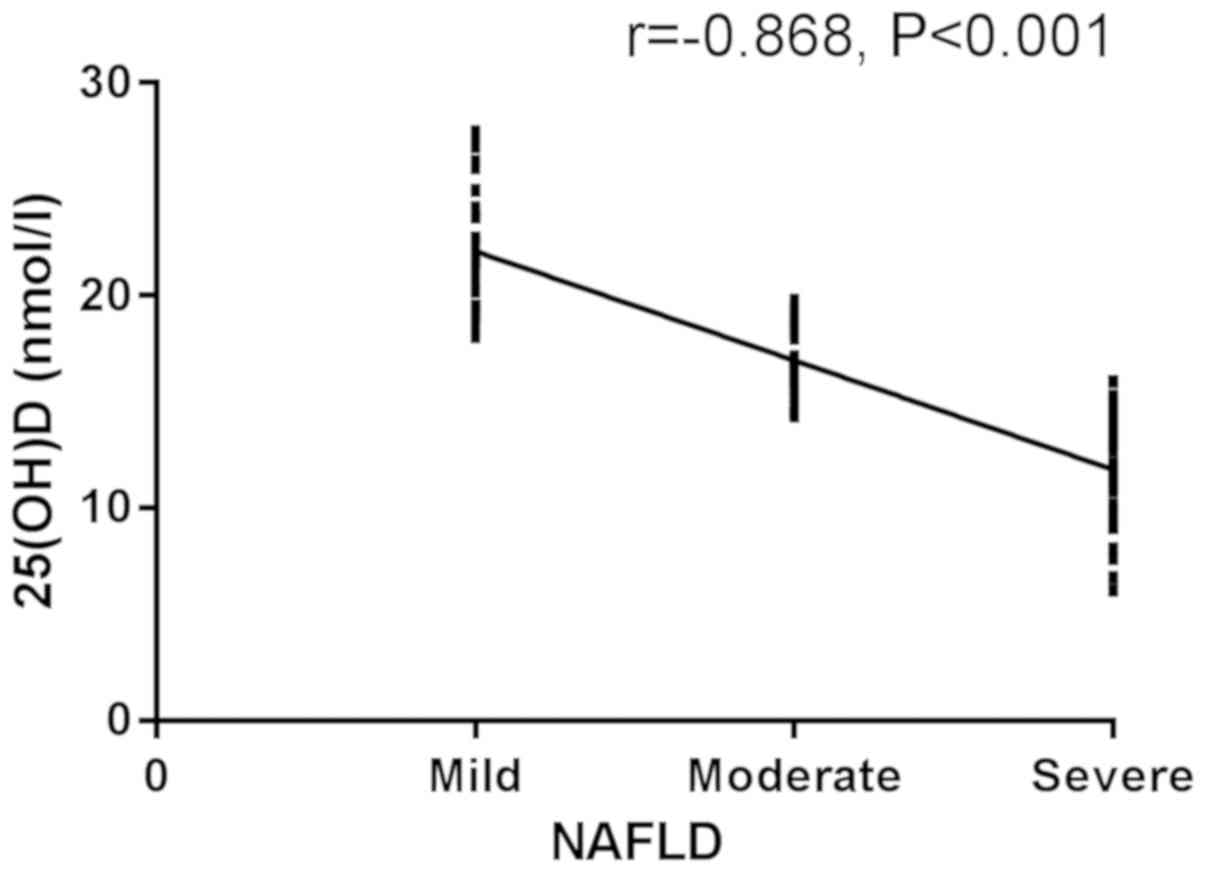
Correlation analysis between degree of
patients in the NAFLD group and level of 25(OH)D
The 25(OH)D levels of patients with mild, moderate,
and severe NAFLD were 17.23±2.61 nmol/l, 15.47±2.38 nmol/l and
13.83±2.26 nmol/l, respectively, and the differences were
statistically significant (P<0.05). The 25(OH)D levels of
patients with moderate and severe NAFLD were significantly lower
than that of patients with mild NAFLD (P<0.05). The 25(OH)D
level of patients with severe NAFLD was significantly lower than
that of patients with moderate NAFLD (P<0.05). According to
Spearman's correlation analysis, there was a significant negative
correlation between 25(OH)D and the degree of patients in the NAFLD
group (r=−0.868, P<0.001) (Figs.
1 and 2).
Logistic regression analysis of low
level of 25(OH)D and levels of BMI, blood glucose and blood
lipid
Indicators with differences in clinical pathology
analysis were assigned values (Table
IV). Multi-factor logistic regression analysis showed that BMI
(OR, 0.712; 95% CI, 0.513–0.988), FPG (OR, 1.357; 95% CI,
1.041–1.770), FPI (OR, 0.678; 95% CI, 0.526–0.873), HbA1c (OR,
2.001; 95% CI, 0.172–0.957), TG (OR, 0.668; 95% CI, 0.483–0.926),
TC (OR, 0.564; 95% CI, 0.323–0.985), and LDL-C (OR, 1.723; 95% CI,
1.051–2.825) were independent risk factors for the low level of
25(OH)D (P<0.05) (Table V).
| Table IV.Assigned values. |
Table IV.
Assigned values.
| Variables | Value |
|---|
| BMI | <22=1;
≥22=0 |
| FPG | <7.00=1;
≥7.00=0 |
| FPI | <8.15=1;
≥8.15=0 |
| HbA1c | <6.53=1;
≥6.53=0 |
| TG | <1.52=1;
≥1.52=0 |
| TC | <4.69=1;
≥4.69=0 |
| LDL-C | <2.85=1;
≥2.85=0 |
| Table V.Logistic regression analysis of low
level of 25(OH)D and levels of BMI, blood glucose and blood
lipid. |
Table V.
Logistic regression analysis of low
level of 25(OH)D and levels of BMI, blood glucose and blood
lipid.
| Variables | Regression
coefficient | OR | 95% CI | P-value |
|---|
| BMI | 2.064 | 0.712 | 0.513–0.988 | 0.042 |
| FPG | 1.576 | 1.357 | 1.041–1.770 | 0.024 |
| FPI | 1.015 | 0.678 | 0.526–0.873 | 0.003 |
| HbA1c | 2.001 | 0.406 | 0.172–0.957 | 0.039 |
| TG | 1.247 | 0.668 | 0.483–0.926 | 0.015 |
| TC | 2.154 | 0.564 | 0.323–0.985 | 0.044 |
| LDL-C | 1.875 | 1.723 | 1.051–2.825 | 0.031 |
Discussion
Due to the prevalence of obesity and metabolic
syndrome, the incidence of NAFLD has increased year by year, having
become an important cause of liver failure and hepatocellular
carcinoma in developed countries (12). Most NAFLD patients have metabolic
syndrome that refers to the metabolic disorder of protein, fat and
carbohydrate in the body, causing the occurrence of hyperlipidemia,
hyperglycemia and obesity. It is even closely associated with
atherosclerotic cardio-cerebrovascular disease and extrahepatic
malignant carcinoma (13,14). NAFLD is regarded as a disease that
interacts with various diseases, not an isolated disease.
Therefore, it has become a new challenge in current medical
field.
In this study, a retrospective analysis was
performed on 385 patients in the NAFLD group and 347 healthy people
with physical examination in the control group. First, the levels
of BMI, blood glucose, blood lipid and 25(OH)D between the two
groups were compared. The BMI level in the NAFLD group was
significantly higher than that in the control group, with a
statistically significant difference. BMI, a current standard for
obesity, is closely related to total body fat, so its level
indicator is closely correlated with NAFLD (15,16). The
levels of TG, TC and LDL-C in the NAFLD group were significantly
higher than those in the control group, with a statistically
significant difference. The lipids contained in human plasma are
collectively referred to as blood lipids. After the digestion and
absorption of food through the gastrointestinal tract, the lipids
enter the blood to form blood lipid, the content of which can
reflect the metabolism of lipids in the body (17). If the body is affected by a high-fat
and high-calorie diet for a long time, it will cause an increase in
blood lipid, so as to induce NAFLD (18). According to a study (19) the increased levels of TG, TC and
LDL-C are associated with the occurrence of NAFLD. The levels of
FPG, FPI and HbA1c in the NAFLD group were significantly higher
than those in the control group, with a statistically significant
difference. Glucose in the blood is called blood sugar. The
operation of various tissues and organs of the body requires
glucose to provide energy (20). The
normal body maintains blood glucose at a relatively stable level
through hormonal regulation and nerve regulation. This is due to
the fact that the production and utilization of blood glucose are
in a dynamic equilibrium. If regulatory dysfunction is caused by
the combination of genetic factors and environmental factors, the
level of blood glucose will pathologically increase (21). According to the study of Alwahsh and
Gebhardt (22), hyperglycemia is a
trigger factor for NAFLD. It may reduce the non-esterified fatty
acid in the blood circulation through inhibiting the lipolysis of
adipose tissues by insulin, thereby leading to fat deposition in
the liver. Therefore, it is a key factor in promoting fatty liver
to fatty hepatitis and even cirrhosis. The study (22) is consistent with the views expressed
in our study, even corroborating it.
The level of 25(OH)D in the NAFLD group was lower
than that in the control group, with a statistically significant
difference. Promoting the absorption of calcium in the small
intestine, vitamin D can increase or maintain and regulate the
concentrations of calcium and phosphorus in plasma. It is converted
to 25(OH)D by hydroxylation in the liver (23). The storage level of vitamin D in
human body can be reflected by the level of serum 25(OH)D that is
closely related to body fat metabolism. 25(OH)D can stimulate the
secretion of adiponectin by promoting its gene expression.
Adiponectin can promote fatty acid oxidation, thereby reducing TG
and TC in the liver (24). Research
has shown that (25) 25(OH)D
deficiency increases the risk of metabolic syndrome. Therefore, it
is important for the diagnosis and treatment of NAFLD to
investigate the level of serum 25(OH)D in NAFLD patients and its
correlation with the severity of NAFLD.
Results of our study showed that the level of
25(OH)D in patients with mild, moderate and severe NAFLD was
significantly lower than that in the control group, with a
statistically significant difference. Patients in the NAFLD group
were compared. That of patients with moderate and severe NAFLD was
significantly lower than that of patients with mild NAFLD, with a
statistically significant difference. That of patients with severe
NAFLD was significantly lower than of patients with moderate NAFLD,
with a statistically significant difference. Spearman's correlation
analysis showed that there was a significant negative correlation
between 25(OH)D and the degree of patients in the NAFLD group,
suggesting that 25(OH)D can be used as a monitoring indicator for
the severity of NAFLD. Pacifico et al (26) found that the incidence of vitamin D
deficiency was significantly higher in patients with cirrhosis than
in patients without cirrhosis (86.3 vs. 49.0%, P=0.0001). In the
liver function score, the level of vitamin D in Child C group was
significantly lower than that in Child A group. Logistic regression
analysis showed that BMI, FPG, FPI, HbA1c, TG, TC and LDL-C were
independent risk factors for the low level of 25(OH)D, with a
statistical significance. It has been reported (27) that the increased blood lipid and
blood sugar are risk factors for fatty liver disease. This is
similar to the results of the present study.
The results of this experiment show that 25(OH)D is
closely related to the occurrence of NAFLD, which is consistent
with the results of studies of vitamin D and NAFLD by Chung et
al (28). However, Patel et
al (29) considered that 25(OH)D
was not related to the severity of NAFLD, and we speculated that
the inconsistency may be caused by the difference in the detection
method and the test sample. Patel et al selected patient
liver tissue for gene expression profiling, while in this study,
patient blood were used for ELISA analysis. It is possible that
25(OH)D is more sensitive in peripheral blood, leading to
differences between studies. Further experimental analysis will be
performed to explore the difference. In this ivestigation the small
number of subjects may cause some contingency in the results. A
longer-term tracing investigation of subjects will be
conducted.
In conclusion, the 25(OH)D low expression in the
serum of NAFLD patients, has a significant negative correlation
with the severity of NAFLD, which is of guiding significance for
the prevention and treatment.
Acknowledgements
Not applicable.
Funding
This study was supported by the Xiamen Municipal
Science and Technology Welfare Program (no. 3502Z20154026).
Availability of data and materials
The datasets used and/or analyzed during the current
study are available from the corresponding author on reasonable
request.
Authors' contributions
JC and ZZ conceived the study and drafted the
manuscript. JL, XX and CW acquired the data. MD and LC analyzed the
data and revised the manuscript. All authors read and approved the
final manuscript.
Ethics approval and consent to
participate
This study was approved by the Ethics Committee of
Zhongshan Hospital Affiliated to Xiamen University (Xiamen, China).
Patients who participated in this research had complete clinical
data. All subjects and their family members signed an informed
consent form and cooperated with the medical staff to complete the
relevant medical treatments.
Patient consent for publication
Not applicable.
Competing interests
The authors declare that they have no competing
interests.
References
|
1
|
Buzzetti E, Pinzani M and Tsochatzis EA:
The multiple-hit pathogenesis of non-alcoholic fatty liver disease
(NAFLD). Metabolism. 65:1038–1048. 2016. View Article : Google Scholar : PubMed/NCBI
|
|
2
|
Younossi Z, Anstee QM, Marietti M, Hardy
T, Henry L, Eslam M, George J and Bugianesi E: Global burden of
NAFLD and NASH: Trends, predictions, risk factors and prevention.
Nat Rev Gastroenterol Hepatol. 15:11–20. 2018. View Article : Google Scholar : PubMed/NCBI
|
|
3
|
Bril F, Sninsky JJ, Baca AM, Superko HR,
Portillo Sanchez P, Biernacki D, Maximos M, Lomonaco R, Orsak B,
Suman A, et al: Hepatic steatosis and insulin resistance, but not
steatohepatitis, promote atherogenic dyslipidemia in NAFLD. J Clin
Endocrinol Metab. 101:644–652. 2016. View Article : Google Scholar : PubMed/NCBI
|
|
4
|
Tilg H, Moschen AR and Roden M: NAFLD and
diabetes mellitus. Nat Rev Gastroenterol Hepatol. 14:32–42. 2017.
View Article : Google Scholar : PubMed/NCBI
|
|
5
|
Olsson K, Saini A, Strömberg A, Alam S,
Lilja M, Rullman E and Gustafsson T: Evidence for vitamin D
receptor expression and direct effects of 1α, 25(OH)2D3 in human
skeletal muscle precursor cells. Endocrinology. 157:98–111. 2016.
View Article : Google Scholar : PubMed/NCBI
|
|
6
|
Rossberg W, Saternus R, Wagenpfeil S,
Kleber M, März W, Reichrath S, Vogt T and Reichrath J: Human
pigmentation, cutaneous vitamin D synthesis and evolution: Variants
of genes (SNPs) involved in skin pigmentation are associated with
25(OH)D serum concentration. Anticancer Res. 36:1429–1437.
2016.PubMed/NCBI
|
|
7
|
Pritchett K, Pritchett R, Ogan D, Bishop
P, Broad E and LaCroix M: 25(OH)D status of elite athletes with
spinal cord injury relative to lifestyle factors. Nutrients.
8:1–11. 2016. View Article : Google Scholar
|
|
8
|
Della Corte C, Carpino G, De Vito R, De
Stefanis C, Alisi A, Cianfarani S, Overi D, Mosca A, Stronati L,
Cucchiara S, et al: Docosahexanoic acid plus vitamin D treatment
improves features of NAFLD in children with serum vitamin D
deficiency: Results from a single centre trial. PLoS One.
11:e01682162016. View Article : Google Scholar : PubMed/NCBI
|
|
9
|
Goswami R, Saha S, Sreenivas V, Singh N
and Lakshmy R: Vitamin D-binding protein, vitamin D status and
serum bioavailable 25(OH)D of young Asian Indian males working in
outdoor and indoor environments. J Bone Miner Metab. 35:177–184.
2017. View Article : Google Scholar : PubMed/NCBI
|
|
10
|
Brunt EM, Kleiner DE, Wilson LA, Belt P
and Neuschwande-Tetri BA; NASH Clinical Research Network (CRN), :
Nonalcoholic fatty liver disease (NAFLD) activity score and the
histopathologic diagnosis in NAFLD: Distinct clinicopathologic
meanings. Hepatology. 53:810–820. 2011. View Article : Google Scholar : PubMed/NCBI
|
|
11
|
Graffy PM and Pickhardt PJ: Quantification
of hepatic and visceral fat by CT and MR imaging: Relevance to the
obesity epidemic, metabolic syndrome and NAFLD. Br J Radiol.
89:201510242016. View Article : Google Scholar : PubMed/NCBI
|
|
12
|
Targher G and Byrne CD: Obesity:
Metabolically healthy obesity and NAFLD. Nat Rev Gastroenterol
Hepatol. 13:442–444. 2016. View Article : Google Scholar : PubMed/NCBI
|
|
13
|
Forlani G, Giorda C, Manti R, Mazzella N,
De Cosmo S, Rossi MC, Nicolucci A, Di Bartolo P, Ceriello A, Guida
P, et al AMD-Annals Study Group, : The burden of NAFLD and its
characteristics in a nationwide population with type 2 diabetes. J
Diabetes Res. 2016:29319852016. View Article : Google Scholar : PubMed/NCBI
|
|
14
|
Godoy P, Hewitt NJ, Albrecht U, Andersen
ME, Ansari N, Bhattacharya S, Bode JG, Bolleyn J, Borner C, Böttger
J, et al: Recent advances in 2D and 3D in vitro systems using
primary hepatocytes, alternative hepatocyte sources and
non-parenchymal liver cells and their use in investigating
mechanisms of hepatotoxicity, cell signaling and ADME. Arch
Toxicol. 87:1315–1530. 2013. View Article : Google Scholar : PubMed/NCBI
|
|
15
|
Kim D and Kim WR: Nonobese fatty liver
disease. Clin Gastroenterol Hepatol. 15:474–485. 2017. View Article : Google Scholar : PubMed/NCBI
|
|
16
|
Feldman A, Eder SK, Felder TK, Kedenko L,
Paulweber B, Stadlmayr A, Huber-Schönauer U, Niederseer D, Stickel
F, Auer S, et al: Clinical and metabolic characterization of lean
Caucasian subjects with non-alcoholic fatty liver. Am J
Gastroenterol. 112:102–110. 2017. View Article : Google Scholar : PubMed/NCBI
|
|
17
|
Lurbe E, Agabiti-Rosei E, Cruickshank JK,
Dominiczak A, Erdine S, Hirth A, Invitti C, Litwin M, Mancia G,
Pall D, et al: 2016 European Society of Hypertension guidelines for
the management of high blood pressure in children and adolescents.
J Hypertens. 34:1887–1920. 2016. View Article : Google Scholar : PubMed/NCBI
|
|
18
|
Houghton D, Thoma C, Hallsworth K, Cassidy
S, Hardy T, Burt AD, Tiniakos D, Hollingsworth KG, Taylor R, Day
CP, et al: Exercise reduces liver lipids and visceral adiposity in
patients with nonalcoholic steatohepatitis in a randomized
controlled trial. Clin Gastroenterol Hepatol. 15:96–102.e3. 2017.
View Article : Google Scholar : PubMed/NCBI
|
|
19
|
Panahi Y, Kianpour P, Mohtashami R, Jafari
R, Simental- Mendía LE and Sahebkar A: Curcumin lowers serum lipids
and uric acid in subjects with nonalcoholic fatty liver disease: A
randomized controlled trial. J Cardiovasc Pharmacol. 68:223–229.
2016. View Article : Google Scholar : PubMed/NCBI
|
|
20
|
Khan S, Bal H, Khan ID and Paul D:
Evaluation of the diabetes in pregnancy study group of India
criteria and Carpenter-Coustan criteria in the diagnosis of
gestational diabetes mellitus. Turk J Obstet Gynecol. 15:75–79.
2018. View Article : Google Scholar : PubMed/NCBI
|
|
21
|
Kearns CE, Schmidt LA and Glantz SA: Sugar
industry and coronary heart disease research: A historical analysis
of internal industry documents. JAMA Intern Med. 176:1680–1685.
2016. View Article : Google Scholar : PubMed/NCBI
|
|
22
|
Alwahsh SM and Gebhardt R: Dietary
fructose as a risk factor for non-alcoholic fatty liver disease
(NAFLD). Arch Toxicol. 91:1545–1563. 2017. View Article : Google Scholar : PubMed/NCBI
|
|
23
|
Cashman KD, Dowling KG, Škrabáková Z,
Gonzalez-Gross M, Valtueña J, De Henauw S, Moreno L, Damsgaard CT,
Michaelsen KF, Mølgaard C, et al: Vitamin D deficiency in Europe:
Pandemic? Am J Clin Nutr. 103:1033–1044. 2016. View Article : Google Scholar : PubMed/NCBI
|
|
24
|
Cavalier E, Lukas P, Bekaert AC, Peeters
S, Le Goff C, Yayo E, Delanaye P and Souberbielle JC: Analytical
and clinical evaluation of the new Fujirebio Lumipulse®G
non-competitive assay for 25(OH)-vitamin D and three immunoassays
for 25(OH)D in healthy subjects, osteoporotic patients, third
trimester pregnant women, healthy African subjects, hemodialyzed
and intensive care patients. Clin Chem Lab Med. 54:1347–1355.
2016.PubMed/NCBI
|
|
25
|
Prasad P and Kochhar A: Interplay of
vitamin D and metabolic syndrome: A review. Diabetes Metab Syndr.
10:105–112. 2016. View Article : Google Scholar : PubMed/NCBI
|
|
26
|
Pacifico L, Andreoli GM, D'Avanzo M, De
Mitri D and Pierimarchi P: Role of osteoprotegerin/receptor
activator of nuclear factor kappa B/receptor activator of nuclear
factor kappa B ligand axis in nonalcoholic fatty liver disease.
World J Gastroenterol. 24:2073–2082. 2018. View Article : Google Scholar : PubMed/NCBI
|
|
27
|
Hanley AJ, Williams K, Festa A,
Wagenknecht LE, D'Agostino RB Jr and Haffner SM: Liver markers and
development of the metabolic syndrome: The insulin resistance
atherosclerosis study. Diabetes. 54:3140–3147. 2005. View Article : Google Scholar : PubMed/NCBI
|
|
28
|
Chung GE, Kim D, Kwak MS, Yang JI, Yim JY,
Lim SH and Itani M: The serum vitamin D level is inversely
correlated with nonalcoholic fatty liver disease. Clin Mol Hepatol.
22:146–151. 2016. View Article : Google Scholar : PubMed/NCBI
|
|
29
|
Patel YA, Henao R, Moylan CA, Guy CD,
Piercy DL, Diehl AM and Abdelmalek MF: Vitamin D is not associated
with severity in NAFLD: Results of a paired clinical and gene
expression profile analysis. Am J Gastroenterol. 111:1591–1598.
2016. View Article : Google Scholar : PubMed/NCBI
|