Introduction
Primary culture of smooth muscle cells (SMCs) is an
established method in the study of vascular physiology and
pathophysiology (1-3).
Many researchers have performed primary culture of human
gastrointestinal/esophageal SMCs (4-6);
enzymatic dispersion (ED) is the most common method. At least two
enzymes with one or two processes/steps were typically used in
previous studies (7-10);
however, to the best of the authors' knowledge, there are no
corresponding established or systematic processes of SMC culture in
the digestive system, including detailed identification using
smooth muscle markers. Gargus et al (7), Rieder et al (11) and Niu et al (12) introduced processes for primary
culture and identification of human esophageal SMCs and fibroblasts
in vitro; however, these processes are relatively
complicated and lack detailed identification methods.
Collagenase II is one of the most commonly used
enzymes in the isolation of primary SMCs (3,8,11,13).
Immersing tissue fragments directly in collagenase solution for
0.5-6 h at 37˚C is the most common isolation method (7,9,11,12). In
contrast to the traditional method, in the present study, smooth
muscles were collected from the tumor-free esophagogastric junction
(EGJ) of patients with esophageal carcinoma and the traditional
method was improved by using an enzyme-injected (EI) method for SMC
isolation at low temperature (4˚C) for an extended duration (14-24
h). Through comparative observation, it was identified that it was
effective in isolating more adherent spindle cells and that the
cells could proliferate in vitro for 3-8 generations of SMC
primary culture, as indicated by identification with smooth muscle
markers, including α-smooth muscle actin (α-SMA) (13-15),
smooth muscle 22 α (SM22α) (14-16),
vimentin (7,8), desmin (7,17) and
CD90 (7,18). The present study identified improved
processes for in vitro culture of SMCs obtained from the
digestive tract and established a foundation for the study of
primary esophageal motility disorders (PEMDs), gastroesophageal
reflux diseases (GERDs) and tissue engineering of the
esophagus.
Materials and methods
Patients and specimens
The present study was approved by The Medical Ethics
Committee of The Fourth Hospital of Hebei Medical University.
Informed consent was obtained from the patients or their authorized
relatives. Smooth muscles of EGJ were obtained from patients
diagnosed at the Thoracic Department, Fourth Hospital of Hebei
Medical University undergoing esophagectomy for upper esophageal
carcinoma. Patients had no symptoms of heartburn and regurgitation,
nor had any medical history of esophageal dysfunction or treatment
with calcium channel blockers. A total of 23 patients agreed to
provide tissue specimens for the present study during the period
from January 2015 to December 2017, including 15 men and 8 women
with a mean age of 60.26±6.32 years; range, 49-71 years.
EGJ tissues were removed during
surgery (19)
Through examination of muscle fibers, esophageal
circular (EC) muscle, esophageal longitudinal (EL) muscle, sling
fiber (Sling), clasp fiber (Clasp), gastric circular muscle near
sling in gastric bottom (GC-S) and gastric circular muscle near
clasp in lesser gastric curvature (GC-C) were identified. Smooth
muscles were prepared in 5-15x5-10 mm strips. Samples from the same
patient were divided into three parts: i) One part was used for
isolation of SMCs and was quickly placed into a 1.5 ml Eppendorf
tube with 1 ml DMEM/F12 (Thermo Fisher Scientific, Inc.) and 200 µl
penicillin/streptomycin (P/S) solution (Biological Industries); ii)
another was used for immunohistochemistry (IHC) and was immediately
immersed in 10% neutral formalin at room temperature for 8-12 h;
and iii) one was used for reverse transcription-quantitative PCR
(RT-qPCR) and was immersed in RNAlater (Thermo Fisher Scientific,
Inc.) and stored at -80˚C.
Hematoxylin and eosin (H&E)
staining
Smooth muscles immersed in 10% neutral formalin were
embedded in paraffin, and were cut into 4-µm sections for H&E
staining Following deparaffinization in xylene and hydration in
descending concentrations of alcohol, sections were stained in
hematoxylin for 3 min followed washing in running tap water.
Sections were differentiatedin 1% HCl in 70% alcohol for 30 sec.
Sections were then dipped in 0.6% ammonia water followed by washing
in tap water until the nuclei were stained blue. Following staining
in 1% eosin for 3 min and a tap water wash, sections were
dehydrated in increasing concentrations of alcohols and cleared in
xylene. Two pathologists measured the morphology of SMCs in these
sections. SMCs were observed in bundles without heteromorphism
under a light microscope (TE2000-U; Nikon Corporation) at x200
magnification. Eosinophilic cytoplasms were stained pink. The
nuclei were oval, without heteromorphism or mitosis. No tumor cells
were contained in smooth muscle tissues.
Primary culture of SMCs: EI method of
ED
Smooth muscle strips were cut into 5-8x5 mm
fragments and soaked in collagenase II (Vetec™; Sigma-Aldrich;
Merck KGaA) DMEM/F12 solutions with concentrations of either 0.5
mg/ml or 1 mg/ml were mixed with ≥125 CDU/mg collagenase II. The
solution volume was 5-6-fold greater than the tissue volume.
DMEM/F12 mixed with collagenase II (0.1-0.2 ml) was injected into
the fragments, which were then digested at 4˚C for 14-24 h. A total
of 400-600 µl newborn bovine serum (NBS; Biological Industries) was
mixed into the solution to terminate digestion with soft suction
piping for 5 min to isolate cells. Following filtration by sieving
through a nylon net (200-µm aperture), the filtrate was centrifuged
at 100 x g for 5 min at room temperature. The resulting precipitate
was suspended with 1 ml smooth muscle cell medium (SMCM; ScienCell
Research Laboratories, Inc.) and placed in six-well plates
pre-layered with 0.1 mg/ml poly-L-lysine (Sigma-Aldrich; Merck
KGaA). Cells were placed in a humidified incubator with 5%
CO2 at a temperature of 37˚C. After 48 h, the wells were
gently flushed with PBS and 2 ml SMCM was added. This constituted
the EI method. Primary cells were dispersed with 0.25% Trypsin/EDTA
and sub-cultured in two flasks when cells were closely arranged and
crowded. The number of days during primary cell adherence to
sub-culture with 0.25% Trypsin/EDTA was defined as the first
passage day (FPD).
These two groups described, in which 0.5 mg/ml or 1
mg/ml collagenase II solution was injected into the tissues at 4˚C,
were defined as the 0.5-EI-4 group and the 1-EI-4 group,
respectively. Other conditions were modified to compare with the
two groups. First, smooth muscles were cut into 1-3x1-3 mm
fragments, then digested at 37˚C with 1 mg/ml collagenase II
solution for 1 h (1-C-37 group), or digested at 4˚C with 0.5 mg/ml
collagenase II solution for 14-24 h (0.5-C-4 group). These
comprised two traditional methods to isolate SMCs in vitro.
Second, smooth muscles were cut into 1-3x1-3 mm fragments, then
digested at 37˚C with 0.25% Trypsin/EDTA for 1 h (0.25-T-37 group),
or digested at 4˚C with 0.125% Trypsin/EDTA for 14-24 h (0.125-T-4
group), to test whether Trypsin/EDTA was effective for ED of
SMCs.
After 72 h, the number of visible adherent cells per
field were visualized under a light microscope (TE2000-U; Nikon
Corporation) at x200 magnification. The FPD was used to evaluate
the effectiveness of each method. The most effective method was
selected for subsequent experiments.
Cell culture and proliferation
test
Cells were passaged and continuously cultured in
SMCM (the second generation of SMCM cultured cells), or replaced
with DMEM/F-12 containing 10% NBS (10%-F12; the first generation of
10%-F12 cultured cells). Cells were defined as ED (SMCM) and ED
(10%-F12) as cultured by SMCS and 10%-F12, respectively.
The third generation of cells cultured in SMCM and
the second generation of cells cultured in 10%-F12 were tested for
proliferation. Cells were cultured in 3 wells of 96-well plates
with 2x10³ cells/well. According to the manufacturer's
protocol of the Cell Counting Kit-8 (CCK-8; Dojindo Molecular
Technologies, Inc.), the absorbance of each well per 24 h was
continuously measured over 9 days (216 h).
Identification of SMCs
SMCs were identified by the expression of the
following markers: α-SMA, SM22α, vimentin, desmin and CD90.
Proliferation potential was evaluated by proliferating cell nuclear
antigen (PCNA) (20-22).
The third generation of cells cultured in SMCM and the second
generation of cells cultured in 10%-F12 were tested.
IHC
IHC and scoring were conducted as described for
smooth muscles (23). Two
pathologists, blinded to tissue details, measured the extent of
marker expression. Expression was scored as follows: 9-12, strong;
5-8, moderate; 1-4, weak; and 0, negative. Detailed antibody
information is presented in Table
I.
 | Table ICatalog numbers and dilutions of
antibodies used in the present study. |
Table I
Catalog numbers and dilutions of
antibodies used in the present study.
| A, Primary
antibody |
|---|
| Name | Supplier | Cat. no. | Dilution | Application |
|---|
| Mouse
anti-α-SMA | Abcam | ab7817 | 1:100 | IHC, IF |
| Rabbit
anti-α-SMA | Abcam | ab124964 | 1:100 | IF, ICW |
| Rabbit
anti-vimentin | Abcam | ab92547 | 1:100 | IHC, IF, ICW |
| Goat
anti-desmin | Santa Cruz
Biotechnology, Inc. | sc-7559 | 1:100 | IF |
| Mouse
anti-desmin | Santa Cruz
Biotechnology, Inc. | sc-23879 | 1:50 | IHC, IF, ICW |
| Mouse
anti-CD90 | Abcam | ab181469 | 1:200 | IHC, IF, ICW |
| Rabbit
anti-SM22α | Abcam | ab14106 | 1:100 | IHC, IF, ICW |
| Mouse
anti-PCNA | Abcam | ab29 | 1:200 | IHC, IF, ICW |
| Mouse
anti-GAPDH | Abcam | ab8245 | 1:500 | IF, ICW |
| Rabbit
anti-GAPDH | Abcam | ab181602 | 1:500 | IF, ICW |
| B, Secondary
antibody |
| Name | Supplier | Cat. no. | Dilution | Application |
| Goat
anti-rabbit/mouse IgG | Servicebio,
Beijing, China | GB1210 | Ready to use | IHC |
| Donkey anti-mouse
IgG 647 | Abcam | ab150107 | 1:200 | IF |
| Donkey anti-rabbit
IgG 488 | Thermo Fisher
Scientific, Inc. | -A-21206 | 1:200 | IF |
| Donkey anti-goat
IgG 555 | Abcam | ab150130 | 1:200 | IF |
| Goat anti-rabbit
IgG 549 | KPL, Inc. | 072-04-15-06 | 1:200 | IF |
| Goat anti-mouse IgG
488 | KPL, Inc. | 072-03-18-06 | 1:200 | IF |
| Goat anti-mouse IgG
IRDyeR 800CW | Rockland
Immunochemicals, Inc. | 25340 | 1:5,000 | ICW |
| Donkey anti-rabbit
IgG (Alexa Fluor® 680) | Abcam | ab175772 | 1:5,000 | ICW |
RT-qPCR
Total RNA was extracted using TRIzol®
(TriQuick Reagent total RNA extraction kit; Invitrogen; Thermo
Fisher Scientific, Inc.) and phenol-chloroform extraction, using
either frozen muscle samples or cultured cells (that were grown to
the third generation in SMCM and the second generation in 10%-F12).
The integrity of the RNA was verified by 2% agarose gel
electrophoresis and ethidium bromide staining at 160 V for 15 min.
In total, 3 µg total RNA was reverse transcribed with random
hexamers using a Thermo RT kit (Thermo Fisher Scientific, Inc.) and
a Veriti PCR system (Thermo Fisher Scientific, Inc.). The following
heat cycle was used for RT: annealing at 25˚C for 5 min extension
at 42˚C for 1 h and reverse transcriptase inactivation at 70˚C for
5 min. Samples were subsequently stored at 4˚C.
Each real-time PCR reaction comprised 2 µl RT
product, 5 µl SYBR Green qPCR Super Mix (Thermo Fisher Scientific,
Inc.), 0.8 µl mixture of forward and reverse primers at 100-fold
dilution, and 2.2 µl nuclease-free water. Reactions were performed
in an ABI 7500 Real-Time PCR System (Thermo Fisher Scientific,
Inc.) for 40 cycles (95˚C for 30 sec, optimum temperature for 30-40
sec and 72˚C for 30-40 sec). In the present study, each group was
treated as an independent sample (not paired samples), and the
expression level of smooth muscle markers in EGJ smooth muscles and
cells cultured in vitro was not clear. The purpose of the
present study was to clarify the characteristics of the expression
levels of smooth muscle markers in EGJ smooth muscles and cells
cultured in vitro, rather than to standardize or homogenize
them to compare the expression level of one gene to the others, so
there was no blank control group and the fold change in expression
of each gene was calculated using the
2-ΔΔCq method (24-26),
with GAPDH as an internal control. Primer information is presented
in Table II.
| Table IIPrimer information. |
Table II
Primer information.
| Gene | Direction | Sequence,
5'-3' | AT, ˚C | Products, bp |
|---|
| α-SMA | F |
GCGACCCTAAAGCTTCCCAG | 60 | 145 |
| | R |
TTCTTGGGCCTTGATGCGAA | | |
| Vimentin | F |
GAGAACTTTGCCGTTGAAGC | 59 | 170 |
| | R |
TCCAGCAGCTTCCTGTAGGT | | |
| Desmin | F |
GATCCAGTCCTACACCTGCG | 58 | 96 |
| | R |
TCACTGGCAAATCGGTCCTC | | |
| CD90 | F |
AAGAGCAGACCTTCTCTGGGTC | 59 | 313 |
| | R |
GCGGCTGCAGCTACAATCAA | | |
| SM22α | F |
AACAGCCTGTACCCTGATGG | 61 | 239 |
| | R |
CGGTAGTGCCCATCATTCTT | | |
| PCNA | F |
GTAGTAAAGATGCCTTCTGGTG | 60 | 190 |
| | R |
TCTCTATGGTAACAGCTTCCTC | | |
| GAPDH | F |
CGCTGAGTACGTCGTGGAGTC | - | 172 |
| | R |
GCTGATGATCTTGAGGCTGTTGTC | | |
Immunofluorescence
Cells were fixed with 4% paraformaldehyde for 30-60
min at room temperature. After permeation with 0.3% (v/v) Triton
X-100 (Sigma-Aldrich; Merck KGaA) for 5 min and blocking with 5%
BSA-PBS for 1 h at room temperature, cells were incubated with
primary antibodies for 12 h at 4˚C; they were then washed three
times with PBS. Cells were incubated with Secondary antibodies for
1 h at room temperature to visualize the binding of anti-α-SMA,
anti-SM22α, anti-vimentin, anti-desmin, anti-CD90 and anti-PCNA
antibodies. Nuclear staining was performed with 4',6'-DAPI
(Sigma-Aldrich; Merck KGaA) for 5 min at room temperature. The
images were viewed using a confocal laser scanning microscope (LSM
510; Zeiss AG) at x200 magnification. Detailed antibody information
is presented in Table I.
In-cell western
Cells (6-8x10³/200 µl/well) were
transferred to black 96-well plates (cat. no. 3603; Corning, Inc.)
at room temperature during the process of subculture. After
adherence for 6 h, the medium was removed. Experimental procedures
were performed as described in a previous study by Henrich
(27). Using the concentrations
shown in Table I, primary antibodies
(mouse/rabbit) and anti-GAPDH (rabbit/mouse) were premixed together
in 2% BSA-PBS. The dilutions of goat anti-mouse IgG 800 (cat. no.
25340; Rockland Immunochemicals, Inc.) and anti-rabbit IgG 680
(cat. no. ab175772; Abcam) antibodies were 1:5,000, premixed in 2%
BSA-PBS. After the final washes, plates were scanned on the Odyssey
Imaging System (UL3101-1, LI-COR Biosciences) using the ‘In-Cell
Western’ mode to capture relative fluorescence in each channel. The
formula of relative protein expression was as follows: Relative
expression of target protein = Fluorescence intensity of target
protein (700/800)/Fluorescence intensity of GAPDH (800/700).
Statistical analysis
Statistical analysis was conducted with SPSS 13.0
(SPSS, Inc.). For measurement data with normal distribution and
variance, samples are presented as the mean ± SD in tables or
histograms and standard deviations in figures. A total of two
independent samples t-tests were used in two group comparisons, and
one-way ANOV followed by Student-Newman-Keuls post-hoc test was
performed for multiple group comparisons. Measurement data that
were neither normal nor homogeneous were recorded as median
(interquartile range) in tables or box plots in figures (28-30),
followed by Wilcoxon rank sum test (31). Box plots can be selected for normal
and non-normal distribution data with distribution characteristics,
including the median, the approximate quartiles, and the lowest and
highest data points to convey the level, spread and symmetry
(28). For IHC staining (count
data), specimens were evaluated as strong, moderate, weak or
negative expression, without further statistical comparison.
P<0.05 was considered to indicate a statistically significant
difference.
Results
Patient information
General information on patient characteristics is
shown in Table III.
| Table IIIPatient information. |
Table III
Patient information.
| | | | | | | Cell
generations | | | | | |
|---|
| Patients
number | Sex | Age (years) | Smooth muscle
species | H&E | Primary
culture | SMCM | 10%-F12 | Proliferation
test | IHC | RT-qPCR | IF | In-cell
western |
|---|
| 1 | M | 57 | 6 | Yes | Yes | 6 | 2 | - | - | - | - | - |
| 2 | M | 63 | 6 | Yes | Yes | 7 | 3 | - | - | - | - | - |
| 3 | F | 65 | 6 | Yes | Yes | 5 | 4 | - | - | - | - | - |
| 4 | M | 67 | 6 | Yes | Yes | 6 | 3 | - | - | - | - | - |
| 5 | F | 69 | 6 | Yes | Yes | 5 | 3 | - | - | - | - | - |
| 6 | M | 57 | 6 | Yes | Yes | 4 | 4 | - | - | - | - | - |
| 7 | F | 50 | 6 | Yes | Yes | 7 | 3 | - | - | - | - | - |
| 8 | M | 71 | 6 | Yes | Yes | 5 | 3 | Yes | - | - | - | - |
| 9 | M | 68 | 6 | Yes | Yes | 6 | 4 | Yes | - | - | - | - |
| 10 | M | 62 | 6 | Yes | Yes | 5 | 3 | Yes | - | - | - | - |
| 11 | F | 56 | 6 | Yes | Yes | 6 | 4 | Yes | - | - | - | - |
| 12 | M | 64 | 6 | Yes | Yes | 6 | 4 | Yes | - | - | - | - |
| 13 | F | 57 | 6 | Yes | Yes | 7 | 3 | Yes | - | - | - | - |
| 14 | F | 60 | 6 | Yes | Yes | 5 | 3 | Yes | - | - | Yes | - |
| 15 | M | 64 | 6 | Yes | Yes | 6 | 4 | - | Yes | Yes | Yes | Yes |
| 16 | M | 51 | 6 | Yes | Yes | 8 | 3 | - | Yes | Yes | Yes | Yes |
| 17 | M | 62 | 6 | Yes | Yes | 4 | 3 | - | Yes | Yes | Yes | Yes |
| 18 | M | 49 | 6 | Yes | Yes | 7 | 4 | - | Yes | Yes | Yes | Yes |
| 19 | M | 58 | 6 | Yes | Yes | 8 | 4 | - | Yes | Yes | Yes | Yes |
| 20 | F | 63 | 6 | Yes | Yes | 6 | 2 | - | Yes | Yes | Yes | Yes |
| 21 | M | 66 | 6 | Yes | Yes | 7 | 3 | - | Yes | Yes | Yes | Yes |
| 22 | F | 56 | 6 | Yes | Yes | 5 | 4 | - | Yes | Yes | Yes | Yes |
| 23 | M | 51 | 6 | Yes | Yes | 6 | 3 | - | - | - | - | - |
ED with tissue fragments
In the present study, all types of ED methods could
isolate adherent cells that grew in culture. There were no
differences in morphology among cells obtained by these methods.
Therefore, both collagenase II and Trypsin/EDTA can be selected as
working enzymes for the ED method of SMC isolation. Cells were
spindle- or long-spindle-shaped and some were rod-like. Few
fibroblasts were observed with long pseudopods. Many nonadherent or
unstretched cells remained floating in the medium at 2 days before
flushing (Fig. 1A).
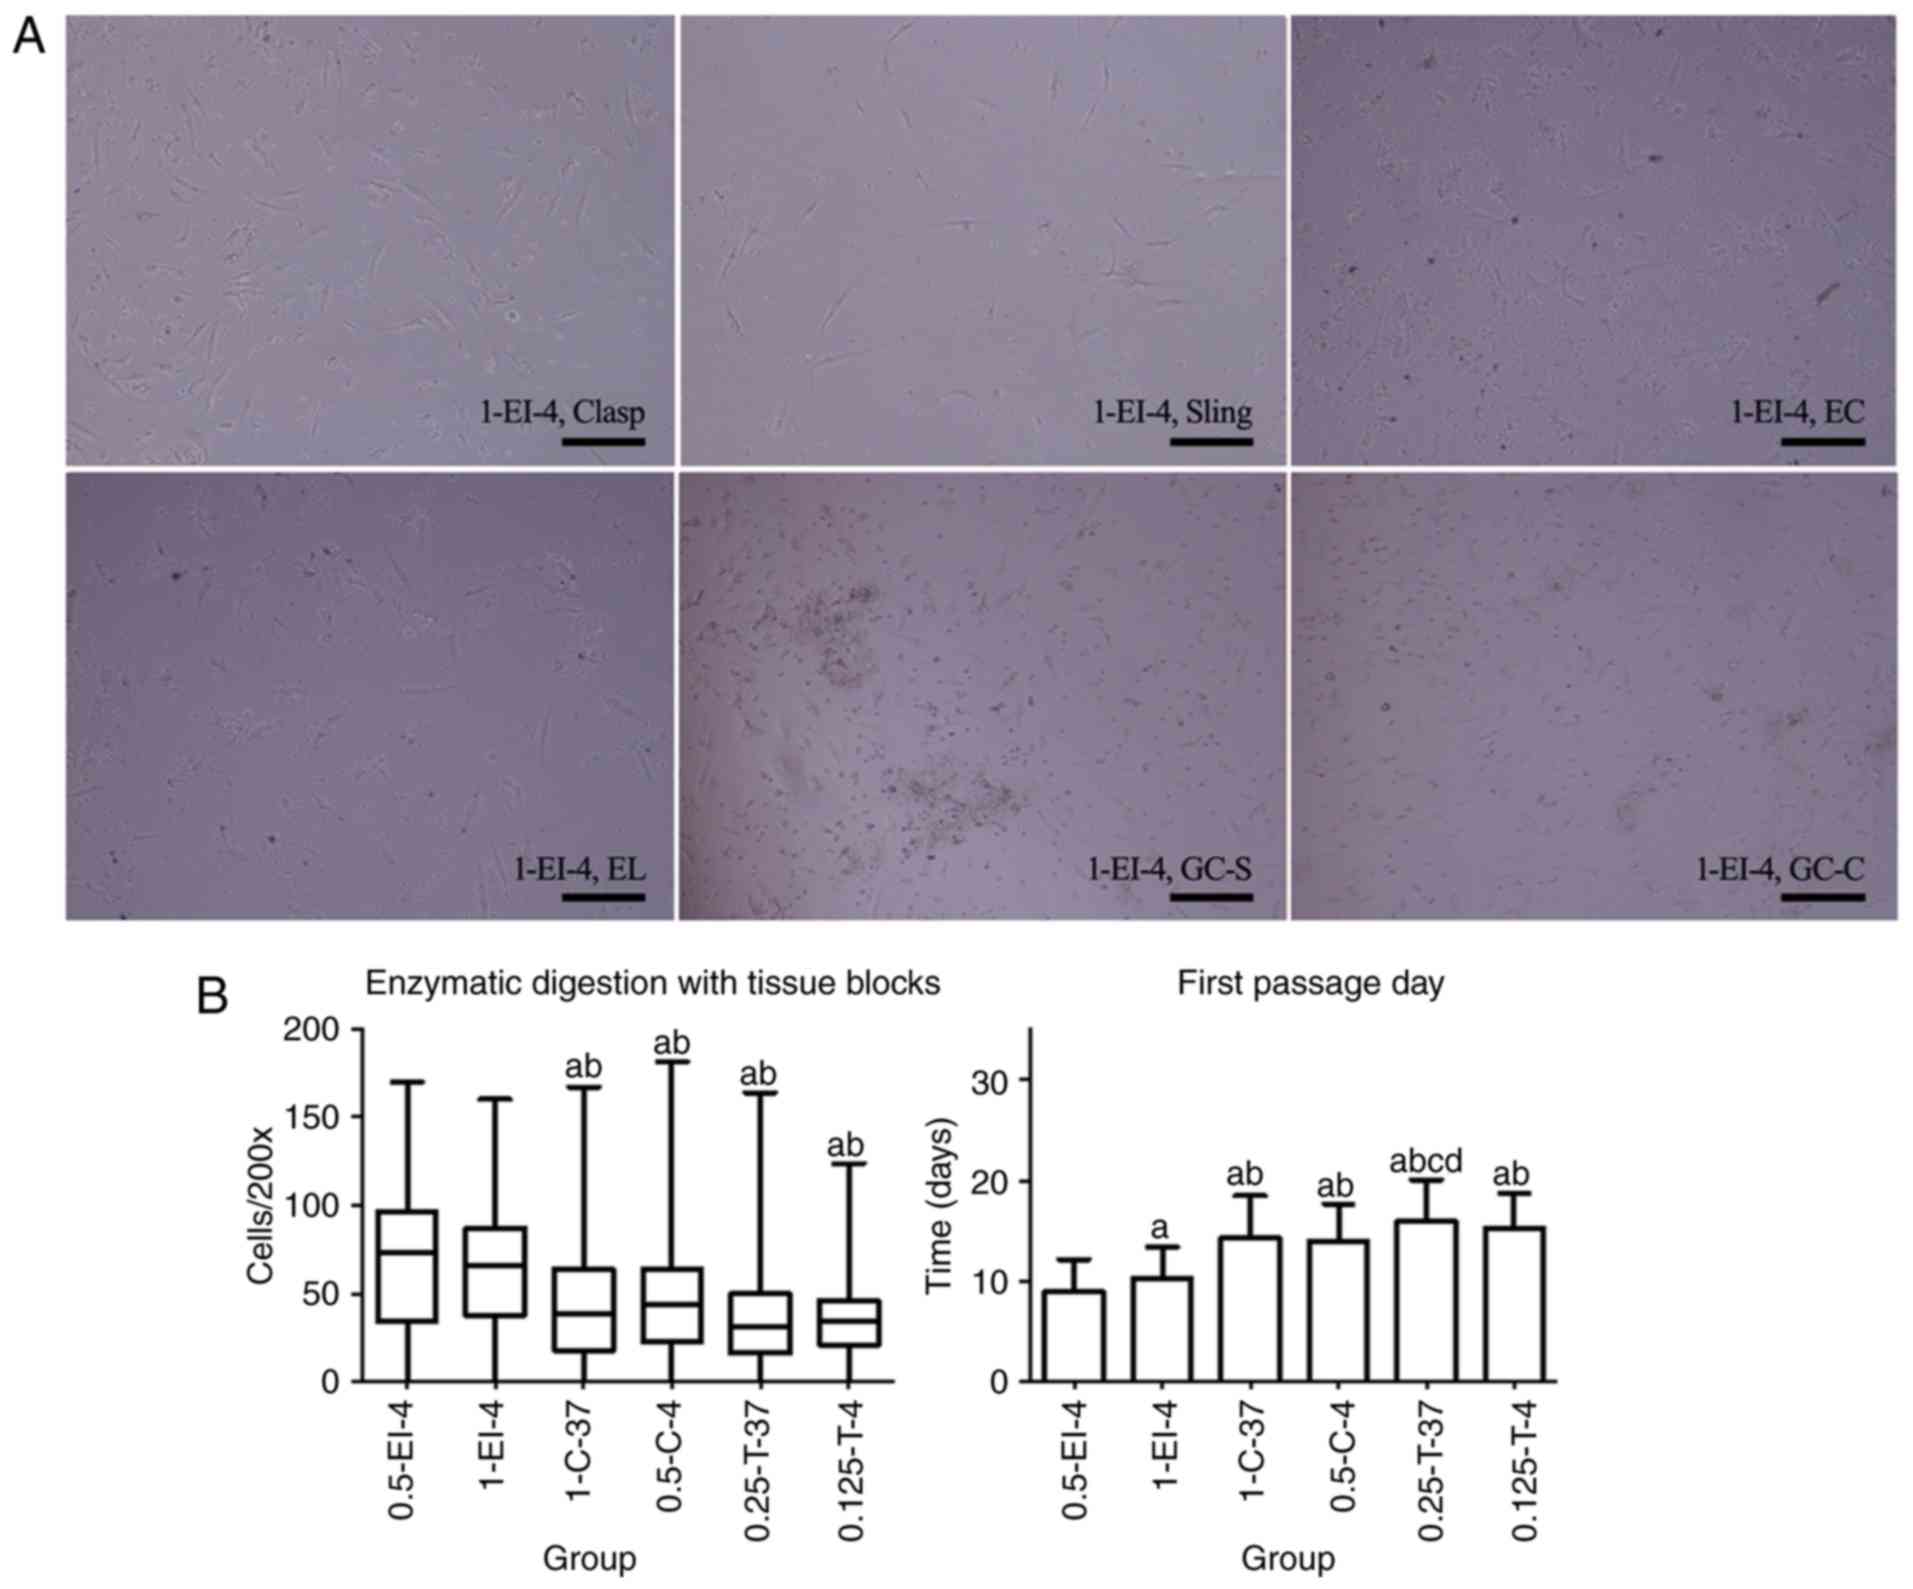 | Figure 1Primary cells of esophagogastric
junction obtained by ED. (A) Primary cells obtained by 1-EI-4 as an
example after 36 h of adherence. Cells showed equal background
distribution and scattered cell fragments after adherence. Most
cells were spindle- or long-spindle-shaped but not uniform as some
were rod-like. Few fibroblasts could be seen with long pseudopods.
Magnification, x200; scale bar, 200 µm. (B) Comparison of different
ED methods to obtain primary cells (from 23 patients). There were
no statistical differences in visible adherent cells per field of
microscope (magnification, x200; Cells/200x); 0.5-EI-4 was
statistically different from both 0.5-C-4 and 0.25-T-37 in the
first passage day. aP<0.05 vs. 0.5-EI-4;
bP<0.05 vs. 1-EI-4; cP<0.05 vs. 1-C-37;
dP<0.05 vs. 0.5-C-4. ED, enzymatic dispersion. Clasp,
clasp fiber; Sling, sling fiber; EC, esophageal circular; EL,
esophageal longitudinal; GC-S, gastric circular muscle near sling
in gastric bottom; GC-C, gastric circular muscle near clasp in
lesser gastric curvature; EI, enzyme injection; C, collagenase II;
T, Trypsin; 0.5-EI-4, 0.5 mg/ml collagenase II solution injected
into tissues at 4˚C; 1-EI-4, 1 mg/ml collagenase II solution
injected into the tissues at 4˚C; 1-C-37, digested at 37˚C with 1
mg/ml collagenase II solution; 0.5-C-4, digested at 4˚C with 0.5
mg/ml collagenase II solution; 0.25-T-37, digested at 37˚C with
0.25% Trypsin/EDTA; 0.125-T-4, digested at 4˚C with 0.125%
Trypsin/EDTA. |
In 6 patients, primary cells isolated from six types
of smooth muscles did not adhere to the bottom of 6-well plates,
leading to cell counts of 0. There was no statistical difference in
Cells/200x between groups 0.5-EI-4 and 1-EI-4 (P=0.994), but
Cells/200x of groups 0.5-EI-4 and 1-EI-4 were greater than those of
the other four groups (P<0.001, P=0.009, P<0.001 and
P<0.001 for 0.5-EI-4 compared with 1-C-37, 0.5-C-4, 0.25-T-37
and 0.125-T-4, respectively; P<0.001, P=0.004, P<0.001 and
P<0.001 for 1-EI-4 compared with 1-C-37, 0.5-C-4, 0.25-T-37 and
0.125-T-4, respectively). FPD was significantly earlier in 0.5-EI-4
compared with the other five groups (P=0.024, P<0.001,
P<0.001, P<0.001 and P<0.001 for 0.5-EI-4 compared with
1-EI-4, 1-C-37, 0.5-C-4, 0.25-T-37 and 0.125-T-4, respectively),
and it was earlier in 1-EI-4 compared with 1-C-37, 0.5-C-4,
0.25-T-37 and 0.125-T-4 (P<0.001, P<0.001, P<0.001 and
P<0.001, respectively; Fig. 1B;
Table IV). Therefore, it was
effective to use a single enzyme to isolate primary cells, both for
collagenase II, the most commonly used tool for primary cell
isolation, and for Trypsin/EDTA, the most commonly used digestive
enzyme in the laboratory. The most efficient ED method in the
present study was EI digested with collagenase II at low
temperature (4˚C) and low concentration (0.5 mg/ml) for an extended
period (14-24 h). According to these results, 0.5-EI-4 was the most
effective method and cells obtained from 0.5-EI-4 were used in the
subsequent studies.
| Table IVStatistics regarding enzymatic
dispersion with tissue blocks of smooth muscle specimens. |
Table IV
Statistics regarding enzymatic
dispersion with tissue blocks of smooth muscle specimens.
| | Cells/x200 | FPD |
|---|
| Group | n | Median | Interquartile
range | Range | n | Mean | Standard
deviation | Range |
|---|
| 0.5-EI-4 | 85 | 73.00 | 63.00 | 0-170 | 81 | 9.01 | 3.15 | 5-19 |
| 1-EI-4 | 98 | 66.00 | 50.00 | 0-160 | 95 | 10.27a | 3.09 | 6-20 |
| 1-C-37 | 132 | 38.50a,b | 46.00 | 0-167 | 123 | 14.35a,b | 4.18 | 6-23 |
| 0.5-C-4 | 78 | 43.50a,b | 42.00 | 0-182 | 75 | 14.04a,b | 3.68 | 7-24 |
| 0.25-T-37 | 82 | 31.50a,b | 34.00 | 0-164 | 80 | 15.95a-d | 4.16 | 6-26 |
| 0.125-T-4 | 67 | 34.00a,b | 25.00 | 0-124 | 66 | 15.23a,b | 3.45 | 6-26 |
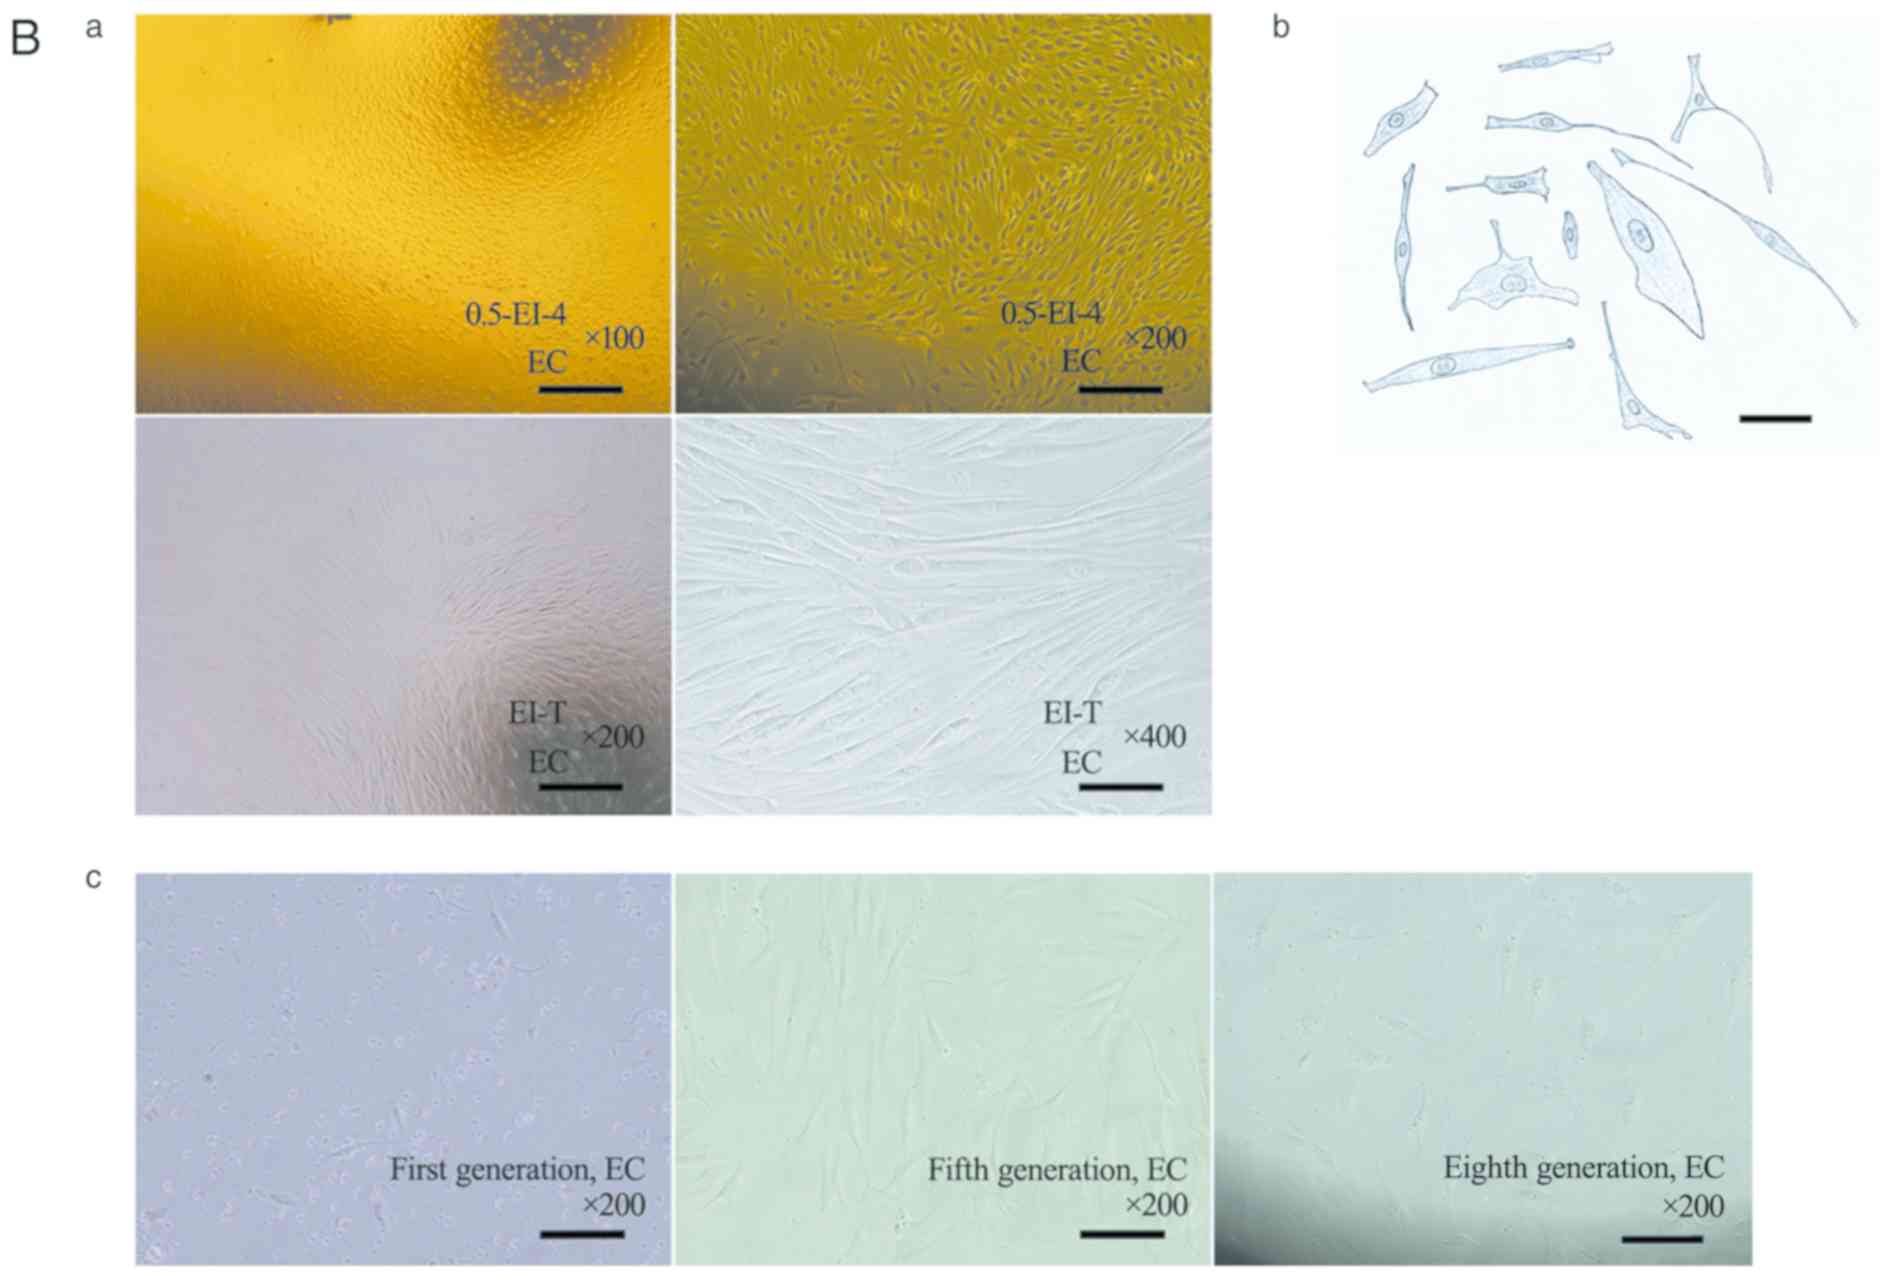
Growth and proliferation of cells
Cultured cells could be dispersed with 0.25%
Trypsin/EDTA in 40-100 sec at room temperature, then sub-cultured
in two flasks, so that the spindle cells were relatively sparse,
leaving space between them for cell proliferation (Fig. 2A-a). The primary cells could grow and
proliferate in SMCM, but merely survived in 10%-F12. The
proliferation test (n=7) showed typical ‘S-shaped curves’ in SMCM,
but not in 10%-F12 (Fig. 2A-b).
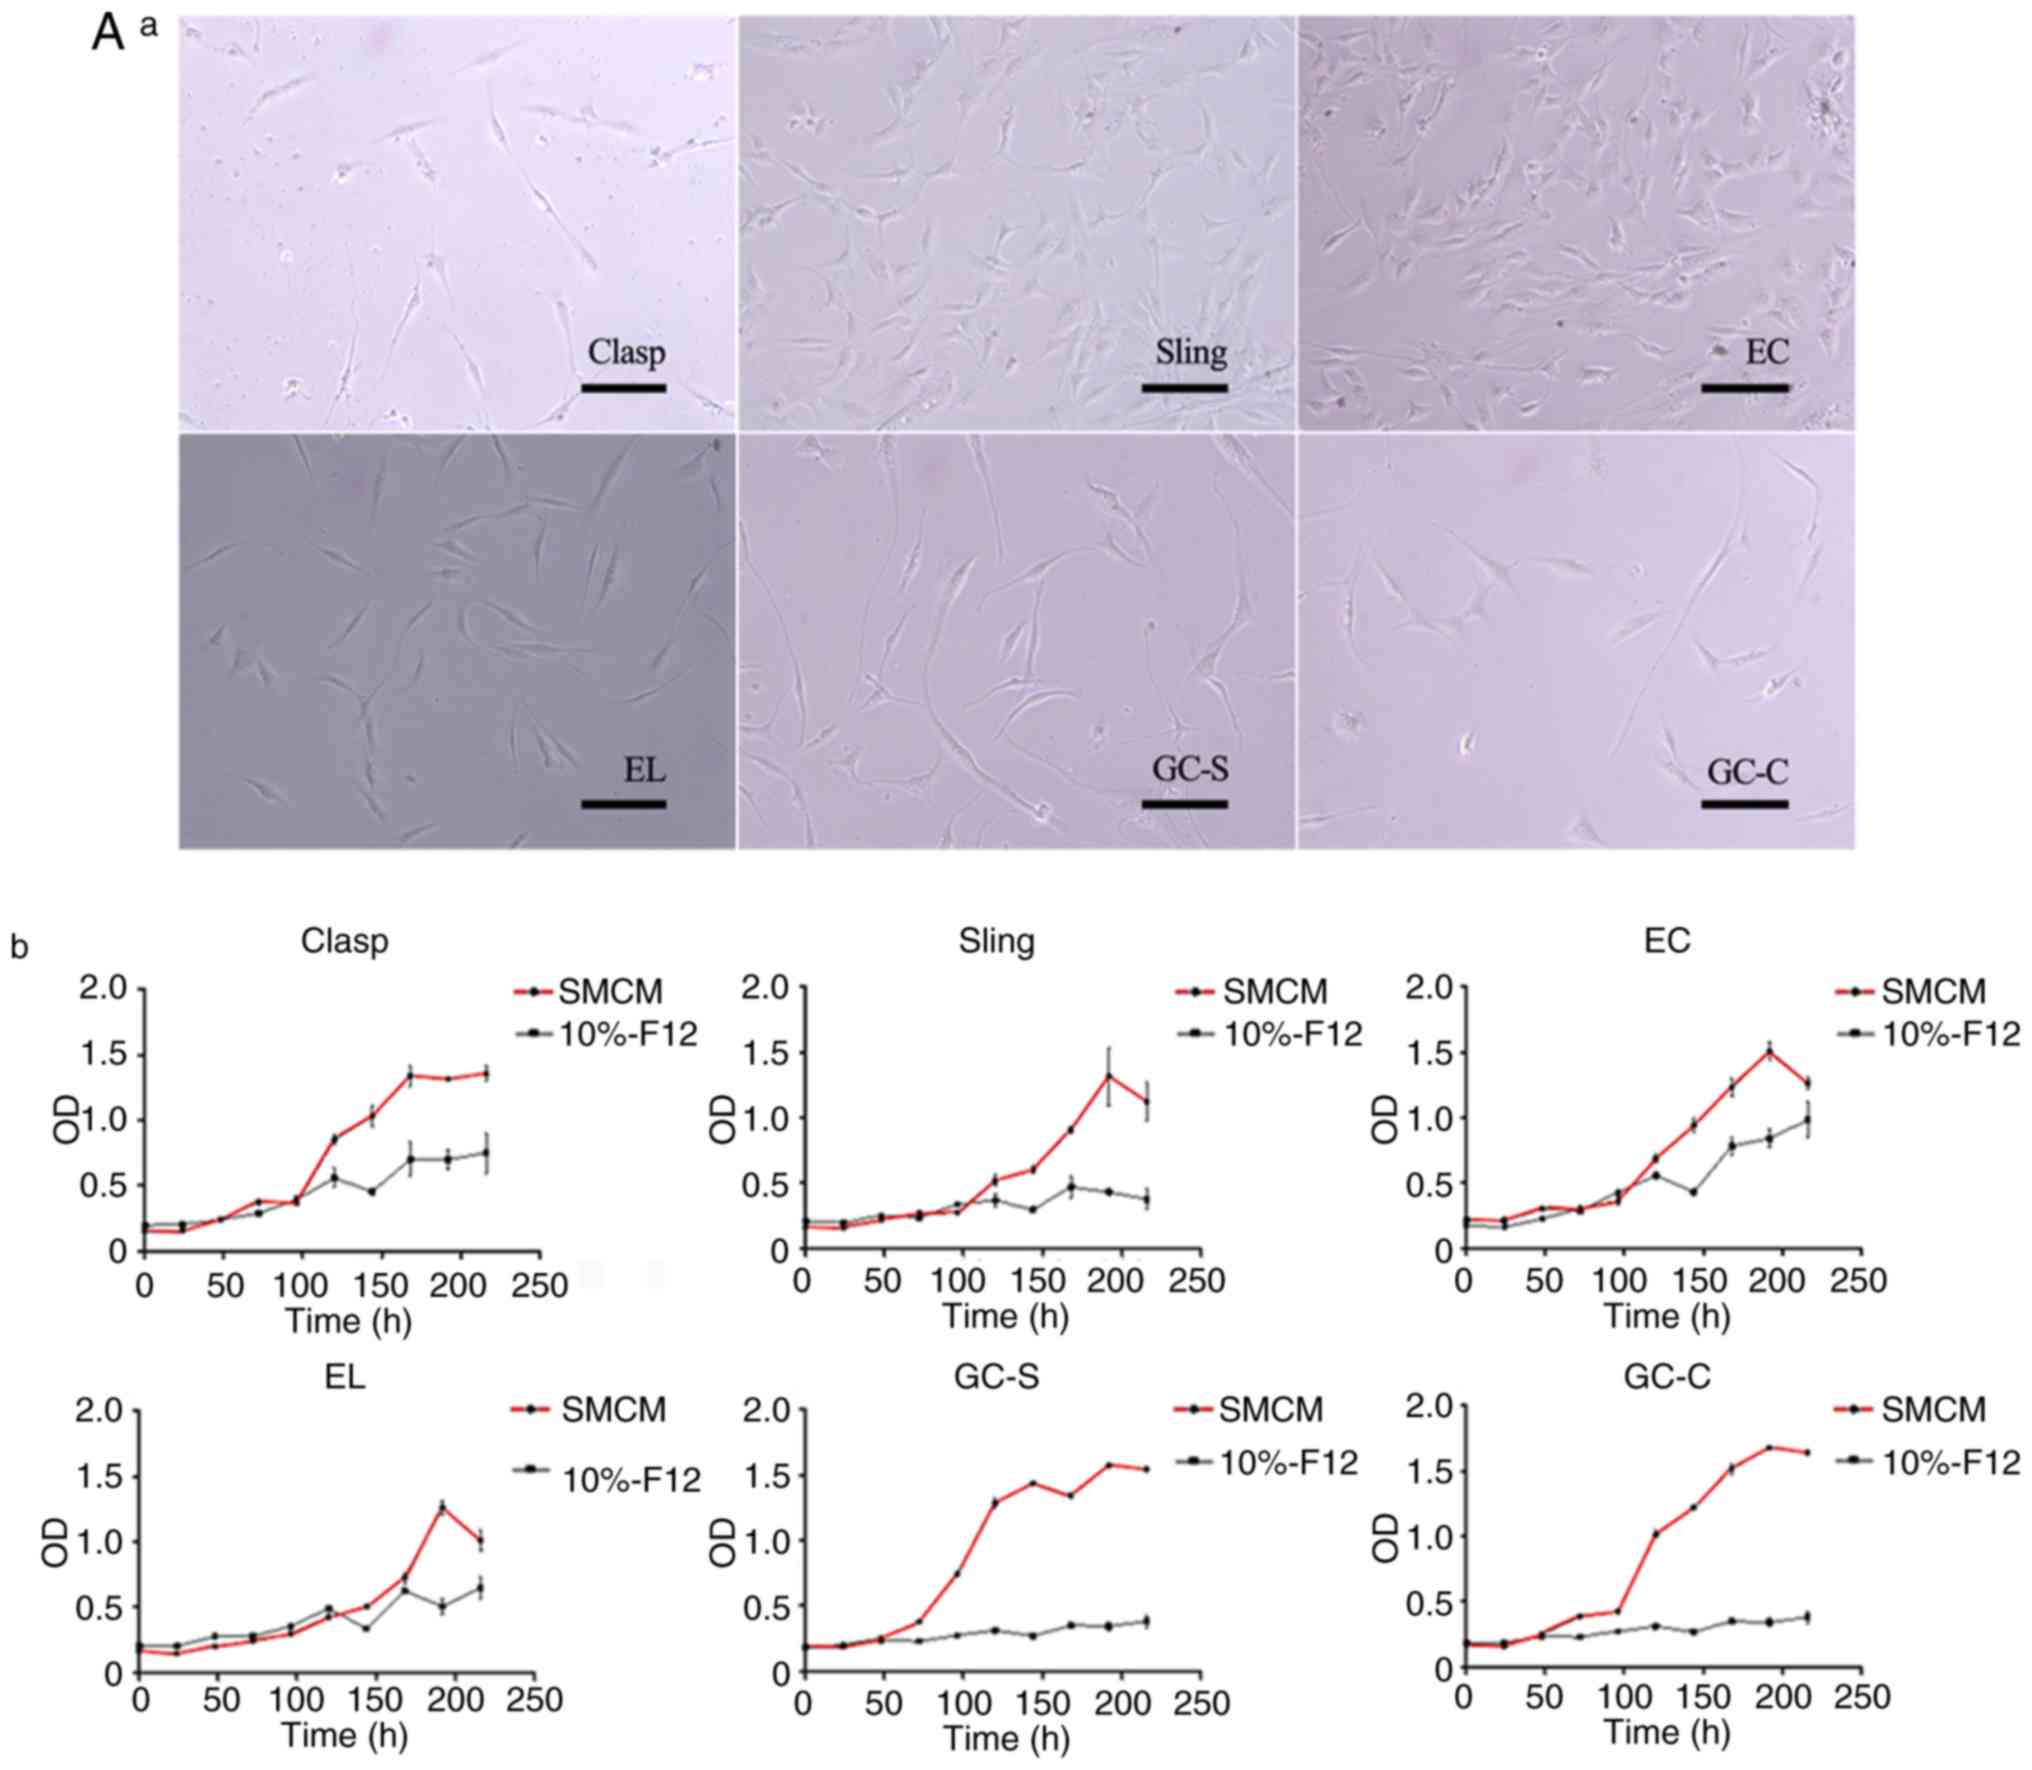 | Figure 2Growth and proliferation of
esophagogastric junction cells in vitro. (A) Cells obtained
by EI in sub-culture. (A-a) Cell morphology of each group after
sub-culture to the third generation. Magnification, x200; scale
bar, 200 µm. (A-b) Cell proliferation curves in SMCM (third
generation; red curve) and DMEM/F12 containing 10% newborn bovine
serum (10%-F12; second generation; black curve). n=7. Experiments
were perfomed in duplicate. A typical ‘S’ curve was observed in
SMCM; in 10%-F12, cell proliferation was largely stopped. (B)
Representative cell morphology of EC muscle cells. (B-a) Typical
structure of ‘hills and valleys’ for primary (two images above on
10th day after adherence) and sub-cultured (two images below,
second generation) cells obtained by EI. Scale bar, 200 µm. Cells
cultured in vitro grew in a uniform direction as ‘hills and
valleys’, as determined by in topographical mapping. (B-b) An
illustration of cell morphology. Magnification, x400; scale bar,
200 µm. Cells were spindle- or long-spindle-shaped, but not
uniform; some were rod- or besom-like. Pseudopods of cells
differed. (B-c) As the number of passages increased, spindle cells
became larger and deformed. Magnification, x200; scale bar, 200 µm.
Sizes and morphologies of the fifth (middle) and eighth (right)
generation cells were compared with primary spindle cells (left),
after 36 h of adherence. EI, enzyme-injected; SMCM, smooth muscle
cell medium; Clasp, clasp fiber; Sling, sling fiber; EC, esophageal
circular; EL, esophageal longitudinal; GC-S, gastric circular
muscle near sling in gastric bottom; GC-C, gastric circular muscle
near clasp in lesser gastric curvature; OD, optical density;
0.5-EI-4, 0.5 mg/ml collagenase II solution injected into tissues
at 4˚C; 1-EI-4, 1 mg/ml collagenase II solution injected into the
tissues at 4˚C; T, Trypsin. |
Cells cultured in vitro grew in a uniform
direction with ‘hills and valleys’ morphology (Fig. 2B-a). Different morphological types
could coexist in cultures obtained from the same tissue. Dominant
cells were spindle- or long-spindle-shaped; some were rod-like or
besom-like, and pseudopods differed among cells (Fig. 2B-b). As the number of passages
increased, cells would gradually enlarge and deform from
spindle-like to irregular morphology (Fig. 2B-c). In the first generation, the
crowded cells were spherical multicellular nodules, surrounded in a
layered fashion. Cells cultured in SMCM lost spindle-like
morphology in the fourth to eighth generations [the median number
of cell passages (interquartile range) was 6.0 (2.0) generations
and the maximum and minimum values were at generations 8 and 4,
respectively]; this change occurred in the second to fourth
generations of 10%-F12 cultures [the median number of cell passages
(interquartile range) was 3.0 (1.0) generations and the maximum and
minimum values were at generations 4 and 2, respectively] (Table III). Cryopreservation was feasible
in a combination of NBS and DMSO (volume ratio, 9:1) in the
following processes: 4˚C for 30 min → -20˚C for 2-4 h → -80˚C for
3-4 months), but most cells died if the duration exceeded 6 months
at -80˚C.
In the present study, it was observed that specimens
from older donors (65-71 years) yielded fewer SMCs; it was more
difficult to obtain enough cells from their tissues. Despite the
success of primary culture, such cells showed more rapid aging and
deformation, and could tolerate fewer passages. Conversely, tissues
provided by younger donors (49-56 years) yielded SMCs relatively
easily; these were also easy to culture and passage.
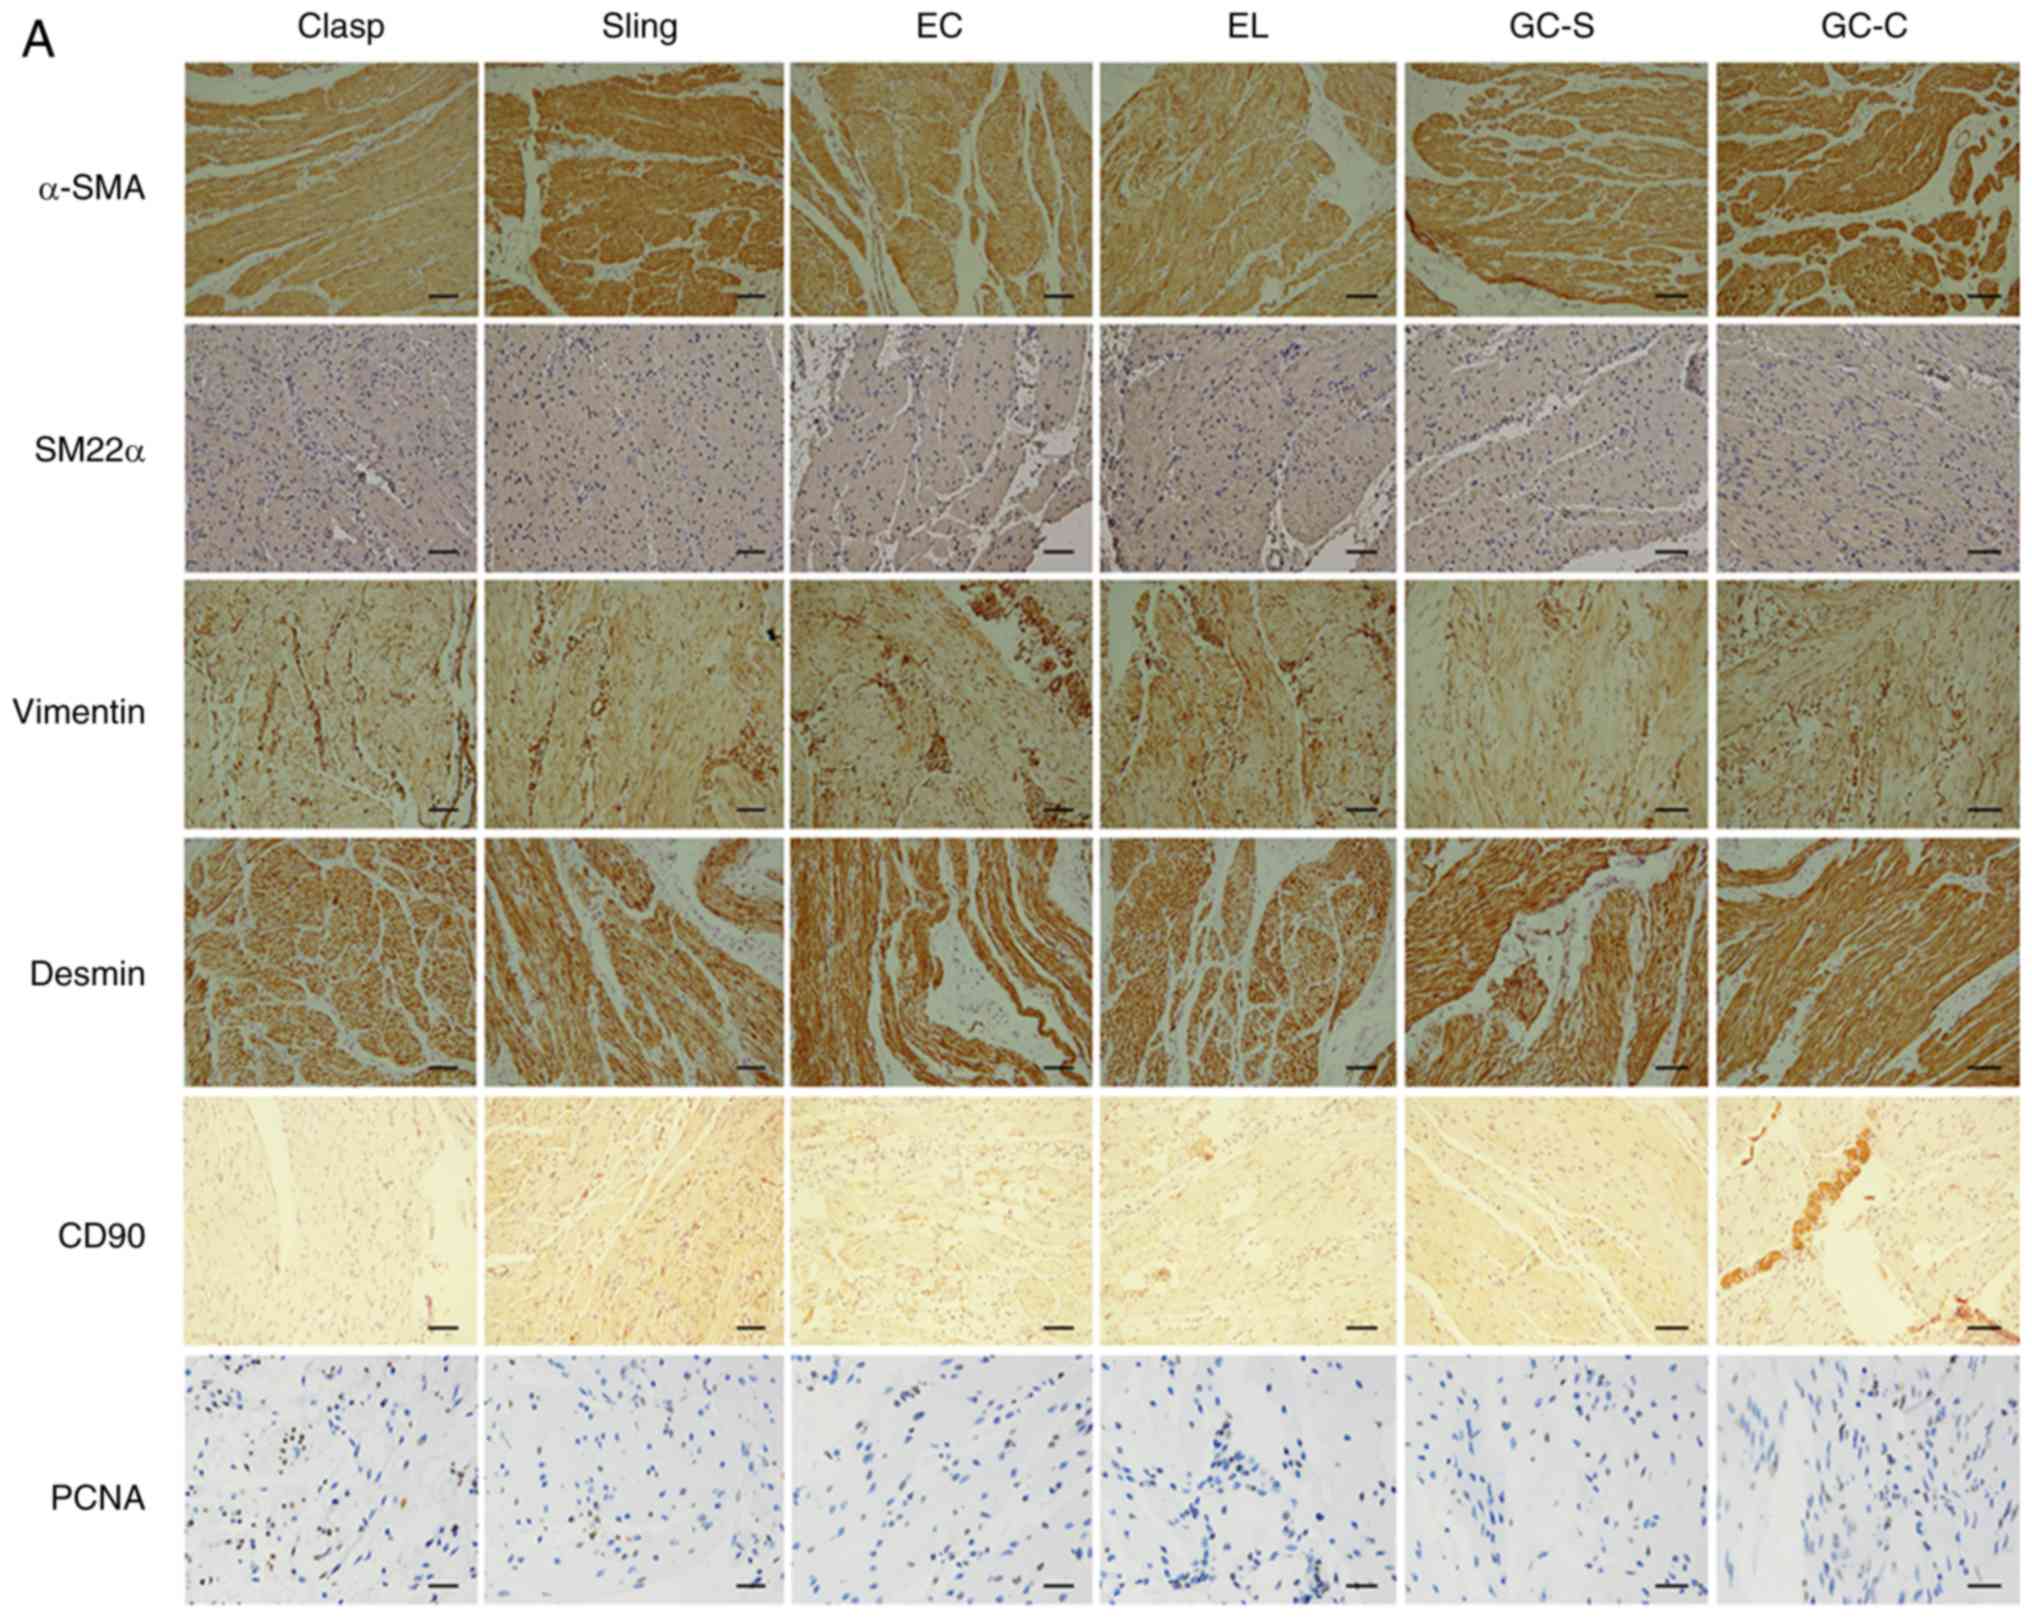
Identification of SMCs
IHC of smooth muscle markers and PCNA in EGJ smooth
muscles was performed. In paraffin sections of six types of EGJ
smooth muscles, positive staining was observed for α-SMA, SM22α,
vimentin, desmin, CD90 and PCNA (Fig.
3A; Table V; n=8). α-SMA,
vimentin and desmin staining was strong or moderate in the
cytoplasm; SM22α staining was moderate or weak in the cytoplasm.
CD90 staining was moderate or weak in cytomembrane and cytoplasm;
PCNA staining was strong or moderate in the nucleus.
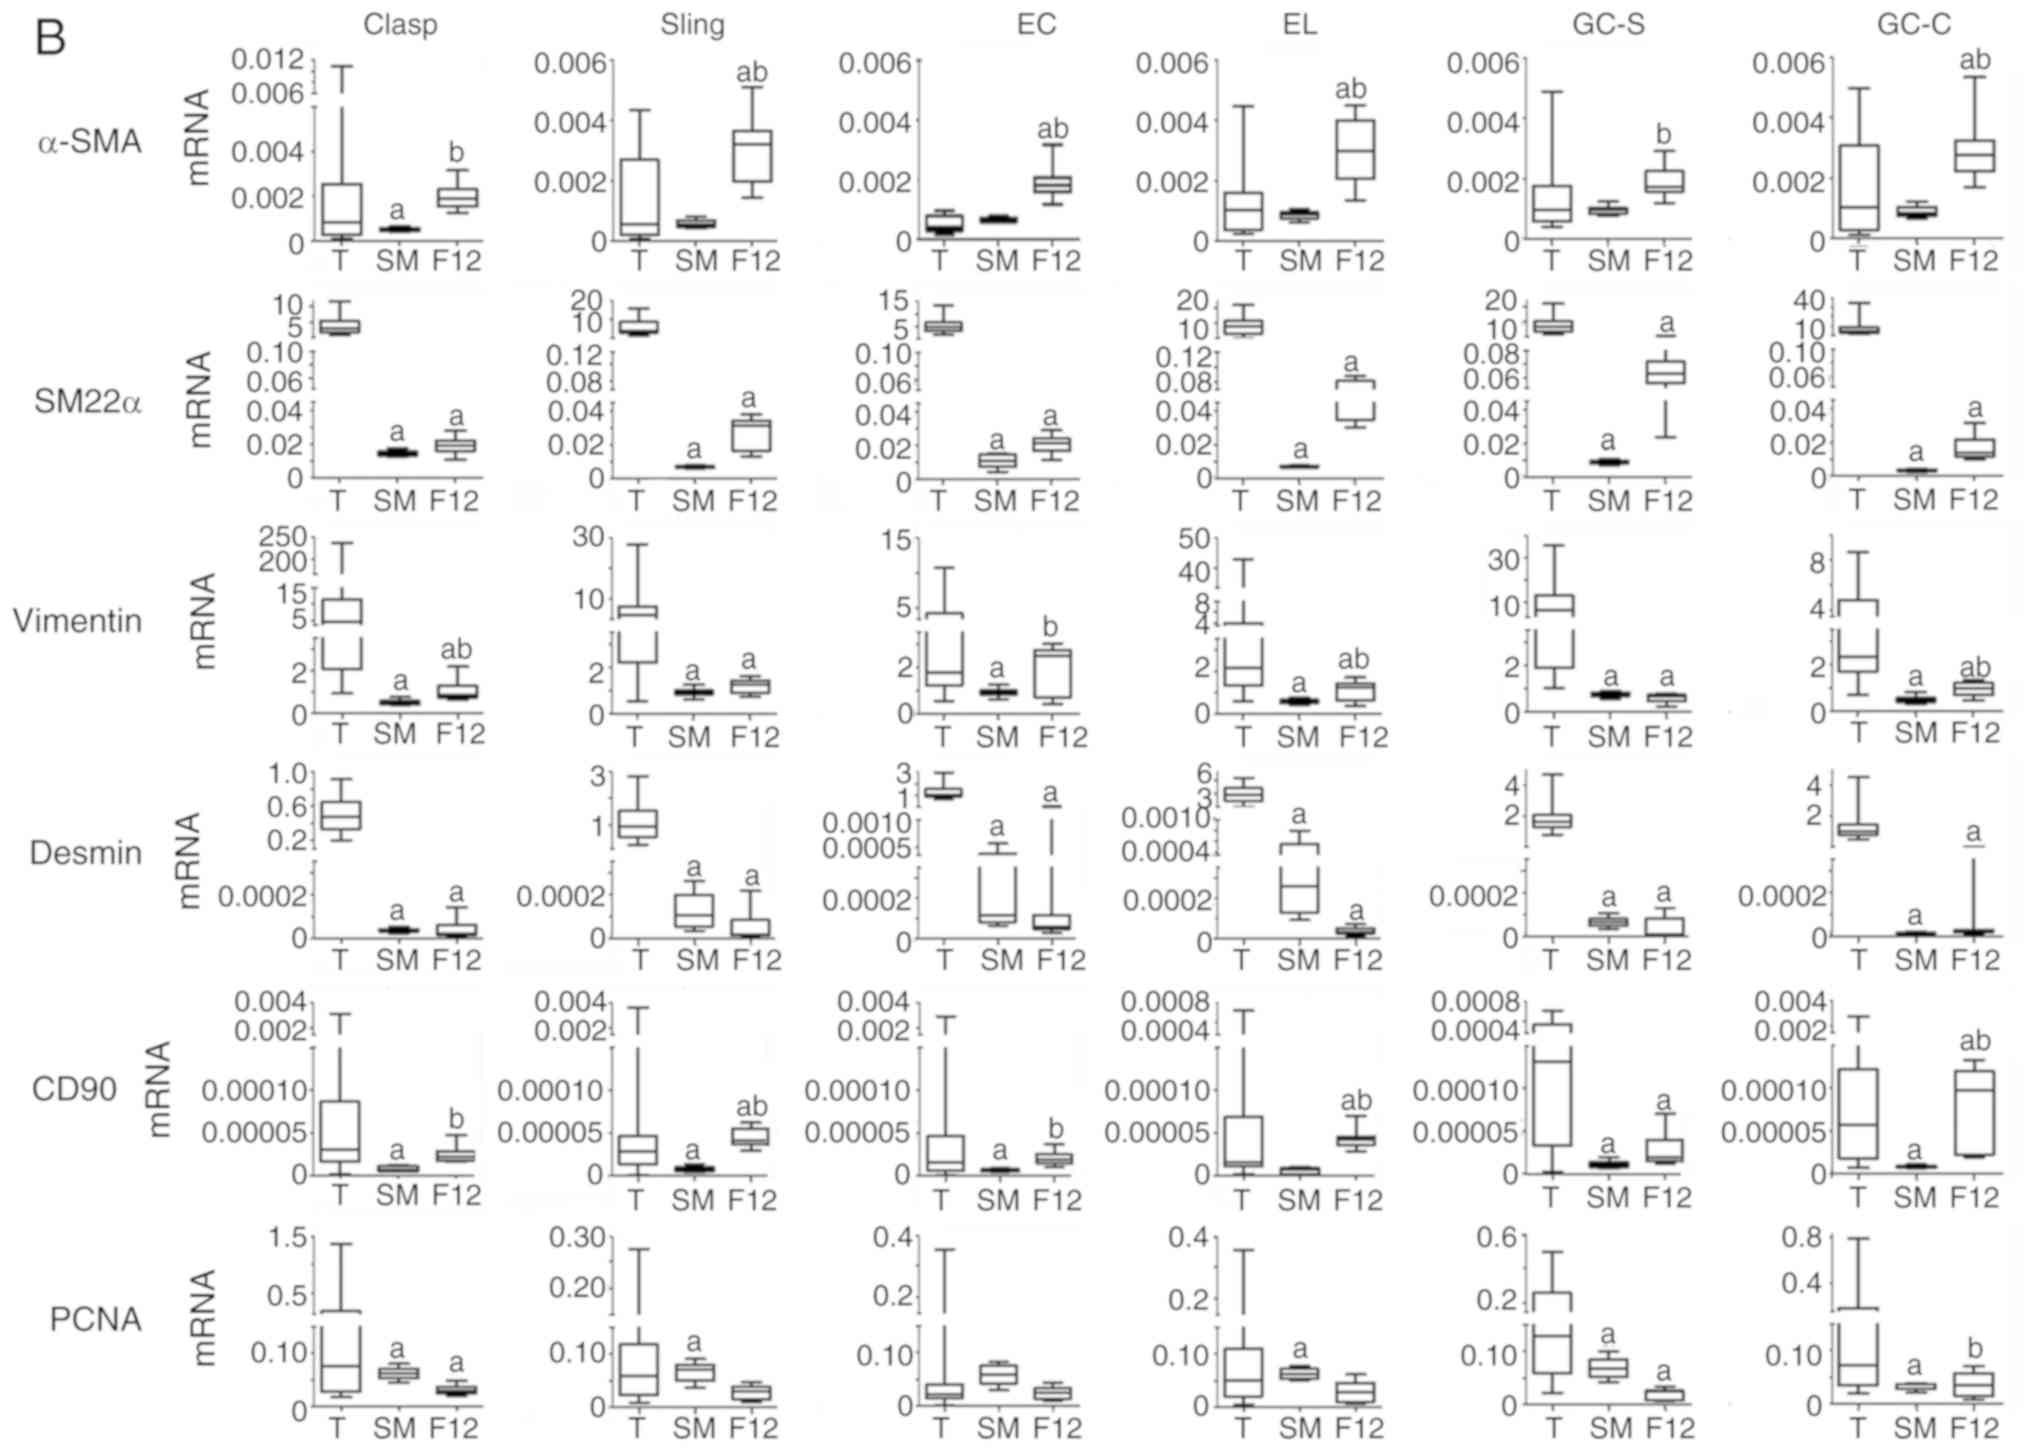
 | Figure 3Expression of smooth muscle markers
and PCNA in human EGJ. (A) Immunohistochemical staining (IHC) of
EGJ smooth muscles using the streptavidin-peroxidase method. n=8.
Experiments were performed in duplicate. Positive expression of
α-SMA, SM22α, vimentin, desmin, CD90 and PCNA was observed in six
types of smooth muscles. Scale bar, 200 µm. α-SMA, vimentin, desmin
were strong or moderate in the cytoplasm (magnification, x200);
however, SM22α was moderate or weak in the cytoplasm
(magnification, x200). CD90 was moderate or weak in the
cytomembrane and cytoplasm (magnification, x200); PCNA was strong
or moderate in part of the nucleus (magnification, x400). In
addition, vimentin and CD90 were stronger in the small vascular
walls of smooth muscles. (B) Relative mRNA expression of smooth
muscle markers and PCNA in EGJ smooth muscle tissues and cells.
n=8. Experiments were performed in triplicate.
aP<0.05 vs. T; bP<0.05 vs. SM. PCNA,
proliferating cell nuclear antigen; EGJ, esophagogastric junction;
Clasp, clasp fiber; Sling, sling fiber; EC, esophageal circular;
EL, esophageal longitudinal; GC-S, gastric circular muscle near
sling in gastric bottom; GC-C, gastric circular muscle near clasp
in lesser gastric curvature; α-SMA, α-smooth muscle actin; SM22α,
smooth muscle 22 α; T, tissue; SM, cells cultured in smooth muscle
cell medium; F12, cells cultured in DMEM/F12 containing 10% newborn
bovine serum. |
| Table VIHC scores of marker staining in
smooth muscles of the esophagogastric junction. |
Table V
IHC scores of marker staining in
smooth muscles of the esophagogastric junction.
| Name | α-SMA | SM22α | Vimentin | Desmin | CD90 | PCNA |
|---|
| Clasp | 10.0 (1.0) | 4.0 (1.0) | 9.0 (1.0) | 11.0 (1.0) | 3.0 (1.1) | 9.0 (1.0) |
| Sling | 10.0 (1.0) | 3.9 (1.0) | 9.2 (1.0) | 11.0 (1.0) | 3.0 (1.0) | 9.0 (1.0) |
| EC | 10.0 (1.0) | 4.0 (1.1) | 9.0 (1.0) | 11.0 (1.0) | 3.1 (1.0) | 9.0 (1.0) |
| EL | 10.0 (1.0) | 3.5 (1.0) | 9.0 (1.0) | 11.0 (1.0) | 3.0 (1.0) | 8.9 (1.0) |
| GC-S | 10.0 (1.0) | 4.0 (1.0) | 8.9 (1.0) | 11.0 (1.0) | 3.0 (1.0) | 9.1 (0.8) |
| GC-C | 10.0 (1.0) | 4.0 (1.0) | 9.0 (1.0) | 11.0 (1.0) | 3.0 (1.0) | 8.9 (1.0) |
mRNA expression of smooth muscle
markers and PCNA
By using automatic plotting of dissolution and
amplification curves in ABI 7500, mRNA of α-SMA, SM22α, vimentin,
desmin, CD90 and PCNA could be detected in EGJ smooth muscles and
cells (Fig. 3B and Table VI; n=8). Each cell type showed
different levels of mRNA expression in different types of medium.
SM22α and desmin mRNA levels in cells were lower than in the
corresponding tissues; however, α-SMA, vimentin, CD90 and PCNA
varied in comparison with the corresponding tissues.
| Table VIRelative mRNA expression of markers
in esophagogastric junction tissues and smooth muscle cells. |
Table VI
Relative mRNA expression of markers
in esophagogastric junction tissues and smooth muscle cells.
| A, Clasp |
|---|
| Source | α-SMA | SM22α | Vimentin | Desmin | CD90 | PCNA |
|---|
| Tissue | 0.000824
(0.00228) | 3.077 (3.535) | 3.204 (7.582) | 0.473 (0.315) | 0.0000305
(0.00007) | 0.075 (0.172) |
| Cell | | | | | | |
|
ED
(SMCM) | 0.00050
(0.00017)a | 0.014900
(0.00258)a | 0.46088
(0.15523)a | 0.00004
(0.00001)a | 0.0000064
(0.00001)a | 0.0314
(0.0474)a |
|
ED
(10%-F12) | 0.00181
(0.00071)b | 0.01904
(0.00640)a | 1.19636
(0.82345)a,b | 0.00002
(0.00001)a | 0.0000267
(0.00001)b | 0.0290
(0.0109)a |
| B, Sling |
| Source | α-SMA | SM22α | Vimentin | Desmin | CD90 | PCNA |
| Tissue | 0.00056
(0.00250) | 3.938 (5.703) | 4.825 (5.512) | 0.933 (0.969) | 0.000028
(0.00003) | 0.0593
(0.0959) |
| Cell |
|
ED
(SMCM) | 0.00055
(0.00022) | 0.00700
(0.00123)a | 0.92093
(0.16985)a | 0.00011
(0.00014)a | 0.0000068
(0.00001)a | 0.0223
(0.0633)a |
|
ED
(10%-F12) | 0.00346
(0.00105)a,b | 0.03349
(0.00433)a | 1.39599
(0.22011)a | 0.000013
(0.00001)a | 0.0000483
(0.00002)a,b | 0.0356
(0.0109) |
| C, EC |
| Source | α-SMA | SM22α | Vimentin | Desmin | CD90 | PCNA |
| Tissue | 0.00042
(0.00050) | 4.724 (3.245) | 1.765 (3.069) | 1.053 (0.608) | 0.000016
(0.00004) | 0.0206
(0.0266) |
| Cell |
|
ED
(SMCM) | 0.00065
(0.00012) | 0.01065
(0.00737)a | 0.499
(0.113)a | 0.00012
(0.00029)a | 0.0000069
(0.00000)a | 0.0222
(0.0476) |
|
ED
(10%-F12) | 0.00197
(0.00081)a,b | 0.02355
(0.00480)a | 2.705
(0.338)b | 0.00005
(0.00006)a | 0.0000152
(0.00001)b | 0.0317
(0.0111) |
| D, EC |
| Source | α-SMA | SM22α | Vimentin | Desmin | CD90 | PCNA |
| Tissue | 0.00102
(0.00124) | 8.140 (8.344) | 2.129 (2.684) | 2.818 (2.872) | 0.000016
(0.00006) | 0.04500
(0.0903) |
| Cell |
|
ED
(SMCM) | 0.00086
(0.00021) | 0.00695
(0.00105)a | 0.573
(0.152)a | 0.00026
(0.00042)a | 0.000007
(0.00001) | 0.0293
(0.0570)a |
|
ED
(10%-F12) | 0.00360
(0.00122)a,b | 0.03652
(0.01286)a | 1.380
(0.211)a,b | 0.00003
(0.00001)a | 0.0000367
(0.00001)a,b | 0.0410
(0.0179) |
| E, GC-S |
| Source | α-SMA | SM22α | Vimentin | Desmin | CD90 | PCNA |
| Tissue | 0.00096
(0.00118) | 6.908 (6.411) | 6.727 (11.390) | 1.604 (0.764) | 0.000132
(0.00030) | 0.1282
(0.1995) |
| Cell |
|
ED
(SMCM) | 0.00095
(0.00019) | 0.00892
(0.00160)a | 0.720
(0.168)a | 0.00007
(0.00003)a | 0.0000111
(0.00001)a | 0.0261
(0.0577)a |
|
ED
(10%-F12) | 0.00162
(0.00029)b | 0.05824
(0.02930)a | 0.707
(0.064)a | 0.00001
(0.00000)a | 0.0000165
(0.00001)a | 0.0254
(0.0031)a |
| F, GC-S |
| Source | α-SMA | SM22α | Vimentin | Desmin | CD90 | PCNA |
| Tissue | 0.00102
(0.00279) | 5.152 (5.385) | 2.329 (3.118) | 0.966 (0.640) | 0.000057
(0.00010) | 0.0729
(0.1452) |
| Cell |
|
ED
(SMCM) | 0.00084
(0.00030) | 0.00353
(0.00095)a | 0.468
(0.182)a | 0.00001
(0.00001)a | 0.0000078
(0.00000)a | 0.0122
(0.0327)a |
|
ED
(10%-F12) | 0.00286
(0.00064)a,b | 0.01555
(0.00970)a | 1.124
(0.249)a,b | 0.00002
(0.00001)a | 0.0001159
(0.00002)a,b | 0.0482
(0.0279)b |
Immunofluorescence of smooth muscle
markers and PCNA
Immunofluorescence observation was performed in
cells obtained by ED (SMCS) (n=9). The same target was identified
at different wavelengths because primary antibodies were from
different species. Positive expression of α-SMA, SM22α, vimentin,
CD90 and PCNA was observed in cells; desmin was weak or negative
(Fig. 4). GAPDH and PCNA could be
detected in the cytoplasm and nucleus.
 | Figure 4Immunofluorescence (IF) of smooth
muscle markers and PCNA for esophagogastric junction cells cultured
in vitro by cells obtained by enzymatic dispersion and
cultured in SMCM. The third generation of cells cultured in SMCM
were tested. n=9. Experiments were performed in triplicate. Scale
bar, 150 µm. Primary antibodies were premixed in 2% BSA-PBS. α-SMA,
SM22α, Vim, CD90 and PCNA were positive in cells; Des was weak or
not visible. Theoretically, CD90 and PCNA are expressed in the cell
membrane and nucleus, respectively. However, due to
permeabilization of cells with 0.3% (v/v) Triton X-100 in this
experiment, primary antibodies entered cells and resulted in
fluorescence of relative proteins, including proteins that were
being synthesized and were within functional structures. PCNA,
proliferating cell nuclear antigen; SMCM, smooth muscle cell
medium; Vim, vimentin; Des, Desmin; α-SMA, α-smooth muscle actin;
SM22α, smooth muscle 22 α; Clasp, clasp fiber; Sling, sling fiber;
EC, esophageal circular; EL, esophageal longitudinal; GC-S, gastric
circular muscle near sling in gastric bottom; GC-C, gastric
circular muscle near clasp in lesser gastric curvature. |
Protein expression of smooth muscle
markers and PCNA
Expression of α-SMA, SM22α, vimentin, desmin, CD90
and PCNA in cells obtained by ED could be detected by the in-cell
western assay (Fig. 5 and Table VII; n=8). Relative expression of
α-SMA, SM22α and vimentin in cells obtained by ED (10%-F12)
appeared greater than that of ED (SMCM); only EC, EL, GC-S and GC-C
demonstrated statistical differences in SM22α and vimentin. CD90
expression in cells obtained by ED (SMCM) was greater than in ED
(10%-F12). The relative expression of desmin was low in cells.
There was no statistical difference in PCNA between ED (SMCM) and
ED (10%-F12) cells. Trends of relative mRNA and corresponding
protein expression in cells were similar, with the exception of
CD90, where. CD90 protein in ED (10%-F12) cells was markedly lower
compared with in ED (SMCM. This is, in contrast to mRNA expression
trends observed.
 | Figure 5Comparison of fluorescence intensity
of smooth muscle markers and PCNA in cultured cells obtained by the
ED method. n=8. Experiments were performed in triplicate. Cells
were fixed with 4% paraformaldehyde and permeabilized with 0.3%
(v/v) Triton X-100. After being blocked with 5% BSA-PBS, cells were
incubated with primary antibodies and anti-GAPDH, premixed in 2%
BSA-PBS (12 h at 4˚C). Concentrations are presented in the
immunofluorescence method. α-SMA, SM22α, vimentin, desmin, CD90 and
PCNA in cells obtained by ED could be detected with different
fluorescence intensities. Smooth muscle markers and PCNA of each
cell showed different levels of expression, according to culture
conditions. PCNA, proliferating cell nuclear antigen; ED, enzymatic
dispersion; ED (SMCM), cells obtained by enzymatic dispersion were
cultured in smooth muscle cell medium; ED (10%-F12), cells obtained
by enzymatic dispersion were cultured in DMEM/F-12 containing 10%
newborn bovine serum; α-SMA, α-smooth muscle actin; SM22α, smooth
muscle 22 α; G, GAPDH; Clasp, clasp fiber; Sling, sling fiber; EC,
esophageal circular; EL, esophageal longitudinal; GC-S, gastric
circular muscle near sling in gastric bottom; GC-C, gastric
circular muscle near clasp in lesser gastric curvature. |
| Table VIIRelative protein expression of
markers in esophagogastric junction smooth muscle cells. |
Table VII
Relative protein expression of
markers in esophagogastric junction smooth muscle cells.
| Type of smooth
muscle | α-SMA | SM22α | Vimentin | Desmin | CD90 | PCNA |
|---|
| Clasp |
|
ED
(SMCM) | 37.000 (4.375) | 15.140
(11.228) | 27.876 (1.986) | 0.00175
(0.00066) | 0.11362
(0.03272) | 0.04525
(0.04733) |
|
ED
(10%-F12) | 40.699
(25.841) | 23.852
(17.236) | 37.770
(15.488) | 0.00207
(0.00134) | 0.06356
(0.03170)a | 0.05118
(0.02452) |
| Sling |
|
ED
(SMCM) | 35.713 (6.858) | 10.022 (3.511) | 25.994 (4.362) | 0.00234
(0.00066) | 0.08551
(0.01736) | 0.04403
(0.07275) |
|
ED
(10%-F12) | 38.447
(21.421) | 17.480 (9.104) | 36.593
(13.882) | 0.00258
(0.00076) | 0.06175
(0.02244)a | 0.05098
(0.04063) |
| EC |
|
ED
(SMCM) | 34.395 (6.574) | 9.322 (2.839) | 21.681 (9.534) | 0.00262
(0.00224) | 0.06843
(0.00670) | 0.03754
(0.08745) |
|
ED
(10%-F12) | 39.542
(20.961) | 19.120
(10.280)a | 33.683
(8.832)a | 0.00289
(0.00183) | 0.04021
(0.00240)a | 0.04864
(0.03670) |
| EL |
|
ED
(SMCM) | 23.304 (4.000) | 5.946 (0.415) | 19.852 (1.617) | 0.00258
(0.00159) | 0.05307
(0.00402) | 0.03663
(0.08016) |
|
ED
(10%-F12) | 44.325
(26.013) | 18.846
(10.047)a | 45.106
(24.629)a | 0.00258
(0.00222) | 0.03693
(0.00299)a | 0.04777
(0.03670) |
| GC-S |
|
ED
(SMCM) | 21.127 (1.531) | 7.551 (1.337) | 12.721 (1.591) | 0.00283
(0.00254) | 0.09068
(0.00358) | 0.05025
(0.07072) |
|
ED
(10%-F12) | 32.608
(15.484) | 13.038
(11.419)a | 32.100 (9.745)
a | 0.00239
(0.00249) | 0.04263
(0.00989)a | 0.06175
(0.03624) |
| GC-C |
|
ED
(SMCM) | 20.178 (1.371) | 4.372 (2.899) | 15.866 (5.203) | 0.00195
(0.00091) | 0.05973
(0.00890) | 0.04287
(0.02947) |
|
ED
(10%-F12) | 33.976
(17.941) | 18.409
(8.091)a | 31.452
(11.938)a | 0.00208
(0.00040) | 0.03722
(0.00680)a | 0.04787
(0.03881) |
Discussion
It was previously identified that SMCs are not
terminally differentiated cells [from a previous studyof vascular
SMCs (VSMCs) (32)]; synthetic
(secretory) and contractile SMCs have been demonstrated to be in a
dynamic balance (17). ED and
explant culture methods are widely used in SMC culture in
vitro, but cells from ED represent the entire breadth of SMC
phenotypes. Therefore, many relative experimental projects can be
performed with superior representativeness; moreover, the time for
acquisition of cells in ED is shorter than in the explant culture
method (24 h vs. 2-3 weeks) (1).
These details are not clear in SMC culture in vitro obtained
from the digestive tract, although previous studies have used ED or
explant culture with tissue blocks (4,5,7-9,33).
Previous studies on motor function of smooth muscles in EGJ have
revealed critical factors for physiology and pathophysiology of
PEMDs and GERD (7,12,34).
Effective isolation methods of primary SMCs and growth
characteristics of cultured SMCs should be recorded in detail so
that follow-up studies can be performed to resolve current
difficulties. The present study is part of research on signal
transduction in esophageal smooth muscles of achalasia. On the
basis of the present study, follow-up function and model
experiments can be carried out (34).
In previous studies of SMCs obtained by ED,
investigators typically used two or more types of enzymes,
including collagenase type I (9),
type II (3,8,11,13),
type V (10), type VIII (35) and type XI (7), co-digested with elastase (9,13),
papain (10,13), deoxyribonuclease I (8,11),
dispase (7,9) or trypsin inhibitor (Soybean) (19,36) in
one or two steps. The temperature used was typically 37˚C because
it was the optimum temperature for enzyme activity. Collagenase II
is one of the most commonly used enzymes for isolation of primary
SMCs, and immersion of tissue fragments directly in collagenase II
solution constitutes the most common isolation method. Detailed
usage of collagenase II in primary cell isolation was the main
objective of the present study.
In the present study, collagenase II and
Trypsin/EDTA were selected, as they are commonly used in cell
culture, to determine a simple and effective isolation method.
There were six groups: 0.5-EI-4 and 1-EI-4 were the experimental
groups in which the new isolation methods were used, and 1-C-37 and
0.5-C-4 were the groups in which traditional ED were used; the
0.25-T-37 and 0.125-T-4 groups were included to test whether
Trypsin/EDTA could also be used for effective isolation of SMCs.
The present results demonstrated that adherent cells could be
obtained by different ED methods, but the time required for FPD
differed among these methods. The most effective method was EI with
low collagenase II concentration (0.5 mg/ml) combined with a low
temperature (4˚C) for 14-24 h. Collagenase is mainly used to
hydrolyze collagen protein in connective tissue. In practice, a
high concentration of collagenase, extended digestion time, or
digestion at 37˚C could lead to prolonged FPD in a single enzyme
process, likely due to damage of cellular structures. This
combination of low enzyme concentration with low temperature for an
extended digestion time reduced enzyme damage to cells.
Furthermore, Trypsin/EDTA could also be used for SMC isolation.
Trypsin/EDTA is one of the most commonly used and inexpensive
reagents in cell culture. Notably, Trypsin/EDTA is not a
conventional enzyme for isolating primary SMCs (37,38). The
Trypsin/EDTA group was included in the present study to demonstrate
that Trypsin/EDTA could be used as a tool for isolation of SMCs, in
order to increase the choices available for a variety of
experimental conditions. There are many alternative digestive
enzymes for isolation of SMCs, and many potential combinations for
experimental grouping designs. The Trypsin/EDTA method yielded
fewer adherent cells with slower rates of cell growth and passage;
thus, a group that used Trypsin/EDTA with the injection method was
not included.
SMCM is mainly comprised DMEM containing 10% FBS
(7,11,39) with
P/S (11,39). RPMI 1640(13) and SMCM (14,35,40) can
also be used. In the present study, primary cells were cultured in
DMEM/F12 containing 10% NBS (10%-F12) and patented SMCM; similar
morphological features of EGJ cells were observed in a previous
study for VSMCs in vitro (1).
Cells obtained by ED were not uniform with spindle-, long-spindle,
rod-like, or besom-like shapes; however, they exhibited ‘hills and
valleys’ growth. The CCK-8 assay identified a typical ‘S’ curve for
proliferation in SMCM, but a lack of proliferation in 10%-F12. The
patented SMCM contains 2% FBS, 1% SMC growth supplement and 1% P/S.
Media lacking growth factors is not able to promote human cell
growth and proliferation in vitro. The content of SMC growth
supplement is not disclosed because it is a patented formula. This
is the most widely used available medium for SMCs in laboratories
(17); many researchers use it
because it can effectively promote the growth and proliferation of
SMCs, and delay cell differentiation during short-term cell culture
experiments. EGJ SMCs cultured in 10%-F12 showed a marked decrease
in cell number after digestion and passage, and nearly all were
deformed after 2-4 passages, regardless of exchanging NBS with FBS.
Growth factors in bovine serum were insufficient to stimulate the
growth and proliferation of human EGJ SMCs in vitro. The
main cause for the differences in proliferation between cells grown
in the two types of media may be due to their compositions, but the
specific factor has not been investigated. Therefore, SMCM is
appropriate for use in expanding the cell population, consistent
with a previous study by Patel et al (17).
Tissues derived from older donors were observed to
not be as conducive to SMC isolation and primary culture, compared
with tissues derived from younger donors. Similar results were
observed in human arterial SMCs (41) and rat myocardial SMCs (42) cultured in vitro; the growth
and proliferative ability of SMCs was inversely proportional to
donor age. This might be due to the advanced donor age (>60
years) and a greater degree of differentiation of human tissues in
the present study.
Specific markers of SMC subsets in vitro
remain unclear (1,13); thus, it is difficult to distinguish
contractile and synthetic phenotypes, or to distinguish among other
phenotypes of cells from smooth muscles. In the present study,
α-SMA and SM22α were selected to identify tissues and cells, along
with vimentin, desmin and CD90. α-SMA and SM22α are common specific
markers in SMC studies (13-15).
Results of IHC, RT-qPCR, immunofluorescence and the in-cell western
assay demonstrated that these markers were present in SMCs.
Combined with the aforementioned morphological features described,
the majority of cells obtained by EI were SMCs. mRNA expression of
these markers in cells differed from the expression in
corresponding tissues, especially for α-SMA, SM22α, desmin and
CD90. A previous study identified that esophageal SMCs cultured
in vitro had decreased α-SMA expression, whereas desmin and
vimentin expression levels were increased based on the magnitude of
strain (43). These smooth muscle
markers (α-SMA, desmin and vimentin) may be involved in the
regulation of smooth muscle movement, and SMCs in vitro may
have lost motility, such that the conversion from contractile to
synthetic phenotypes could be triggered in vitro. The
mechanisms underlying these differences in expression have not been
studied in the present study. The expression and regulation of the
corresponding biomarkers in smooth muscles or SMCs cultured in
vitro, and their relationships with cell phenotypic
transformation require further study. To further identify SMCs,
PCNA (20-22)
was used to detect the proliferation potential. PCNA is mainly
synthesized and stored in the nucleus, and participates in the
synthesis of DNA (20-22).
When comparing the PCNA mRNA, not all SMCs cultured in vitro
demonstrated greater expression than that of corresponding tissues;
moreover, mRNA and protein expression trends differed in cultured
cells. According to the results of the CCK-8 assay, SMCs cultured
in 10%-F12 exhibited poor proliferation; thus, the inconsistency of
PCNA might be attributed to modified protein synthesis in the ED
(10%-F12) condition.
The cell types in smooth muscles include SMCs
(4), myofibroblasts (7,12,44),
fibroblasts (45), telocytes
(32) and gastrointestinal Cajal
interstitial cells (4,46). A limitation of the present study was
the purification and differentiation of SMCs in vitro. The
problems involved in primary isolation and culture of SMCs with
respect to the purity of cells, which are often discussed by
researchers, were assessed. Furthermore, the main cells involved in
the present study were SMCs. The primary cell specimens must be
smooth muscle tissue, and it was ensured that there were no cells
from other tissue sources present. Patented SMCM was selected to
ensure that the in vitro culture process was more conducive
to the growth and proliferation of SMCs. Smooth muscle specimens
and cells should be identified by several smooth muscle markers in
order to clarify the expression level and characteristics of cell
markers in vitro. Also, the present study could not
guarantee that all the obtained cells were SMCs; to the best of the
authors' knowledge, there is no precise method of identification
and purification of SMCs. Previous studies summarize various
methods for primary cell culture (1-3,15).
Other studies have used these methods for isolation and culture of
primary cells (4,5,7-9,33);
however, the mechanisms of primary cell differentiation remain
unclear. To the best of the authors' knowledge, the only effective
approach for cell differentiation is to use primary cells as soon
as possible. Previous studies have focused on the mechanisms by
which SMCs differentiate in conditions of vascular pathophysiology
(47,48). At present, to the best of the
authors' knowledge, there is not a detailed investigation of the
mechanisms by which esophageal SMCs differentiate into fibroblasts
in vitro; therefore, these complex mechanisms require
further investigation.
In conclusion, SMCs of EGJ could be cultured in
vitro. In the present study, the most effective isolation
method of primary cells was EI with low collagenase II
concentration (0.5 mg/ml) combined with low temperature (4˚C) for
14-24 h; SMCs of EC, EL, GC-S and GC-C cultured in 10%-F12
exhibited superior smooth muscle phenotypes compared with SMCs
cultured in SMCM in terms of smooth muscle marker expression.
Further studies should be performed regarding SMC phenotype
transformation in vivo and in vitro, in addition to
studies regarding motor function of smooth muscles in EGJ.
Acknowledgements
The authors would like to thank Dr Ryan
Chastain-Gross, (a postdoctoral researcher in Urology at the
University of Florida), for editing the English text of a draft of
this manuscript.
Funding
No funding was received.
Availability of data and materials
All data generated or analyzed during this study are
included in this published article.
Authors' contributions
JFL designed the study. YG performed experiments,
collated data and drafted manuscript. CZ, LL and SLZ proposed
improvements of the experiments, performed primary cell culture and
revised the manuscript. YPL and LMZ interpreted the results of
hematoxylin-eosin staining and immunohistochemistry experiments.
All authors read and approved the final manuscript.
Ethics approval and consent to
participate
The present study was approved by The Medical Ethics
Committee of The Fourth Hospital of Hebei Medical University.
Informed consent was obtained from all patients or their authorized
relatives.
Patient consent for publication
Not applicable.
Competing interests
The authors declare that they have no competing
interests.
References
|
1
|
Proudfoot D and Shanahan C: Human vascular
smooth muscle cell culture. Methods Mol Biol. 806:251–264.
2012.PubMed/NCBI View Article : Google Scholar
|
|
2
|
Metz RP, Patterson JL and Wilson E:
Vascular smooth muscle cells: Isolation, culture, and
characterization. Methods Mol Biol. 843:169–176. 2012.PubMed/NCBI View Article : Google Scholar
|
|
3
|
Villa-Bellosta R and Hamczyk MR: Isolation
and culture of aortic smooth muscle cells and in vitro
calcification assay. Methods Mol Biol. 1339:119–130.
2015.PubMed/NCBI View Article : Google Scholar
|
|
4
|
Wallace AS and Burns AJ: Development of
the enteric nervous system, smooth muscle and interstitial cells of
Cajal in the human gastrointestinal tract. Cell Tissue Res.
319:367–382. 2005.PubMed/NCBI View Article : Google Scholar
|
|
5
|
Wang J, Laurier LG, Sims SM and
Preiksaitis HG: Enhanced capacitative calcium entry and TRPC
channel gene expression in human LES smooth muscle. Am J Physiol
Gastrointest Liver Physiol. 284:G1074–G1083. 2003.PubMed/NCBI View Article : Google Scholar
|
|
6
|
Deshpande MA, Wang J, Preiksaitis HG,
Laurier LG and Sims SM: Characterization of a voltage-dependent
Na(+) current in human esophageal smooth muscle. Am J Physiol Cell
Physiol. 283:C1045–C1055. 2002.PubMed/NCBI View Article : Google Scholar
|
|
7
|
Gargus M, Niu C and Shaker A: Isolation of
myofibroblasts from mouse and human esophagus. J Vis Exp.
52215:2015.PubMed/NCBI View
Article : Google Scholar
|
|
8
|
Chen X, Zheng Y, Manole CG, Wang X and
Wang Q: Telocytes in human oesophagus. J Cell Mol Med.
17:1506–1512. 2013.PubMed/NCBI View Article : Google Scholar
|
|
9
|
Zhu Y and Chan-Park MB: Density
quantification of collagen grafted on biodegradable polyester: Its
application to esophageal smooth muscle cell. Anal Biochem.
363:119–127. 2007.PubMed/NCBI View Article : Google Scholar
|
|
10
|
Bautista-Cruz F, Nair DG, Lourenssen S,
Miller DV, Blennerhassett MG and Paterson WG: Impaired
platelet-derived growth factor receptor expression and function in
cultured lower esophageal sphincter circular smooth muscle cells
from W/W(v) mutant mice. Can J Physiol Pharmacol. 92:34–41.
2014.PubMed/NCBI View Article : Google Scholar
|
|
11
|
Rieder F, Cheng L, Harnett KM, Chak A,
Cooper GS, Isenberg G, Ray M, Katz JA, Catanzaro A, O'Shea R, et
al: Gastroesophageal reflux disease-associated esophagitis induces
endogenous cytokine production leading tomotor abnormalities.
Gastroenterology. 132:154–165. 2007.PubMed/NCBI View Article : Google Scholar
|
|
12
|
Niu C, Chauhan U, Gargus M and Shaker A:
Generation and characterization of an immortalized human esophageal
myofibroblast line. PLoS One. 11(e0153185)2016.PubMed/NCBI View Article : Google Scholar
|
|
13
|
Huber A and Badylak SF: Phenotypic changes
in cultured smooth muscle cells: Limitation or opportunity for
tissue engineering of hollow organs? J Tissue Eng Regen Med.
6:505–511. 2012.PubMed/NCBI View
Article : Google Scholar
|
|
14
|
Franck D, Chung YG, Coburn J, Kaplan DL,
Estrada CR Jr and Mauney JR: In vitro evaluation of bi-layer silk
fibroin scaffolds for gastrointestinal tissue engineering. J Tissue
Eng. 5(2041731414556849)2014.PubMed/NCBI View Article : Google Scholar
|
|
15
|
Aji K, Maimaijiang M, Aimaiti A, Rexiati
M, Azhati B, Tusong H and Cui L: Differentiation of human adipose
derived stem cells into smooth muscle cells is modulated by
CaMKIIγ. Stem Cells Int. 2016(1267480)2016.PubMed/NCBI View Article : Google Scholar
|
|
16
|
Yamamura H, Masuda H, Ikeda W, Tokuyama T,
Takagi M, Shibata N, Tatsuta M and Takahashi K: Structure and
expression of the human SM22alpha gene, assignment of the gene to
chromosome11, and repression of the promoter activity by cytosine
DNA methylation. J Biochem. 122:157–167. 1997.PubMed/NCBI View Article : Google Scholar
|
|
17
|
Patel JJ, Srivastava S and Siow RC:
Isolation, culture, and characterization of vascular smooth muscle
cells. Methods Mol Biol. 1430:91–105. 2016.PubMed/NCBI View Article : Google Scholar
|
|
18
|
Peng G, Xu J, Liu R, Fu Z, Li S, Hong W,
Chen J, Li B and Ran P: Isolation, culture and identification of
pulmonary arterial smooth muscle cells from rat distal pulmonary
arteries. Cytotechnology. 69:831–840. 2017.PubMed/NCBI View Article : Google Scholar
|
|
19
|
Liu JF, Sun J and Drew PA:
Characterization of excitatory and inhibitory motor neurons to the
human gastric clasp and sling fibers. Can J Physiol Pharmacol.
89:617–622. 2011.PubMed/NCBI View Article : Google Scholar
|
|
20
|
Juríková M, Danihel Ľ, Polák Š and Varga
I: Ki67, PCNA, and MCM proteins: Markers of proliferation in the
diagnosis of breast cancer. Acta Histochem. 118:544–552.
2016.PubMed/NCBI View Article : Google Scholar
|
|
21
|
Anggorowati N, Ratna Kurniasari Ch,
Damayanti K, Cahyanti T, Widodo I, Ghozali A, Romi MM, Sari DC and
Arfian N: Histochemical and immunohistochemical study of α-SMA,
collagen, and PCNA in epithelial ovarian neoplasm. Asian Pac J
Cancer Prev. 18:667–671. 2017.PubMed/NCBI View Article : Google Scholar
|
|
22
|
Goodlad RA: Quantification of epithelial
cell proliferation, cell dynamics, and cell kinetics in vivo. Wiley
Interdiscip Rev Dev Biol. 6(e274)2017.PubMed/NCBI View Article : Google Scholar
|
|
23
|
Soslow RA, Dannenberg AJ, Rush D, Woerner
BM, Khan KN, Masferrer J and Koki AT: Cox-2 is expressed in human
pulmonary, colonic, and mammary tumors. Cancer. 89:2637–2645.
2000.PubMed/NCBI View Article : Google Scholar
|
|
24
|
Schmittgen TD and Livak KJ: Analyzing
real-time PCR data by the comparative C(T) method. Nat Protoc.
3:1101–1108. 2008.PubMed/NCBI View Article : Google Scholar
|
|
25
|
Czarny P, Wigner P, Strycharz J, Swiderska
E, Synowiec E, Szatkowska M, Sliwinska A, Talarowska M, Szemraj J,
Su KP, et al: Mitochondrial DNA copy number, damage, repair and
degradation in depressive disorder. World J Biol Psychiatry.
13:1–11. 2019.PubMed/NCBI View Article : Google Scholar
|
|
26
|
Jia QW, Chen ZH, Ding XQ, Liu JY, Ge PC,
An FH, Li LH, Wang LS, Ma WZ, Yang ZJ and Jia EZ: Predictive
effects of circulating miR-221, miR-130a and miR-155 for coronary
heart disease: A multi-ethnic study in China. Cell Physiol Biochem.
42:808–823. 2017.PubMed/NCBI View Article : Google Scholar
|
|
27
|
Henrich CJ: Microplate-based
nonradioactive protein synthesis assay: Application to TRAIL
sensitization by protein synthesis inhibitors. PLoS One.
11(e0165192)2016.PubMed/NCBI View Article : Google Scholar
|
|
28
|
Williamson DF, Parker RA and Kendrick JS:
The box plot: A simple visual method to interpret data. Ann Intern
Med. 110:916–921. 1989.PubMed/NCBI View Article : Google Scholar
|
|
29
|
Bulluck H, Fröhlich GM, Nicholas JM,
Mohdnazri S, Gamma R, Davies J, Sirker A, Mathur A, Blackman D,
Garg P, et al: Mineralocorticoid receptor antagonist pre-treatment
and early post-treatment to minimize reperfusion injury after
ST-elevation myocardial infarction: The MINIMIZE STEMI trial. Am
Heart J. 211:60–67. 2019.PubMed/NCBI View Article : Google Scholar
|
|
30
|
Xue Y, Qian H, Hu J, Zhou B, Zhou Y, Hu X,
Karakhanyan A, Pang Z and Fu XD: Sequential regulatory loops as key
gatekeepers for neuronal reprogramming in human cells. Nat
Neurosci. 19:807–815. 2016.PubMed/NCBI View Article : Google Scholar
|
|
31
|
Liu W and Lin HS: Application of SPSS in
multiple comparison Nemenyi rank sum test for multiple samples with
completely randomized designs. Chin J Health Statistics.
26:214–216. 2009.(In Chinese).
|
|
32
|
Xie C, Ritchie RP, Huang H, Zhang J and
Chen YE: Smooth muscle cell differentiation in vitro: Models and
underlying molecular mechanisms. Arterioscler Thromb Vasc Biol.
31:1485–1494. 2011.PubMed/NCBI View Article : Google Scholar
|
|
33
|
Hayashi K, Ando N, Ozawa S, Kitagawa Y,
Miki H, Sato M and Kitajima M: A neo-esophagus reconstructed by
cultured human esophageal epithelial cells, smooth musclecells,
fibroblasts, and collagen. ASAIO J. 50:261–266. 2004.PubMed/NCBI View Article : Google Scholar
|
|
34
|
Gao Y, Liu JF, He X, Liu XB, Zhang LL,
Zhao LM and Zhang C: Calcium receptor and nitric oxide synthase
expression in circular muscle of lower esophagus from patients with
achalasia. Chin Med J (Engl). 131:2882–2885. 2018.PubMed/NCBI View Article : Google Scholar
|
|
35
|
Beppu LY, Anilkumar AA, Newbury RO, Dohil
R, Broide DH and Aceves SS: TGF-β1-induced phospholamban expression
alters esophageal smooth muscle cell contraction in patients with
eosinophilic esophagitis. J Allergy Clin Immunol. 134:1100–1107.
2014.PubMed/NCBI View Article : Google Scholar
|
|
36
|
Muir AB, Dods K, Henry SJ, Benitez AJ, Lee
D, Whelan KA, De Marshall M, Hammer DA, Falk G, Wells RG, et al:
Eosinophilic esophagitis-associated chemical and mechanical
microenvironment shapes esophageal fibroblast behavior. J Pediatr
Gastroenterol Nutr. 63:200–209. 2016.PubMed/NCBI View Article : Google Scholar
|
|
37
|
Ryan US: Isolation and culture of
pulmonary endothelial cells. Environ Health Perspect. 56:103–114.
1984.PubMed/NCBI View Article : Google Scholar
|
|
38
|
Lou JN, Mili N, Decrind C, Donati Y,
Kossodo S, Spiliopoulos A, Ricou B, Suter PM, Morel DR, Morel P and
Grau GE: An improved method for isolation of microvascular
endothelial cells from normal and inflamed human lung. In Vitro
Cell Dev Biol Anim. 34:529–536. 1998.PubMed/NCBI View Article : Google Scholar
|
|
39
|
Woo JG, Park SY, Lim JC, Joo MJ, Kim HR
and Sohn UD: Acid-induced COX-2 expression and prostaglandin E2
production via activation of ERK1/2 and p38 MAPK in cultured feline
esophageal smooth muscle cells. Arch Pharm Res. 34:2131–2140.
2011.PubMed/NCBI View Article : Google Scholar
|
|
40
|
Jensen T, Blanchette A, Vadasz S, Dave A,
Canfarotta M, Sayej WN and Finck C: Biomimetic and synthetic
esophageal tissue engineering. Biomaterials. 57:133–141.
2015.PubMed/NCBI View Article : Google Scholar
|
|
41
|
Grünwald J, Mey J, Schönleben W, Hauss J
and Hauss WH: Cultivated human arterial smooth muscle cells. The
effect of donor age, blood pressure, diabetes and smoking on in
vitro cell growth. Pathol Biol (Paris). 31:819–823. 1983.PubMed/NCBI
|
|
42
|
Zhang H, Fazel S, Tian H, Mickle DA,
Weisel RD, Fujii T and Li RK: Increasing donor age adversely
impacts beneficial effects of bone marrow but not smooth muscle
myocardial cell therapy. Am J Physiol Heart Circ Physiol.
289:H2089–H2096. 2005.PubMed/NCBI View Article : Google Scholar
|
|
43
|
Ritchie AC, Wijaya S, Ong WF, Zhong SP and
Chian KS: Dependence of alignment direction on magnitude of strain
in esophageal smooth muscle cells. Biotechnol Bioeng.
102:1703–1711. 2009.PubMed/NCBI View Article : Google Scholar
|
|
44
|
El Mourabit H, Loeuillard E, Lemoinne S,
Cadoret A and Housset C: Culture model of rat portal
myofibroblasts. Front Physiol. 7(120)2016.PubMed/NCBI View Article : Google Scholar
|
|
45
|
Sinzger C, Grefte A, Plachter B, Gouw AS,
The TH and Jahn G: Fibroblasts, epithelial cells, endothelial cells
and smooth muscle cells are major targets of human cytomegalovirus
infection in lung and gastrointestinal tissues. J Gen Virol.
76:741–750. 1995.PubMed/NCBI View Article : Google Scholar
|
|
46
|
Faussone-Pellegrini MS, Cortesini C and
Romagnoli P: The ultrastructure of the muscle coat of human
gastro-oesophageal junction, with special reference to
‘interstitial cells of Cajal’. Front Neurosci. 7(49)2013.PubMed/NCBI View Article : Google Scholar
|
|
47
|
Kumar A, D'Souza SS, Moskvin OV, Toh H,
Wang B, Zhang J, Swanson S, Guo LW, Thomson JA and Slukvin II:
Specification and diversification of pericytes and smooth muscle
cells from mesenchymoangioblasts. Cell Rep. 19:1902–1916.
2017.PubMed/NCBI View Article : Google Scholar
|
|
48
|
Lao KH, Zeng L and Xu Q: Endothelial and
smooth muscle cell transformation in atherosclerosis. Curr Opin
Lipidol. 26:449–456. 2015.PubMed/NCBI View Article : Google Scholar
|


