Introduction
Heart failure (HF) is a common health problem
worldwide, which leads to disability and reductions in life quality
and expectancy (1); however, because
HF is prevalent in elderly populations, the management of HF is
often associated with a high use of resources and healthcare costs
(2). For example, in China it is
estimated that HF healthcare has cost ~$5.42 billion per year,
accounting for 5.01% of total healthcare costs (3). Although a number of different methods
have been investigated to help manage HF, including medical
devices, pharmacological agents and telemonitoring, the clinical
treatment of HF remains relatively poor (4). Therefore, there is an urgent
requirement for clinicians to investigate novel therapies for the
management of HF.
The dysregulation of gene expression is a common
mechanism that occurs in HF and microRNAs (miRNAs) are suggested to
serve critical roles in the metabolic modulation during HF
(5). Within the past few decades,
concerted efforts have been made to investigate the mechanism of
HF. For example, previous studies have revealed that miRNA
(miR)-214 is upregulated in HF and suppresses the transcription
factor (TF) X-box binding protein 1 (XBP1)-mediated endothelial
cell angiogenesis (6,7). Masson et al (8) reported that increased levels of
circulating miR-132 improved the hospitalization of patients with
HF, whilst miR-21 was observed to negatively regulate T regulatory
cells in coronary heart disease via the transforming growth
factor-β1/Smad pathway, including HF (9). Moreover, TFs are considered to serve
important roles in the regulation of gene expression (10); Bakker et al (11) demonstrated that T-box TF 3 (TBX3)
could reprogram mature cardiac myocytes into pacemaker-like cells,
whereas the silenced TF interferon regulatory factor 5 (IRF5) was
indicated to reprogram the macrophage phenotype and promote infarct
healing (12). In addition,
cardiomyocyte-specific IkB kinase (IKK)/NF-κB activation reversed
inflammation in HF (13). However,
despite these findings, the pathogenesis of HF is still not fully
understood.
To identify the mechanisms of HF, Chevillard et
al have created a dataset (accession no. GSE84796) on the Gene
Expression Omnibus (GEO) database to investigate the differential
expression of the transcriptome between patients with HF and normal
healthy controls; however, the functions and mechanisms of the
identified differences were not further elucidated. In the present
study, differentially expressed genes (DEGs) in the dataset
GSE84796 were also identified and subsequently, the biofunction and
regulatory mechanisms of these DEGs were further predicted and
validated in clinical samples and cell line experiments. These
findings may aid in providing novel information that will aid in
understanding and treating HF.
Materials and methods
Data sourcing
The dataset GSE84796 was downloaded from the GEO
database (https://www.ncbi.nlm.nih.gov/geo). This dataset
comprised the gene expression data of the left ventricular tissue
of 10 end-stage patients with HF that had undergone heart
transplantation and the left ventricular tissue of seven healthy
hearts from organ donors. Samples included in this dataset were
sequenced using the GPL14550 Agilent-028004 SurePrint G3 Human GE
8x60K Microarray (Agilent Technologies, Inc.) platform.
Identification of DEGs
Raw data from the dataset was downloaded and DEGs
were identified between the patients with HF and healthy controls
using the limma version 3.10.3 package (http://www.bioconductor.org/packages/2.9/bioc/html/limma.html)
of R software (14), including
background correction and expression value normalization. According
to the annotation files, probes were mapped to gene symbols and
probes that did not map to gene symbols were removed. For multiple
probes mapped to one gene symbol, the average expression value was
calculated as the expression level of this gene. According to the
expression matrix, DEGs between the disease and control group were
isolated using Bayes method in the limma package (15) with adjusted cut-off thresholds of
P<0.05 and log|fold change (FC)|>2.
Pathway enrichment analysis for
DEGs
DEGs were then subjected to signaling pathway
enrichment analysis using the Kyoto Encylopedia of Genes and
Genomes (KEGG) database (16).
Significantly enriched DEGs in KEGG pathways were analyzed using
the The Database for Annotation, Visualization and Integrated
Discovery (DAVID) online tool (version 6.8; https://david-d.ncifcrf.gov) (17) using the following criteria: Enriched
gene number≥2 and P<0.05.
Protein-protein interaction (PPI)
network construction
A PPI network of the DEGs was constructed using the
Search Tool for the Retrieval of Interacting Genes/Proteins
(STRING; version 10.0; http://string-db.org) (18), with a threshold combined score of
>0.9. Cytoscape (version 3.2.0) (19) was used to visualize the PPI network.
In addition, the plug-in MCODE (version 1.4.2; http://apps.cytoscape.org/apps/MCODE)
(20) in Cytoscape was used to
identify and isolate the significantly enriched modules with scores
of ≥10. In addition, pathway enrichment analysis for significantly
enriched modules was also performed based on the information
provided by KEGG pathway analysis.
Construction of TF/miRNA-target
regulatory network
Using the WEB-based Gene SeT AnaLysis Tookit
(WebGestalt; http://www.webgestalt.org/option.php) (21), the regulatory relationships between
TF/miRNA and DEGs identified in the PPI network were predicted and
visualized using Cytoscape software to obtain the TF/miRNA-target
regulatory network with a threshold value of P<0.05.
Patient studies
To further validate the results of the present
study, a total of 20 patients (15 males and 5 females; age range,
38-52 years; mean age 43.54±5.72 years) with HF and 20 matched
healthy controls (14 males and 6 females; age range 36-58 years;
mean age 44.48±6.63 years) were enrolled at Gansu Provincial
Hospital in the current study from December 2017 to May 2018.
Patients in this study were examined for significant symptoms of HF
and had no history of myocardial infarction or revascularization.
Patients were excluded if they presented with the following:
Previous stroke, diabetes mellitus, blood disease, obvious disease,
infectious diseases or receiving hormone treatment. Among these
participants, 5 ml blood samples were collected to confirm the
expression levels of G-protein coupled receptor 18 (GPR18), miR-155
and E26 transformation-specific transcription factor 2 (ETS2). This
study was approved by the Ethic Committee of Gansu Provincial
Hospital and signed informed consent was obtained from all
participants.
Cell culture and transfection
The cardiomyoblast H9c2 (2-1) cell line was
purchased from the American Type Culture Collection. Cells were
cultured in DMEM (Gibco; Thermo Fisher Scientific, Inc.),
supplemented with 10% FBS (Gibco; Thermo Fisher Scientific, Inc.),
100 µg/ml streptomycin (Sigma-Aldrich; Merck KGaA) and 100 µg/ml
penicillin (Sigma-Aldrich; Merck KGaA), and maintained in a
humidified atmosphere with 5% CO2 at 37˚C.
For transfections, 1x10⁵ H9c2 (2-1)
cells/well were seeded into six-well plates and cultured overnight
at 37˚C with 70% confluency, and subsequently transfected with
miR-155 mimic (50 nM;
5'-UUAAUGCUAAUCGUGAUAGGGGUCCCUAUCACGAUUAGCAUUAAUU-3'),
miR-155 inhibitor (50 nM; 5'-ACCCCUAUCACGAUUAGCAUUAA-3'), negative
control (NC; 50 nM; 5'-UUCUCCGAACGUGUCACGUTT-3'), pcDNA3.0-ETS2
overexpression plasmid, an empty pcDNA3.0 plasmid as the NC (100
nM; pcDNA3.0), small interfering RNA (si) targeting ETS2 (si-ETS2;
100 nm; sense, 5'-GGGAACAUCUGGAGCAAAUTT-3'; antisense,
5'-AUUUGCUCCAGAUGUUCCCTT-3') or si-NC (100 nM; sense,
5'-UUCUCCGAACGUGUCACGUTT-3'; antisense, 5'ACGUGACACGUUCGGAGAATT-3')
using Lipofectamine® 2000 reagent (Thermo Fisher
Scientific, Inc.), according to the manufacturer's protocol.
miR-155 mimic, miR-155 inhibitor, miRNA negative control, pcDNA3.0,
pcDNA3.0-ETS2, si-NC and si-ETS2 were purchased from Nanjing KeyGen
Biotech Co., Ltd. Cells were transfected for 48 h prior to
subsequent experimentation.
Cell viability
Cell viability was determined using a Cell Counting
Kit-8 assay (CCK-8; Dojindo Molecular Technologies, Inc.),
according to the manufacturer's protocol. Briefly, 2x10⁴
H9c2 (2-1) cells/well were plated into 96-well plates and incubated
in a humidified atmosphere with 5% CO2 at 37˚C.
Following incubation for 24, 48 and 72 h, 10 µl CCK-8 solution was
added to each well and cultured for 1 h at 37˚C. The optical
density of each well at 450 nm was recorded using a Varioskan Flash
microplate reader (Thermo Fisher Scientific, Inc.).
Flow cytometric analysis of
apoptosis
Briefly, a total 1x10⁵ of H9c2 (2-1)
cells were seeded on a six-well plate and incubated in a humidified
atmosphere with 5% CO2 at 37˚C with 70% confluency
overnight. Following transfection and incubation for 48 h, the rate
of apoptosis was determined using the Annexin V-FITC Apoptosis
Detection kit (BioVision, Inc.), according to the manufacturer's
protocol. Apoptotic cells were analyzed using a BD FACScan™ flow
cytometer (BD Biosciences).
Reverse transcription-quantitative PCR
(RT-qPCR)
Total RNA was extracted from tissue and cell lines
using TRIzol™ reagent (Invitrogen; Thermo Fisher Scientific, Inc.),
according to the manufacturer's protocol. To determine mRNA
expression levels, 2 µg RNA was reversed transcribed into cDNA
using the PrimeScript RT Master mix (Takara Biotechnology Co.,
Ltd.) according to the manufacturer's protocol. qPCR was
subsequently performed using the SYBR® Green PCR Master
mix (Thermo Fisher Scientific Inc.) according the manufacturer's
protocol. The following primer pairs were used for the qPCR: GPR18
forward, 5'-CCACCAAGAAGAGAACCAC-3' and reverse,
5'-GAAGGGCATAAAGCAGACG-3'; ETS2 forward, 5'-GTGGACCTATTCAGCTGTGG-3'
and reverse, 5'-TTCCCCGACGTCTTGTGGAT-3'; and β-actin forward,
5'-CTGGGACGACATGGAGAAAA-3' and reverse, 5'-AAGGAAGGCTGGAAGAGTGC-3'.
The following thermocycling conditions were used for the qPCR: 50˚C
for 3 min; 95˚C for 3 min; and 40 cycles of 95˚C for 10 sec and
60˚C for 30 sec. β-actin was used as the internal loading
control.
For miRNA, 2 µg total RNA was reversed transcribed
into cDNA using the TaqMan MicroRNA Reverse Transcription kit
according to the manufacturer's protocol (Applied Biosystems;
Thermo Fisher Scientific, Inc.). qPCR was performed using
SYBR® Green PCR Master mix (Thermo Fisher Scientific,
Inc.) according to the manufacturer's protocol. The following
primer pairs were used for the qPCR: miR-155 forward,
5'-GCGGTTAATGCTAATCGTGAT-3' and reverse, 5'-GTGCAGGGTCCGAGGT-3';
and U6 forward, 5'-CTCGCTTCGGCAGCACA-3' and reverse,
5'-AACGCTTCACGAATTTGCGT-3'. The following thermocycling conditions
were used for the qPCR: 95˚C for 10 min; and 40 cycles of 95˚C for
15 sec, 60˚C for 30 sec and 60˚C for 1 min. U6 was used as the
internal loading control for the miRNA. mRNA and miRNA expression
levels were quantified using the 2-ΔΔCq method (22).
Western blot analysis
Total protein was extracted from cells using RIPA
lysis buffer containing a protease inhibitor cocktail (Roche
Diagnostics GmbH). Total protein was quantified using a BCA assay
kit (Pierce; Thermo Fisher Scientific, Inc.) and 25 µg protein/lane
was separated using 10% SDS-PAGE. The separated proteins were
subsequently transferred onto PVDF membranes (GE Healthcare) and
blocked for 1 h at room temperature with 5% non-fat milk. The
membranes were incubated with primary antibodies against GPR18
(1:2,000; cat. no. PA5-23218; Invitrogen; Thermo Fisher Scientific,
Inc.) and β-actin (1:5,000; cat. no. sc-69879; Santa Cruz
Biotechnology, Inc.) at 4˚C overnight. Following the primary
antibody incubation, membranes were incubated with horseradish
peroxidase-labeled goat anti-rabbit IgG (1:5,000; cat. no. sc-2030;
Santa Cruz Biotechnology, Inc.) and goat anti-mouse IgG secondary
antibodies (1:5,000; cat. no. sc-2005; Santa Cruz Biotechnology,
Inc.) at room temperature for 1 h. Protein bands were visualized
using an ECL plus kit (GE Healthcare) and analyzed with ChemiDoc
XRS+ luminescent image analyzer (Bio-Rad Laboratories, Inc.).
Statistical analysis
Statistical analysis was performed using GraphPad
Prism 6.0 software (GraphPad Software, Inc.) and data are presented
as the mean ± standard deviation of three experimental repeats.
Statistical differences between 2 groups were determined using
Student's t-tests, whereas differences between >2 groups were
determined using one-way ANOVA, with Tukey's post hoc test for
multiple comparisons. P<0.05 was considered to indicate a
statistically significant difference.
Results
DEGs screening
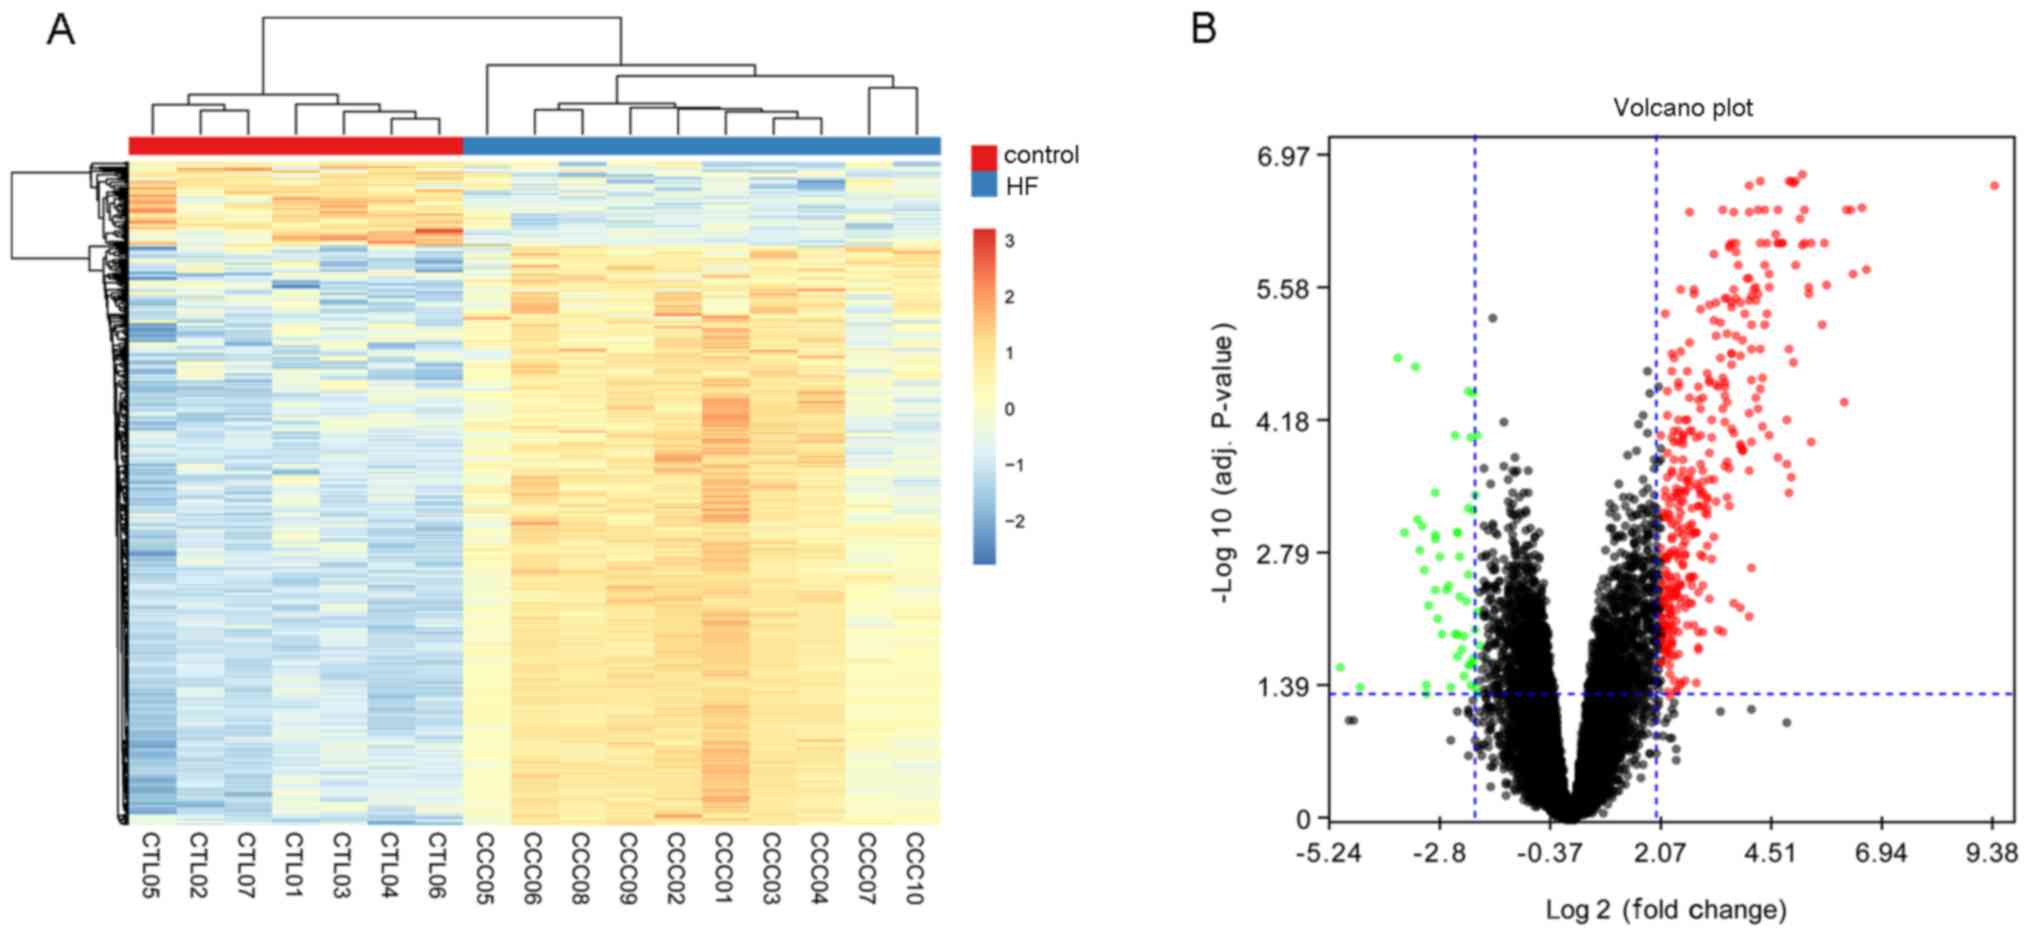
After preprocessing, a total of 419 DEGs were
identified, including 366 upregulated genes and 53 downregulated
genes, which suggested that DEGs could distinguish patients with HF
from healthy controls. The bi-clustering of identified DEGs are
presented in Fig. 1A. and the
volcano plot of DEGs is presented in Fig. 1B.
Functional enrichment of DEGs
To further identify the molecular mechanisms that
the DEGs participated within, KEGG pathway enrichment analysis for
upregulated and downregulated DEGs was conducted using the DAVID
online tool. Due to the low number of downregulated DEGs
identified, no KEGG pathway was indicated to be significantly
enriched by the downregulated DEGs; however, 40 KEGG pathways were
enriched by the upregulated DEGs, including ‘cytokine-cytokine
receptor interaction’ (P=3.46x10⁻¹⁶), ‘natural killer
cell mediated cytotoxicity’ (P=6.05x10⁻¹⁴) and ‘primary
immunodeficiency’ (P=6.77x10⁻¹⁴). The top 10 pathways
are presented in Table I.
 | Table ITop Kyoto Encyclopedia of Genes and
Genomes pathways enriched by differentially expressed genes. |
Table I
Top Kyoto Encyclopedia of Genes and
Genomes pathways enriched by differentially expressed genes.
| Pathway ID | Pathway name | Count | P-value |
|---|
| hsa04060 | Cytokine-cytokine
receptor interaction | 31 |
3.46x10⁻¹⁶ |
| hsa04650 | Natural killer cell
mediated cytotoxicity | 22 |
6.05x10⁻¹⁴ |
| hsa05340 | Primary
immunodeficiency | 14 |
6.77x10⁻¹⁴ |
| hsa04660 | T cell receptor
signaling pathway | 19 |
3.28x10⁻¹² |
| hsa04640 | Hematopoietic cell
lineage | 16 |
2.02x10⁻¹⁰ |
| hsa04514 | Cell adhesion
molecules | 18 |
6.15x10⁻⁹ |
| hsa04062 | Chemokine signaling
pathway | 20 |
1.08x10⁻⁸ |
| hsa04064 | NF-κB signaling
pathway | 13 |
2.47x10⁻⁷ |
| hsa05323 | Rheumatoid
arthritis | 13 |
2.81x10⁻⁷ |
| hsa04672 | Intestinal immune
network for IgA production | 10 |
4.78x10⁻⁷ |
PPI network and model analysis
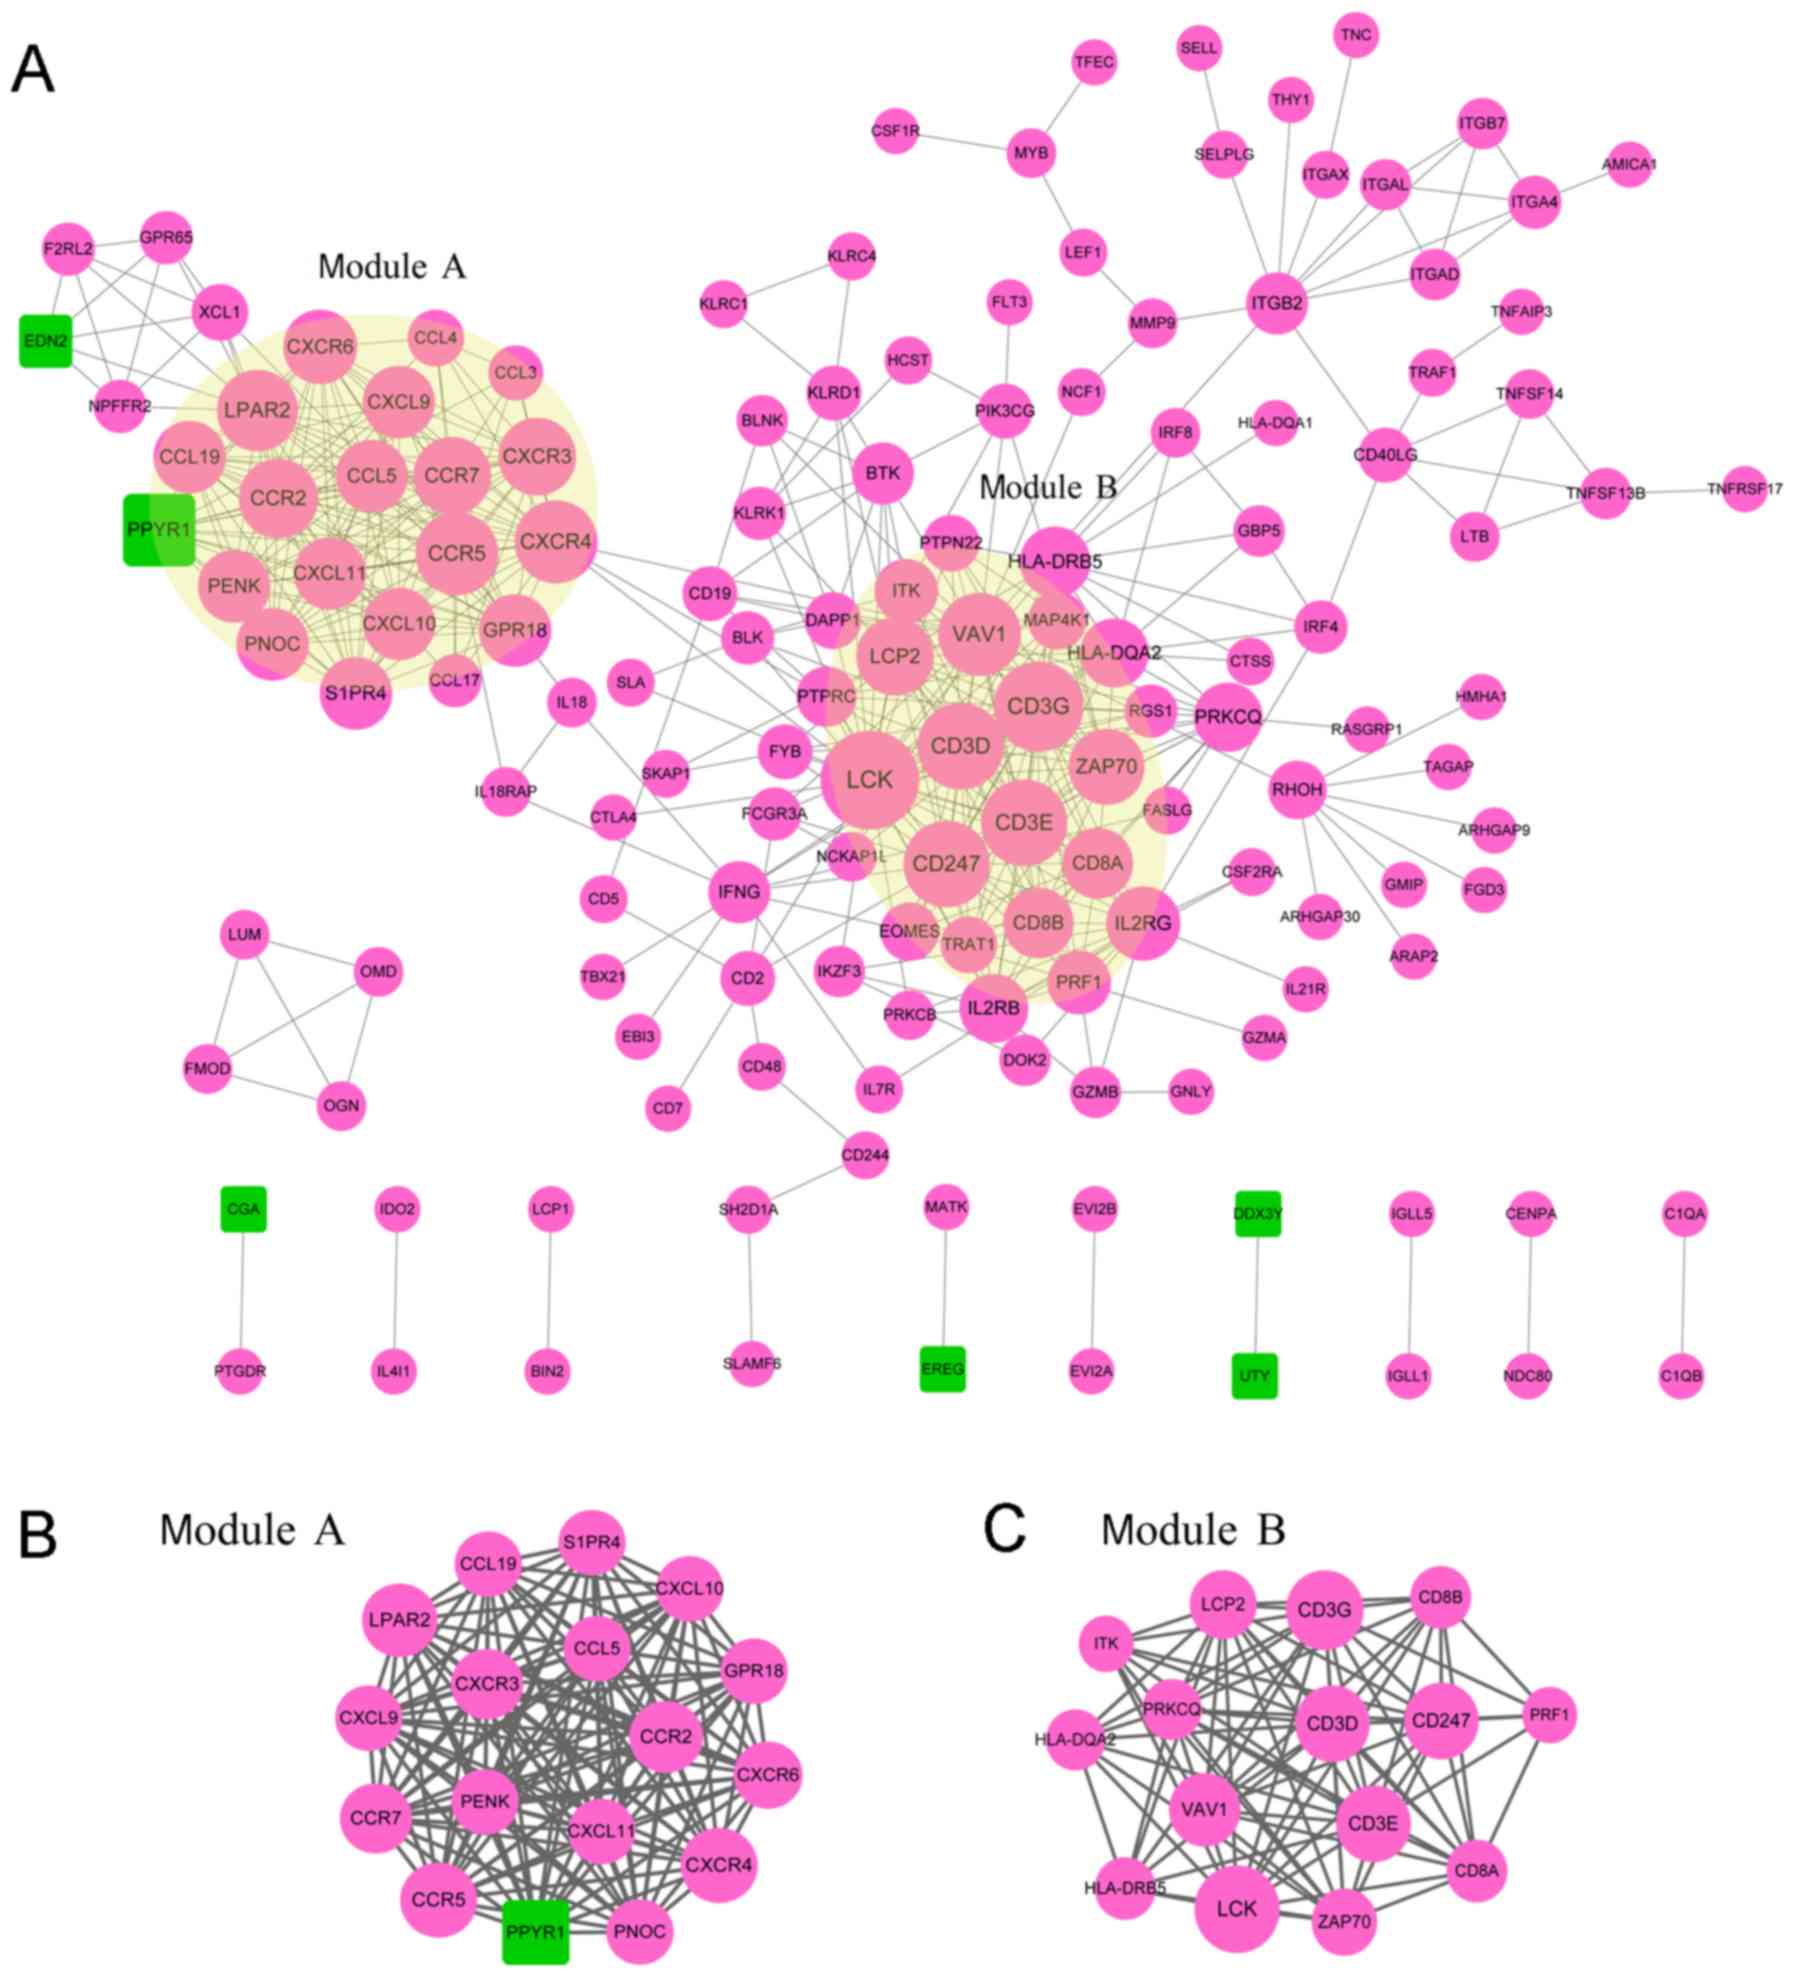
According to the STRING database, the PPI network
for DEG-encoded proteins was constructed with 148 nodes and 482
edges (Fig. 2A). The top 10 nodes
that were expressed to a higher degree were: Lymphocyte-specific
protein tyrosine kinase (LCK), cluster of differentiation 3 g
(CD3G), cluster of differentiation 3e (CD3E), cluster of
differentiation 3d (CD3D), cluster of differentiation 247 (CD247),
van guanine nucleotide exchange factor 1 (VAV1), C-C motif
chemokine receptor 5 (CCR5), C-X-C motif chemokine receptor 4
(CXCR4), lysophosphatidic acid receptor (LPAR2) and C-C motif
chemokine receptor 2 (CCR2). Two significantly enriched modules
with an enriched score ≥10 were isolated from the PPI network.
Module A contained 17 nodes and 136 relationship pairs with a score
of 12 (Fig. 2B), which were
significantly enriched in the ‘chemokine signaling pathway’
(P=9.85x10⁻¹⁵), ‘cytokine-cytokine receptor interaction’
(P=8.58x10⁻¹⁴) and ‘Toll-like receptor signaling
pathway’ (P=6.98x10⁻⁴; Table
II). A total of 15 nodes and 84 relationship pairs were
included in module B with a score of 12 (Fig. 2C), and this module was significantly
enriched in 15 KEGG pathways, including ‘T cell receptor signaling
pathway’ (P=1.64x10⁻¹⁸), ‘primary immunodeficiency’
(P=4.12x10⁻⁹) and ‘hematopoietic cell lineage’
(P=4.59x10⁻⁷; Table
II).
| Table IIKyoto Encyclopedia Genes and Genomes
pathway enrichment analysis results for Module A and Module B. |
Table II
Kyoto Encyclopedia Genes and Genomes
pathway enrichment analysis results for Module A and Module B.
| A, Module A |
|---|
| Pathway ID | Pathway name | Count | P-value | Proteins |
|---|
| hsa04062 | Chemokine signaling
pathway | 11 |
9.85x10⁻¹⁵ | CCR7, CCR5, CXCR4,
CCR2, CXCR6, CXCL9, CCL19, CXCR3, CCL5, CXCL11, CXCL10 |
| hsa04060 | Cytokine-cytokine
receptor interaction | 11 |
8.58x10⁻¹⁴ | CCR7, CCR5, CXCR4,
CCR2, CXCR6, CXCL9, CCL19, CXCR3, CCL5, CXCL11, CXCL10 |
| hsa04620 | Toll-like receptor
signaling pathway | 4 |
6.98x10-04 | CXCL9, CCL5,
CXCL11, CXCL10 |
| B, Module B |
| Pathway ID | Pathway name | Count | P-value | Proteins |
| hsa04660 | T cell receptor
signaling pathway | 12 |
1.64x10⁻¹⁸ | ITK, PRKCQ, CD3G,
CD3D, CD8A, CD3E, CD8B, CD247, LCK, ZAP70, VAV1, LCP2 |
| hsa05340 | Primary
immunodeficiency | 6 |
4.12x10⁻⁹ | CD3D, CD8A, CD3E,
CD8B, LCK, ZAP70 |
| hsa04640 | Hematopoietic cell
lineage | 6 |
4.59x10⁻⁷ | CD3G, CD3D, CD8A,
CD3E, CD8B, HLA-DRB5 |
| hsa04650 | Natural killer cell
mediated cytotoxicity | 6 |
2.79x10⁻⁶ | PRF1, CD247, LCK,
ZAP70, VAV1, LCP2 |
| hsa05166 | HTLV-I
infection | 6 |
1.02x10⁻⁴ | CD3G, CD3D, CD3E,
LCK, HLA-DRB5, HLA-DQA2 |
| hsa04612 | Antigen processing
and presentation | 4 |
4.27x10⁻⁴ | CD8A, CD8B,
HLA-DRB5, HLA-DQA2 |
| hsa05142 | Chagas disease
(American trypanosomiasis) | 4 |
1.07x10⁻³ | CD3G, CD3D, CD3E,
CD247 |
| hsa05332 | Graft-versus-host
disease | 3 |
1.94x10⁻³ | PRF1, HLA-DRB5,
HLA-DQA2 |
| hsa05162 | Measles | 4 |
2.17x10⁻³ | PRKCQ, CD3G, CD3D,
CD3E |
| hsa05330 | Allograft
rejection | 3 |
2.44x10⁻³ | PRF1, HLA-DRB5,
HLA-DQA2 |
| hsa04514 | Cell adhesion
molecules (CAMs) | 4 |
2.62x10⁻³ | CD8A, CD8B,
HLA-DRB5, HLA-DQA2 |
| hsa04940 | Type I diabetes
mellitus | 3 |
3.13x10⁻³ | PRF1, HLA-DRB5,
HLA-DQA2 |
| hsa05320 | Autoimmune thyroid
disease | 3 |
4.77x10⁻³ | PRF1, HLA-DRB5,
HLA-DQA2 |
| hsa05416 | Viral
myocarditis | 3 |
5.71x10⁻³ | PRF1, HLA-DRB5,
HLA-DQA2 |
| hsa04064 | NF-kappa B
signaling pathway | 3 |
1.29x10⁻² | PRKCQ, LCK,
ZAP70 |
TF/miRNA-target regulatory
network
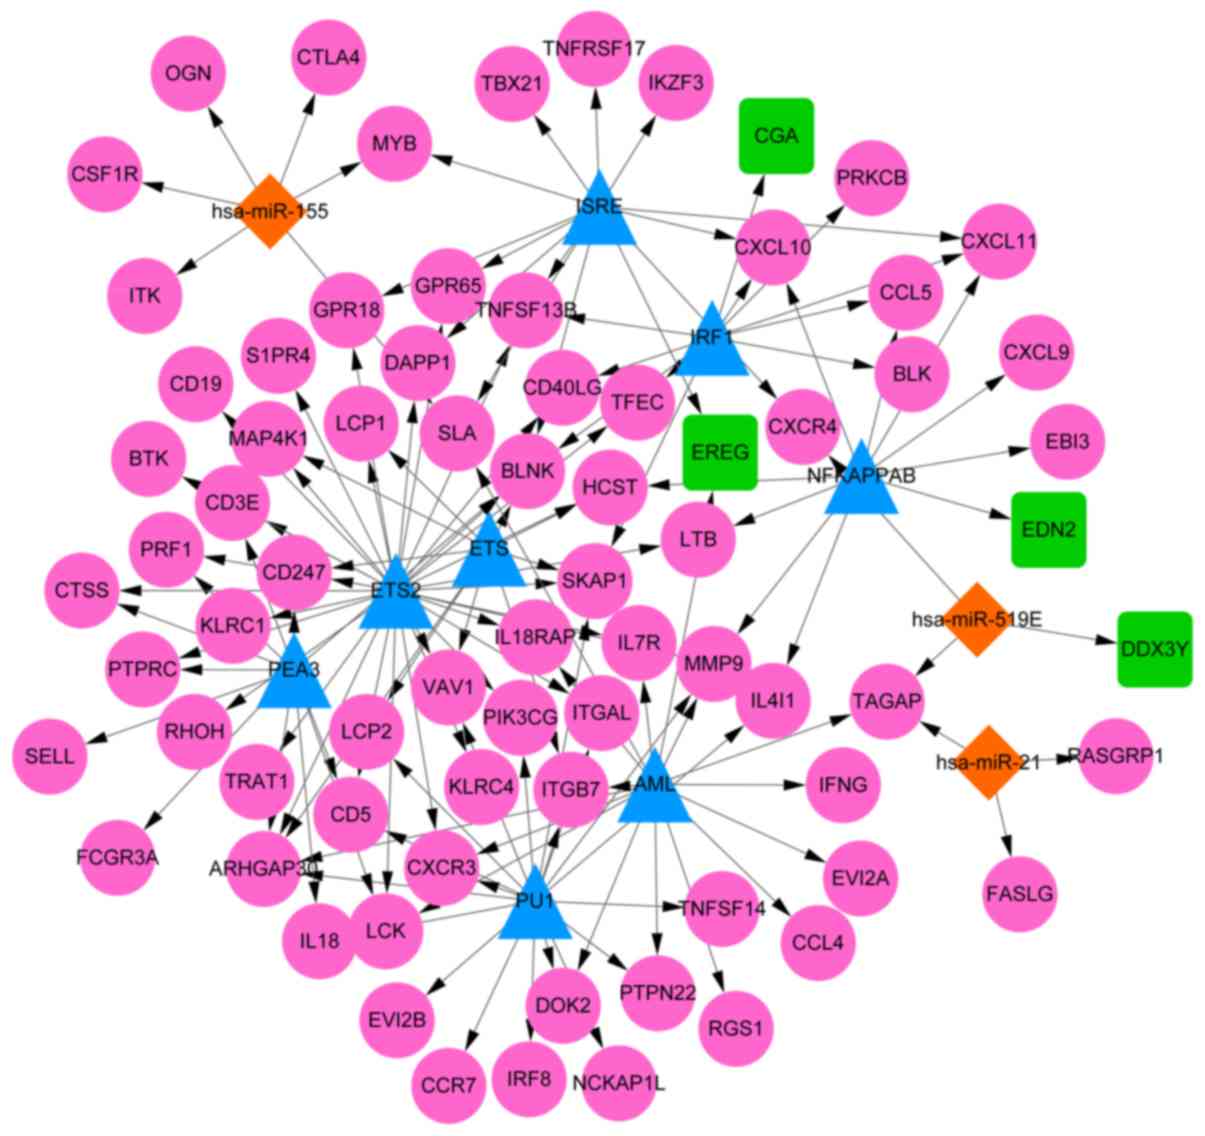
According to the WebGestalt database, among 10 nodes
in this network, there were 8 TFs identified to target the DEGs
identified in the current study, including ETS2, pullulanase 1
(PU1), acute myeloid leukemia protein (AML), interferon-stimulated
response elements (ISRE), polyomavirus enhancer activator 3 (PEA3),
interferon 1 (IRF1), nuclear factor kappa B (NFKAPPAB) and E26
transformation-specific transcription factor (ETS). Moreover, a
total of three miRNAs were predicted to target DEGs: miR-155,
miR-21 and miR-519. Through combining the regulatory relationships
of TF/gene and miRNA/gene, the TF/miRNA-target regulatory network
was constructed (Fig. 3), which
included 86 nodes (71 upregulated DEGs and 4 downregulated DEGs)
and 138 relationship pairs.
Validation of gene expression in
clinical samples
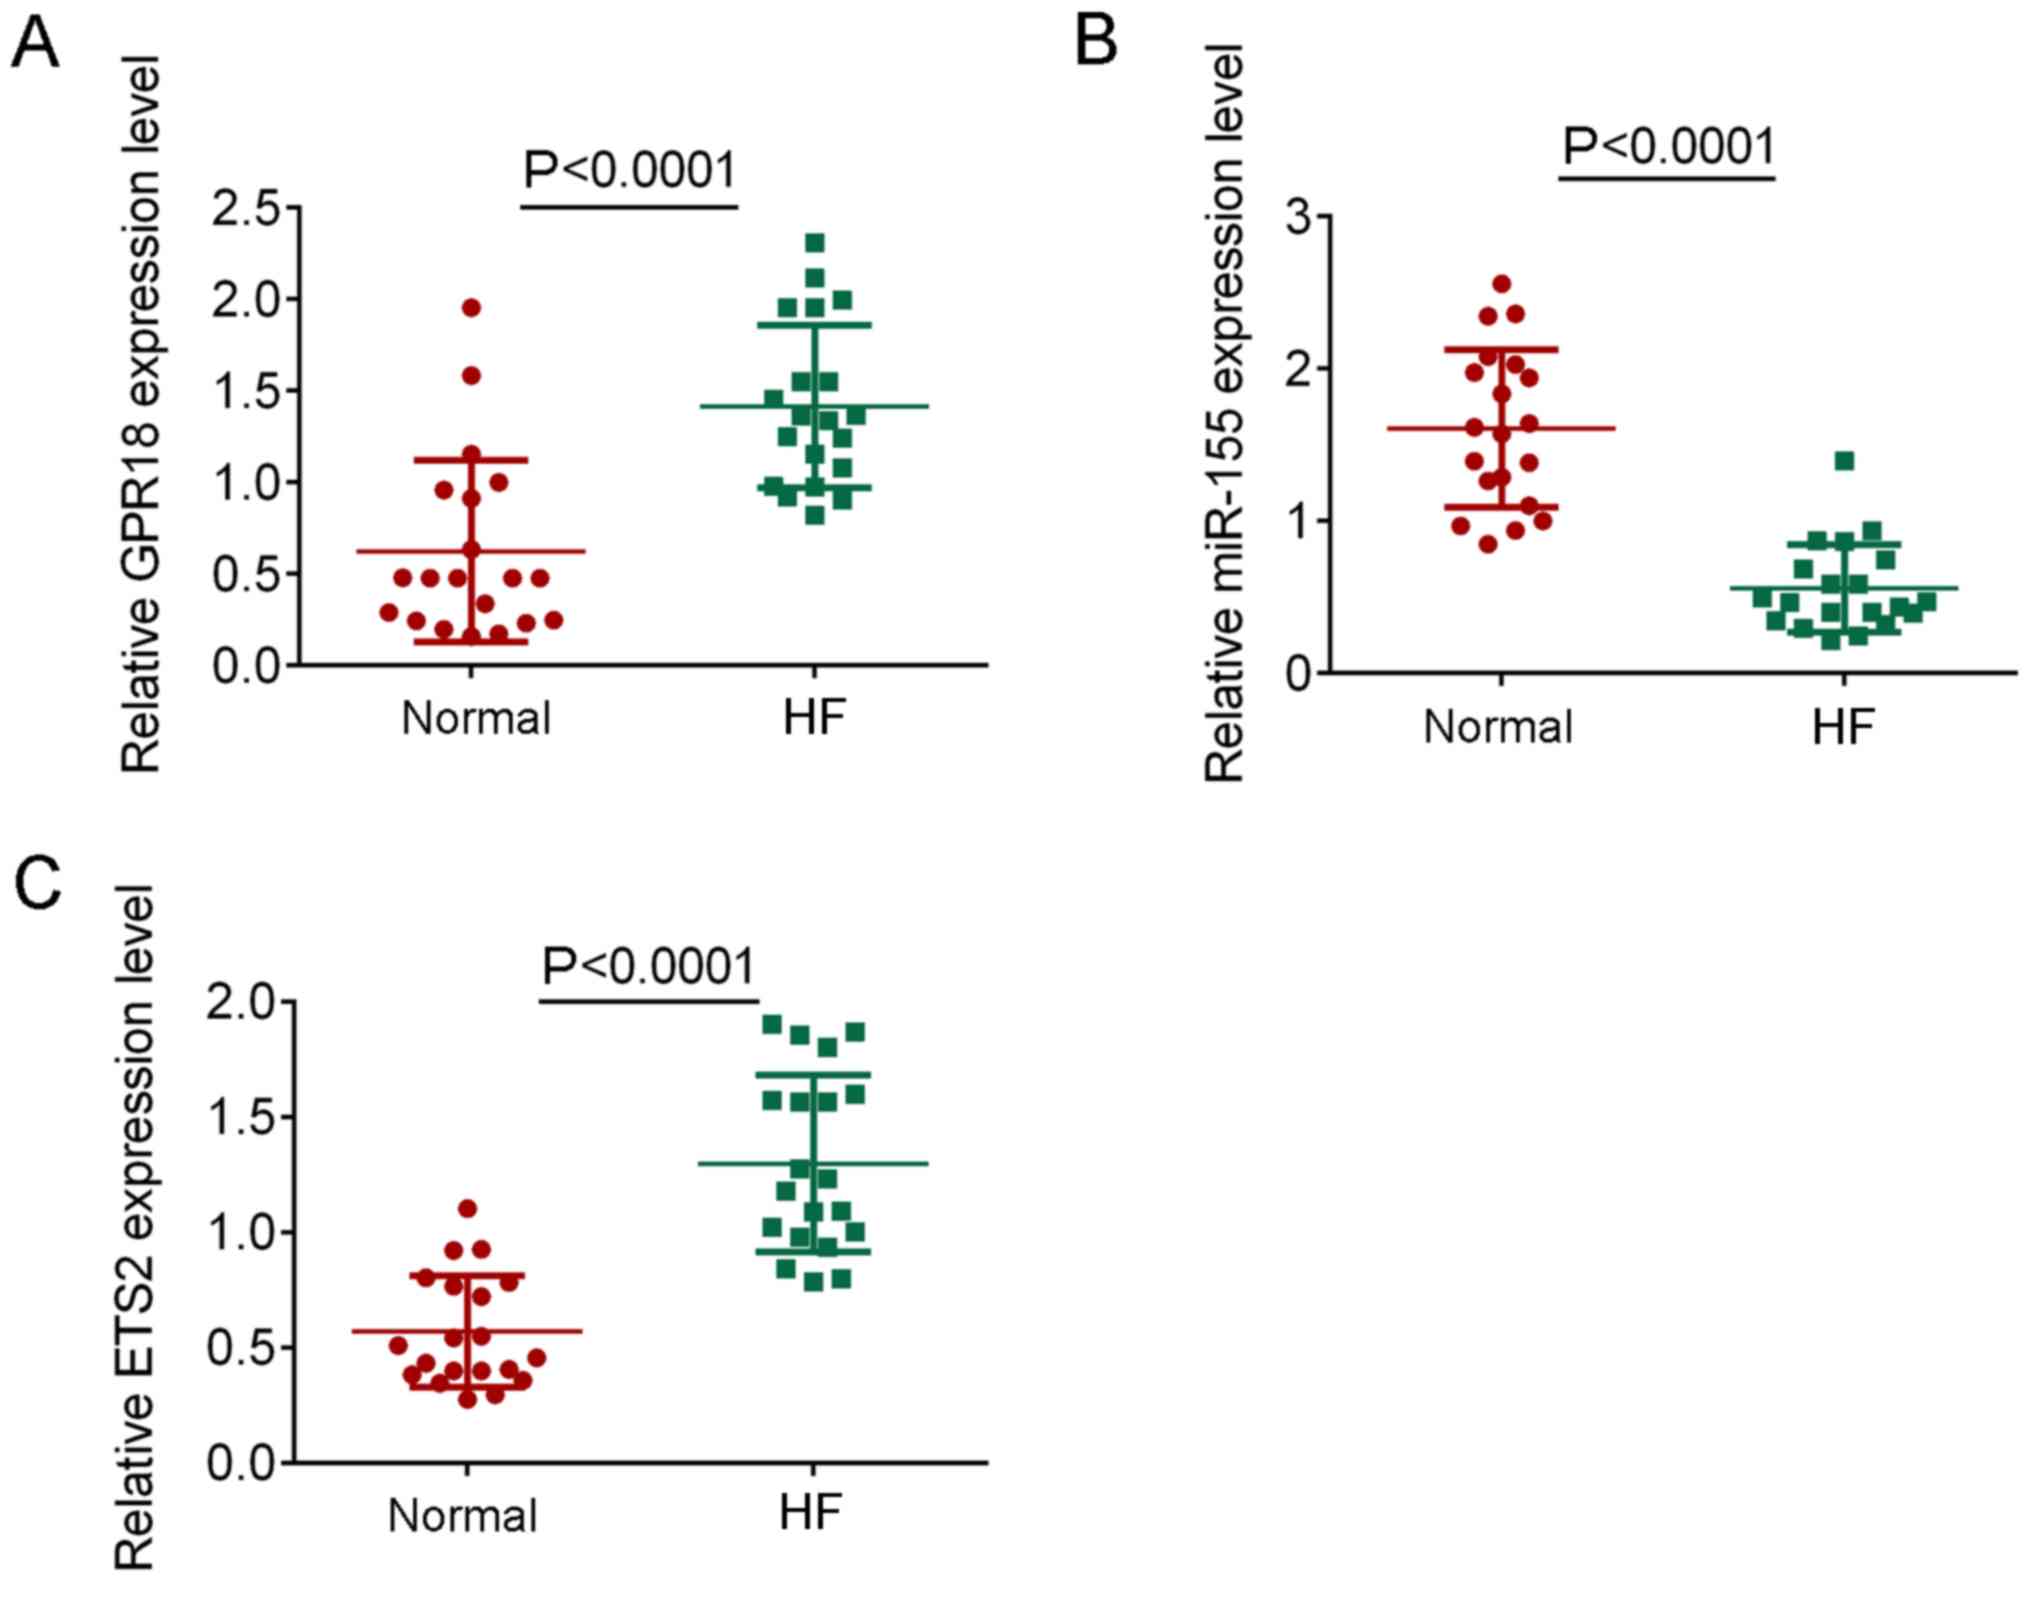
To confirm the findings of the bioinformatics
analysis, the expression levels of miR-155, GPR18 and ETS2 were
determined in patients with HF. The expression levels of GPR18 and
ETS2 were significantly increased in HF samples compared with the
healthy controls (P<0.0001; Fig.
4A and C), whereas the
expression levels of miR-155 were significantly decreased in HF
samples compared with the healthy controls (P<0.0001; Fig. 4B). These results were consistent with
the findings observed using bioinformatics.
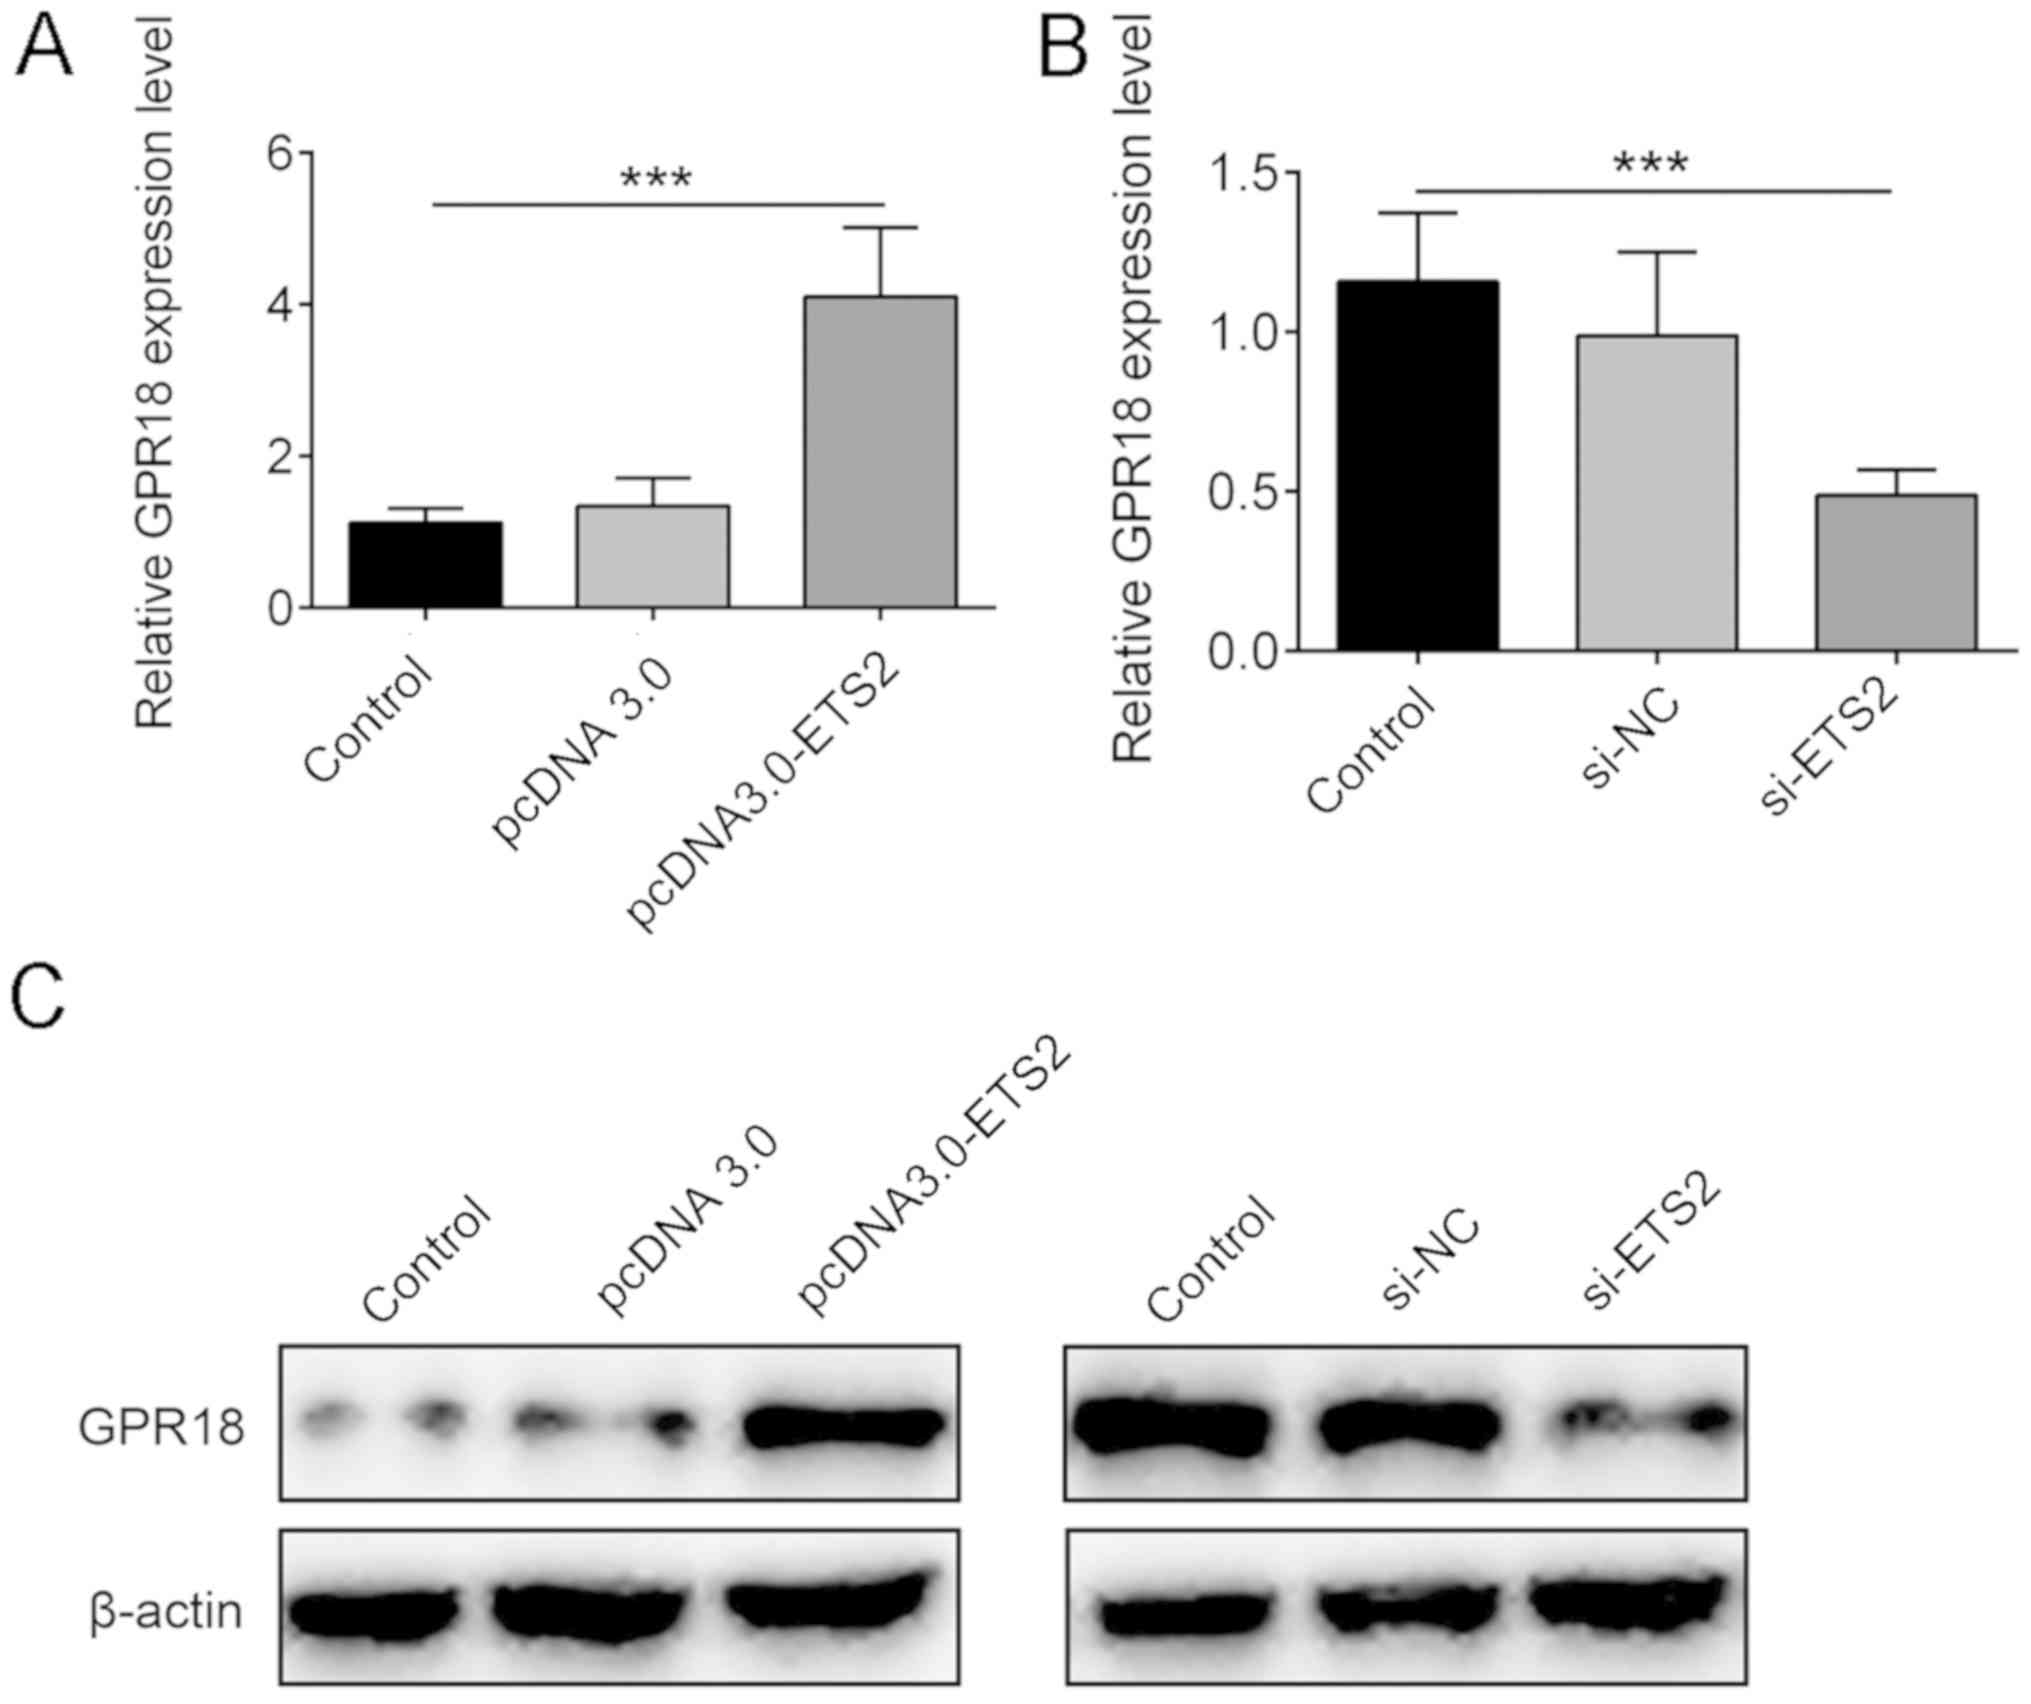
ETS2 is a TF for GPR18
To further confirm the regulation of the upregulated
expression of GPR18, the expression levels of ETS2 were verified
and the expression levels of GPR18 were determined at the cellular
level following the use of ETS2 overexpression plasmids or siRNA
targeting ETS2, of which their transfection was proved to be
successful (Fig. S1A-D). It was
demonstrated that the overexpression of ETS2 with the pcDNA3.0-ETS2
plasmid could significantly increase the mRNA and protein
expression levels of GPR18 compared with the control group
(P<0.001; Fig. 5A and C), whereas the genetic silencing of ETS2
with si-ETS2 could significantly decrease the expression levels of
GPR18 in H9c2 (2-1) cells compared with the control group
(P<0.001; Fig. 5B and C). These findings indicated that GPR18 may
be a downstream target of ETS2, and ETS2 may target GPR18 to
promote the progression of HF.
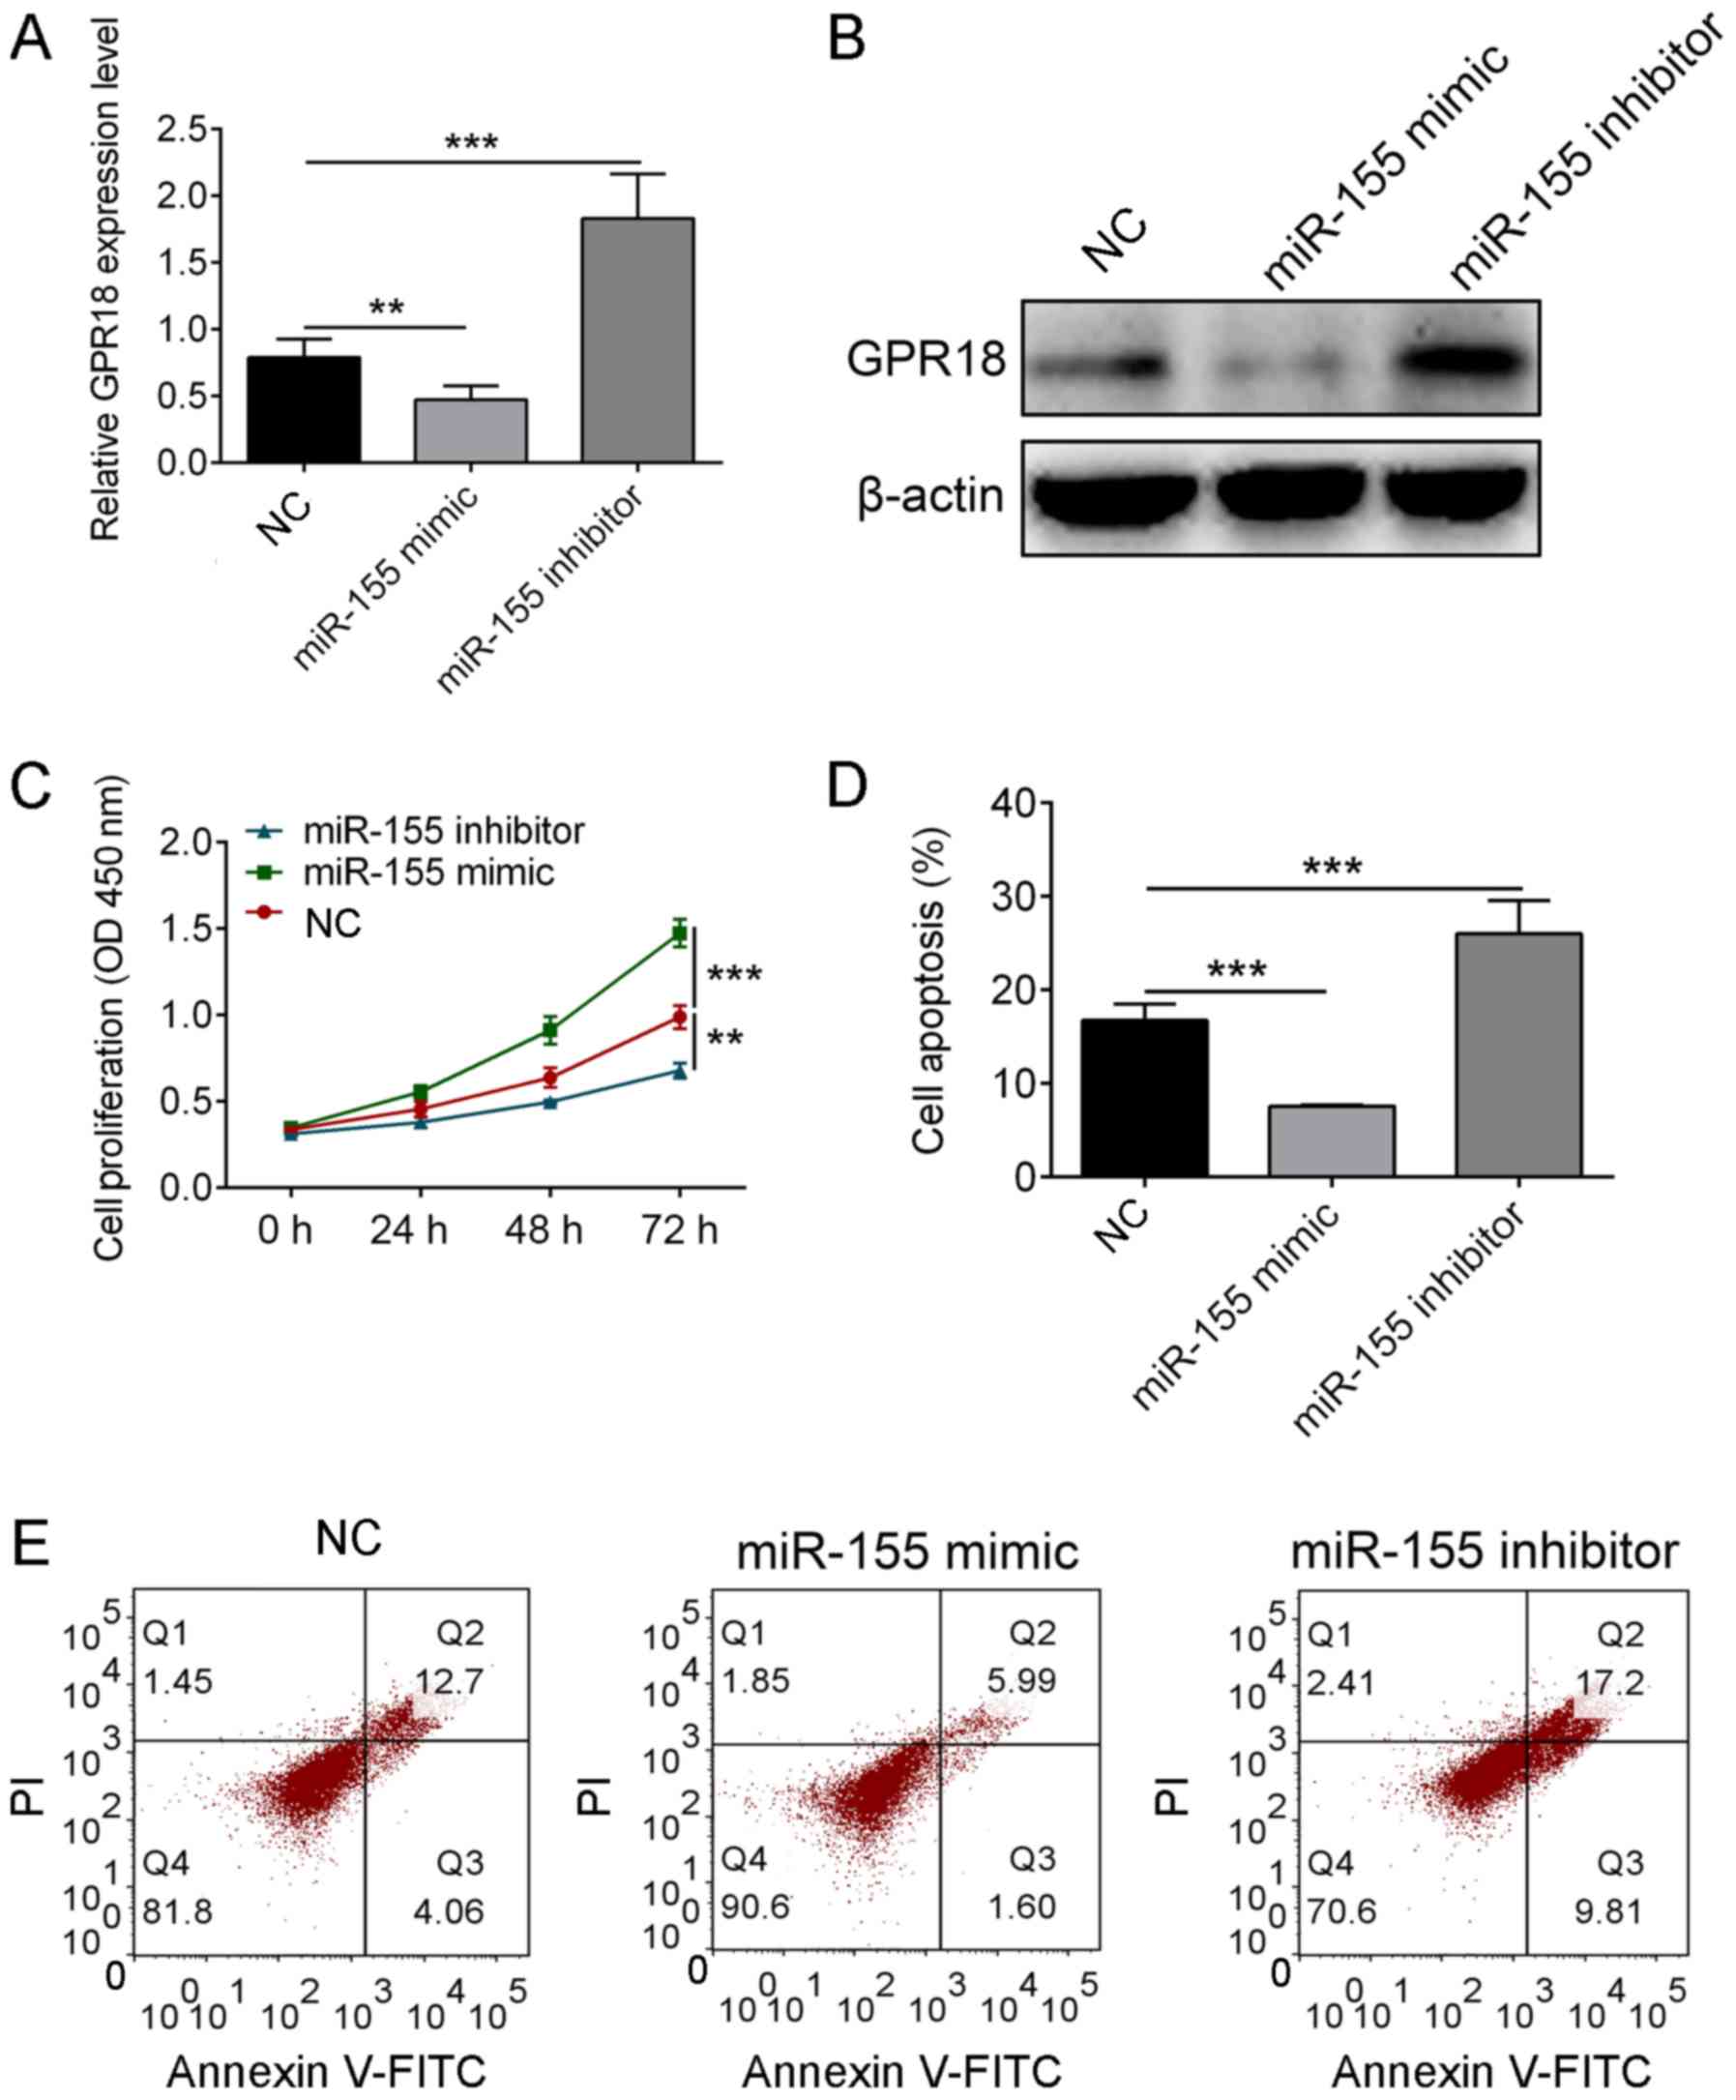
miR-155 regulates the cell viability
and apoptosis of H9c2 (2-1) through GPR18
The regulatory relationship between GPR18 and
miR-155 was also verified at the cellular level following the use
of miR-155 mimics or miR-155 inhibitors, of which their
transfection was proved to be successful (Fig. S1E). The results revealed that the
overexpression of miR-155 mimic decreased the expression levels of
GPR18 (P<0.01), whereas the miR-155 inhibitor increased the
expression levels of GPR18 in H9c2 (2-1) cells compared with the
control group (P<0.001; Fig. 6A
and B). The increased expression of
miR-155 was also indicated to significantly increase the cell
viability in H9c2 (2-1) cells (P<0.01), but attenuated apoptosis
compared with the control group (P<0.001), whereas the decreased
expression of miR-155 using miR-155 inhibitor demonstrated opposite
effects to the miR-155 mimic-transfected cells (P<0.001;
Fig. 6C-E). These findings indicated
that miR-155 might inhibit the apoptosis of H9c2 (2-1) through
downregulating the expression of GPR18.
Discussion
HF is a common clinical syndrome worldwide
characterized by heart structure damage and/or heart dysfunction,
resulting in fatigue and dyspnea at rest (23). HF is a multifactorial disease and its
development is associated with a complex and sophisticated
regulation, but the exact mechanism remains to be elucidated
(24). Although numerous researches
have been performed (25,26), the exact mechanism of HF remains to
be elucidated. In the present study, a total of 419 DEGs were
identified and their encoding proteins were used to construct a PPI
network, and GPR18 was identified as a hub node in this network.
Further bioinformatics and experimental analyses showed that GPR18
could be targeted by miR-155 and the TF ETS2, suggesting that
miR-155 and ETS2 might play critical role in the development of HF
via targeting GPR18.
GPR18 is a deorphaned lipid receptor that can be
activated by behaviorally inactive atypical cannabinoid and
N-arachidonoyl glycine (27). A
number of tissues have reportedly demonstrated very low expression
of GPR18, including the brain, heart, liver, lung and ovaries
(28). A previous study identified
that GPR18 serves a critical role in modulating cardiovascular
function (24) and Penumarti and
Abdel-Rahman (29) reported that
GPR18 mediated hypertension through activating the
PI3K/AKT/ERK/nNOS signaling pathway and suppressing cAMP in an
animal model (30). However, the
function of GPR18 in HF is relatively unreported. In the present
study, GPR18 expression levels were significantly increased in
patients with HF compared with healthy controls, which was further
validated with clinical studies; GPR18 expression was significantly
elevated in patients with HF compared with healthy controls. All of
these findings indicated that GPR18 may serve a role in promoting
the pathogenesis of HF.
ETS2, encoded by E26 oncogene homolog 2, serves an
important role in the pathogenesis of cardiovascular disease
(31). Previous studies have
demonstrated that ETS2 and Mesp1 are two important TFs involved in
the reprogramming of fibroblasts into cardiac progenitor-like cells
(32,33). In addition, Rowell et al
(34) revealed that reduced ETS2
expression in endothelial progenitor cells was a beneficial
biomarker of sitagliptin efficacy in patients undergoing coronary
artery-bypass grafting. The current study also revealed that ETS
family members, including ETS-related transcription factor 1 (Elf1)
and ETS2, were upregulated in late-HF (34). In the present study, ETS2 expression
levels were found to be significantly increased in patients with HF
compared with the healthy controls. Moreover, the overexpression of
ETS2 significantly increased the expression levels of GPR18,
whereas the silencing of ETS2 expression significantly reduced the
expression levels of GPR18 in H9c2 (2-1) cells. These results
indicated that GPR18 may be a downstream target for ETS2.
Considering this evidence, it was hypothesized that ETS2 may
promote the pathogenesis of HF through targeting and regulating
GPR18 expression.
miR-155 is an established miRNA that is involved in
the regulation of a number of different cancer pathways, as well as
in cardiovascular diseases (35).
Bao et al (36) demonstrated
that miR-155 and miR-148a could reduce cardiac injury through
suppressing NF-κB expression in acute viral myocarditis. Moreover,
miR-155 was demonstrated to serve as a potential marker for
arrhythmic risk in patients with chronic heart failure (37) and Matsumoto et al (38) revealed that miR-155 is a risk factor
for cardiac death. In the current study, miR-155 expression was
significantly decreased in patients with HF, and it was observed to
promote the proliferation of H9c2 (2-1) cells and reduce apoptosis
in H9c2 (2-1) cells through negatively regulating the expression
levels of GPR18. These findings suggested that miR-155 may serve a
crucial role in regulating cell viability and apoptosis in HF
through targeting and regulating GPR18 expression.
There are multiple limitations associated with the
current study; For example, because no relevant clinical
information was provided for the GSE84796 dataset in the GEO
database, investigations between the molecular mechanisms and
clinical features were not analyzed in the present study.
Additionally, due to time and resource limitations, an insufficient
number of matched heart tissue samples were collected from patients
to confirm the results of the current study. Due to this, the study
used blood samples instead to perform validation studies, but
further validation in clinical samples is required in the future.
Additionally, due to the limited funding for the current study,
only H9c2 (2-1) cell lines were used for the following experimental
validations and further validation in additional human cell lines,
including HCM HJ1-I, are required to further validate the results
of the current study. Finally, also due to the limited funds
available, further investigations into ETS2 and subsequent pathway
analysis were not performed in the present study. However, despite
these limitations, the findings in the present study may provide
some novel insight in understanding HF.
In conclusion, both GRP18 and ETS2 expression levels
were demonstrated to be significantly increased in HF compared with
healthy controls, whereas the expression levels of miR-155 were
significantly reduced in HF compared with healthy controls. These
findings suggested that GPR18 may be targeted by EST2 and miR-155,
and miR-155 may promote cell viability and suppress apoptosis in HF
through targeting and regulating GPR18.
Supplementary Material
Confirmation of gene overexpression or
silencing in H9c2 (2-1) cells. (A) mRNA expression of ETS2 after
overexpression of ETS2. (B) Protein expression of ETS2 after
overexpression of ETS2. (C) mRNA expression of ETS2 after ETS2
knockdown. (D) Protein expression of ETS2 after ETS2 knockdown. (E)
Expression of miR-155 after miR-155 mimic or inhibitor
transfection. ***P<0.001. si, small interfering RNA;
ETS2, E26 transformation-specific transcription factor 2; NC,
negative control; miR-155, microRNA-155.
Acknowledgements
Not applicable.
Funding
No funding was received.
Availability of data and materials
The datasets used and/or analyzed during the current
study are available from the corresponding author on reasonable
request.
Authors' contributions
XM and JL designed all the experiments and revised
the paper; HS, YC and YZ performed the experiments; and YC and XM
wrote the manuscript. All authors read and approved the final
manuscript.
Ethics approval and consent to
participate
The present study was approved by the Ethics
Committee of Gansu Provincial Hospital and informed consent was
obtained from all participants.
Patient consent for publication
Not applicable.
Competing interests
The authors declare that they have no competing
interests.
References
|
1
|
Forouzanfar MH, Moran A, Phillips D,
Mensah GA, Ezzati M, Naghavi M and Murray Christopher JL:
Prevalence of heart failure by cause in 21 regions: global burden
of diseases, injuries and risk factors-2010 study. Journal of the
American College of Cardiology. 61:E786. 2013.
|
|
2
|
Farré N, Vela E, Clèries M, Bustins M,
Cainzos-Achirica M, Enjuanes C, Moliner P, Ruiz S, Verdú-Rotellar
JM and Comín-Colet J: Real world heart failure epidemiology and
outcome: A population-based analysis of 88,195 patients. PLoS One.
12(e0172745)2017.PubMed/NCBI View Article : Google Scholar
|
|
3
|
Cook C, Cole G, Asaria P, Jabbour R and
Francis DP: The annual global economic burden of heart failure. Int
J Cardiol. 171:368–376. 2014.PubMed/NCBI View Article : Google Scholar
|
|
4
|
Inglis SC, Clark RA, Dierckx R,
Prieto-Merino D and Cleland JGF: Structured telephone support or
non-invasive telemonitoring for patients with heart failure.
Cochrane Database Syst Rev. 10(CD007228)2015.PubMed/NCBI View Article : Google Scholar
|
|
5
|
Pinti MV, Hathaway QA and Hollander JM:
Role of microRNA in metabolic shift during heart failure. Am J
Physiol Heart Circ Physiol. 312:H33–H45. 2017.PubMed/NCBI View Article : Google Scholar
|
|
6
|
Duan Q, Yang L, Gong W, Chaugai S, Wang F,
Chen C, Wang P, Zou MH and Wang DW: MicroRNA-214 is upregulated in
heart failure patients and suppresses XBP1-mediated endothelial
cells angiogenesis. J Cell Physiol. 230:1964–1973. 2015.PubMed/NCBI View Article : Google Scholar
|
|
7
|
Duan Q, Chen C, Yang L, Li N, Gong W, Li S
and Wang DW: MicroRNA regulation of unfolded protein response
transcription factor XBP1 in the progression of cardiac hypertrophy
and heart failure in vivo. J Transl Med. 13(363)2015.PubMed/NCBI View Article : Google Scholar
|
|
8
|
Masson S, Batkai S, Beermann J, Bär C,
Pfanne A, Thum S, Magnoli M, Balconi G, Nicolosi GL, Tavazzi L, et
al: Circulating microRNA-132 levels improve risk prediction for
heart failure hospitalization in patients with chronic heart
failure. Eur J Heart Fail. 20:78–85. 2018.PubMed/NCBI View
Article : Google Scholar
|
|
9
|
Li S, Fan Q, He S, Tang T, Liao Y and Xie
J: MicroRNA-21 negatively regulates Treg cells through a
TGF-β1/Smad-independent pathway in patients with coronary heart
disease. Cell Physiol Biochem. 37:866–878. 2015.PubMed/NCBI View Article : Google Scholar
|
|
10
|
Mcculley DJ and Black BL: Chapter
nine-Transcription Factor Pathways and Congenital Heart Disease.
In: Current Topics in Developmental Biology. Vol 100. Elsevier
Inc., 2012.
|
|
11
|
Bakker ML, Boink GJJ, Boukens BJ, Verkerk
AO, Malou VDB, Den Haan AD, Hoogaars WM, Buermans HP, de Bakker JM,
Seppen J, et al: T-box transcription factor TBX3 reprogrammes
mature cardiac myocytes into pacemaker-like cells. Cardiovasc Res.
94:439–449. 2012.PubMed/NCBI View Article : Google Scholar
|
|
12
|
Courties G, Heidt T, Sebas M, Iwamoto Y,
Jeon D, Truelove J, Tricot B, Wojtkiewicz G, Dutta P, Sager HB, et
al: In vivo silencing of the transcription factor IRF5 reprograms
the macrophage phenotype and improves infarct healing. J Am Coll
Cardiol. 63:1556–1566. 2014.PubMed/NCBI View Article : Google Scholar
|
|
13
|
Maier HJ, Schips TG, Wietelmann A, Krüger
M, Brunner C, Sauter M, Klingel K, Böttger T, Braun T and Wirth T:
Cardiomyocyte-specific IκB kinase (IKK)/NF-κB activation induces
reversible inflammatory cardiomyopathy and heart failure. Proc Natl
Acad Sci USA. 109:11794–11799. 2012.PubMed/NCBI View Article : Google Scholar
|
|
14
|
Smyth GK: Limma: Linear Models for
Microarray Data. In: Bioinformatics and Computational Biology
Solutions Using R and Bioconductor. Gentleman R, Carey VJ, Huber W,
Irizarry RA and Dudoit S (eds). Springer, New York, NY, 2005.
|
|
15
|
Phipson B, Lee S, Majewski IJ, Alexander
WS and Symth GK: Empirical Bayes in the presence of exceptional
cases, with application to microarray data. ScienceOpen, Inc.,
Burlington, MA, 2016.
|
|
16
|
Ogata H, Goto S, Sato K, Fujibuchi W, Bono
H and Kanehisa M: KEGG: Kyoto encyclopedia of genes and genomes.
Nucleic Acids Res. 27:29–34. 1999.PubMed/NCBI View Article : Google Scholar
|
|
17
|
Huang da W, Sherman BT and Lempicki RA:
Systematic and integrative analysis of large gene lists using DAVID
bioinformatics resources. Nat Protoc. 4:44–57. 2009.PubMed/NCBI View Article : Google Scholar
|
|
18
|
Szklarczyk D, Franceschini A, Kuhn M,
Simonovic M, Roth A, Minguez P, Doerks T, Stark M, Muller J, Bork
P, et al: The STRING database in 2011: Functional interaction
networks of proteins, globally integrated and scored. Nucleic Acids
Res. 39:D561–D568. 2011.PubMed/NCBI View Article : Google Scholar
|
|
19
|
Shannon P, Markiel A, Ozier O, Baliga NS,
Wang JT, Ramage D, Amin N, Schwikowski B and Ideker T: Cytoscape: A
software environment for integrated models of biomolecular
interaction networks. Genome Res. 13:2498–2504. 2003.PubMed/NCBI View Article : Google Scholar
|
|
20
|
Bandettini WP, Kellman P, Mancini C,
Booker OJ, Vasu S, Leung SW, Wilson JR, Shanbhag SM, Chen MY and
Arai AE: MultiContrast delayed enhancement (MCODE) improves
detection of subendocardial myocardial infarction by late
gadolinium enhancement cardiovascular magnetic resonance: A
clinical validation study. J Cardiovasc Magn Reson.
14(83)2012.PubMed/NCBI View Article : Google Scholar
|
|
21
|
Wang J, Duncan D, Shi Z and Zhang B:
WEB-based GEne SeT AnaLysis Toolkit (WebGestalt): Update 2013.
Nucleic Acids Res. 41:W77–W83. 2013.PubMed/NCBI View Article : Google Scholar
|
|
22
|
Livak KJ and Schmittgen TD: Analysis of
relative gene expression data using real-time quantitative PCR and
the 2(-Delta Delta C(T)) method. Method. 25:402–408.
2001.PubMed/NCBI View Article : Google Scholar
|
|
23
|
Franics GS and Tang WH: Pathophysiology of
congestive heart failure. Rev Cardiovasc Med. 4 (Suppl 2):S14–S20.
2003.PubMed/NCBI
|
|
24
|
Ziaeian B and Fonarow GC: Epidemiology and
aetiology of heart failure. Nat Rev Cardiol. 13:368–378.
2016.PubMed/NCBI View Article : Google Scholar
|
|
25
|
Marrouche NF, Brachmann J, Andresen D,
Siebles J, Boersma L, Jordaens L, Merkely B, Pokushalov E, Sanders
P, Proff J, et al: Catheter ablation for atrial fibrillation with
heart failure. N Engl J Med. 378:417–427. 2018.PubMed/NCBI View Article : Google Scholar
|
|
26
|
Velazquez EJ, Morrow DA, DeVore AD, Duffy
CI, Ambrosy AP, McCague K, Rocha R and Braunwald E: PIONEER-HF
Investigators. Angiotensin-neprilysin inhibition in acute
decompensated heart failure. N Engl J Med. 380:539–548.
2019.PubMed/NCBI View Article : Google Scholar
|
|
27
|
Caldwell MD, Hu SJ, Viswanathan S,
Bradshaw H, Kelly ME and Straiker A: A GPR18-based signalling
system regulates IOP in murine eye. Br J Pharmacol. 169:834–843.
2013.PubMed/NCBI View Article : Google Scholar
|
|
28
|
Alexander SP: So what do we call GPR18
now? Br J Pharmacol. 165:2411–2413. 2012.PubMed/NCBI View Article : Google Scholar
|
|
29
|
Penumarti A and Abdel-Rahman AA: Role of
central atypical cannabinoid receptor GPR18 in modulating
cardiovascular function. FASEB J. 26: (Suppl 1)(663.10)2012.
|
|
30
|
Penumarti A and Abdel-Rahman AA: Abstract
17612: Central GPR18 mediates hypotension via enhanced
PI3K/AKT-ERK1/2-nNOS signaling and inhibition of cAMP in the
rostral ventrolateral medulla of conscious normotensive rats.
Circulation. 128:A17612. 2013.
|
|
31
|
Sheydina A, Volkova M, Jiang L, Juhasz O,
Zhang J, Tae HJ, Perino MG, Wang M, Zhu Y, Lakatta EG and Boheler
KR: Linkage of cardiac gene expression profiles and ETS2 with
lifespan variability in rats. Aging Cell. 11:350–359.
2012.PubMed/NCBI View Article : Google Scholar
|
|
32
|
Islas JF, Liu Y, Weng KC, Robertson MJ,
Zhang S, Prejusa A, Harger J, Tikhomirova D, Chopra M, Iyer D, et
al: Transcription factors ETS2 and MESP1 transdifferentiate human
dermal fibroblasts into cardiac progenitors. Proc Natl Acad Sci
USA. 109:13016–13021. 2012.PubMed/NCBI View Article : Google Scholar
|
|
33
|
Schwartz RJ, Potaman VN and Francisco IJ:
Ets2 and Mesp1 generate cardiac progenitors from fibroblasts. US
Patent 9109232. Filed June 12, 2013; issued August 18, 2015.
|
|
34
|
Rowell J, Koitabashi N, Kass DA and Barth
AS: Dynamic gene expression patterns in animal models of early and
late heart failure reveal biphasic-bidirectional transcriptional
activation of signaling pathways. Physiol Genomics. 46:779–787.
2014.PubMed/NCBI View Article : Google Scholar
|
|
35
|
Czyzyk-Krzeska MF and Zhang X: MiR-155 at
the heart of oncogenic pathways. Oncogene. 33:677–678.
2014.PubMed/NCBI View Article : Google Scholar
|
|
36
|
Bao JL and Lin L: MiR-155 and miR-148a
reduce cardiac injury by inhibiting NF-κB pathway during acute
viral myocarditis. Eur Rev Med Pharmacol Sci. 18:2349–2356.
2014.PubMed/NCBI
|
|
37
|
Blanco RR, Austin H, Vest RN III, Valadri
R, Li W, Lassegue B, Song Q, London B, Dudley SC, Bloom HL, et al:
Angiotensin receptor type 1 single nucleotide polymorphism A1166C
is associated with malignant arrhythmias and altered circulating
miR-155 levels in patients with chronic heart failure. J Card Fail.
18:717–723. 2012.PubMed/NCBI View Article : Google Scholar
|
|
38
|
Matsumoto S, Sakata Y, Nakatani D, Suna S,
Mizuno H, Shimizu M, Usami M, Sasaki T, Sato H, Kawahara Y, et al:
A subset of circulating microRNAs are predictive for cardiac death
after discharge for acute myocardial infarction. Biochem Biophys
Res Commun. 427:280–284. 2012.PubMed/NCBI View Article : Google Scholar
|