Introduction
Osteoporosis is a common bone disorder characterized
by excessive bone resorption and insufficient formation of new
bone, leading to reduced bone function and increased risk of
fracture (1-3).
Among several subtypes of osteoporosis, post-menopausal
osteoporosis (PMOP) affects 9-38% of females and accounts for a
large proportion of the total osteoporotic population (4,5). PMOP is
a chronic disease with high prevalence among post-menopausal
females. Therefore, PMOP has been considered a major public health
concern during the last decades (6,7).
Long non-coding RNAs (lncRNAs) are evolutionarily
conserved molecules that have been extensively studied due to their
significant role in various biological processes, including signal
transduction, cell growth and apoptosis (8-10).
Recently, the expression levels of several specific lncRNAs,
including lncRNA DANCR and lncRNA MEG3, were reported to be
dysregulated in patients with PMOP and to be associated with
disease progression (11,12). Although the majority of previous
studies have focused on the function of specific lncRNAs,
aberrations in lncRNA expression profiles associated with the
pathogenesis of PMOP have been rarely investigated. In a previous
study, the lncRNA expression profiles in PMOP were assessed using
RNA sequencing and a total of 51 dysregulated lncRNAs were
identified in patients with PMOP (13). However, the sample size of the study
was relatively small (3 PMOP and 2 control samples), suggesting
that the results were sensitive to noise and had low statistical
power. Therefore, the lncRNA expression profiles in PMOP should be
further investigated. The present study aimed to explore the
implication of aberrant lncRNAs in the pathogenesis of PMOP by
analyzing expression profiles.
Materials and methods
Patients
A total of 10 patients with PMOP who were treated at
the Union Hospital (Tongji Medical College, Huazhong University of
Science and Technology, Wuhan, China) between January and May 2018
were enrolled in the present study. The inclusion criteria were as
follows: i) Post-menopausal females; and ii) diagnosis of
osteoporosis according to the World Health Organization (WHO)
criteria (14). The diagnostic
cut-off for osteoporosis, based on WHO guidelines, is defined as
the bone mineral density (BMD) T-score being 2.5 standard
deviations (SD) below the average value of a young adult, at the
femoral neck, total hip or lumbar spine (L1-L4). The exclusion
criteria were as follows: i) History of diseases affecting bone
metabolism, including osteomalacia, hyperparathyroidism,
hyperthyroidism, hypothyroidism, rheumatoid arthritis,
hypercortisolism, chronic renal insufficiency and cancer; ii)
history of diabetes mellitus; and iii) previous treatment with
drugs affecting bone metabolism, including glucocorticoids,
estrogens and fluorides. In addition, 10 age-matched healthy
females who served as the control group were enrolled in the
present study. The inclusion criteria of the control group were: i)
Post-menopausal females; and ii) femoral neck, total hip or spinal
L1-L4 BMD T-score ≥-1.0 SD. The exclusion criteria were as follows:
i) History of diseases affecting bone metabolism, including
osteomalacia, hyperparathyroidism, hyperthyroidism, hypothyroidism,
rheumatoid arthritis, hypercortisolism, chronic renal insufficiency
and cancer; ii) history of diabetes mellitus; and iii) previous
treatment with drugs affecting bone metabolism, including
glucocorticoids, estrogens and fluorides.
Samples
Peripheral whole blood samples were collected from
all subjects and the peripheral blood mononuclear cells (PBMCs)
were isolated by centrifugation according to standard methods.
RNA sequencing
Total RNA was extracted from PBMCs using TRIzol
reagent (Invitrogen; Thermo Fisher Scientific, Inc.). Subsequently,
the concentration, purity and integrity of the isolated RNA were
measured and adjusted. Ribosomal RNA (rRNA) was removed from the
total RNA using a Ribo-Zero™ rRNA Removal Kit (Epicentre; Illumina,
Inc.) and the rRNA-depleted RNAs were used to construct the
sequencing library. The first and second strand of the
complementary DNA (cDNA) were synthesized and the library fragments
were purified using the AMPure XP system (Beckman Coulter, Inc.).
The cDNA fragments, preferentially 150-200 base pairs in length,
were selected. The quality of the library was assessed by PCR on
the Bioanalyzer 2100 system (Agilent Technologies, Inc.). The
clustering of index-coded samples was subsequently performed using
the HiSeq PE Cluster Kit v4 cBot and the library was sequenced on
the Illumina Hiseq X10 platform (both from Illumina, Inc.).
Subsequently, 150 bp paired-end reads were produced following
cluster generation. Automated quality control and adapter trimming
were then performed using Trim Galore, Cutadapt and FastQC
software. Finally, the trimmed reads were mapped to the human
genome Hg38 by HISAT2 using the default parameters, followed by
mapping of the quality control using the RSeQC software. The read
counts of lncRNAs and mRNAs were subsequently calculated using
feature Counts based on the annotation file
(Homo_sapiens.GRCh38.83.gtf) of the Ensembl database (http://www.ensembl.org).
Bioinformatics analysis
LncRNAs and mRNAs that were identified in >50% of
the samples (at least 10 samples) were subjected to bioinformatics
analysis using the R software (version 3.5.3; Lucent Technologies).
Subsequently, the following analyses were performed: i) Principal
component analysis (PCA) of lncRNA and mRNA expression profiles was
performed using the Stats package. ii) Heatmap analysis of lncRNA
and mRNA expression profiles was performed using the Pheatmap
package. iii) Dysregulated lncRNAs and mRNAs were analyzed using
the DeSeq2 package and were visualized in Volcano plots. An
adjusted P-value of <0.05 and a fold change (FC) of >2.0
according to |log2FC|>1, were considered to indicate
a statistically and biologically significant difference,
respectively. iv) Heatmap analysis of the dysregulated lncRNAs and
mRNAs was performed using the Pheatmap package. v) Gene Ontology
(GO) and Kyoto Encyclopedia of Genes and Genomes (KEGG) enrichment
analyses of the dysregulated lncRNAs and mRNAs were performed using
the DAVID tool. A cut-off criterion of P<0.05 was used to
indicate significant differences (significant enrichment by the
differentially expressed RNAs, or the co-expressed genes of the
core/hub RNAs identified) for the GO terms and KEGG pathways. The
top 30 significantly enriched GO terms, including the top 10 terms
in the categories biological process, cellular component and
molecular function, and the KEGG pathways, were determined in the
present study. If <30 significantly enriched terms were
obtained, all of them were presented. vi) The gene transcription
and regulation data were visualized with a Circos plot using the
RCircos package. In the present study, the cis-regulatory lncRNAs
were defined as lncRNAs that acted within or overlapped with up to
300 kb of the mRNA gene, while the trans-regulatory lncRNAs were
defined as the lncRNA molecules that acted beyond 300 kb in the
genomic distance. These definitions were based on the chromosomal
association of the lncRNAs with the mRNA molecules. Correlation
coefficients of >0.95 were considered to indicate a significant
correlation between lncRNAs and mRNAs.
Results
Characteristics
The mean age was 63.3±5.2 and 61.5±6.6 years and the
body mass index (BMI) was 21.1±2.3 and 22.0±2.5 kg/m2
for the PMOP patients and controls, respectively (Table I). No significant differences were
noted in the parameters age (P=0.507) and BMI (P=0.413) between
PMOP patients and control subjects. However, increased BMD-T scores
were noted in the femoral neck (-3.18±0.39 vs. 0.49±0.61,
P<0.001), hip (-3.03±0.46 vs. 0.71±0.95, P<0.001) and lumbar
spine L1-L4 (-3.26±0.42 vs. 0.79±0.98, P<0.001) in PMOP patients
compared with those in control subjects (Table I).
 | Table ICharacteristics of patients with PMOP
and controls. |
Table I
Characteristics of patients with PMOP
and controls.
| Parameter | PMOP (n=10) | Controls (n=10) | P-value |
|---|
| Age (years) | 63.3±5.2 | 61.5±6.6 | 0.507 |
| BMI
(kg/m2) | 21.1±2.3 | 22.0±2.5 | 0.413 |
| BMD-T score |
|
Femoral
neck | -3.18±0.39 | 0.49±0.61 | <0.001 |
|
Hip | -3.03±0.46 | 0.71±0.95 | <0.001 |
|
L1-L4 | -3.26±0.42 | 0.79±0.98 | <0.001 |
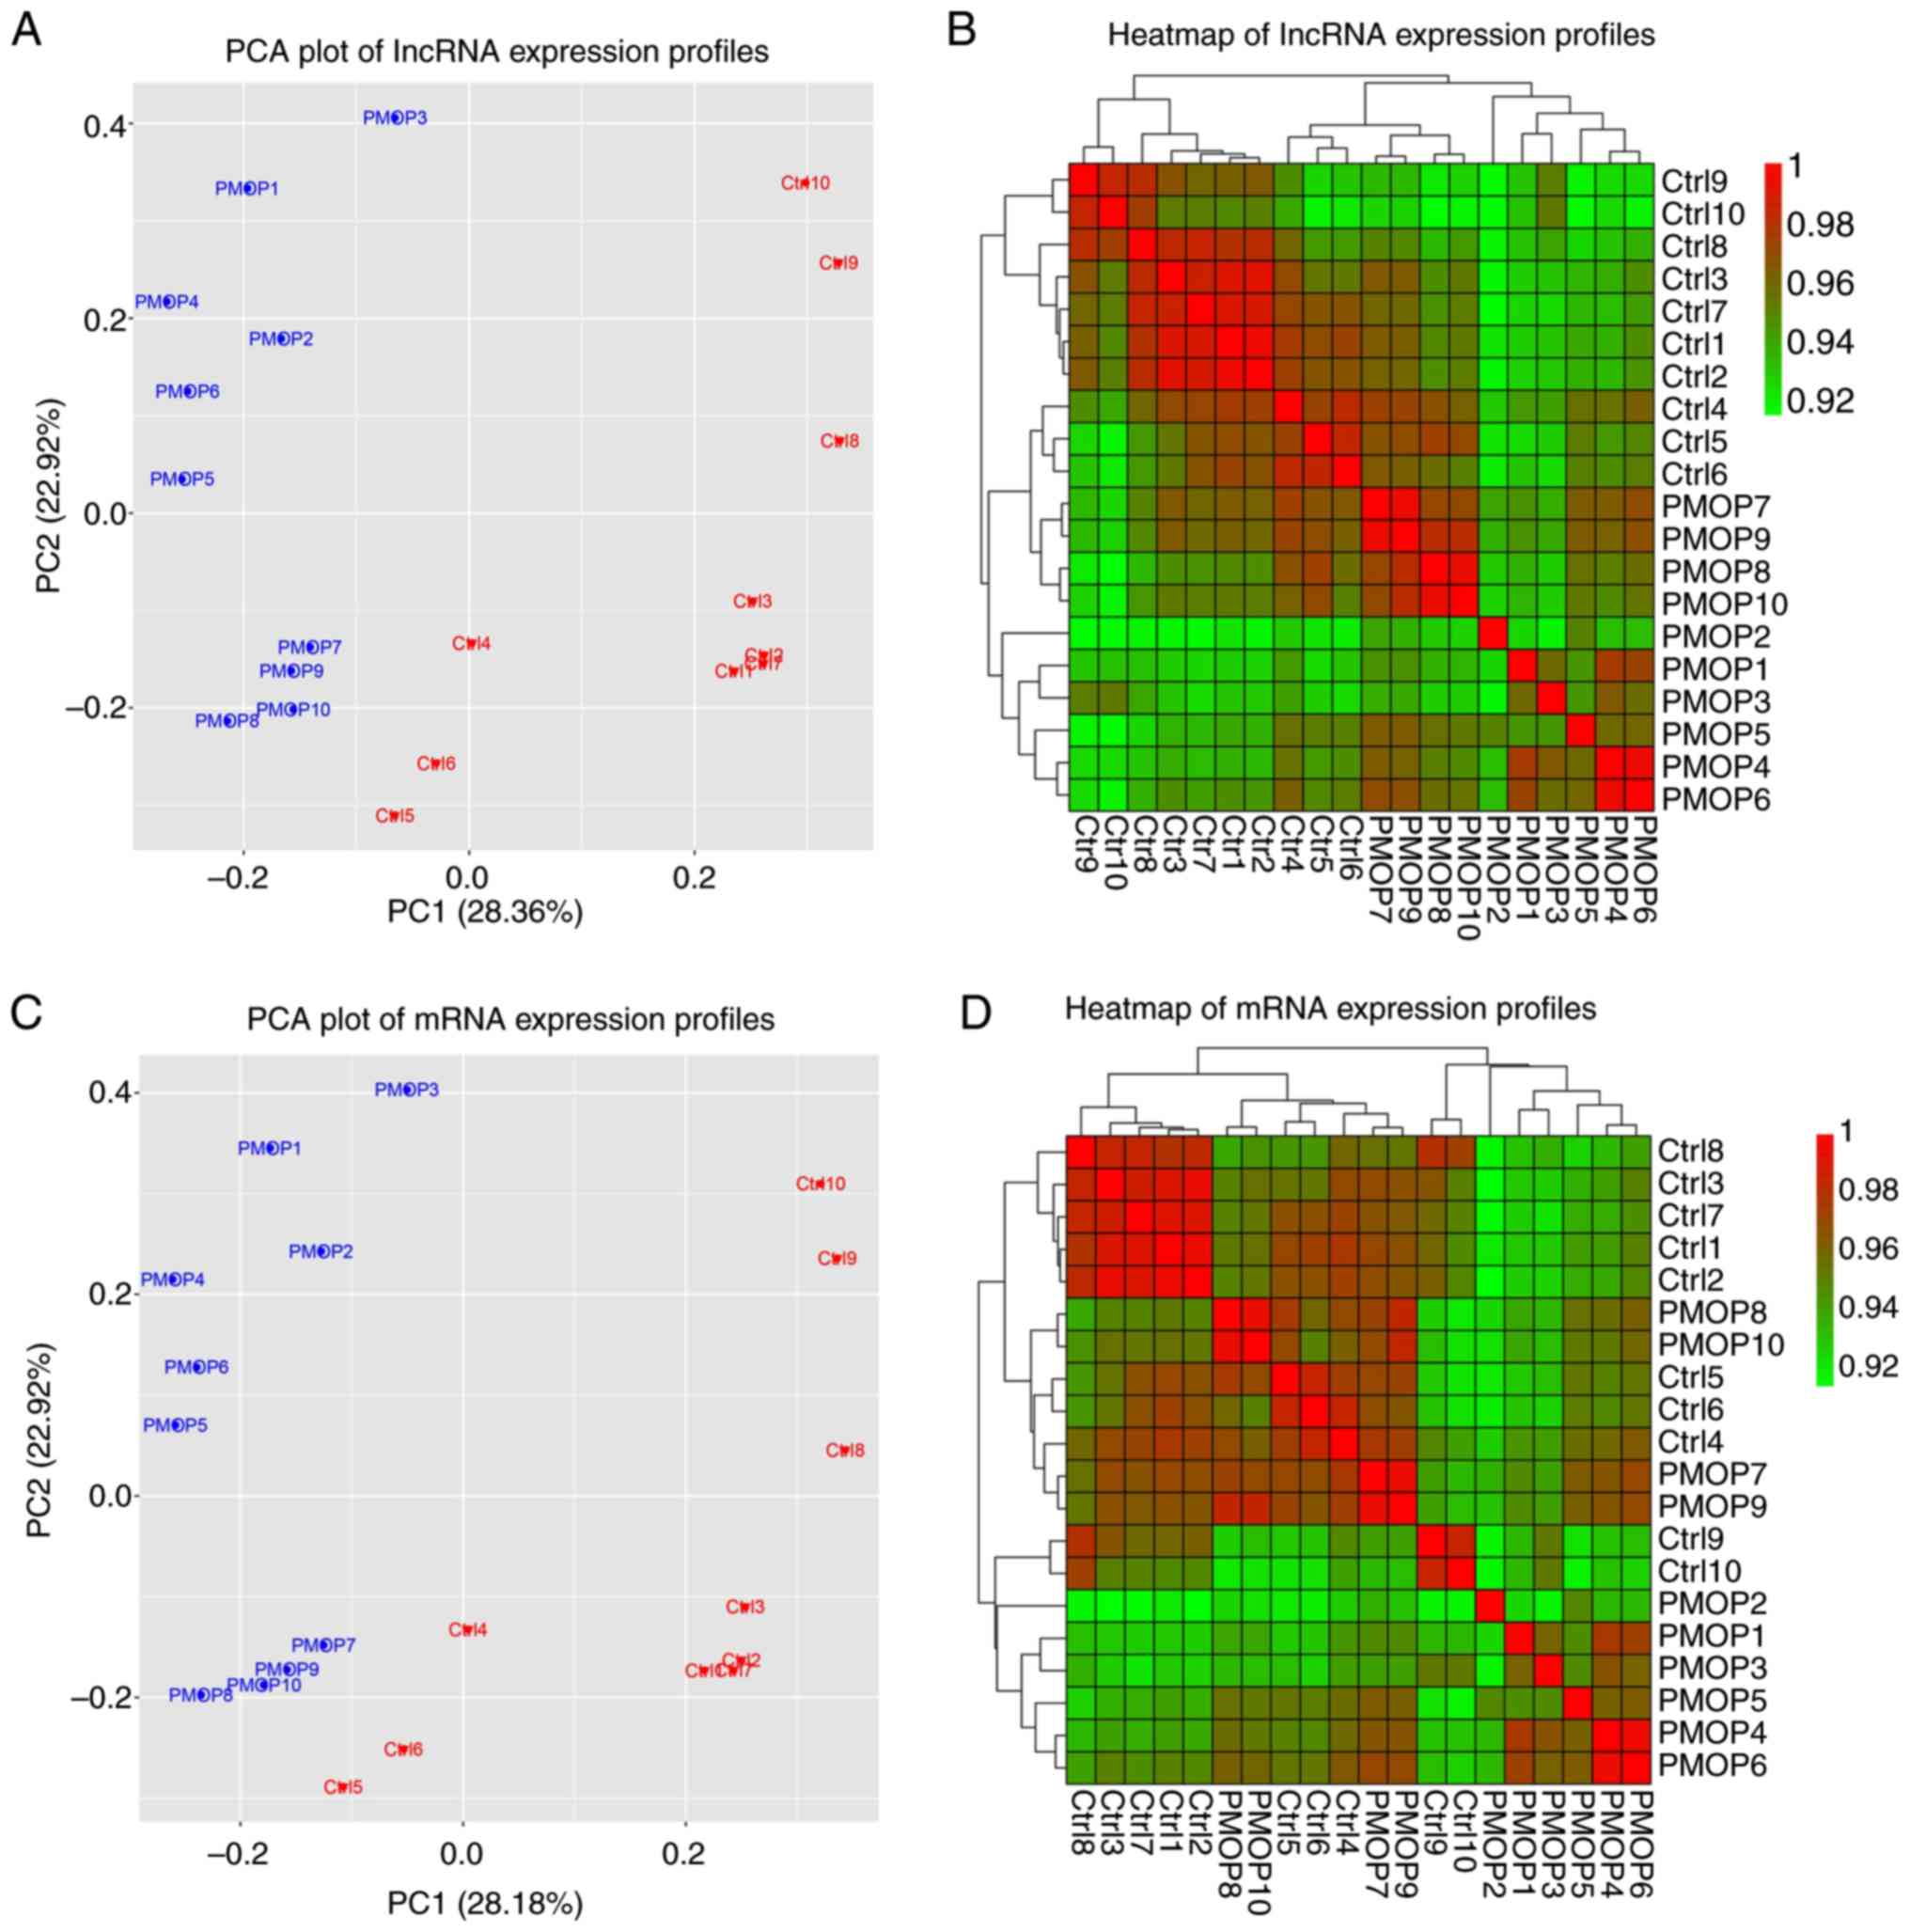
PCA plot and heatmap analyses of
lncRNA and mRNA expression profiles
Fig. 1 presents the
results of the lncRNA and mRNA expression profile analysis. PCA
plots are provided in Fig. 1A and
C and heatmaps are displayed in
Fig. 1B and D. The data revealed differential expression
profiles between PMOP patients and the control group. These results
suggested that lncRNA and mRNA expression profiles may be used to
discriminate PMOP patients from healthy control subjects.
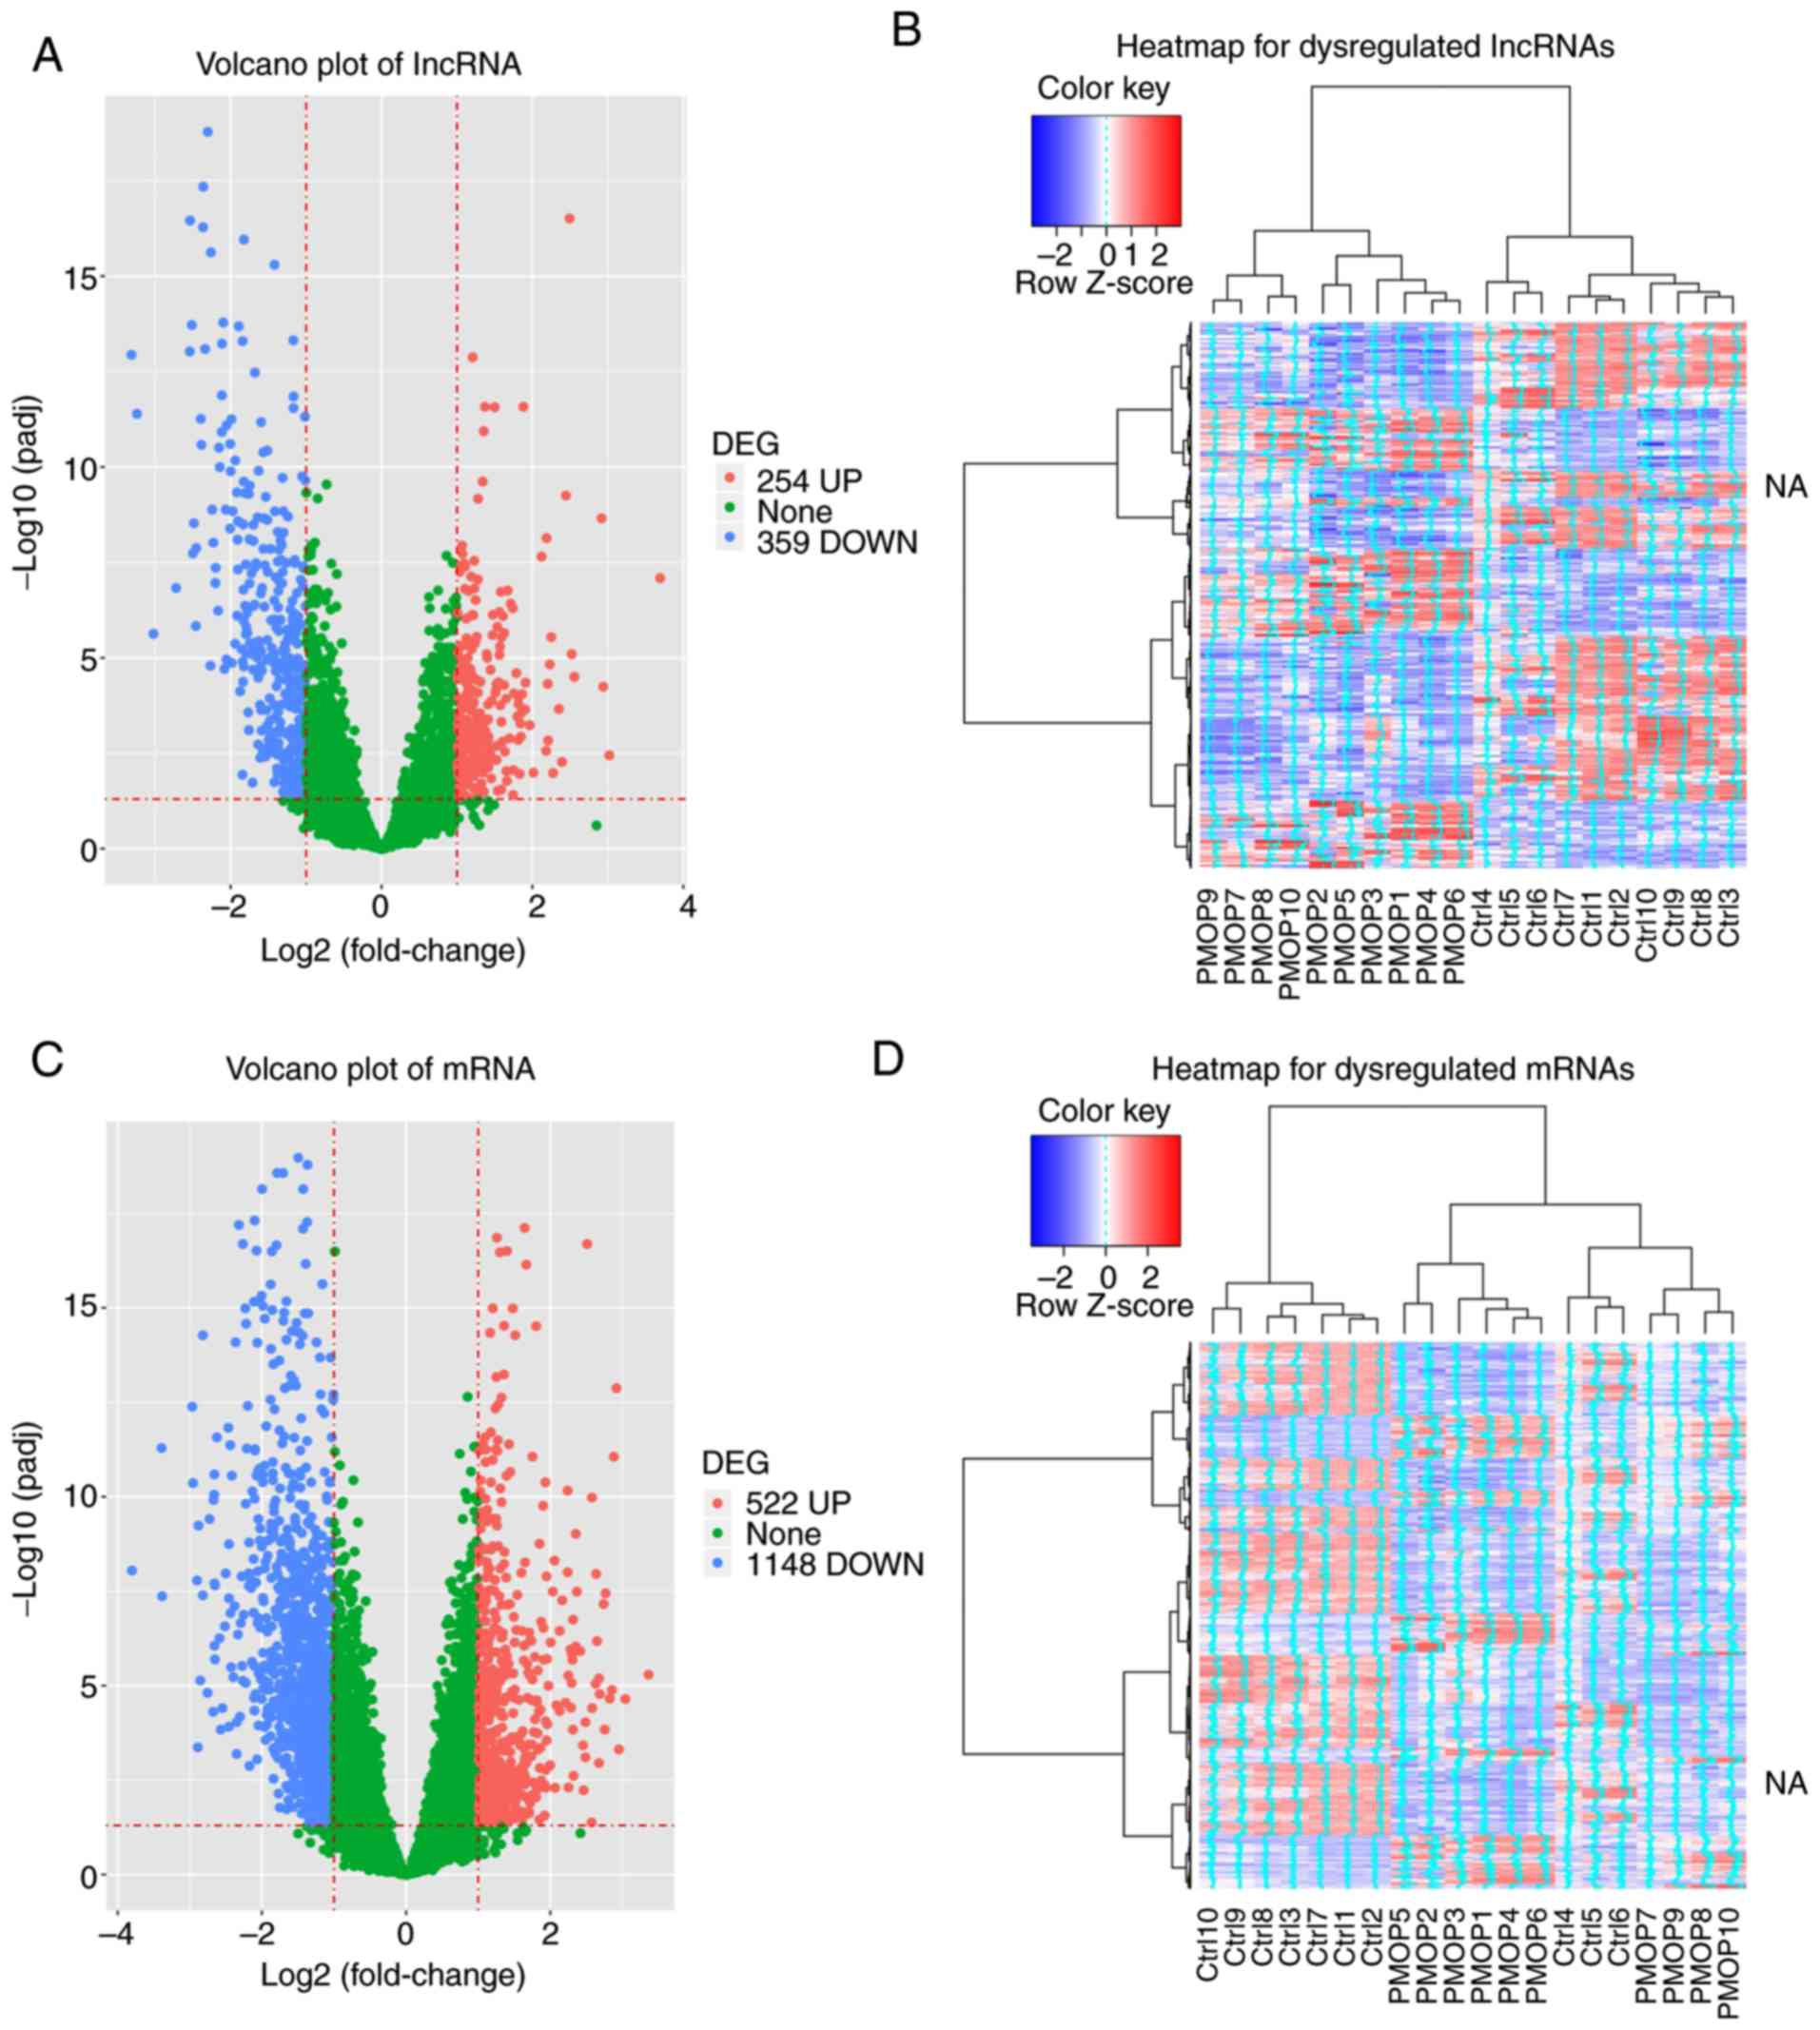
Volcano plot and heatmap analyses of
dysregulated lncRNAs and mRNAs
The volcano plot comprising 254 upregulated and 359
downregulated lncRNAs in patients with PMOP compared with those in
the control group is provided in Fig.
2A. In the heatmap, patients with PMOP and control subjects
were clustered separately based on the dysregulated expression of
the lncRNAs (Fig. 2B). In addition,
522 upregulated and 1,148 downregulated mRNAs in patients with PMOP
compared with those of the control group were revealed in the
volcano plot (Fig. 2C), further
suggesting a clustering capability of the two groups based on the
expression of the dysregulated mRNAs as indicated in the heatmap
(Fig. 2D).
GO and KEGG enrichment analyses for
dysregulated lncRNAs and mRNAs
Enrichment analyses were performed to identify the
possible implications of the dysregulated lncRNAs and mRNAs in the
relevant GO terms and signaling pathways. GO enrichment analysis
indicated that the dysregulated lncRNAs were accumulated in various
terms in the category biological process, including the apoptotic
process and positive regulation of NF-κB signaling, as well as
terms in the category cellular component, including cytosol and
nucleoplasm, and terms in the category molecular function, e.g.
protein binding and transcription factor activity (Fig. 3A). KEGG pathway analysis revealed
that the dysregulated lncRNAs were mainly involved in
PMOP-associated signaling pathways, including osteoclast
differentiation and tumor necrosis factor (TNF) and
mitogen-activated protein kinase (MAPK) signaling pathways
(Fig. 3B). In addition, the GO
enrichment analysis revealed that the dysregulated mRNAs were
accumulated in terms in the category biological function, including
apoptosis and protein phosphorylation, as well as terms in the
category cellular component, including cytosol and membrane, and in
terms in the category molecular function, e.g. metal ion and ATP
binding (Fig. 3C). Finally, the KEGG
pathway analysis revealed that the dysregulated mRNAs were highly
associated with PMOP-associated signaling pathways in patients with
diabetic complications, including osteoclast differentiation,
vascular endothelial growth factor and the advanced glycation end
products (AGE)/receptor for AGE (RAGE) signaling pathways (Fig. 3D).
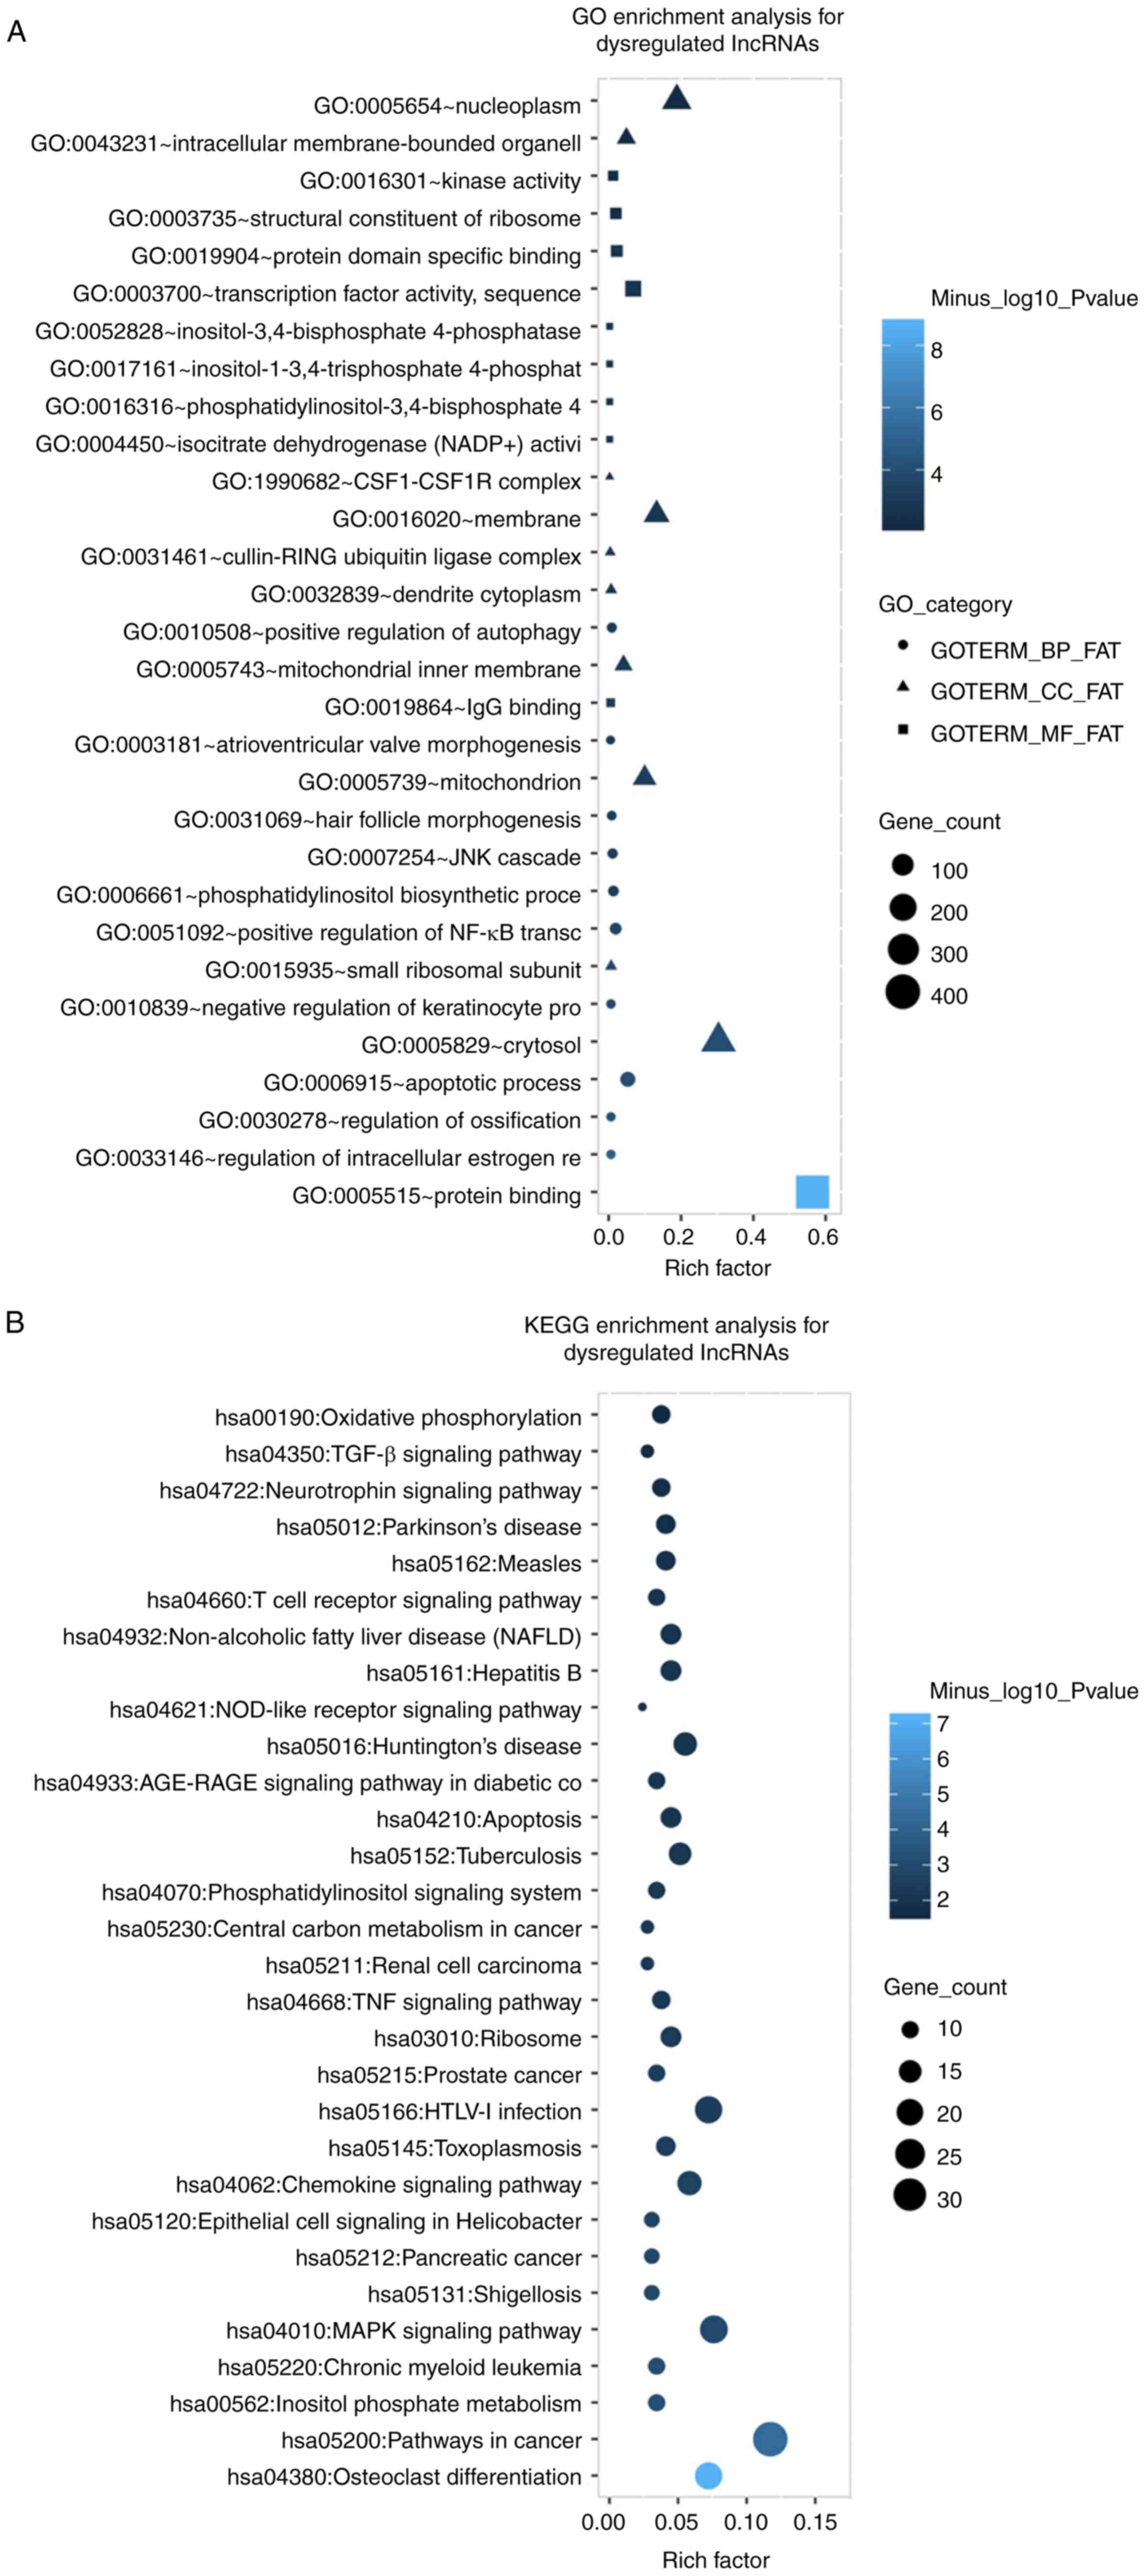 | Figure 3Functional enrichment analysis of
dysregulated lncRNAs and mRNAs. (A) GO enrichment analysis of the
dysregulated lncRNAs. (B) KEGG enrichment analysis of the
dysregulated lncRNAs. (C) GO enrichment analysis of the
dysregulated mRNAs. (D) KEGG enrichment analysis of the
dysregulated mRNAs. Enrichment analyses of dysregulated lncRNAs and
mRNAs were performed using the DAVID online tool. FAT: a filter
applied to remove very broad terms; BP, biological process; CC,
cellular component; MF, molecular function; TNF, tumor necrosis
factor; RAGE, receptor for advanced glycation endproducts; CSF1R,
colony-stimulating factor 1 receptor; TGF, transforming growth
factor; VEGF, vascular endothelial growth factor; lncRNA, long
non-coding RNA; GO, Gene Ontology; KEGG, Kyoto Encyclopedia of
Genes and Genomes; MAPK, mitogen-activated protein kinase; hsa,
Homo sapiens. |
Top 20 upregulated and 20
downregulated lncRNAs
The characteristics of the top 20 upregulated and
downregulated lncRNAs in patients with PMOP are presented in
Table II. The top 20 upregulated
lncRNAs were as follows: RP11-704M14.1, RP11-754N21.1,
RP11-408E5.5, ANKRD26P3, TPTEP1, LINC01468, RP11-556E13.1,
AE000661.37, RP11-384P7.7, HMGB1P41, MRPL42P6, CASC15, PWAR6,
RP11-701H24.8, CTB-78O21.1, RP11-214K3.19, AC104088.1, MIR99AHG,
RP1-34H18.1 and LINC00890, whereas the top 20 downregulated lncRNAs
were as follows: RP11-310E22.4, RP11-326K13.4, FABP5P1, SERPINB9P1,
RPL13P2, EEF1DP2, RP11-529H2.2, MIR3180-2, LINC00672,
RP11-1148L6.9, CTC-137K3.1, FLJ45079, RP11-93O17.2, LINC01481,
NCF1B, CTD-2023M8.1, RP11-867G23.8, RP11-498C9.15, CTD-3126B10.4
and CTB-35F21.1.
| Table IITop 20 upregulated and 20
downregulated lncRNAs in patients with PMOP compared to
controls. |
Table II
Top 20 upregulated and 20
downregulated lncRNAs in patients with PMOP compared to
controls.
| A, Upregulated
lncRNAs |
|---|
| Gene symbol | Gene ID | Chromosomal
location |
Log2FC | P-value | Padj |
|---|
| RP11-704M14.1 | ENSG00000250696 | 4 | 3.692493 |
2.53x10⁻⁹ |
8.01x10⁻⁸ |
| RP11-754N21.1 | ENSG00000258084 | 12 | 3.018311 |
7.37x10⁻⁴ |
3.517x10⁻³ |
| RP11-408E5.5 | ENSG00000232243 | 13 | 2.940108 |
5.41x10⁻⁶ |
5.63x10⁻⁵ |
| ANKRD26P3 | ENSG00000237636 | 13 | 2.917439 |
3.72x10⁻¹¹ |
2.17x10⁻⁹ |
| TPTEP1 | ENSG00000100181 | 22 | 2.55805 |
2.64x10⁻⁶ |
3.1x10⁻⁵ |
| LINC01468 | ENSG00000231131 | 10 | 2.522501 |
5.18x10⁻⁷ |
7.83x10⁻⁶ |
| RP11-556E13.1 | ENSG00000228651 | 10 | 2.494046 |
5.99x10⁻²⁰ |
3.05x10⁻¹⁷ |
| AE000661.37 | ENSG00000251002 | 14 | 2.444645 |
8.08x10⁻¹² |
5.63x10⁻¹⁰ |
| RP11-384P7.7 | ENSG00000260947 | 9 | 2.393043 |
1.186x10⁻³ |
5.224x10⁻³ |
| HMGB1P41 | ENSG00000253516 | 8 | 2.352494 |
2.63x10⁻⁵ |
2.19x10⁻⁴ |
| MRPL42P6 | ENSG00000242810 | 3 | 2.275756 |
2.704x10⁻³ |
1.0281x10⁻² |
| CASC15 |
ENSG00000272168 | 6 | 2.250902 |
1.6x10⁻⁷ |
2.86x10⁻⁶ |
| PWAR6 |
ENSG00000257151 | 15 | 2.232163 |
1.08x10⁻⁶ |
1.46x10⁻⁵ |
| RP11-701H24.8 |
ENSG00000270246 | 15 | 2.209787 |
2.51x10⁻⁴ |
1.446x10⁻³ |
| CTB-78O21.1 |
ENSG00000249363 | 5 | 2.204651 |
4.43x10⁻⁶ |
4.75x10⁻⁵ |
| RP11-214K3.19 |
ENSG00000270061 | 12 | 2.187844 |
1.47x10⁻¹⁰ |
7.17x10⁻⁹ |
| AC104088.1 |
ENSG00000232555 | 2 | 2.181118 |
5.27x10⁻⁴ |
2.688x10⁻³ |
| MIR99AHG |
ENSG00000215386 | 21 | 2.122705 |
5.44x10⁻¹⁰ |
2.21x10⁻⁸ |
| RP1-34H18.1 |
ENSG00000231121 | 12 | 2.013722 |
2.646x10⁻³ |
1.0099x10⁻² |
| LINC00890 |
ENSG00000260802 | X | 1.964715 |
8.19x10⁻⁵ |
5.71x10⁻⁴ |
| B, Downregulated
lncRNAs |
| Gene symbol | Gene ID | Chromosomal
location |
Log2FC | P-value |
Padj |
| RP11-310E22.4 |
ENSG00000234026 | 10 | -3.31587 |
5.97x10⁻¹⁶ |
1.13x10⁻¹³ |
| RP11-326K13.4 |
ENSG00000263823 | 18 | -3.24126 |
2.91x10⁻¹⁴ |
4x10-12 |
| FABP5P1 |
ENSG00000236972 | 13 | -3.02139 |
1.27x10⁻⁷ |
2.34x10⁻⁶ |
| SERPINB9P1 |
ENSG00000230438 | 6 | -2.72421 |
5.05x10⁻⁹ |
1.49x10⁻⁷ |
| RPL13P2 |
ENSG00000213820 | 20 | -2.53959 |
4.73x10⁻¹⁶ |
9.27x10⁻¹⁴ |
| EEF1DP2 |
ENSG00000226721 | 9 | -2.53635 |
7.67x10⁻²⁰ |
3.44x10⁻¹⁷ |
| RP11-529H2.2 |
ENSG00000255723 | 4 | -2.51381 |
8.33x10⁻¹⁷ |
1.91x10⁻¹⁴ |
| MIR3180-2 |
ENSG00000257366 | 16 | -2.4977 |
4.34x10⁻¹⁰ |
1.81x10⁻⁸ |
| LINC00672 |
ENSG00000263874 | 17 | -2.48497 |
5.27x10⁻¹¹ |
2.95x10⁻⁹ |
| RP11-1148L6.9 |
ENSG00000204620 | X | -2.46017 |
7.42x10⁻⁸ |
1.47x10⁻⁶ |
| CTC-137K3.1 |
ENSG00000270137 | 8 | -2.4554 |
2.97x10⁻¹⁰ |
1.31x10⁻⁸ |
| FLJ45079 |
ENSG00000204283 | 17 | -2.39574 |
4.27x10⁻¹⁴ |
5.47x10⁻¹² |
| RP11-93O17.2 |
ENSG00000206356 | 5 | -2.38807 |
2.47x10⁻¹³ |
2.58x10⁻¹¹ |
| LINC01481 |
ENSG00000257613 | 12 | -2.36361 |
1.17x10⁻¹⁹ |
5.12x10⁻¹⁷ |
| NCF1B |
ENSG00000182487 | 7 | -2.36149 |
6.22x10⁻²¹ |
4.5x10⁻¹⁸ |
| CTD-2023M8.1 |
ENSG00000248693 | 5 | -2.3384 |
3.98x10⁻¹⁶ |
7.96x10⁻¹⁴ |
| RP11-867G23.8 |
ENSG00000255468 | 11 | -2.30296 |
1.82x10⁻²² |
1.63x10⁻¹⁹ |
| RP11-498C9.15 |
ENSG00000263731 | 17 | -2.26584 |
1.19x10⁻⁶ |
1.58x10⁻⁵ |
| CTD-3126B10.4 |
ENSG00000260176 | 16 | -2.26079 |
6.1x10⁻¹⁹ |
2.39x10⁻¹⁶ |
| CTB-35F21.1 |
ENSG00000249526 | 5 | -2.24419 |
2.01x10⁻¹¹ |
1.29x10⁻⁹ |
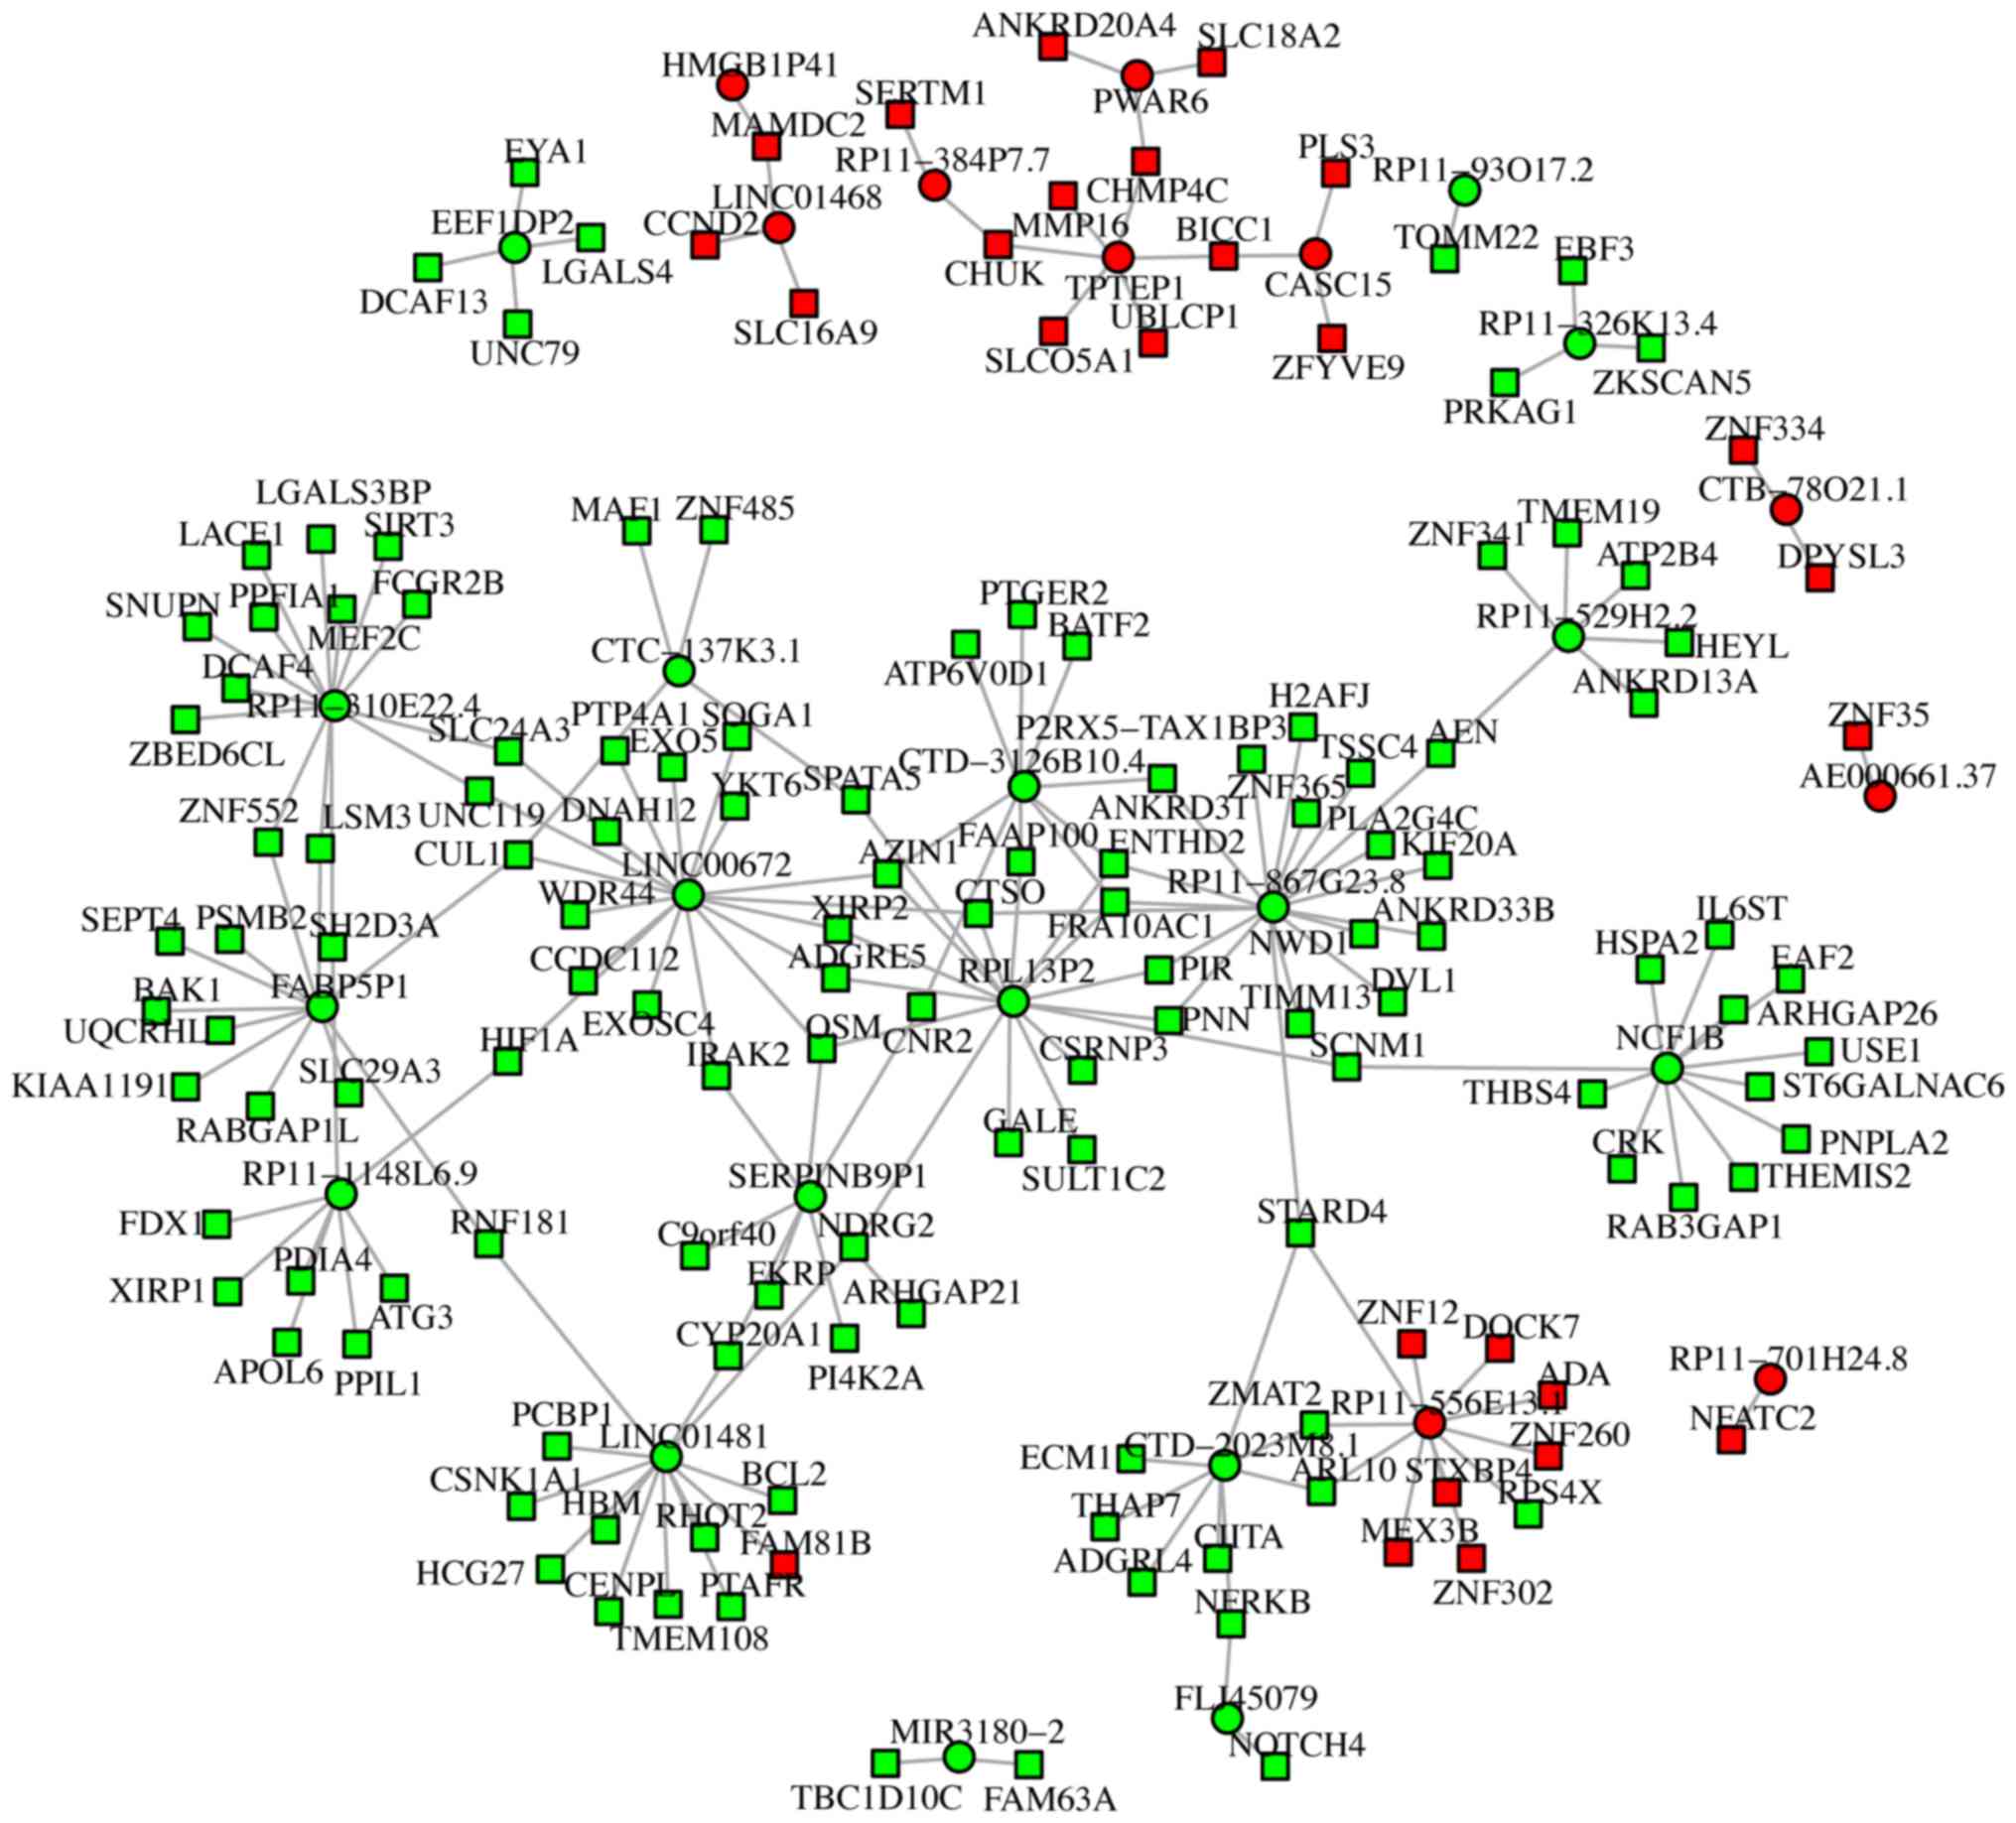
Regulatory network of the top 20 up-
and downregulated lncRNAs
The top 20 up- and downregulated lncRNAs were
recorded. According to the target gene search criteria of the cis
and trans lncRNAs, all lncRNAs identified at least one target mRNA.
The regulatory network based on these results for the 10
upregulated and 18 downregulated lncRNAs is presented in Fig. 4. The regulatory network was generated
and examined to further increase the understanding of the
association between the dysregulated lncRNAs and target mRNAs. All
mRNAs that were differentially expressed and were closely
correlated with dysregulated lncRNAs were selected. A total of 25
lncRNAs were demonstrated to directly regulate mRNAs gene
expression levels. Furthermore, the majority of the lncRNAs exerted
a positive regulatory effect on gene expression. In addition, among
the predicted 25 lncRNAs, 13 were indicated to directly regulate
the expression of >3 mRNAs, while the remaining 12 were
demonstrated to regulate the expression of <3 mRNAs (Fig. 4).
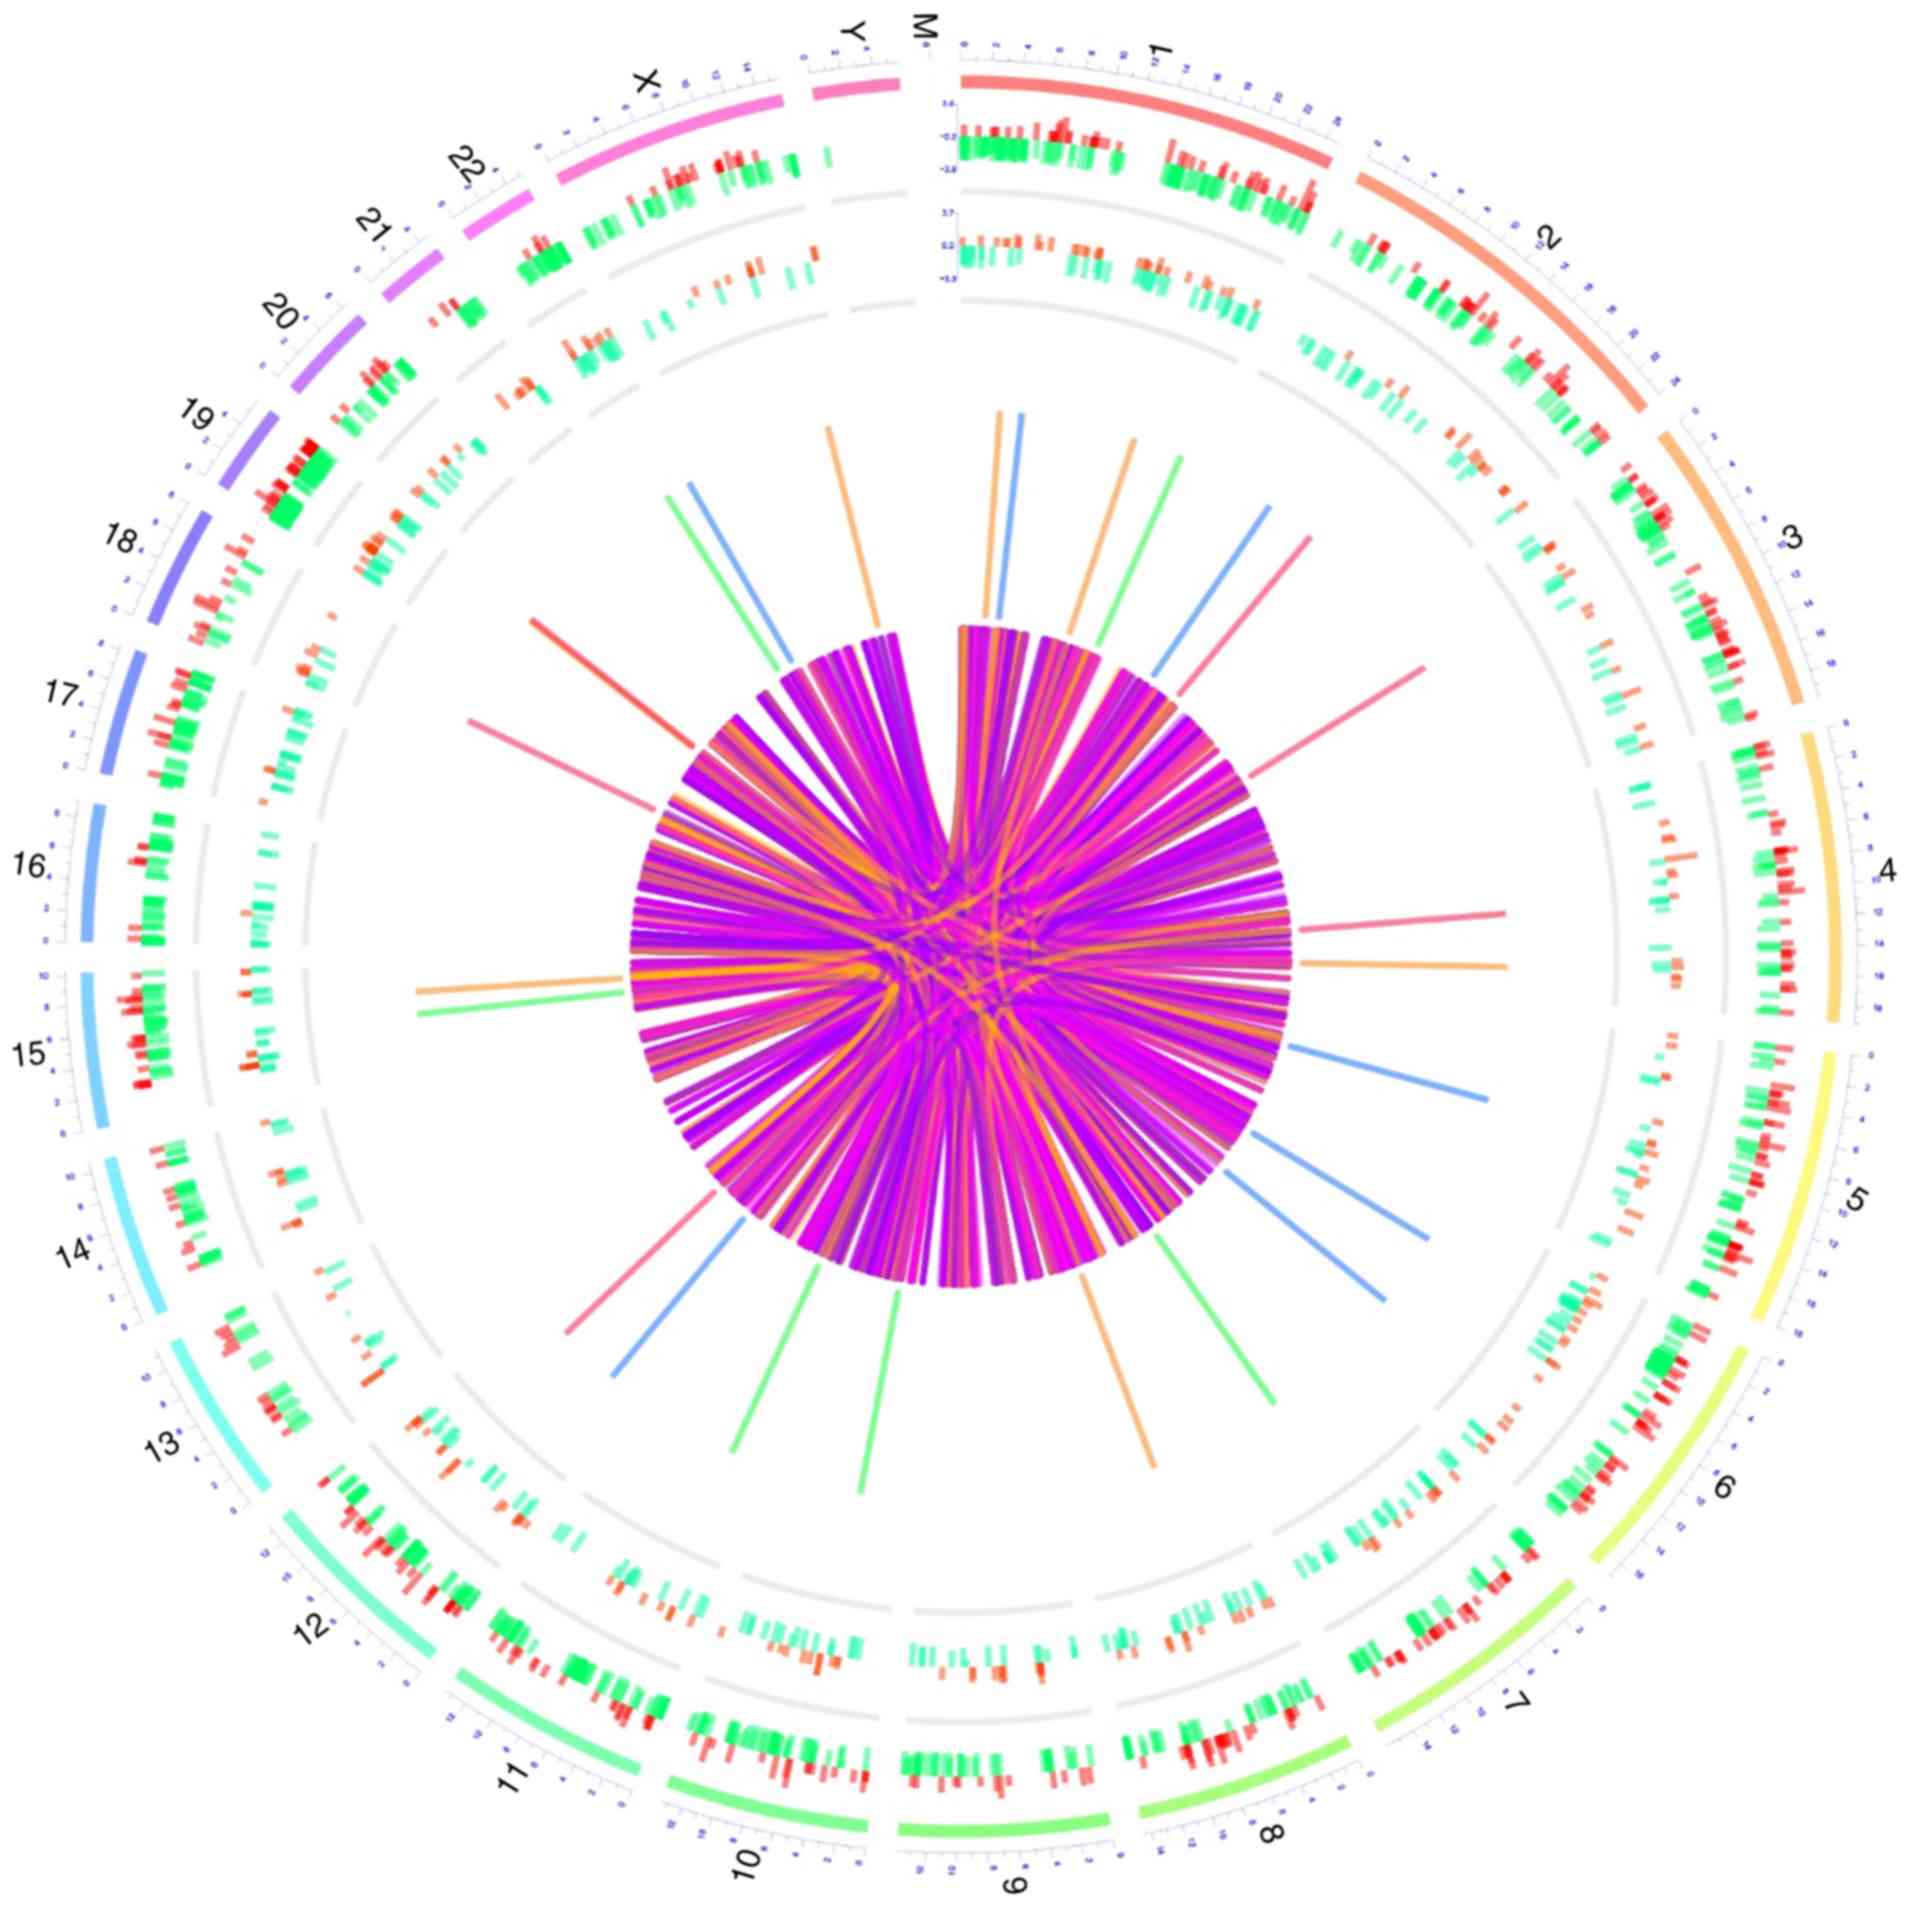
Circos graph
The roles of the dysregulated lncRNAs and mRNAs in
the pathology of PMOP were displayed in the Circos plots (Fig. 5). The outermost layer of the Circos
plot indicates the chromosome number. The second and third
outermost layers represent all differentially expressed mRNAs and
lncRNAs, respectively. Finally, the inner lines represent the cis
or trans lncRNA actions on the target mRNAs (Fig. 5).
Discussion
In the present study, the lncRNA expression profiles
in patients with PMOP were investigated. A total of 254 upregulated
and 359 downregulated lncRNAs were identified in patients with PMOP
compared with those in the control group. GO enrichment analysis
revealed that the dysregulated lncRNAs were implicated in several
GO terms in the category biological process, including apoptosis
and positive regulation of NF-κB signaling. The implication of the
dysregulated lncRNAs in the PMOP-associated signaling pathways was
assessed using KEGG pathway analysis. The results suggested that
the differentially expressed lncRNAs were accumulated in
PMOP-associated signaling pathways, including osteoclast
differentiation, as well as TNF and MAPK signaling pathways.
Aberrant gene expression profiles have been observed
in various diseases, suggesting their potential as diagnostic
biomarkers and therapeutic targets (15-17).
The gene expression profiles in osteoporosis remain poorly
investigated. A previous study revealed 327 upregulated and 396
downregulated genes in mesenchymal stem cells of 5 patients with
osteoporosis by using microarray analysis (18). In a subsequent study, a total of
1,125 dysregulated genes (373 upregulated and 752 downregulated)
were identified by microarray analysis in PBMCs derived from
patients with osteoporosis (15).
These results provided insight that may be used for the development
of novel biomarkers and identification of treatment targets for
osteoporosis.
Specific lncRNA expression profiles have been
increasingly investigated in the past few years, mainly due to the
implication of multiple aberrant lncRNAs in the development and
progression of various diseases (19,20).
Recent studies revealed that aberrant lncRNA expression profiles
were associated with degenerative bone diseases, including
intervertebral disc degeneration (IDD) (21). The investigation of the lncRNA
expression profiles in IDD using microarray technology identified
1,570 dysregulated lncRNAs in IDD patients compared with those
noted in control subjects. The lncRNAs were mainly enriched in the
‘extracellular matrix’ and cell ‘apoptosis pathways’ (21). A previous study identified 1,806
lncRNAs (1,357 upregulated and 449 downregulated) and 2,307 mRNAs
(1,694 upregulated and 613 downregulated) that were differentially
expressed in patients with IDD compared with those in a control
group (22). In addition, the levels
of lncRNAs in human degenerative and normal nucleus pulposus
tissues were evaluated using lncRNA-mRNA microarray. The results
demonstrated that 305 lncRNAs (135 upregulated and 170
downregulated) and 3,231 mRNAs (2,133 upregulated and 1,098
downregulated) were dysregulated (23). Therefore, considering the important
role of lncRNA expression profiles in IDD, their implication in the
development and progression of PMOP should also be investigated.
However, at present, limited information is available. A previous
study identified 25 upregulated and 26 downregulated lncRNAs in
total blood samples from 3 patients with PMOP compared with those
in 2 healthy control subjects (13).
However, further studies with a larger sample size are required to
confirm the role of lncRNA expression profiles in PMOP. In the
present study, PBMCs from 10 patients with PMOP and 10 healthy
controls were isolated in order to investigate their corresponding
lncRNA expression profiles. A total of 254 upregulated and 359
downregulated lncRNAs were identified in patients with PMOP
compared with those in healthy controls. In the present study, the
number of the dysregulated lncRNAs was higher compared with that in
the above-mentioned study. This discrepancy may be due to various
aspects. First, the sample size in the present study was larger
compared with that in the previous study, which increased the
statistical power of the data. In addition, deep RNA sequencing was
utilized to investigate the lncRNA expression profiles in patients
with PMOP. Therefore, a higher number of dysregulated lncRNAs,
particularly novel lncRNAs, was identified. Finally, certain
differences in the clinical features of the patients of the two
studies were present. For instance, in the present study, the
average age was 5 years lower compared with that in the previous
study. These discrepancies may explain the increased number of
dysregulated lncRNAs reported in the present study.
Functional enrichment analyses are frequently
performed to reveal the potential functions of newly identified
dysregulated lncRNAs in various diseases (24,25). In
a previous study, 25 upregulated and 26 downregulated lncRNAs were
identified in patients with PMOP (13). Subsequent enrichment analyses
suggested that the dysregulated lncRNAs (n=51) were significantly
enriched in ‘membrane’, ‘cytosol’, ‘ribosome’, ‘cancer pathways’
and in ‘osteoclast differentiation’. The enrichment analysis of the
present study revealed that the dysregulated lncRNAs were enriched
in various GO terms in the category biological process, including
‘apoptosis’ and ‘positive regulation of the NF-κB signaling
pathway’. In addition, significant enrichment was noted in several
signaling pathways associated with diabetic complications,
including ‘osteoclast differentiation’ and ‘TNF’, ‘MAPK’ and
‘chemokine’ signaling pathway, as well as the ‘AGE-RAGE signaling
pathway’. These observations were consistent with previously
reported data (13). The results
suggested that the dysregulated lncRNAs may affect the development
and progression of PMOP via the regulation of osteoclast
differentiation, inflammation and apoptosis. In the present study,
the regulatory network of lncRNAs and mRNAs was visualized using a
Circos plot. In conclusion, the lncRNA expression profiles in
patients with PMOP were investigated. In addition, novel
dysregulated lncRNAs and their potential functions were identified
by functional enrichment analysis. The aforementioned results may
deepen the current understanding of the roles of lncRNAs in PMOP
and provide an application of lncRNAs as biomarkers for PMOP and
novel therapeutic targets.
The present study has certain limitations. First,
the majority of the patients and healthy subjects were recruited
from the Middle of China. Therefore, considering broader
populations, a selection bias may have occurred. Furthermore, the
expression of dysregulated lncRNAs was not verified in a larger
number of patients with PMOP by in vitro detection methods,
e.g. PCR. Finally, the mechanistic roles of dysregulated lncRNAs in
the underlying pathogenesis of PMOP should be further
investigated.
In summary, investigation of the lncRNA expression
profiles in patients with PMOP and controls indicated that certain
lncRNAs may be associated with the pathogenesis of PMOP via the
regulation of osteoclast differentiation, inflammation and
apoptosis.
Acknowledgements
Not applicable.
Funding
No funding was received.
Availability of data and materials
All data generated or analyzed during the present
study are included in this published article.
Author's contributions
SW designed the experiment, performed the
experiments, analyzed the data and wrote and revised the
manuscript.
Ethics approval and consent to
participate
Ethical approval was obtained from the Ethics
Committee of the Union Hospital (Tongji Medical College, Huazhong
University of Science and Technology, Wuhan, China; approval no.
2017-S927). Written informed consent was provided by all
participants prior to enrollment.
Patient consent for publication
Not applicable.
Competing interests
The author declares to have no competing
interests.
References
|
1
|
Ng PY, Brigitte-Patricia Ribet-A and
Pavlos NJ: Membrane trafficking in osteoclasts and implications for
osteoporosis. Biochem Soc Trans. 47:639–650. 2019.PubMed/NCBI View Article : Google Scholar
|
|
2
|
Yang DH and Yang MY: The role of
macrophage in the pathogenesis of osteoporosis. Int J Mol Sci.
20(E2093)2019.PubMed/NCBI View Article : Google Scholar
|
|
3
|
Tanaka S: Molecular understanding of
pharmacological treatment of osteoporosis. EFORT Open Rev.
4:158–164. 2019.PubMed/NCBI View Article : Google Scholar
|
|
4
|
Wade SW, Strader C, Fitzpatrick LA,
Anthony MS and O'Malley CD: Estimating prevalence of osteoporosis:
Examples from industrialized countries. Arch Osteoporos.
9(182)2014.PubMed/NCBI View Article : Google Scholar
|
|
5
|
Shoback D, Rosen CJ, Black DM, Cheung AM,
Murad MH and Eastell R: Pharmacological management of osteoporosis
in postmenopausal women: An endocrine society clinical practice
guideline. J Clin Endocrinol Metab. 105:2020. View Article : Google Scholar
|
|
6
|
Li N, Zheng B, Liu M, Zhou H, Zhao L, Cai
H and Huang J: Cost-effectiveness of antiosteoporosis strategies
for postmenopausal women with osteoporosis in China. Menopause.
26:906–914. 2019.PubMed/NCBI View Article : Google Scholar
|
|
7
|
Kanis JA, Cooper C, Rizzoli R and
Reginster JY: Scientific Advisory Board of the European Society for
Clinical and Economic Aspects of Osteoporosis (ESCEO) and the
Committees of Scientific Advisors and National Societies of the
International Osteoporosis Foundation (IOF). European guidance for
the diagnosis and management of osteoporosis in postmenopausal
women. Osteoporos Int. 30:3–44. 2019.PubMed/NCBI View Article : Google Scholar
|
|
8
|
Dhanoa JK, Sethi RS, Verma R, Arora JS and
Mukhopadhyay CS: Long non-coding RNA: Its evolutionary relics and
biological implications in mammals: A review. J Anim Sci Technol.
60(25)2018.PubMed/NCBI View Article : Google Scholar
|
|
9
|
Uszczynska-Ratajczak B, Lagarde J,
Frankish A, Guigó R and Johnson R: Towards a complete map of the
human long non-coding RNA transcriptome. Nat Rev Genet. 19:535–548.
2018.PubMed/NCBI View Article : Google Scholar
|
|
10
|
Zampetaki A, Albrecht A and Steinhofel K:
Long non-coding RNA structure and function: Is there a link? Front
Physiol. 9(1201)2018.PubMed/NCBI View Article : Google Scholar
|
|
11
|
Tong X, Gu PC, Xu SZ and Lin XJ: Long
non-coding RNA-DANCR in human circulating monocytes: A potential
biomarker associated with postmenopausal osteoporosis. Biosci
Biotechnol Biochem. 79:732–737. 2015.PubMed/NCBI View Article : Google Scholar
|
|
12
|
Wang Q, Li Y and Zhang Y, Ma L, Lin L,
Meng J, Jiang L, Wang L, Zhou P and Zhang Y: LncRNA MEG3 inhibited
osteogenic differentiation of bone marrow mesenchymal stem cells
from postmenopausal osteoporosis by targeting miR-133a-3p. Biomed
Pharmacother. 89:1178–1186. 2017.PubMed/NCBI View Article : Google Scholar
|
|
13
|
Fei Q, Bai X, Lin J, Meng H, Yang Y and
Guo A: Identification of aberrantly expressed long non-coding RNAs
in postmenopausal osteoporosis. Int J Mol Med. 41:3537–3550.
2018.PubMed/NCBI View Article : Google Scholar
|
|
14
|
Camacho PM, Petak SM, Binkley N, Clarke
BL, Harris ST, Hurley DL, Kleerekoper M, Lewiecki EM, Miller PD,
Narula HS, et al: American Association of Clinical Endocrinologists
and American College of Endocrinology Clinical practice guidelines
for the diagnosis and treatment of postmenopausal
osteoporosis-2016. Endocr Pract. 22 (Suppl 4):1111–1118.
2016.PubMed/NCBI View Article : Google Scholar
|
|
15
|
Li JJ, Wang BQ, Fei Q, Yang Y and Li D:
Identification of candidate genes in osteoporosis by integrated
microarray analysis. Bone Joint Res. 5:594–601. 2016.PubMed/NCBI View Article : Google Scholar
|
|
16
|
Chen JB, Zhu YW, Guo X, Yu C, Liu PH, Li
C, Hu J, Li HH, Liu LF, Chen MF, et al: Microarray expression
profiles analysis revealed lncRNA OXCT1-AS1 promoted bladder cancer
cell aggressiveness via miR-455-5p/JAK1 signaling. J Cell Physiol.
234:13592–13601. 2019.PubMed/NCBI View Article : Google Scholar
|
|
17
|
Wang Q, Li ZX, Li YJ, He ZG, Chen YL, Feng
MH, Li SY, Wu DZ and Xiang HB: Identification of lncRNA and mRNA
expression profiles in rat spinal cords at various timepoints
following cardiac ischemia/reperfusion. Int J Mol Med.
43:2361–2375. 2019.PubMed/NCBI View Article : Google Scholar
|
|
18
|
Zhang Y, Wang N, Ma J, Chen XC, Li Z and
Zhao W: Expression profile analysis of new candidate genes for the
therapy of primary osteoporosis. Eur Rev Med Pharmacol Sci.
20:433–440. 2016.PubMed/NCBI
|
|
19
|
Luo Q, Xu C, Li X, Zeng L, Ye J, Guo Y,
Huang Z and Li J: Comprehensive analysis of long non-coding RNA and
mRNA expression profiles in rheumatoid arthritis. Exp Ther Med.
14:5965–5973. 2017.PubMed/NCBI View Article : Google Scholar
|
|
20
|
Bountali A, Tonge DP and
Mourtada-Maarabouni M: RNA sequencing reveals a key role for the
long non-coding RNA MIAT in regulating neuroblastoma and
glioblastoma cell fate. Int J Biol Macromol. 130:878–891.
2019.PubMed/NCBI View Article : Google Scholar
|
|
21
|
Sun ZY, Yan P, Wang SJ, Liang H, Li Y,
Wang DG and Tian JW: Gene expression profiles of long non-coding
RNAs in human degenerated intervertebral disc tissue. Zhonghua Yi
Xue Za Zhi. 97:2582–2586. 2017.PubMed/NCBI View Article : Google Scholar : (In Chinese,
Abstract available in Chinese from the publisher).
|
|
22
|
Wan ZY, Song F, Sun Z, Chen YF, Zhang WL,
Samartzis D, Ma CJ, Che L, Liu X, Ali MA, et al: Aberrantly
expressed long noncoding RNAs in human intervertebral disc
degeneration: A microarray related study. Arthritis Res Ther.
16(465)2014.PubMed/NCBI View Article : Google Scholar
|
|
23
|
Chen Y, Ni H, Zhao Y, Chen K, Li M, Li C,
Zhu X and Fu Q: Potential role of lncRNAs in contributing to
pathogenesis of intervertebral disc degeneration based on
microarray data. Med Sci Monit. 21:3449–3458. 2015.PubMed/NCBI View Article : Google Scholar
|
|
24
|
Nam OH, Oh TJ, Lee JH, Hwang YS and Choi
SC: Differential gene expression profiles of human periodontal
ligament cells preserved in Hank's balanced salt solution and milk.
Dent Traumatol. 36:58–68. 2010.PubMed/NCBI View Article : Google Scholar
|
|
25
|
Sun J, Wang J, Zhang N, Yang R, Chen K and
Kong D: Identification of global mRNA expression profiles and
comprehensive bioinformatic analyses of abnormally expressed genes
in cholestatic liver disease. Gene. 707:9–21. 2019.PubMed/NCBI View Article : Google Scholar
|