Introduction
Membranous nephropathy (MN) is considered an
autoimmune disease and is characterized by autoimmune antibodies
deposited on the glomerular basement membrane. It is a leading
cause of nephrotic syndrome in adults (1,2).
Approximately 20% of MN cases are caused by systemic diseases or
exposure, termed secondary MN, while 80% of cases are located in
the kidney and termed idiopathic MN (iMN) (2,3).
Autoimmune antibodies against the M-type phospholipase A2 receptor
(PLA2R) have been detected in 70% of MN cases and against
thrombospondin type 1 domain-containing 7A in 2-3% of MN cases
(4,5). It is thought that iMN with a benign
course toward spontaneous remission occurs in approximately 30-60%
of cases within the first 2 years after presentation, and mild
progression of renal function occurs during follow-up (6-8).
However, approximately 30-50% of iMN cases gradually progress to
renal insufficiency within 5-10 years (9-11)
and immunosuppressive treatment should be offered to these patients
with a medium or high risk of renal progression (12). Unfortunately, the early
identification of such medium- or high-risk patients remains
elusive (13).
Cattran et al and Pei et al (14,15)
developed a logistic model called the Toronto Risk Score for the
classification of patients with iMN, but the calculation process is
complicated as the variables included in the model require
conversion and follow-up data for at least 6 months. Significant
differences in clinical variables at the time of renal biopsy have
been reported between iMN patients with different renal outcomes
(6,16-18).
Thus, an early predictive model based on these variables may be
warranted. The present study was designed to construct a simple and
convenient predictive model to facilitate early prediction of the
renal outcomes of iMN patients.
Materials and methods
Subjects
Patients who received a biopsy-based diagnosis of
iMN between January 2010 and December 2018 at the Second Affiliated
Hospital of Wenzhou Medical University were included in this
retrospective analysis. The inclusion criteria were as follows: i)
Age >18 years; ii) an estimated glomerular filtration rate
(eGFR) >15 ml/min/1.73 m2 at renal biopsy; and iii) a
follow-up time >12 months. The exclusion criteria were: i)
Secondary membranous nephropathy, such as hepatitis B-associated
membranous nephropathy or systemic lupus erythematosus; and ii) the
presence of malignant tumors.
Collection of clinical and laboratory
data
Patient demographic data and blood pressure were
recorded at the time of renal biopsy. Clinical laboratory tests,
including the results of serum biochemical tests and urinary tests,
were also collected at the time of renal biopsy and during the
follow-up. At the time of renal biopsy, 24 h proteinuria was
assessed and the spot urinary protein-to-creatinine ratio was
determined during the follow-up. Serum anti-PLA2R antibody levels
were determined using the commercial ELISA kits (EUROIMMUN AG; cat.
no. EA 1254-9601 G) following the standard instruction (19). The treatment strategy was decided
based on the Kidney Disease Improving Global Outcomes guidelines
(20). However, immunosuppressive
therapy was started more rapidly among patients with obviously
reduced levels of serum albumin (<25 g/l; normal range,
35.0-55.0 g/l) combined with a nephritic range of proteinuria
(>4 g per day; normal range, 0.0-0.15 g per day) or gradually
increased serum creatinine in our cohort. Patients that received
different immunosuppressive treatment regimens were divided into
four groups: i) No, did not receive any immunosuppressants or
received only corticosteroids; ii) cyclophosphamide (CTX), received
CTX with corticosteroids; iii) CNI, received tacrolimus or
cyclosporine with/without corticosteroids, and iv) others, received
multiple immunosuppressants or immunosuppressants other than the
above. The eGFR was evaluated using the chronic kidney disease
(CKD) epidemiology collaboration (CKD-EPI) equation (21). Hypertension was defined as a blood
pressure (BP) >140/90 mmHg (22)
or a diagnosis of hypertension before the renal biopsy. Complete
remission was defined as a spot urine protein-to-creatinine ratio
(UPCR) <0.2 g/g and serum albumin >35 g/l. Partial remission
was defined as a spot UPCR >0.2 g/g and <3.5 g/g and serum
albumin >30 g/l. Patients who did not meet the above criteria
were defined as having no remission. Relapse was defined as the
recurrence of nephrotic syndrome in patients with partial or
complete remission.
Renal histopathology
Kidney tissues were obtained from all patients
during routine renal biopsies. Specimens from all patients were
allocated and processed according to standard techniques for light
microscopy, immunofluorescence microscopy and electron microscopy
(23). Membranous lesions from all
iMN cases were classified (stages I-IV) by electron microscopy
based on the criteria of Ehrenreich and Churg (24). Chronic tubulointerstitial fibrosis
was assessed using the Oxford classification of tubular
atrophy/interstitial fibrosis and graded as grade 0 (absent to
mild, 0-24%), grade 1 (moderate, 25-49%), or grade 2 (severe,
>50%) (25). All renal biopsies
were reviewed and scored independently by two renal pathologists
(MP and DL) that were not blinded to patient history.
Constructing and verifying the early predictive
model. A univariate Cox proportional hazard model was built using
the rms package (R package version 5.1-1; https://CRAN.R-project.org/package=rms) (26) and survival package (R package version
2.41-3; https://CRAN.R-project.org/package=survival) (27) to investigate the relationship between
poor renal outcomes and histopathological or clinical variables.
Next, covariates with P-values <0.1 in univariate Cox models
were selected to build a multivariate Cox regression model.
Akaike's information criterion (AIC) (28) was used to simplify and optimize the
model. The proportional hazard assumption of each covariate in the
model was tested using the Therneau-Grambsch method (29). Finally, a nomogram was developed, and
the estimated three-year renal survival rate (ETR) was calculated
based on the model. Harrell's concordance index (Harrell's C-index)
of the models was calculated using the Hmisc package (R package
version 4.1-0; https://CRAN.R-project.org/package=Hmisc) (30), and internal validation was performed
using the rms package (R package version 5.1-1; https://CRAN.R-project.org/package=rms)
(26). Receiver operating
characteristic (ROC) curves and areas under the ROC curve (AUCs)
were used to assess the prognostic efficiency of the ETR and
traditional risk factors. Then, the appropriate cut-off values were
calculated based on the ROC curve.
Statistical analysis
Numerical variables are presented as the mean and
standard deviation (SDs) or as the median and interquartile range
(IQR) and were compared using the Wilcoxon test. Categorical
variables are presented as cases with percentages and were compared
with the χ2 test. The primary endpoints were a poor
renal outcome [defined as an eGFR decrease of at least 50% from the
baseline level or progression to end-stage renal disease (ESRD)
during the follow-up] or death caused by MN. Renal survival was
defined as the absence of the primary endpoints during the
follow-up. Differences in proteinuria and eGFR changes in the
groups during the follow-up were compared using factorial analysis
of variance and Tukey's range test. All reported P-values were
two-tailed, and P<0.05 was considered statistically significant.
Mathematical analyses were performed using R (version 3.5.1)
(31).
Results
Clinical characteristics of including
cases
A total of 141 cases met the inclusion criteria and
were enrolled in the present study. The rate of male-to-female was
1.4:1. Approximately 95.7% of the enrolled cases were at CKD stage
1 or 2, and half of the cases had hypertension at the time of renal
biopsy. The median follow-up time of our cohort was 30 (IQR, 21-45)
months. During the follow-up, 115 (81.6%) patients received
corticosteroids, and 103 (81.5%) patients received
immunosuppressants other than corticosteroids. A total of 85.8% of
the patients achieved partial or complete remission of nephrotic
syndrome, and 23 (19%) patients relapsed during the follow-up.
Almost all patients received angiotensin-converting enzyme
inhibitor (ACEI) and/or angiotensin receptor blocker (ARB) agents
to reduce urinary protein extraction and/or control BP. Eighteen
(12.8%) patients eventually progressed to the primary endpoints, 6
(4.3%) of whom developed ESRD, and one patient died due to a
massive cerebral infarction mainly caused by nephrotic syndrome
during the follow-up. These results are listed in Table I.
 | Table IClinical and laboratory
characteristics at the time of renal biopsy and during
follow-up. |
Table I
Clinical and laboratory
characteristics at the time of renal biopsy and during
follow-up.
| A, Characteristics at
time of biopsy |
|---|
| Characteristic
[units, figure reported] | Value |
|---|
| No. of cases | 141 |
| Female [n (%)] | 60 (42.6) |
| Age [years, mean
(SD)] | 51.5 (14.1) |
| Serum albumin [g/l,
mean (SD)] | 24.2 (5.4) |
| Total cholesterol
[mmol/l, mean (SD)] | 7.8 (2.2) |
| Triglycerides
[mmol/l, mean (SD)] | 2.8 (1.3) |
| HDL-C [mmol/l, mean
(SD)] | 1.5 (0.5) |
| LDL-C (mmol/l, mean
(SD)] | 4.5 (1.7) |
| Serum uric acid
[mg/dl, mean (SD)] | 6.3 (1.4) |
| Serum creatinine
[mg/dl, median (IQR)] | 0.8 (0.6-0.9) |
| eGFR [ml/min/1.73
m2, mean (SD)] | 101.5 (24.6) |
| CKD stage [n,
%] | |
|
Stage 1 | 103 (73.0) |
|
Stage 2 | 32 (22.7) |
|
Stage 3 | 4 (2.8) |
|
Stage 4 | 2 (1.4) |
| 24-h proteinuria
[g/24 h, median (IQR)] | 4.6 (2.8, 6.4) |
| Hemoglobin [g/l,
mean (SD)] | 132.4 (15.1) |
| Fibrinogen [g/l,
mean (SD)] | 5.1 (1.4) |
| Serum
anti-PLA2R antibody [Ru/ml, median (IQR)] | 171.1 (11.6,
561.8) |
| Hypertension (n,
%) | 82 (58.2) |
|
SBP [mmHg,
mean (SD)] | 135.0 (21.9) |
|
DBP [mmHg,
mean (SD)] | 80.3 (12.9) |
| B, Characteristics
during follow-up |
| Characteristic | Value |
| Follow-up [months,
median (IQR)] | 30 (21.0,
45.0) |
| Corticosteroids (n,
%) | 115 (81.6) |
| Immunosuppressants
(n, %) | |
|
NO | 38 (27.0) |
|
CTX | 28 (19.9) |
|
CNI | 46 (32.6) |
|
Others | 29 (20.6) |
| Remission (n,
%) | |
|
CR | 41 (29.1) |
|
PR | 80 (56.7) |
|
NR | 20 (14.2) |
| Relapse (n, %) | 23 (19.0) |
| ACEI (n, %) | 48 (34.0) |
| ARB (n, %) | 130 (92.2) |
| Endpoints (n,
%) | 18 (12.8) |
| ESRD (n, %) | 6 (4.3%) |
| Death (n, %) | 1 (0.7%) |
Comparing differences in pathological
lesions in patients with different renal outcomes
Cases with different renal outcomes were divided
into two groups: Those with poor renal outcome (Yes) and those
without poor renal outcome (No). The results are listed in Table II. In the present study cohort, the
majority of patients had stage 1-2 membranous lesions, and no
significant difference was found between the Yes and No groups.
However, a significant difference was found for chronic
tubulointerstitial injury (P=0.01), with the Yes group showing an
association with more severe tubulointerstitial injury in
comparison with the No group. No significant difference in the
intensity of immunofluorescence staining between the Yes and No
groups was found. All cases in the present cohort displayed diffuse
global granular polyclonal IgG deposition along the glomerular
capillary wall, and the main subtypes of IgG were IgG1 and IgG4.
Approximately 85-88% of the cases had complementary C3 diffuse
global granular deposition along the glomerular capillary loop.
None of these cases had C1q deposition.
| Table IIDifferences in pathological lesions
between patients with and without poor renal outcomes. |
Table II
Differences in pathological lesions
between patients with and without poor renal outcomes.
| | Poor renal
outcome | |
|---|
|
Characteristics | No | Yes | P-value |
|---|
| Cases (n) | 123 | 18 | |
| MN stage (n,
%) | | | 0.22 |
|
Stage I | 51 (42.1) | 8 (47.1) | |
|
Stage
II | 66 (54.5) | 7 (41.2) | |
|
Stage
III | 4 (3.3) | 2 (11.8) | |
| Chronic
tubulointerstitial injury (n, %) | | | 0.01 |
|
Grade 0 | 71 (57.7) | 4 (22.2) | |
|
Grade 1 | 39 (31.7) | 9 (50.0) | |
|
Grade 2 | 13 (10.6) | 5 (27.8) | |
| IgG deposition (n,
%) | | | |
|
IgG1 (n,
%) | 82 (90.1) | 14 (87.5) | 1.00 |
|
IgG2 (n,
%) | 3 (3.3) | 1 (6.2) | 1.00 |
|
IgG3 (n,
%) | 4 (4.4) | 0 (0.0) | 0.89 |
|
IgG4 (n,
%) | 87 (95.6) | 14 (87.5) | 0.48 |
| C3 deposition (n,
%) | 104 (85.2) | 15 (88.2) | 1.00 |
Relationship between clinical and
pathological variables and poor renal outcomes
The relationship between poor renal outcomes and
clinical or pathological variables at the time of renal biopsy was
assessed by univariate Cox proportional hazard regression (Table III). Serum uric acid [hazard ratio
(HR), 1.44; 95% confidence interval (CI), 1.09-1.91; P-value=0.01],
eGFR (HR, 0.97; 95% CI, 0.95-0.99; P-value=0.001), 24-h proteinuria
(HR, 1.21; 95% CI, 1.11-1.33; P-value <0.001), hypertension (HR,
10.78; 95% CI, 1.43-81.08; P-value=0.02), systolic BP (HR, 1.03;
95% CI, 1.01-1.05; P-value=0.005) and chronic tubulointerstitial
injury [referred to as grade 0, grade 1 (HR, 6.01; 95% CI,
1.61-22.42; P-value=0.008)] and grade 2 (HR, 10.91; 95% CI
2.48-48.00; P-value=0.002) were significantly associated with poor
renal outcomes. However, other variables, including the serum
anti-PLA2R antibody level, showed no significant correlation with
poor renal outcomes in the present study cohort. Covariates with
P-values <0.1 were selected to build a multivariate Cox
regression model, but systolic BP was removed considering the
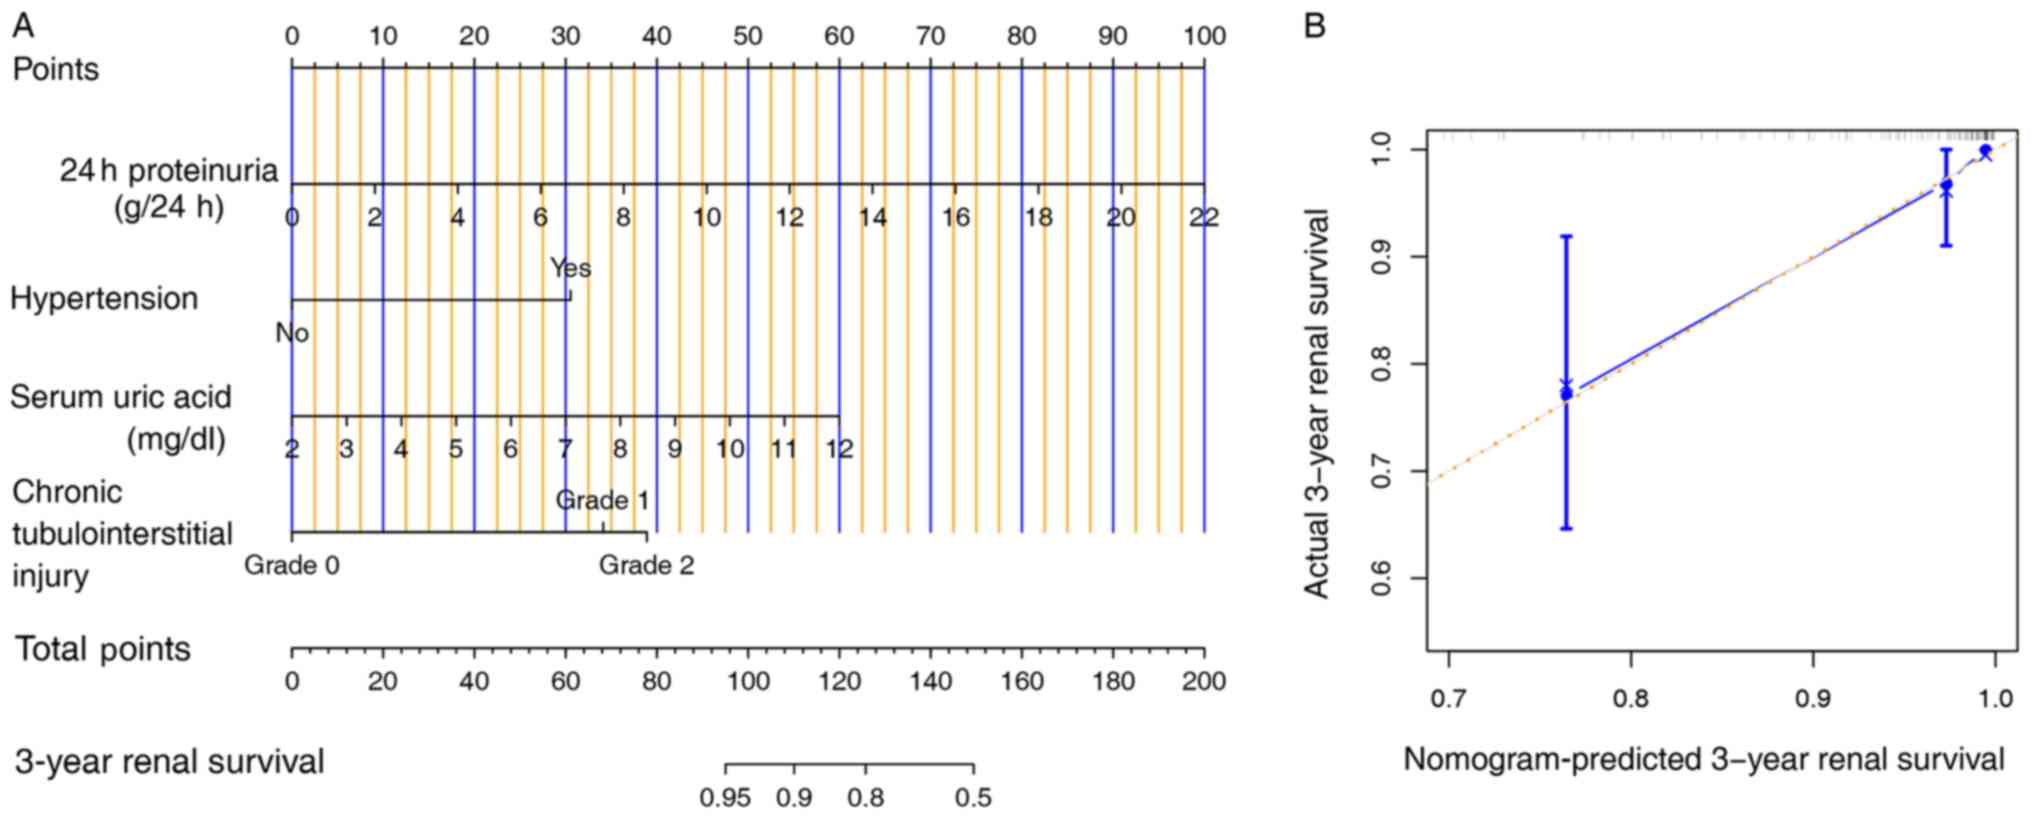
collinearity. The multivariate Cox regression model fit well for
predicting a poor renal outcome with a high C-index (86%; 95% CI,
78-94%; P-value <0.001). Furthermore, according to the AIC,
serum albumin level and eGFR were removed from the multivariate
model, and four covariates (24-h proteinuria, serum uric acid,
chronic tubulointerstitial injury and hypertension) were maintained
to construct an optimized multivariate Cox regression model
(Table IV). In particular, 24-h
proteinuria (HR, 1.24; 95% CI, 1.10-1.40; P-value <0.001) and
chronic tubulointerstitial injury [referred to as grade 0; grade 1
(HR, 5.12; 95% CI, 1.33-19.75; P-value=0.02) or grade 2 (HR, 6.43;
95% CI, 1.35-30.59; P-value=0.02) were independent risk factors for
a poor renal outcome. Therneau-Grambsch tests demonstrated that the
four covariates in the optimized model were all independent of time
(Table IV), which is a key
assumption of the Cox regression. The C-index of the model was 87%
(95% CI, 79-95%; P-value <0.001) and no significant difference
was found between the two multivariate Cox models (χ2
test; P-value=0.86). A nomogram was plotted based on the optimized
model to facilitate the calculation of the ETR (Fig. 1A).
| Table IIIRelationships between poor renal
outcomes and clinical and pathological variables. |
Table III
Relationships between poor renal
outcomes and clinical and pathological variables.
| | Univariate
model | Multivariate
model |
|---|
|
Characteristics | HR (95% CI) | P-value | HR (95% CI) | P-value |
|---|
| Sex (female) | 0.75
(0.29-1.96) | 0.56 | | |
| Age (years) | 1.03
(0.99-1.07) | 0.19 | | |
| Serum albumin
(g/l) | 0.93
(0.84-1.01) | 0.10 | 1.00
(0.90-1.11) | 0.99 |
| Total cholesterol
(mmol/l) | 1.12
(0.9-1.38) | 0.31 | | |
| Triglycerides
(mmol/l) | 1.23
(0.91-1.65) | 0.18 | | |
| HDL-C (mmol/l) | 0.35
(0.09-1.41) | 0.14 | | |
| LDL-C (mmol/l) | 1.09
(0.83-1.45) | 0.53 | | |
| Serum uric acid
(mg/dl) | 1.44
(1.09-1.91) | 0.01 | 1.31
(0.95-1.79) | 0.10 |
| eGFR (ml/min/1.73
m2) | 0.97
(0.95-0.99) | 0.001 | 0.99
(0.97-1.02) | 0.58 |
| 24-h proteinuria
(g/24 h) | 1.22
(1.11-1.33) | <0.001 | 1.23
(1.08-1.41) | 0.002 |
| Hemoglobin
(g/l) | 0.99
(0.95-1.02) | 0.48 | | |
| Fibrinogen
(g/l) | 1.28
(0.89-1.83) | 0.18 | | |
| Hypertension
(Yes) | 10.78
(1.43-81.08) | 0.02 | 4.05
(0.49-33.75) | 0.20 |
|
SBP
(mmHg) | 1.03
(1.01-1.05) | 0.005 | | |
|
DBP
(mmHg) | 1.02
(0.99-1.05) | 0.24 | | |
| Serum
anti-PLA2R antibody (Ru/ml) | 0.99
(0.98-1.01) | 0.31 | | |
| Stage of membranous
lesions | | | | |
|
Stage I | 1 | - | | |
|
Stage
II | 1.03
(0.37-2.91) | 0.95 | | |
|
Stage
III | 3.74
(0.77-18.09) | 0.10 | | |
| Chronic
tubulointerstitial injury | | | | |
|
Grade 0 | 1 | - | 1 | - |
|
Grade 1 | 6.01
(1.61-22.42) | 0.008 | 4.84
(1.22-19.24) | 0.03 |
|
Grade 2 | 10.91
(2.48-48.00) | 0.002 | 5.38
(0.95-30.42) | 0.06 |
|
Corticosteroids | 8.93
(0.26-3.10) | 0.86 | | |
|
Immunosuppressants | | | | |
|
NO | 1 | - | | |
|
CTX | 0.47
(0.11-2.13) | 0.33 | | |
|
CNI | 0.86
(0.16-4.76) | 0.86 | | |
|
Others | 2.39
(0.73-7.84) | 0.15 | | |
| Table IVOptimized prediction model. |
Table IV
Optimized prediction model.
| | Results of
regression | Therneau-grambsch
test |
|---|
|
Characteristics | HR (95% CI) | P-value | ρ
(χ2) | P-value |
|---|
| 24-h proteinuria
(g/24 h) | 1.24
(1.10-1.40) | <0.001 | -0.05 (0.04) | 0.85 |
| Serum uric acid
(mg/dl) | 1.33
(0.98-1.81) | 0.07 | -0.28 (1.13) | 0.29 |
| Hypertension
(Yes) | 4.31
(0.53-35.35) | 0.17 | -0.19 (0.58) | 0.45 |
| Chronic
tubulointerstitial injury | | | | |
|
Grade 0 | 1 | - | 1 | - |
|
Grade 1 | 5.12
(1.33-19.75) | 0.02 | 0.21 (0.89) | 0.35 |
|
Grade 2 | 6.43
(1.35-30.59) | 0.02 | 0.13 (0.31) | 0.58 |
Validation of the optimized model
A calibration plot was used to display the internal
validity of the optimized model (Fig.
1B). The bootstrapping validation analysis illustrated that the
optimized model showed good discrimination, with a high corrected
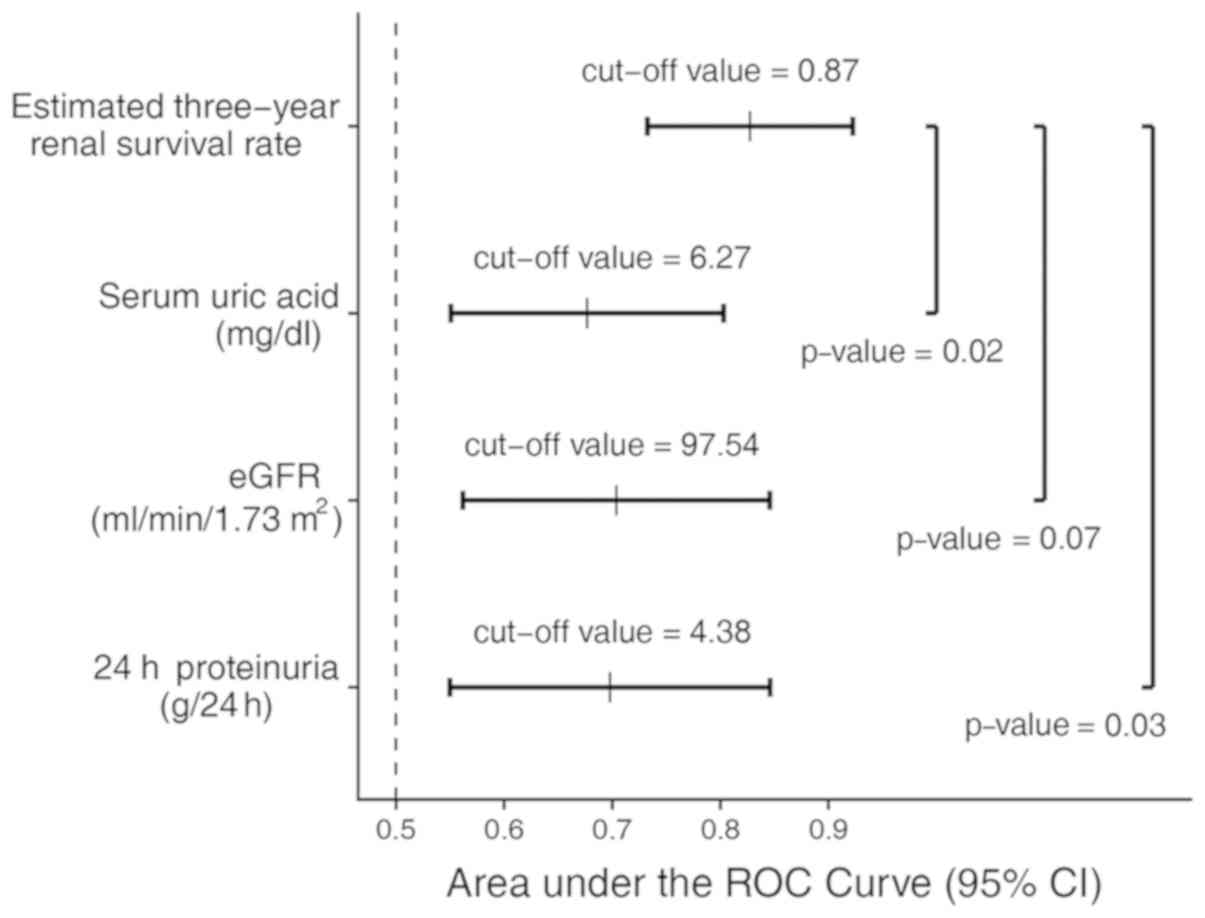
C-index of 84%. The ROC analysis of the optimized model showed an
AUC of 0.83 (95% CI, 0.73-0.92), and the specificity and
sensitivity were 85% (95% CI, 79-91%) and 67% (95% CI, 44-89%),
respectively. Based on the optimized model, the best cut-off value
of the ETR was 0.87 (Fig. 2).
Compared to the traditional risk factors of iMN, the AUCs were
significantly decreased for 24-h proteinuria (AUC, 0.69; 95% CI,
0.55-0.85) and serum uric acid (AUC, 0.68; 95% CI, 0.55-0.80) and
slightly reduced for the eGFR (AUC, 0.70; 95% CI, 0.56-0.85).
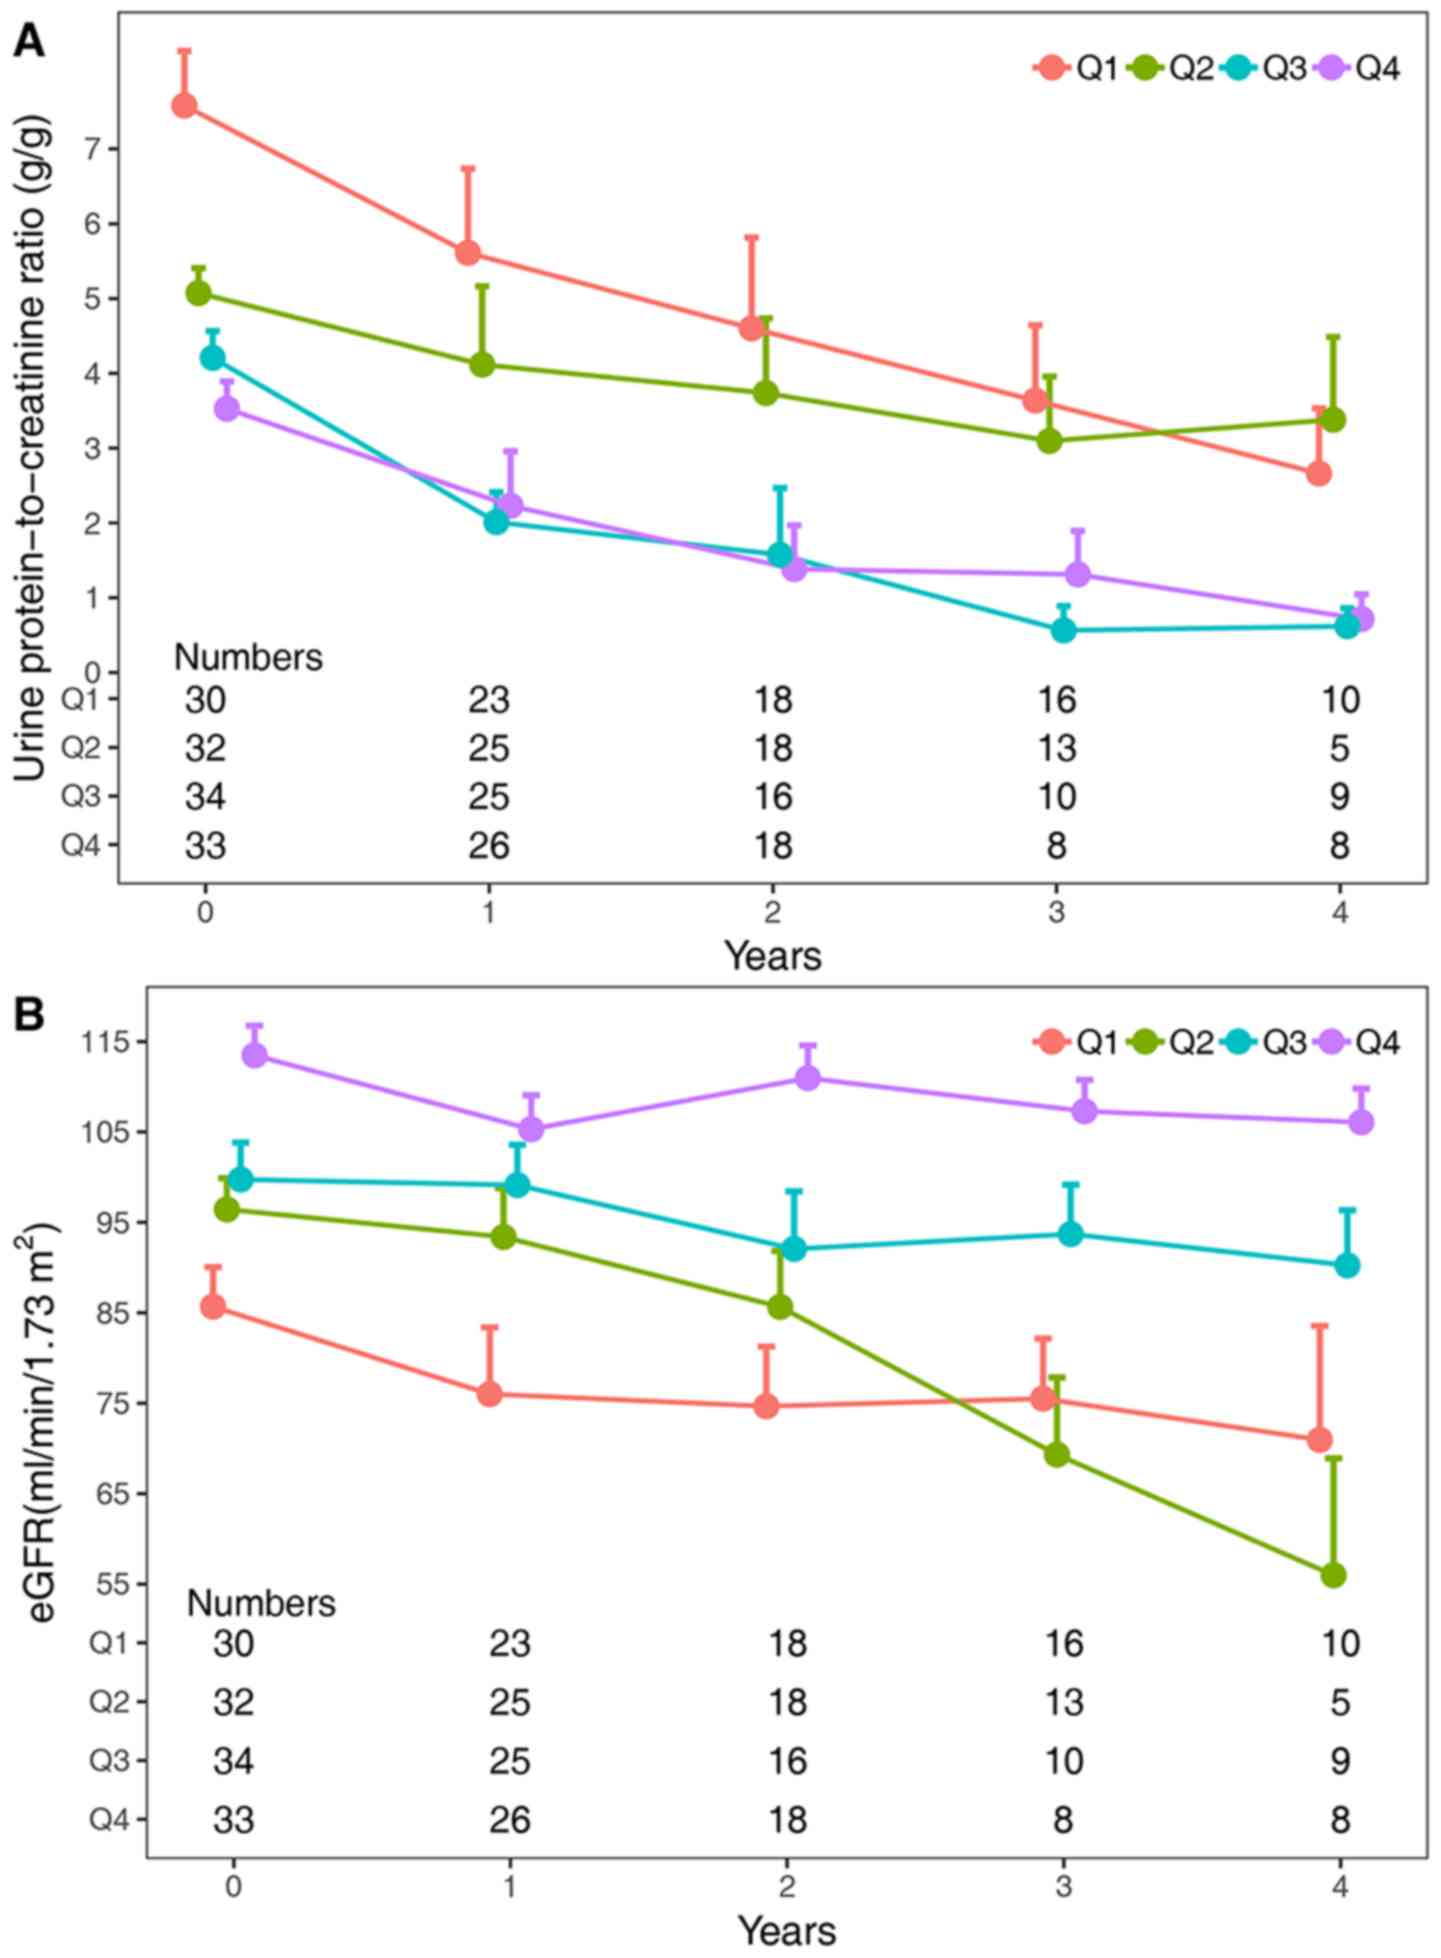
Changes in proteinuria and the eGFR at
different levels of the ETR
The cases in the present study cohort were divided
into four groups according to the quartiles of the ETR (Q1,
0.09-0.90; Q2, 0.90-0.98; Q3, 0.98-0.99 and Q4, 0.99-1.00; with
boundary values divided into lower intervals), and the 24-h
proteinuria levels corresponding to the ETR were calculated (Q1,
21.7-8.8 g; Q2, 8.8-4.0 g; Q3, 4.0-2.0 g and Q4, 2.0-0 g; with
boundary values divided into lower intervals). Referring to the
Toronto Risk Score risk classification (14), the four groups were classified into
three groups: Q1, the high-risk group, Q2, the medium-risk group
and Q3 and Q4, the low-risk group. The changes in proteinuria and
the eGFR in different categories of the ETR are displayed in
Fig. 3. Significant correlations
were found between the ETR and changes in proteinuria or the eGFR
(both P-values <0.001). The changes in proteinuria were not
significantly different between the Q1 and Q2 groups [mean
difference (MD), -0.9; 95% CI, -2.10-0.30; P-value=0.21], but
significant differences were found between the Q1 and Q3 groups
(MD, -2.68; 95% CI, -3.87- -1.50; P-value <0.001) and the Q1 and
Q4 groups (MD, -2.80; 95% CI, -3.99- -1.61; P-value <0.001).
Additionally, the changes in the eGFR were significantly different
between the Q1 group and the other groups: Q2 (MD=10.52, 95% CI
1.64-19.39, P-value=0.01), Q3 (MD=20.01, 95% CI 11.21-28.81,
P-value <0.001), and Q4 (MD=31.96, 95% CI 23.16-40.76, P-value
<0.001).
Discussion
Given the toxicity of immunosuppressive therapies
and the natural course of iMN, early prediction of renal outcomes
is critical for therapy selection (32). However, to the best of our knowledge,
there is no nomogram for the early prediction of the renal outcomes
among patients with iMN at present. The current study showed that
24-h proteinuria and chronic tubulointerstitial injury are
independently associated with poor renal outcomes in patients with
iMN, and a validated model and nomogram for the early prediction of
renal outcomes based on an optimized multivariate Cox proportional
hazard model incorporating four variables at the time of renal
biopsy (24-h proteinuria, serum uric acid, chronic
tubulointerstitial injury, and hypertension) was established.
Although the time at which immunosuppressive therapy
is administered to patients with iMN is still controversial,
aggressive immunosuppressant therapy has been confirmed to increase
the remission rate of nephrotic syndrome and improve renal
prognosis (6). In the present study
cohort, 81.6% of patients received glucocorticoid therapy and 73%
of patients received other immunologic agents. Among the cohort,
85.8% of patients achieved remission, which is significantly higher
than the proportion of spontaneous remission (17,33).
Previous research has shown that male sex, older
than 60 years, hypertension, nephrotic-range proteinuria and
decreased eGFR are associated with a poor prognosis (8,16,33-35).
The results of the present study cohort also indicated that the
24-h proteinuria level at the time of renal biopsy was an
independent predictor for a poor renal outcome. Renal histology is
usually required to diagnose MN, and most studies have suggested
that pathological renal lesions other than chronic
tubulointerstitial injury are not useful for predicting renal
outcomes, which is consistent with the present results (36,37). In
the present model, chronic tubulointerstitial injury was also an
independent predictor for poor renal outcomes.
Unexpectedly, eGFR was removed by the AIC analysis,
but serum uric acid and hypertension were maintained. Although the
role of uric acid in the progression of CKD is controversial,
increasing evidence has indicated that uric acid plays a
considerable role in the progression of CKD (38,39).
Approximately 10-67% of patients have hypertension at the onset of
MN (37,40). In the present study cohort, 58.2% of
the patients had hypertension at the time of renal biopsy. Other
studies have also demonstrated that the presence of hypertension at
the onset of MN is a risk factor for poor renal outcomes (8,17,18).
Compared to other studies, the present model had
some advantages (14,34). The four variables of the present
model were confirmed to fit the assumption of Cox regression
analysis and can be obtained easily at the time of renal biopsy.
Furthermore, internal validation demonstrated that the model was
robust for predicting the ETR and was significantly preferred over
individuals' variables for the identification of poor renal
outcomes. According to the ROC analysis, the specificity and
sensitivity of the present model for the identification of poor
renal outcomes were 85 and 67%, respectively, and the best cut-off
value of the ETR was 0.87. In other words, patients with an ETR
<0.87 likely progress to a poor renal outcome.
The present model indicated that the patients
divided into the Q1 and Q2 groups would show more severe
proteinuria and rapid progression of renal function decline,
demonstrating that the model effectively predicted renal outcomes
at an early stage. However, the changes in proteinuria and the eGFR
were significantly different in the Q2 and Q3 groups, suggesting
that the model may be useful for the early identification of
medium-risk patients. Furthermore, after two years of follow-up,
the patients in the Q2 group more quickly developed a decreased
eGFR, indicating that more aggressive immunosuppressive treatment
is warranted for these patients.
There are several limitations to the present study.
First, this was a small retrospective study, which may have caused
bias in the results. Second, few cases reached the endpoint due to
the nature of the cases that were included in the present study and
the duration of the follow-up. Although a variety of rigorous
statistical analyses were used to verify the results, the stability
of the model may have been affected. Third, most of the enrolled
patients had received various immunosuppressive therapies during
the follow-up that may have shifted the survival curve. Finally,
the enrolled patients were from a single center and were of the
same ethnicity, which may affect the scalability of the model.
In conclusion, the present study suggested a new
optimized Cox regression model for the early prediction of renal
outcomes in patients with iMN and developed a nomogram for the
convenient calculation of the ETR. Patients with an ETR of <0.87
may require early immunosuppressive treatment. In addition, more
attention should be directed toward patients with an ETR of
0.87-0.98 during follow-up.
Acknowledgements
The authors would like to thank their colleagues, Dr
Xiaokai Ding, Dr Bo Chen, Dr Lvying Qiu, Dr Yu Zheng, Dr Xiaohan
You, Dr Jianna Zhang, at the Department of Nephrology, The First
and Second Affiliated Hospitals of Wenzhou Medical University, for
their hard work of performing routine follow-up.
Funding
The present study was supported by the Medical
Health Science and Technology Project of Zhejiang Provincial Health
Commission (grant no. 2020377868) and the Fund for Lin He's
Academician Workstation of New Medicine and Clinical Translation
(grant no. 18331210).
Availability of data and materials
The datasets used and/or analyzed during the current
study are available from the corresponding author on reasonable
request.
Authors' contributions
JZ and SFP analyzed and interpreted the patient data
regarding iMN. ZYL and LWJ collected and processed the clinical
data. MP and DL reviewed and scored kidney histopathology. ZHZ and
MP conceived and designed the current study. JZ, ZHZ, and MP were
major contributors in writing the manuscript. All authors read and
approved the final manuscript.
Ethics approval and consent to
participate
The present study was performed after obtaining
written informed consent from all patients and approved by the
Ethics Committee of the Second Affiliated Hospital &Yuying
Children's Hospital of Wenzhou Medical University (approval no.
LCKY2019-217).
Patient consent for publication
Not applicable.
Competing interests
The authors declare that they have no competing
interests.
References
|
1
|
Ronco P and Debiec H: Pathophysiological
advances in membranous nephropathy: Time for a shift in patient's
care. Lancet. 385:1983–1992. 2015.PubMed/NCBI View Article : Google Scholar
|
|
2
|
Cattran DC and Brenchley PE: Membranous
nephropathy: Integrating basic science into improved clinical
management. Kidney Int. 91:566–574. 2017.PubMed/NCBI View Article : Google Scholar
|
|
3
|
Couser WG: Primary membranous nephropathy.
Clin J Am Soc Nephrol. 12:983–997. 2017.PubMed/NCBI View Article : Google Scholar
|
|
4
|
Beck LH Jr, Bonegio RG, Lambeau G, Beck
DM, Powell DW, Cummins TD, Klein JB and Salant DJ: M-type
phospholipase A2 receptor as target antigen in idiopathic
membranous nephropathy. N Engl J Med. 361:11–21. 2009.PubMed/NCBI View Article : Google Scholar
|
|
5
|
Tomas NM, Beck LH Jr, Meyer-Schwesinger C,
Seitz-Polski B, Ma H, Zahner G, Dolla G, Hoxha E, Helmchen U,
Dabert-Gay AS, et al: Thrombospondin type-1 domain-containing 7A in
idiopathic membranous nephropathy. N Engl J Med. 371:2277–2287.
2014.PubMed/NCBI View Article : Google Scholar
|
|
6
|
Ponticelli C, Zucchelli P, Passerini P,
Cesana B, Locatelli F, Pasquali S, Sasdelli M, Redaelli B, Grassi
C, Pozzi C, et al: A 10-year follow-up of a randomized study with
methylprednisolone and chlorambucil in membranous nephropathy.
Kidney Int. 48:1600–1604. 1995.PubMed/NCBI View Article : Google Scholar
|
|
7
|
Hladunewich MA, Troyanov S, Calafati J and
Cattran DC: Metropolitan Toronto Glomerulonephritis Registry. The
natural history of the non-nephrotic membranous nephropathy
patient. Clin J Am Soc Nephrol. 4:1417–1422. 2009.PubMed/NCBI View Article : Google Scholar
|
|
8
|
Zuo K, Wu Y, Li SJ, Xu F, Zeng CH and Liu
ZH: Long-term outcome and prognostic factors of idiopathic
membranous nephropathy in the Chinese population. Clin Nephrol.
79:445–453. 2013.PubMed/NCBI View
Article : Google Scholar
|
|
9
|
van den Brand JA, Hofstra JM and Wetzels
JF: Low-molecular-weight proteins as prognostic markers in
idiopathic membranous nephropathy. Clin J Am Soc Nephrol.
6:2846–2853. 2011.PubMed/NCBI View Article : Google Scholar
|
|
10
|
Ruggenenti P, Fervenza FC and Remuzzi G:
Treatment of membranous nephropathy: Time for a paradigm shift. Nat
Rev Nephrol. 13:563–579. 2017.PubMed/NCBI View Article : Google Scholar
|
|
11
|
Segal PE and Choi MJ: Recent advances and
prognosis in idiopathic membranous nephropathy. Adv Chronic Kidney
Dis. 19:114–119. 2012.PubMed/NCBI View Article : Google Scholar
|
|
12
|
Waldman M and Austin HA III: Controversies
in the treatment of idiopathic membranous nephropathy. Nat Rev
Nephrol. 5:469–479. 2009.PubMed/NCBI View Article : Google Scholar
|
|
13
|
van den Brand JA, Hofstra JM and Wetzels
JF: Prognostic value of risk score and urinary markers in
idiopathic membranous nephropathy. Clin J Am Soc Nephrol.
7:1242–1248. 2012.PubMed/NCBI View Article : Google Scholar
|
|
14
|
Cattran DC, Pei Y, Greenwood CM,
Ponticelli C, Passerini P and Honkanen E: Validation of a
predictive model of idiopathic membranous nephropathy: Its clinical
and research implications. Kidney Int. 51:901–907. 1997.PubMed/NCBI View Article : Google Scholar
|
|
15
|
Pei Y, Cattran D and Greenwood C:
Predicting chronic renal insufficiency in idiopathic membranous
glomerulonephritis. Kidney Int. 42:960–966. 1992.PubMed/NCBI View Article : Google Scholar
|
|
16
|
Shiiki H, Saito T, Nishitani Y, Mitarai T,
Yorioka N, Yoshimura A, Yokoyama H, Nishi S, Tomino Y, Kurokawa K,
et al: Prognosis and risk factors for idiopathic membranous
nephropathy with nephrotic syndrome in Japan. Kidney Int.
65:1400–1407. 2004.PubMed/NCBI View Article : Google Scholar
|
|
17
|
Schieppati A, Mosconi L, Perna A, Mecca G,
Bertani T, Garattini S and Remuzzi G: Prognosis of untreated
patients with idiopathic membranous nephropathy. N Engl J Med.
329:85–89. 1993.PubMed/NCBI View Article : Google Scholar
|
|
18
|
Chembo CL, Marshall MR, Williams LC,
Walker RJ, Lynn KL, Irvine J and Pilmore HL: Long-term outcomes for
primary glomerulonephritis: New Zealand glomerulonephritis study.
Nephrology (Carlton). 20:899–907. 2015.PubMed/NCBI View Article : Google Scholar
|
|
19
|
Dähnrich C, Komorowski L, Probst C,
Seitz-Polski B, Esnault V, Wetzels JF, Hofstra JM, Hoxha E, Stahl
RA, Lambeau G, et al: Development of a standardized ELISA for the
determination of autoantibodies against human M-type phospholipase
A2 receptor in primary membranous nephropathy. Clin Chim Acta.
421:213–218. 2013.PubMed/NCBI View Article : Google Scholar
|
|
20
|
Foundation NK: KDIGO clinical practice
guideline for glomerulonephritis. Kidney Int Suppl. 2(142)2012.
|
|
21
|
Matsushita K, Selvin E, Bash LD, Astor BC
and Coresh J: Risk implications of the new CKD epidemiology
collaboration (CKD-EPI) equation compared with the MDRD study
equation for estimated GFR: The atherosclerosis risk in communities
(ARIC) study. Am J Kidney Dis. 55:648–659. 2010.PubMed/NCBI View Article : Google Scholar
|
|
22
|
Brien EO, Atkins N and Malley KO: Defining
normal ambulatory blood pressure. Am J Hypertens. 6:201S–206S.
1993.PubMed/NCBI
|
|
23
|
Fogo AB, Lusco MA, Najafian B and Alpers
CE: AJKD atlas of renal pathology: Membranous nephropathy. Am J
Kidney Dis. 66:e15–e17. 2015.PubMed/NCBI View Article : Google Scholar
|
|
24
|
Ehrenreich T, Porush JG, Churg J,
Garfinkel L, Glabman S, Goldstein MH, Grishman E and Yunis SL:
Treatment of idiopathic membranous nephropathy. N Engl J Med.
295:741–746. 1976.PubMed/NCBI View Article : Google Scholar
|
|
25
|
Working Group of the International IgA
Nephropathy Network and the Renal Pathology Society. Cattran DC,
Coppo R, Cook HT, Feehally J, Roberts IS, Troyanov S, Alpers CE,
Amore A, Barratt J, et al: The Oxford classification of IgA
nephropathy: rationale, clinicopathological correlations, and
classification. Kidney Int. 76:534–545. 2009.PubMed/NCBI View Article : Google Scholar
|
|
26
|
Harrell FE Jr: Rms: Regression modeling
strategies. R package version 5.1-0, Journal, 2017.
|
|
27
|
Therneau TM and Grambsch PM: Modeling
survival data: Extending the Cox model. Springer Science &
Business Media, 2013.
|
|
28
|
Akaike H: Information theory and an
extension of the maximum likelihood principle. In: Selected papers
of hirotugu akaike. New York, Springer, pp199-213, 1998.
|
|
29
|
Grambsch PM and Therneau TM: Proportional
hazards tests and diagnostics based on weighted residuals.
Biometrika. 81:515–526. 1994.
|
|
30
|
Harrell FE Jr: Dupont wcfC and others. m:
Hmisc: Harrell Miscellaneous. R package version 4.0-3, Journal,
2017.
|
|
31
|
Team RC: R: A language and environment for
statistical computing. Journal, 2017.
|
|
32
|
Fervenza FC, Sethi S and Specks U:
Idiopathic membranous nephropathy: Diagnosis and treatment. Clin J
Am Soc Nephrol. 3:905–919. 2008.PubMed/NCBI View Article : Google Scholar
|
|
33
|
Polanco N, Gutiérrez E, Covarsí A, Ariza
F, Carreño A, Vigil A, Baltar J, Fernández-Fresnedo G, Martín C,
Pons S, et al: Spontaneous remission of nephrotic syndrome in
idiopathic membranous nephropathy. J Am Soc Nephrol. 21:697–704.
2010.PubMed/NCBI View Article : Google Scholar
|
|
34
|
Zhang XD, Cui Z, Zhang MF, Wang J, Zhang
YM, Qu Z, Wang X, Huang J, Wang F, Meng LQ, et al: Clinical
implications of pathological features of primary membranous
nephropathy. BMC Nephrol. 19(215)2018.PubMed/NCBI View Article : Google Scholar
|
|
35
|
Chen Y, Tang L, Feng Z, Cao X, Sun X, Liu
M, Liu S, Zhang X, Li P, Wei R, et al: Pathological predictors of
renal outcomes in nephrotic idiopathic membranous nephropathy with
decreased renal function. J Nephrol. 27:307–316. 2014.PubMed/NCBI View Article : Google Scholar
|
|
36
|
Horvatic I, Ljubanovic DG, Bulimbasic S,
Knotek M, Prkacin I, Tisljar M and Galesic K: Prognostic
significance of glomerular and tubulointerstitial morphometry in
idiopathic membranous nephropathy. Pathol Res Pract. 208:662–667.
2012.PubMed/NCBI View Article : Google Scholar
|
|
37
|
Reichert LJ, Koene RA and Wetzels JF:
Prognostic factors in idiopathic membranous nephropathy. Am J
Kidney Dis. 31:1–11. 1998.PubMed/NCBI View Article : Google Scholar
|
|
38
|
Mwasongwe SE, Fülöp T, Katz R, Musani SK,
Sims M, Correa A, Flessner MF and Young BA: Relation of uric acid
level to rapid kidney function decline and development of kidney
disease: The Jackson heart study. J Clin Hypertens (Greenwich).
20:775–783. 2018.PubMed/NCBI View Article : Google Scholar
|
|
39
|
Iseki K: Significance of hyperuricemia
among community-based screening participants. Contrib Nephrol.
192:41–47. 2018.PubMed/NCBI View Article : Google Scholar
|
|
40
|
Waldman M, Beck LH Jr, Braun M, Wilkins K,
Balow JE and Austin HA III: Membranous nephropathy: Pilot study of
a novel regimen combining cyclosporine and rituximab. Kidney Int
Rep. 1:73–84. 2016.PubMed/NCBI View Article : Google Scholar
|