Introduction
Ankylosing spondylitis (AS) is a chronic
immune-mediated type of inflammatory arthritis, mainly invading the
axial skeleton, frequently accompanied by extra-articular
manifestations. In severe cases, spinal deformity and ankylosis may
occur. AS has a prevalence of 0.03-0.09% and the risk of mortality
and cardiovascular events, including vascular death, is increased
in patients with AS (1). The
aetiology and pathogenesis of AS have remained to be fully
elucidated. Epidemiological investigations have indicated that
genetic and environmental factors have a role in the pathogenesis
of this disease. The human leukocyte antigen B27 (HLA-B27) is known
to have a strong association with AS and a distinct tendency of
family aggregation (2). In addition,
several inflammatory pathways appear to have a relevant role in the
pathogenesis of AS, including NF-κB and the IL-17/IL-23 pathway
(3).
Autophagy is an important mechanism in which cells
digest their components through lysosomes/vacuoles to maintain
normal physiological activity and homeostasis. It is highly
conserved from yeast to mammals. In addition to regulating cell
homeostasis, autophagy also has an important role in various
diseases, including cancer, neurodegeneration, cardiomyopathy and
diabetes (4). Autophagy, the process
by which cells degrade intracellular components, may be categorized
into three major types: Macroautophagy, microautophagy and
chaperonemediated autophagy (5).
Macroautophagy is the major form of autophagy and has been studied
most commonly; it relies on the formation of the
double-membrane-bound phagophore and autophagosome. The formation
of macroautophagy (hereafter referred to as ‘autophagy’) is divided
into three stages, including the formation of pre-autophagosomes
(also called isolation membranes), the formation of autophagosomes
and the maturation of autophagy (6).
Each step is regulated by different genes associated with
autophagy. The core autophagy proteins, which are required for
autophagosome formation, are divided into different functional
subgroups: i) The autophagy-related gene (ATG)1/ULK complex; ii)
ATG9 and its cycling system; iii) the PtdIns 3-kinase complex; and
iv) two ubiquitin-like conjugation systems: The ATG12 [ATG5, ATG7,
ATG10, ATG12 and ATG16 ligand 1 (ATG16L1)] and ATG8 (ATG3, ATG4,
ATG7 and ATG8) conjugation systems (5). In addition to the interaction of
autophagy proteins, long non-coding RNAs (lncRNAs) are also
involved in the regulation of autophagy (7), including lncRNA autophagy-promoting
factor (8), lncRNA gallbladder
cancer drug resistance-associated lncRNA 1(9) and lncRNA growth arrest-specific 5
(GAS5) (10).
Autophagy has recently been indicated to be involved
in the regulation of immunity and inflammation. Therefore, the
association between autophagy and rheumatic diseases characterized
by immune system dysfunction has gained increasing attention from
researchers. It has been confirmed that autophagy is involved in
the progression of various rheumatic diseases, including systemic
lupus erythematosus (SLE), rheumatoid arthritis (RA),
osteoarthritis (OA) and systemic sclerosis (11). Furthermore, studies have indicated
that autophagy may be involved in the pathogenesis of AS (12-14).
Autophagy regulation is associated with a variety of
autophagy genes and lncRNA. Microtubule-associated protein light
chain 3 (LC3) is an important gene that regulates autophagy and has
been widely used as an autophagosomal marker (15). Beclin1 is important for the
recruitment of autophagy proteins to the pre-autophagosome
structure and together with vacuolar protein sorting-34 (Vps34),
Vps15 and ATG14 form the Beclin1-Vps34-Vps15-ATG14 complex, it
triggers vesicle nucleation (16).
ATG3 and ATG12-ATG5-ATG16L1 complexes are involved in the expansion
and closure of autophagosome membranes as E2 and E3 enzymes in the
ATG8 lipidation cascade, respectively (17). It was previously indicated that
lncRNA GAS5 is involved in the pathogenesis of immune-associated
diseases (18). In the present
study, the expression of LC3, Beclin1, ATG3, ATG5, ATG12, ATG16L1
and lncRNA GAS5 in peripheral blood mononuclear cells (PBMCs) from
patients with AS and healthy control (HC) subjects was examined,
and it was assessed whether the expression of genes associated with
autophagy is correlated with clinical parameters and inflammatory
cytokines in patients with AS to explore the role and clinical
significance of autophagy in the development of AS.
Materials and methods
Patients and sample collection
Between January 2018 and January 2019, 60 patients
with AS were enrolled from the outpatient department and inpatient
department of Rheumatology and Immunology of the Affiliated
Hospital of North Sichuan Medical College (Nanchong, China). All
patients with AS enrolled in this study fulfilled the 1984 modified
New York criteria for AS (19). All
patients completed a questionnaire, which was used to define the
age, sex, and disease severity indexes, including the Bath AS
Disease Activity Index (BASDAI) and the Bath AS Functional Index
(BASFI) (20). Laboratory
parameters, including the erythrocyte sedimentation rate (ESR) and
hypersensitive C-reactive protein (hsCRP), were also recorded. The
BASDAI, ESR and hsCRP were used to evaluate disease activity and
the normal reference range in the peripheral blood was as follows:
ESR, 0-22 mm/1 h; and hsCRP, 0-9 mg/l. The 60 patients were divided
into an active disease group (n=30; BASDAI ≥6, or 6>BASDAI>4
and ESR>22 mm/1 h, or 6>BASDAI>4 and hsCRP>9 mg/l) and
an inactive disease group (n=30; BASDAI≤4). Control blood samples
were obtained from 30 age- and sex-matched healthy subjects who are
healthy examinees at the Medical Examination Center of the
Affiliated Hospital of North Sichuan Medical College between
January 2018 and January 2019 without any evidence of disease. The
present study was approved by the ethics committee of the
Affiliated Hospital of North Sichuan Medical College (Nanchong,
China) and written informed consent was obtained from all of the
study subjects enrolled.
RNA extraction and reverse
transcription-quantitative PCR (RT-qPCR)
The PBMCs were isolated from the blood samples of 30
patients with active AS (AAS) and 30 patients with inactive AS
(IAS) and 30 HCs by Ficoll-Hypaque density gradient centrifugation.
Total RNA was extracted from PBMCs using TRIzol® reagent
(Invitrogen; Thermo Fisher Scientific, Inc.). RT was performed
using a PrimeScript RT reagent with gDNA Eraser kit (Takara Bio,
Inc.). The synthesized complementary (c)DNA was cryopreserved at
-80˚C until qPCR was performed. The expression of LC3, Beclin1,
ATG5, ATG12, ATG16L1 and lncRNA GAS5 was measured by real-time qPCR
using the Applied Biosystems QuantStudio™ 12K Flex Real-Time PCR
system (Applied Biosystems; Thermo Fisher Scientific, Inc.). The
reaction mixture contained SYBR Green real-time PCR master mix
(Takara Bio, Inc.) (5.2 µl), forward and reverse primers (0.1 µl
each), cDNA sample (1 µl) and double-distilled H2O (3.6
µl). The thermocycling conditions were as follows: 95˚C for 10 min,
followed by 40 cycles of denaturation at 95˚C for 10 sec and
annealing/extension at 60˚C for 1 min. All reactions were performed
in triplicate. The housekeeping gene β-actin was used as an
internal control. The following primer pairs were used for the
qPCR: LC3 forward (F), 5'-AACATGAGCGAGTTGGTCAAG-3' and reverse (R),
5'-GCTCGTAGATGTCCGCGAT-3'; Beclin-1 F, 5'-ACCTCAGCCGAAGACTGAAG-3'
and R, 5'-AACAGCGTTTGTAGTTCTGACA-3'; ATG3 F,
5'-GATGGCGGATGGGTAGATACA-3' and R, 5'-TCTTCACATAGTGCTGAGCAATC-3';
ATG5 F, 5'-CACTTTGTCAGTTACCAACGTCA-3' and R,
5'-TAGAGCGAACACGAACCATCC-3'; ATG12 F, 5'-TAGAGCGAACACGAACCATCC-3'
and R, 5'-CACTGCCAAAACACTCATAGAGA-3'; ATG16L1 F,
5'-TAGAGCGAACACGAACCATCC-3' and R, 5'-CCTTTCTGGGTTTAAGTCCAGG-3';
GAS5 F, 5'-AGCAAGCCTAACTCAAGCCATTGG-3' and R,
5'-ACAGTGTAGTCAAGCCGACTCTCC-3' and β-actin F,
5'-GAGCTACGAGCTGCCTGACG-3' and R, 5'-GTAGTTTCGTGGATGCCACAG-3'.
Relative quantification with the
2-ΔΔCq method (21) was used to evaluate the expression of
target genes.
Statistical analysis
Statistical analysis was performed using SPSS 22.0
statistical analysis software (IBM Corp.). Quantitative data
approximating a normal distribution are expressed as the mean ±
standard deviation. Statistical analysis of demographics, clinical
and laboratory indicators were compared using independent samples
t-test, Mann-Whitney U test and one-way ANOVA followed by the LSD
post hoc test. Correlations were calculated using Spearman's rank
correlation test. A receiver operating characteristic (ROC) curve
was drawn and the area under the ROC curve (AUC) was determined to
estimate the diagnostic value of lncRNA GAS5 for AS. P<0.05 was
considered to indicate statistical significance.
Results
Baseline characteristics
Table I presents the
demographic and clinical characteristics of the 30 patients with
AAS, 30 patients with IAS and 30 HCs in the present study. Patients
with AS and HCs were matched in terms of age and sex. There were
significant differences in the BASDAI and BASFI between the AAS
group and the IAS group.
 | Table IClinical characteristics of patients
with AS and HCs. |
Table I
Clinical characteristics of patients
with AS and HCs.
|
Characteristics | AS (n=60) | AAS (n=30) | IAS (n=30) | HC (n=30) |
|---|
| Age (years) | 37.1±9.74 | 37.67±10.01 | 32.67±7.05 | 36.53±9.59 |
| Sex
(male/female) | 48/12 | 26/4 | 22/8 | 23/7 |
| Disease duration
(months) | 93.17±72.61 | 108.37±74.60 | 77.96±68.43 | - |
| Positive
HLA-B27 | 55 (91.7) | 27(90) | 28 (93.3) | - |
| BASDAI | 3.98±1.94 |
5.58±0.94a | 2.38±1.20 | - |
| BASFI | 2.44±2.45 |
3.95±2.50a | 0.93±1.12 | - |
| Anti-TNF
inhibitor | 3 (5.0%) | 0 (0.0%) | 3 (10.0%) | - |
| NSAIDs | 15 (25.0%) | 8 (26.7%) | 7 (23.3%) | - |
| DMARDs | 18 (20.0%) | 9 (30.0%) | 9 (30.0%) | - |
mRNA levels of genes associated with
autophagy and lncRNA GAS5 in patients with AS and in HCs
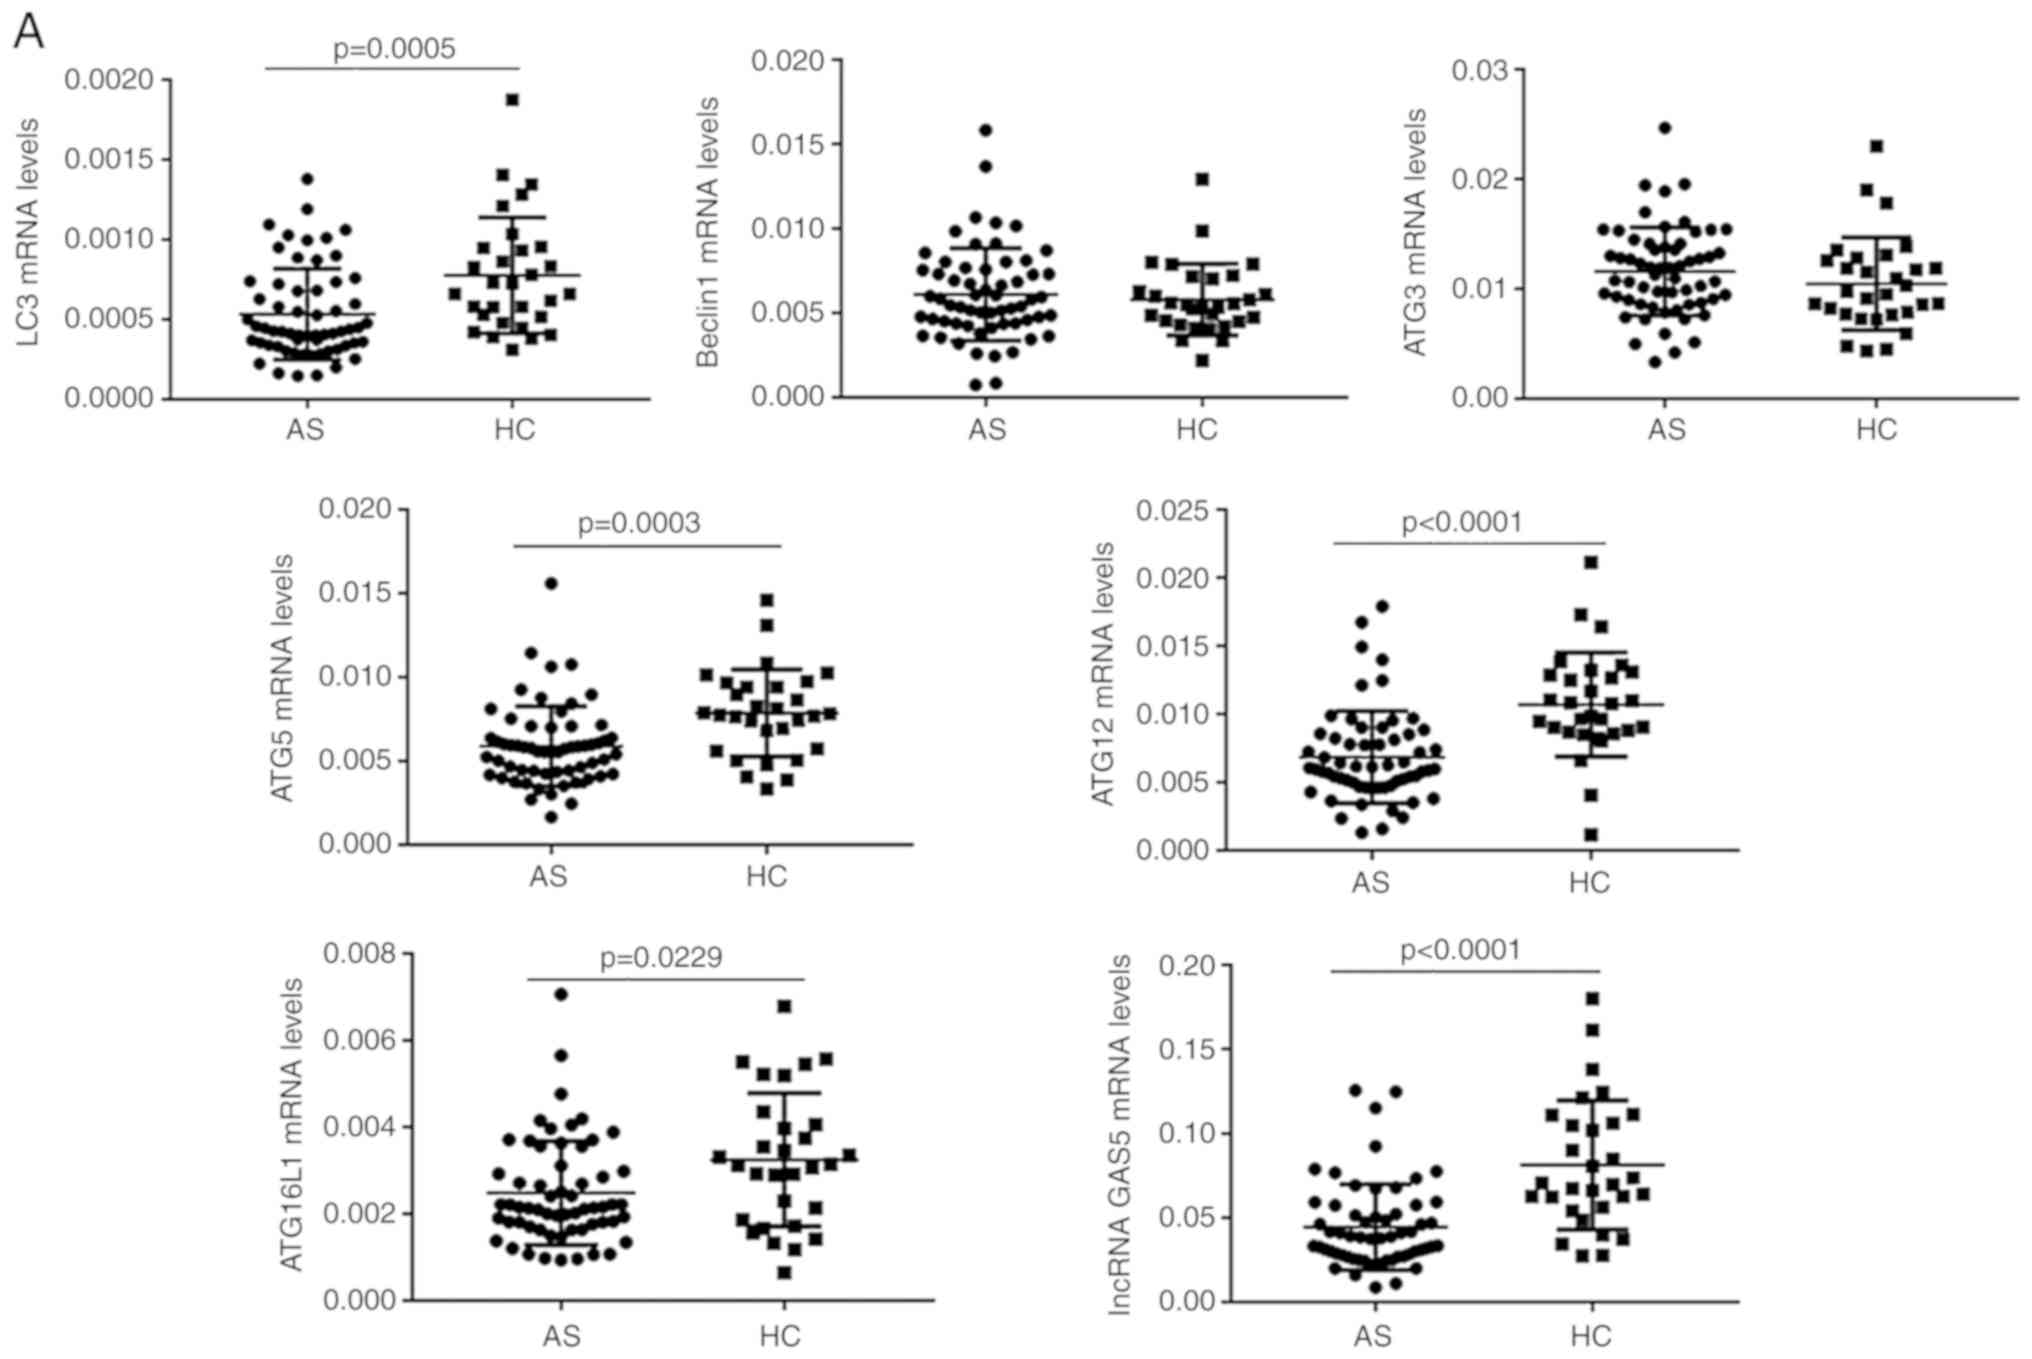
The mRNA levels of LC3, Beclin1, ATG3, ATG5, ATG12,
ATG16L1 and the levels of lncRNA GAS5 in PBMCs were detected in all
samples by RT-qPCR. As presented in Fig.
1A, the expression levels of LC3, ATG5, ATG12, ATG16L1 and
lncRNA GAS5 in PBMCs were significantly decreased in the AS
compared with the HC group (P<0.05 for each; Fig. 1A). The expression levels of Beclin1
and ATG3 mRNA in PBMCs was not significantly different between the
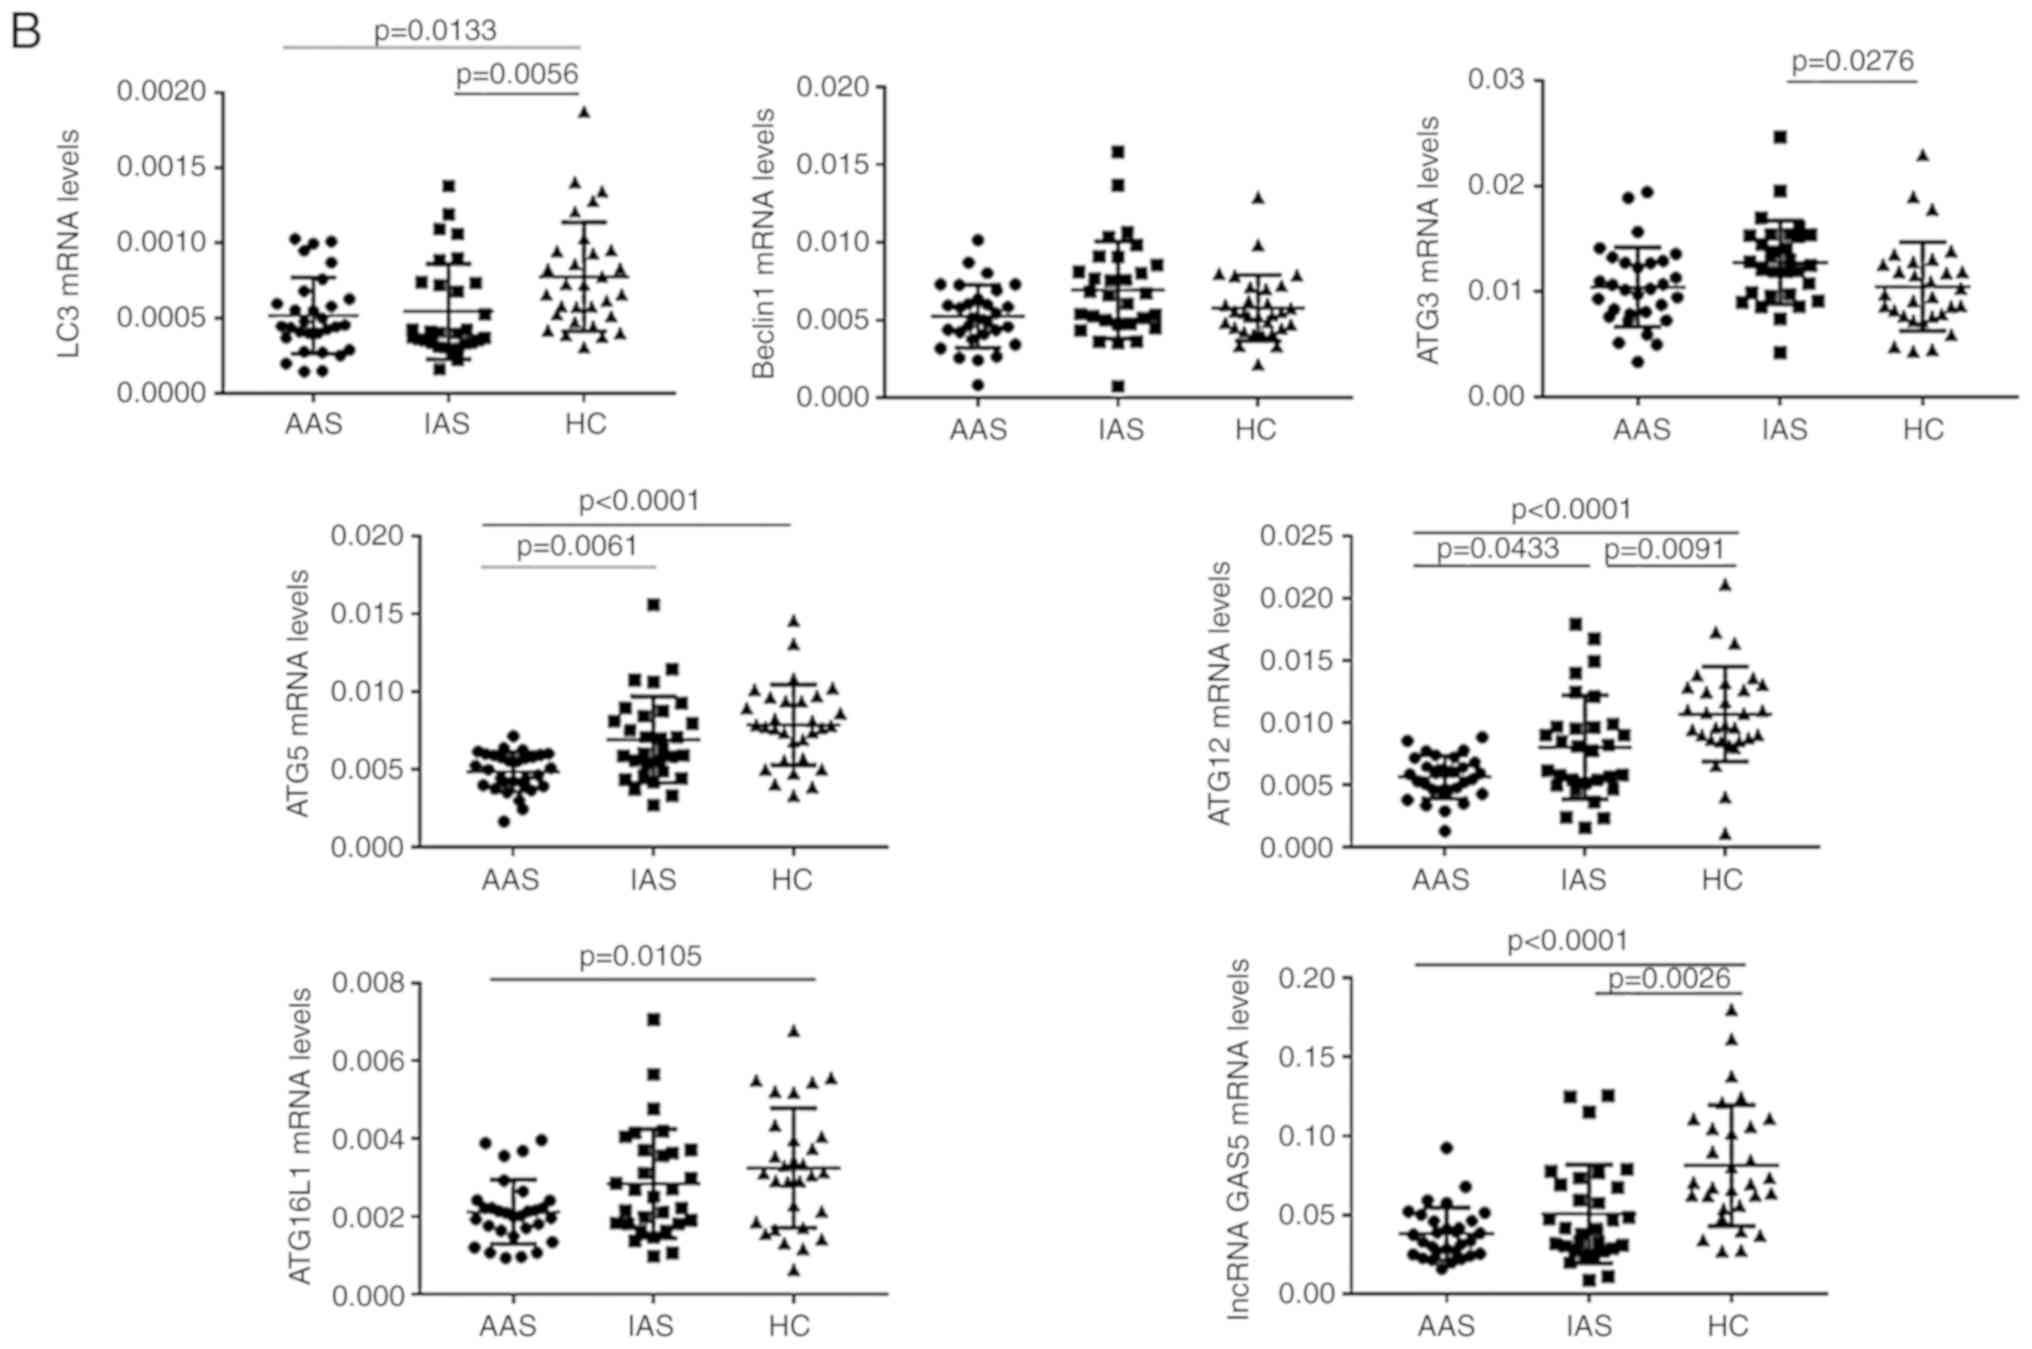
two groups (P>0.05 for each; Fig. 1A). Compared with those in the IAS
group, the expression levels of ATG5 and ATG12 mRNA were
significantly decreased in the AAS group (P<0.05 for each;
Fig. 1B). Although no statistical
significance was obtained, the expression levels of LC3, Beclin1,
ATG3, ATG16L1 and lncRNA GAS5 in patients with AAS were lower than
those in patients with IAS (P>0.05 for each; Fig. 1B).
Positive rate of genes associated with
autophagy and lncRNA GAS5 in patients with AAS and IAS
The positive rate refers to the proportion of gene
expression of patients with AS in the active and inactive groups
that increased or decreased relative to the gene expression levels
of the HC group (based on the mean of HC). Compared with that in
the HC group, the positive rate of LC3 was 80.0% in the AAS group
and 73.3% in the IAS group. The positive rate of ATG3 was 76.7% in
the IAS group. The positive rate of ATG5 was 100% in the AAS group
and 66.7% in the IAS group. The positive rate of ATG12 was 100% in
the AAS and 80.0% in the IAS group. The positive rate of ATG16L1
was 86.7% in the AAS group. The positive rate of lncRNA GAS5 was
96.7% in the AAS and 76.7% in the IAS group (Table II).
| Table IIRate of positive expression of genes
associated with autophagy and lncRNA GAS5 in patients with AAS and
IAS (%). |
Table II
Rate of positive expression of genes
associated with autophagy and lncRNA GAS5 in patients with AAS and
IAS (%).
| Group | LC3 | ATG5 | ATG12 | ATG16L1 | lncRNA GAS5 |
|---|
| AAS | 83.3 | 100.0 | 100.0 | 86.7 | 96.7 |
| IAS | 80.0 | 66.7 | 80.0 | - | 90 |
Correlation of gene expression with
disease activity as well as laboratory indexes in patients with
AS
Correlations between detected gene expression levels
and clinical parameters reflecting disease activity of AS are
presented in Table III. The mRNA
expression levels of ATG3, ATG5 and ATG12 exhibited significant
negative correlations with the BASDAI (R=-0.336, P<0.01 for
ATG3; R=-0.359, P<0.01 for ATG5 and R=-0.294, P<0.05 for
ATG12). The mRNA expression levels of ATG3 were significantly
negatively correlated with the BASFI (R=-0.360, P<0.01). The
mRNA expression levels of ATG3, ATG5, ATG12 and lncRNA GAS5
exhibited significant negative correlations with the ESR (R=-0.357,
P<0.01 for ATG3; R=-0.393, P<0.01 for ATG5; R=-0.313,
P<0.05 for ATG12 and R=-0.424, P<0.01 for lncRNA GAS5). The
mRNA expression levels of ATG5 and ATG12 were significantly
negatively correlated with hsCRP (R=-0.328, P<0.05 for ATG5;
R=-0.258, P<0.05 for ATG12). The mRNA expression levels of
ATG16L1 was significantly negatively correlated with leukocytes
(R=-0.310, P<0.05). However, the mRNA expression levels of LC3
and Beclin1 were not correlated with any clinical parameters of
patients with AS.
| Table IIICorrelations of the expression of
various genes associated with autophagy and lncRNA GAS5 in PBMCs of
AS patients with clinical and laboratory data. |
Table III
Correlations of the expression of
various genes associated with autophagy and lncRNA GAS5 in PBMCs of
AS patients with clinical and laboratory data.
| | LC3 | Beclin1 | ATG3 | ATG5 | ATG12 | ATG16L1 | lncRNA GAS5 |
|---|
| Clinical
parameter | r | P-value | r | P-value | r | P-value | R | P-value | r | P-value | r | P-value | r | P-value |
|---|
| BASDAI | 0.069 | NS | -0.190 | NS | -0.336 | 0.009 | -0.359 | 0.005 | -0.294 | 0.023 | -0.191 | NS | -0.172 | NS |
| BASFI | -0.010 | NS | -0.146 | NS | -0.360 | 0.005 | -0.271 | NS | -0.203 | NS | -0.102 | NS | -0.019 | NS |
| ESR (mm/h) | 0.014 | NS | -0.237 | NS | -0.375 | 0.003 | -0.393 | 0.002 | -0.313 | 0.015 | -0.250 | NS | -0.424 | 0.001 |
| hsCRP (mg/l) | 0.074 | NS | -0.197 | NS | -0.226 | NS | -0.328 | 0.011 | -0.258 | 0.049 | -0.233 | NS | -0.182 | NS |
| WBC
(109/l) | 0.263 | NS | -0.036 | NS | 0.016 | NS | -0.175 | NS | -0.181 | NS | -0.310 | 0.016 | -0.091 | NS |
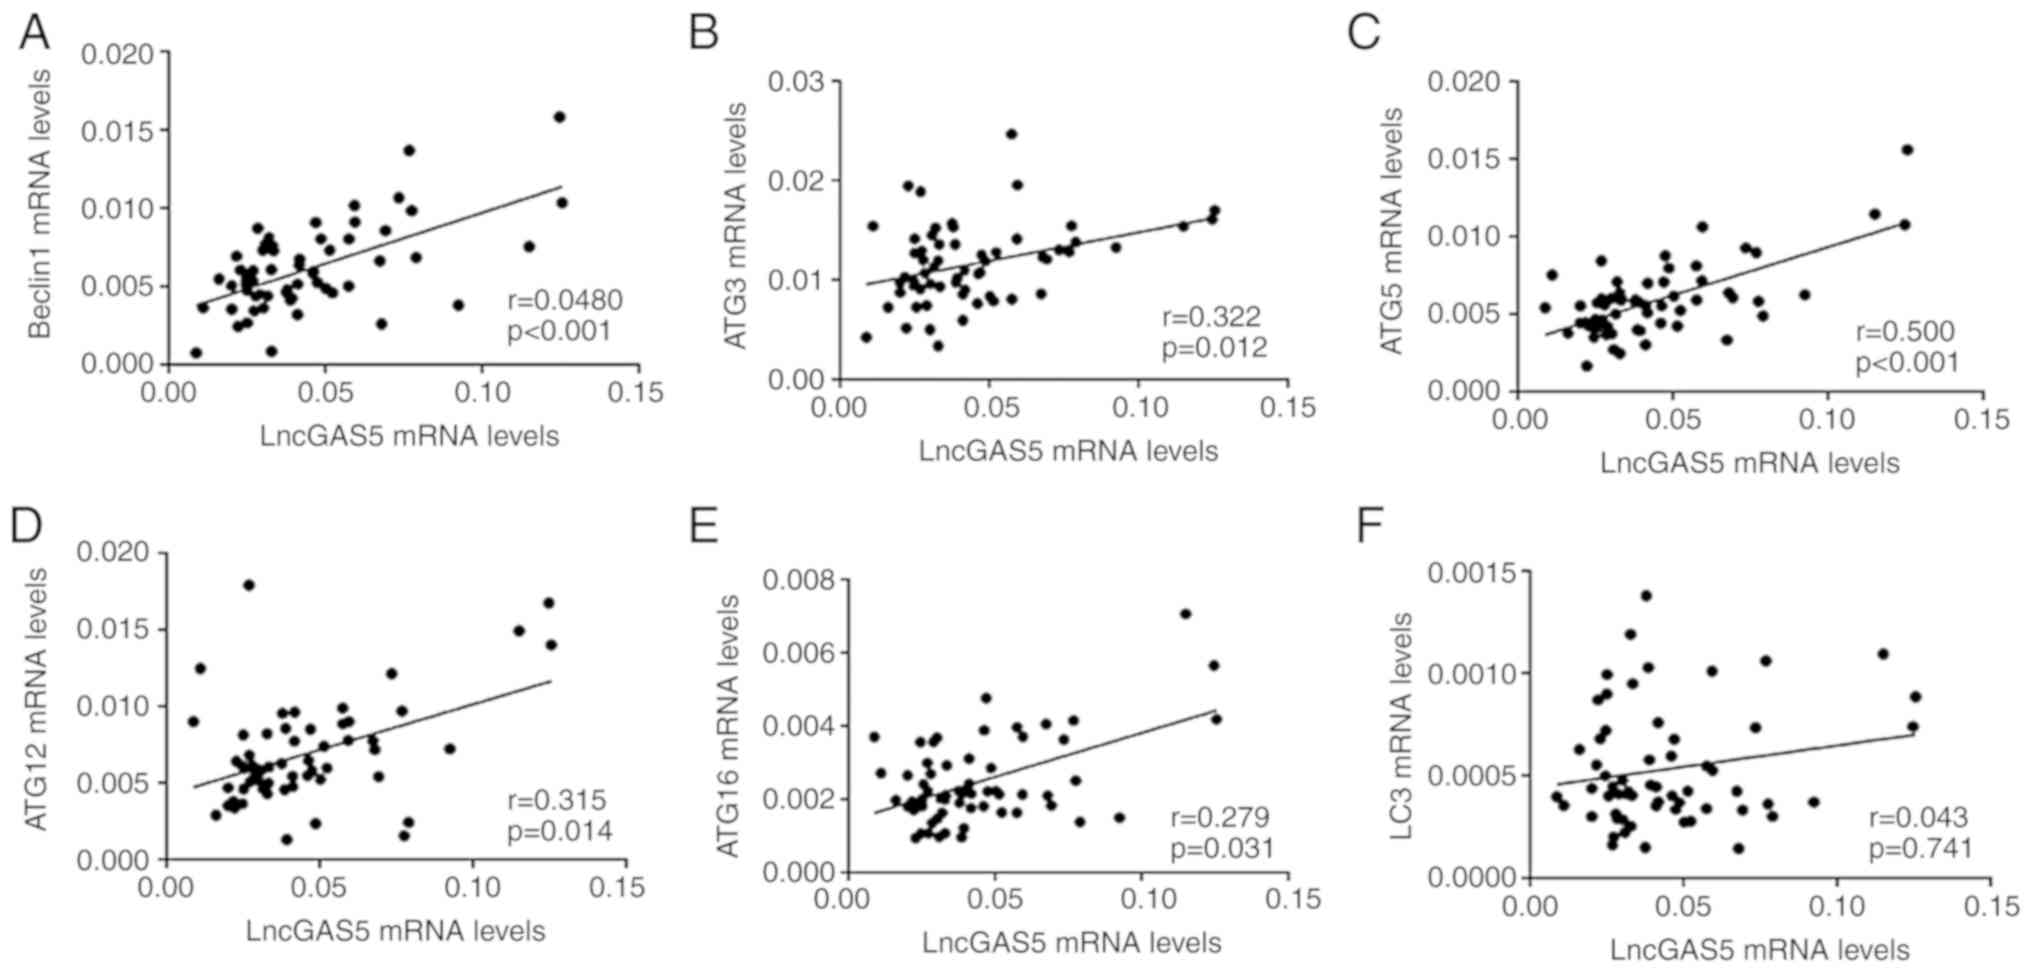
Correlations between lncRNA GAS5 and
mRNA levels of genes associated with autophagy
Increasing evidence has indicated that lncRNAs are
able to regulate autophagy through various mechanisms (7). To assess the potential associations of
the levels of lncRNA GAS5 with the mRNA levels of genes associated
with autophagy in patients with AS, the correlations between lncRNA
GAS5 and LC3, Beclin1, ATG3, ATG5, ATG12 and ATG16L1 were analysed
(Fig. 2). The results indicated that
the levels of lncRNA GAS5 were positively correlated with the
levels of Beclin1 (R=0.454, P<0.001; Fig. 2A), ATG3 (R=0.322, P=0.012; Fig. 2B), ATG5 (R=0.500, P<0.001;
Fig. 2C), ATG12 (R=0.317, P=0.014;
Fig. 2D) and ATG16L1 (R=0.279,
P=0.031; Fig. 2E), respectively.
However, no significant correlation was observed between lncRNA
GAS5 and LC3 in patients with AS (R=0.043, P=0.741; Fig. 2F).
Downregulation of lncRNA GAS5 has
diagnostic value for AS
An ROC curve was established to determine the
diagnostic value of lncRNA GAS5 in PBMCs for AS (Fig. 3). The AUC of the ROC for the use of
lncRNA GAS5 to diagnose AS was 0.808 with a 95% CI of 0.714-0.902
and cut-off value of 0.729 (P<0.0001).
Discussion
There is a growing body of evidence suggesting that
autophagy is involved in the pathogenesis of AS (12-14).
To the best of our knowledge, the present study was the first to
determine the expression levels of genes associated with autophagy
in different disease activity stages of AS. The key findings of the
present study are that ATG5 and ATG12 may serve as novel biomarkers
of AS activity and that lncRNA GAS5 is likely involved in the
pathogenesis of AS.
In a previous study, Neerinckx et al
(12) indicated that the expression
levels of ATG16L1 were lower in PBMCs of patients with AS than in
healthy controls, whereas ATG5 expression was not significantly
different between the two groups. Furthermore, Park et al
(13) and Wang et al
(14) determined that the expression
levels of LC3, Beclin1 and ATG5 mRNA were significantly decreased
in PBMCs of patients with AS. In the present study, a decrease in
the expression levels of LC3, ATG5, ATG12 and ATG16L1 was observed
in patients with AS, whereas the expression levels of Beclin1 and
ATG3 were not statistically different between the patients with AS
and HCs. The results of the present study are not completely
consistent with the results of Neerinckx et al (12), which may be due to differences in
populations. Of note, the results for ATG5 in the present study are
consistent with the results of Park et al (13) and Wang et al (14), and all of these studies were
performed on Asian populations, while the subjects of Neerinckx
et al (12) were of Caucasian
ethnicity. Furthermore, the expression of Beclin1 in the present
study was different from that of Park et al (13). The reason for the inconsistent
results may be that although the subjects of the present study were
randomly selected, the proportion of AAS and IAS patients is equal,
which may lead to selection bias. Different from these previous
studies, staging of different disease activities in patients with
AS was performed in the present study and the expression levels of
genes associated with autophagy were compared between the active
and inactive phases. In the present study, the expression levels of
ATG5 and ATG12 were significantly lower in patients with AAS than
those in patients with IAS. Although no statistical significance
was obtained, the expression levels of Beclin1, ATG3 and ATG16L1 in
patients with AAS were lower than those in patients with IAS.
Therefore, the present data indicated that the level of autophagy
in patients with AS was negatively correlated with the severity and
activity of the disease. In addition to AS, autophagy dysfunction
was also observed in Crohn's disease (22) and Psoriasis (23) as extra-articular manifestations of
AS, and other rheumatic immune diseases such as SLE (24). These results are consistent with the
notion that defective autophagy may cause inflammation and induce
or exacerbate autoimmune disease (25), and further support the results of
autophagy dysfunction in AS obtained in the present study.
Autophagy is an important mechanism by which cells
decompose cell components through lysosomes or vacuoles to maintain
normal physiological activity and homeostasis of the body (5,6). The
formation of autophagy is a dynamic process, which may be roughly
divided into the following stages: Initiation, nucleation,
elongation, fusion and degradation (26). This process is regulated by a unique
set of autophagy genes. Loss or abnormal expression of core
autophagy genes at various stages of autophagy leads to
dysfunctional autophagy, which leads to a variety of diseases.
Beclin1 is mainly involved in the initiation stage of autophagy and
is an important gene facilitating initiate autophagy. The
Atg12-Atg5-Atg16L1 complex is essential for the formation of
autophagosomes and contributes to the expansion of the phagophore.
ATG3 is involved in the lipidation of LC3 as an E2 enzyme.
Furthermore, the ATG12-ATG3 complex has an important role in the
basic autophagy flux, endosome function and endolysosomal transport
in the late nuclear period (27). A
study suggested that neonatal lethality occurred in mice with gene
knockout of ATGs involved in the conjugation system
(ATG3-/-,
ATG5-/-,
ATG12-/- and
ATG16L1-/-) and
Beclin1-/- mice died of
E8.5(28). LC3-II is located in the
outer and inner membranes of autophagosomes and the amount of
LC3-II is also widely used for the quantification of autophagic
activity (15). In the present
study, no significant changes in Beclin1 expression in PBMCs from
patients with AS were observed, indicating that autophagy
initiation may not be impaired. However, the expression of LC3,
ATG5, ATG12 and ATG16L1 mRNA in PBMCs of patients with AS was
downregulated. These results suggest that there may be certain
possible factors in PBMCs of patients with AS: Obstruction of
double-membrane autophagosomes, decreased autophagy activity, and
impaired accumulation and endolysosomal transport in the late
nuclear weeks.
The detailed mechanism of autophagy dysfunction in
AS remains to be fully elucidated. It may be speculated that
autophagy deficiency is involved in the pathogenesis and disease
activity of AS through crosstalk with immune inflammation and
endoplasmic reticulum (ER) stress.
It is well known that inhibition of autophagy may
lead to increased inflammasome activation (29). In addition to directly promoting the
formation of inflammatory bodies and eventually leading to the
secretion of inflammatory cytokines, including IL-1β and IL-18,
defective autophagy may also indirectly promote the secretion of
IL-23 and IL-17(30). In addition to
promoting inflammation, autophagic dysfunction also promotes ER
stress in the pathogenesis of AS. Impaired autophagy was observed
in colitis and neurodegenerative diseases with active ER stress
(31,32). ATG16L1T300A, causing
impaired autophagy, leads to increased ER stress in Paneth cells
(33). Suppression of ATG7 resulted
in elevated ER stress and restoration of the expression of ATG7
resulted in dampened ER stress in obesity (34). Therefore, autophagy dysfunction may
also promote ER stress. It may therefore be speculated that
defective autophagy and ER stress may synergistically promote AS
development.
Although no consensus for the use of genes
associated with autophagy as diagnostic markers for disease has
been reached, it has been indicated that overexpression or low
expression of certain autophagy genes may be used as biomarkers for
the diagnosis and prognosis of certain diseases (35). The BASDAI has been widely used to
asses AS activity and the levels of CRP and ESR are also used to
reflect inflammation in patients with AS. In the present study, the
expression of ATG5 and ATG12 exhibited a negative correlation with
BASDI, ESR and CRP. In addition, the present study determined that
ATG5 and ATG12 were downregulated in patients with AAS, as compared
with those in patients with IAS. The expression levels of ATG5 and
ATG12 in PBMCs of patients with AS were negatively correlated with
the severity and activity of the disease, and downregulation of
ATG5 and ATG12 may be used as an indicator of the activity of
AS.
LncRNA GAS5 may be involved in the development of
autoimmune diseases by regulating the proliferation and activity of
immune cells and participating in immune responses. Previous
studies have indicated that lncRNA GAS5 is abnormally expressed in
various immune-associated diseases, including RA, SLE and multiple
sclerosis (18). In the present
study, lncRNA GAS5 was downregulated in patients with AS compared
with that in HCs. It was therefore indicated that lncRNA GAS5 may
be a suppressor for AS. In addition, studies have found that the
expression of lncRNA GAS5 is reduced in most tumour types (36), including prostate cancer, renal cell
carcinoma, ovarian cancer, cervical cancer and osteosarcoma. Of
note, the occurrence of tumours is associated with the immune
inflammatory microenvironment, mainly manifested as chronic
inflammation (37). Therefore, it
further supports that lncRNA GAS5 may be involved in the regulation
of the pathogenesis of diseases related to immune dysfunction.
However, the detailed role and mechanism of lncRNA GAS5 still needs
to be further clarified. Evidence has indicated that lncRNA GAS5
promoted autophagy through interactions with the PI3K/AKT/mTOR
pathway (10,38). Knockdown of lncRNA GAS5 significantly
increased the expression of mTOR and suppressed the expression of
ATGs (38). The present study
suggested that lncRNA GAS5 was downregulated in PBMCs of patients
with AS and was positively correlated with the expression of
Beclin1, ATG3, ATG5, ATG12 and ATG16. Thus, these data strongly
supported the present hypothesis that lncRNA GAS5 participates in
the pathogenesis of AS by regulating autophagy. The precise
regulatory mechanism of lncRNA GAS5 in autophagy modulation and its
detailed roles in AS still requires further elucidation. The
present study preliminarily proved the correlation between lncRNA
GAS5 and autophagy genes. In future studies, loss- and
gain-of-function studies on lncRNA GAS5 will be performed through
gene transfection and other techniques to observe the resulting
changes of expression levels of autophagy genes or proteins.
Early diagnosis is key for curing AS. Most patients
with AS have a long-term delay in diagnosis (39). Of note, there is currently no gold
standard for diagnosis, and thus, it is important to identify
diagnostic markers for AS. Although HLA-B27 is closely associated
with the pathogenesis of AS and the HLA-B27-positive rate of
patients with AS reaches 85-90% (40), the expression of HLA-B27 may not
necessarily be positive in all patients with AS and may also be
negative. Therefore, it is necessary to further study biomarkers
for AS. The present study indicated that the occurrence and
development of AS are associated with changes in multiple lncRNA
expression patterns, and certain lncRNAs may become potential
biomarkers for the diagnosis of AS (41). LncRNA GAS5 is involved in the
occurrence and development of various diseases by regulating
various physiological processes, including the cell cycle, growth
and apoptosis. Studies have indicated that lncRNA GAS5 is involved
in the development of atherosclerosis and associated diseases. Low
expression of lncRNA GAS5 may be used as a promising biomarker for
the diagnosis of coronary artery disease (42). In the present study, the expression
levels of lncRNA GAS5 in patients with AS were significantly lower
than those of HC, but there was no significant difference between
AAS and IAS. Furthermore, the ROC curve analysis indicated that
downregulation of lncRNA GAS5 in PBMCs may be used to effectively
distinguish patients with AS from healthy individuals. Therefore,
lncRNA GAS5 may be an independent diagnostic indicator for AS.
Most diagnostic indicators available are elevated,
but a small number of diagnostic indicators are reduced. The
decrease of an index in a disease may lead to the occurrence of the
disease due to the lack of the index. For instance, studies have
indicated that the downregulation of lncRNA-D16366 is a biomarker
for the diagnosis of hepatocellular carcinoma (43) and the downregulation of lncRNA
activated by TGF-β in serum is a reliable diagnostic marker for OA
(44). In the present study, the
diagnostic value of LncRNA GAS5 was determined by ROC curve
analysis. ROC analysis is a method that reflects the sensitivity
and specificity of diagnostic indicators for a disease, with
sensitivity% displayed on the ordinate and (100%-specificity%) on
the abscissa. The AUC indicates the diagnostic efficacy of the
indicator. The value of the AUC ranges from 1.0 to 0.5, with a
value closer to 1 indicating better diagnostic efficacy. The
results obtained in the present ROC curve analysis is only
preliminary. Future studies will further verify the diagnostic
efficacy by expanding the sample size, functional experiments and
disease controls such as increasing sample size of the rheumatoid
arthritis group and osteoarthritis group.
In conclusion, autophagy genes and lncRNA GAS5 were
downregulated in AS and the level of autophagy in patients with AS
was negatively correlated with the severity and activity of the
disease. Furthermore, ATG5 and ATG12 may serve as novel biomarkers
of AS activity. LncRNA GAS5 may be an independent diagnostic
indicator of AS. These results suggest that autophagy deficiency
and the downregulation of lncRNA GAS5 may be associated with the
pathogenesis of AS. The downregulated autophagy genes and lncRNA
GAS5 may be of potential use for the clinical diagnosis and
treatment of AS.
Acknowledgements
Not applicable.
Funding
The present study was supported by the Sichuan Youth
Science and Technology Innovation Team fund of the Sichuan
Provincial Department of Education (grant no. 14TD0021).
Availability of data and materials
The datasets used and/or analyzed during the current
study are available from the corresponding author on reasonable
request.
Authors' contributions
QZ and YQ as the corresponding authors conceived the
research design and revised the writing of the manuscript. MT
collected of case specimens, performed experiments and drafted the
manuscript. TL assisted in the completion of the experiments. YY
helped with the collection of patient data and samples, and the
completion of certain experiments. JZ purchased reagents and
assisted in the completion of preliminary experiments. QX and WZ
helped collect specimens. All authors read and approved the final
version of the manuscript.
Ethics approval and consent to
participate
This study was approved by the ethics committee of
the Affiliated Hospital of North Sichuan Medical College and
informed consent from all participants was obtained.
Patient consent for publication
Not applicable
Competing interests
The authors declare that they have no competing
interests.
References
|
1
|
Wang R and Ward MM: Epidemiology of axial
spondyloarthritis: An update. Curr Opin Rheumatol. 30:137–143.
2018.PubMed/NCBI View Article : Google Scholar
|
|
2
|
Sieper J and Poddubnyy D: Axial
spondyloarthritis. Lancet. 390:73–84. 2017.PubMed/NCBI View Article : Google Scholar
|
|
3
|
Smith JA: Update on ankylosing
spondylitis: Current concepts in pathogenesis. Curr Allergy Asthma
Rep. 15(489)2015.PubMed/NCBI View Article : Google Scholar
|
|
4
|
Saha S, Panigrahi DP, Patil S and Bhutia
SK: Autophagy in health and disease: A comprehensive review. Biomed
Pharmacother. 104:485–495. 2018.PubMed/NCBI View Article : Google Scholar
|
|
5
|
Feng Y, He D, Yao Z and Klionsky DJ: The
machinery of macroautophagy. Cell Res. 24:24–41. 2014.PubMed/NCBI View Article : Google Scholar
|
|
6
|
Galluzzi L, Baehrecke EH, Ballabio A, Boya
P, Bravo-San Pedro JM, Cecconi F, Choi AM, Chu CT, Codogno P,
Colombo MI, et al: Molecular definitions of autophagy and related
processes. EMBO J. 36:1811–1836. 2017.PubMed/NCBI View Article : Google Scholar
|
|
7
|
Yang L, Wang H, Shen Q, Feng L and Jin H:
Long non-coding RNAs involved in autophagy regulation. Cell Death
Dis. 8(e3073)2017.PubMed/NCBI View Article : Google Scholar
|
|
8
|
Wang K, Liu CY, Zhou LY, Wang JX, Wang M,
Zhao B, Zhao WK, Xu SJ, Fan LH, Zhang XJ, et al: APF lncRNA
regulates autophagy and myocardial infarction by targeting
miR-188-3p. Nat Commun. 6(6779)2015.PubMed/NCBI View Article : Google Scholar
|
|
9
|
Cai Q, Wang S, Jin L, Weng M, Zhou D, Wang
J, Tang Z and Quan Z: Long non-coding RNA GBCDRlnc1 induces
chemoresistance of gallbladder cancer cells by activating
autophagy. Mol Cancer. 18(82)2019.PubMed/NCBI View Article : Google Scholar
|
|
10
|
Gu J, Wang Y, Wang X, Zhou D, Wang X, Zhou
M and He Z: Effect of the LncRNA GAS5-MiR-23a-ATG3 axis in
regulating autophagy in patients with breast cancer. Cell Physiol
Biochem. 48:194–207. 2018.PubMed/NCBI View Article : Google Scholar
|
|
11
|
Rockel JS and Kapoor M: Autophagy:
Controlling cell fate in rheumatic diseases. Nat Rev Rheumatol.
12:517–531. 2016.PubMed/NCBI View Article : Google Scholar
|
|
12
|
Neerinckx B, Carter S and Lories R: IL-23
expression and activation of autophagy in synovium and PBMCs of
HLA-B27 positive patients with ankylosing spondylitis. Response to:
‘Evidence that autophagy, but not the unfolded protein response,
regulates the expression of IL-23 in the gut of patients with
ankylosing spondylitis and subclinical gut inflammation’ by Ciccia
et al. Ann Rheum Dis. 73(e68)2014.PubMed/NCBI View Article : Google Scholar
|
|
13
|
Park MC, Kim HW, Lee SW, Song JJ and Park
YB: Defective autophagy activity and its association with spinal
damage in patients with ankylosing spondylitis. Joint Bone Spine.
84:583–587. 2017.PubMed/NCBI View Article : Google Scholar
|
|
14
|
Wang Y, Luo J, Wang X, Yang B and Cui L:
MicroRNA-199a-5p induced autophagy and inhibits the pathogenesis of
ankylosing spondylitis by modulating the mTOR signaling via
directly targeting ras homolog enriched in brain (Rheb). Cell
Physiol Biochem. 42:2481–2491. 2017.PubMed/NCBI View Article : Google Scholar
|
|
15
|
Kabeya Y, Mizushima N, Ueno T, Yamamoto A,
Kirisako T, Noda T, Kominami E, Ohsumi Y and Yoshimori T: LC3, a
mammalian homologue of yeast Apg8p, is localized in autophagosome
membranes after processing. EMBO J. 19:5720–5728. 2000.PubMed/NCBI View Article : Google Scholar
|
|
16
|
Menon MB and Dhamija S: Beclin 1
phosphorylation-at the center of autophagy regulation. Front Cell
Dev Biol. 6(137)2018.PubMed/NCBI View Article : Google Scholar
|
|
17
|
Nakatogawa H: Two ubiquitin-like
conjugation systems that mediate membrane formation during
autophagy. Essays Biochem. 55:39–50. 2013.PubMed/NCBI View Article : Google Scholar
|
|
18
|
Mayama T, Marr AK and Kino T: Differential
expression of glucocorticoid receptor noncoding RNA repressor Gas5
in autoimmune and inflammatory diseases. Horm Metab Res.
48:550–557. 2016.PubMed/NCBI View Article : Google Scholar
|
|
19
|
van der Linden S, Valkenburg HA and Cats
A: Evaluation of diagnostic criteria for ankylosing spondylitis. A
proposal for modification of the New York criteria. Arthritis
Rheum. 27:361–368. 1984.PubMed/NCBI View Article : Google Scholar
|
|
20
|
Madsen OR: Stability of fatigue, pain,
patient global assessment and the bath ankylosing spondylitis
functional index (BASFI) in spondyloarthropathy patients with
stable disease according to the bath ankylosing spondylitis disease
activity index (BASDAI). Rheumatol Int. 38:425–432. 2018.PubMed/NCBI View Article : Google Scholar
|
|
21
|
Livak KJ and Schmittgen TD: Analysis of
relative gene expression data using real-time quantitative PCR and
the 2(-Delta Delta C(T)) method. Methods. 25:402–408.
2001.PubMed/NCBI View Article : Google Scholar
|
|
22
|
McCarroll SA, Huett A, Kuballa P,
Chilewski SD, Landry A, Goyette P, Zody MC, Hall JL, Brant SR, Cho
JH, et al: Deletion polymorphism upstream of IRGM associated with
altered IRGM expression and Crohn's disease. Nat Genet.
40:1107–1112. 2008.PubMed/NCBI View
Article : Google Scholar
|
|
23
|
Mahil SK, Twelves S, Farkas K,
Setta-Kaffetzi N, Burden AD, Gach JE, Irvine AD, Képíró L,
Mockenhaupt M, Oon HH, et al: AP1S3 mutations cause skin
autoinflammation by disrupting keratinocyte autophagy and
up-regulating IL-36 production. J Invest Dermatol. 136:2251–2259.
2016.PubMed/NCBI View Article : Google Scholar
|
|
24
|
Martinez J, Cunha LD, Park S, Yang M, Lu
Q, Orchard R, Li QZ, Yan M, Janke L, Guy C, et al: Noncanonical
autophagy inhibits the autoinflammatory, lupus-like response to
dying cells. Nature. 533:115–119. 2016.PubMed/NCBI View Article : Google Scholar
|
|
25
|
Yang Z, Goronzy JJ and Weyand CM:
Autophagy in autoimmune disease. J Mol Med (Berl). 93:707–717.
2015.PubMed/NCBI View Article : Google Scholar
|
|
26
|
Parzych KR and Klionsky DJ: An overview of
autophagy: Morphology, mechanism, and regulation. Antioxid Redox
Signal. 20:460–473. 2014.PubMed/NCBI View Article : Google Scholar
|
|
27
|
Murrow L, Malhotra R and Debnath J:
ATG12-ATG3 interacts with Alix to promote basal autophagic flux and
late endosome function. Nat Cell Biol. 17:300–310. 2015.PubMed/NCBI View
Article : Google Scholar
|
|
28
|
Kuma A, Komatsu M and Mizushima N:
Autophagy-monitoring and autophagy-deficient mice. Autophagy.
13:1619–1628. 2017.PubMed/NCBI View Article : Google Scholar
|
|
29
|
Shi H, Zhang Z, Wang X, Li R, Hou W, Bi W
and Zhang X: Inhibition of autophagy induces IL-1β release from
ARPE-19 cells via ROS mediated NLRP3 inflammasome activation under
high glucose stress. Biochem Biophys Res Commun. 463:1071–1076.
2015.PubMed/NCBI View Article : Google Scholar
|
|
30
|
Peral de Castro C, Jones SA, Ní Cheallaigh
C, Hearnden CA, Williams L, Winter J, Lavelle EC, Mills KH and
Harris J: Autophagy regulates IL-23 secretion and innate T cell
responses through effects on IL-1 secretion. J Immunol.
189:4144–4153. 2012.PubMed/NCBI View Article : Google Scholar
|
|
31
|
Kökten T, Gibot S, Lepage P, D'Alessio S,
Hablot J, Ndiaye NC, Busby-Venner H, Monot C, Garnier B, Moulin D,
et al: TREM-1 inhibition restores impaired autophagy activity and
reduces colitis in mice. J Crohns Colitis. 12:230–244.
2018.PubMed/NCBI View Article : Google Scholar
|
|
32
|
Yin Y, Sun G, Li E, Kiselyov K and Sun D:
ER stress and impaired autophagy flux in neuronal degeneration and
brain injury. Ageing Res Rev. 34:3–14. 2017.PubMed/NCBI View Article : Google Scholar
|
|
33
|
Deuring JJ, Fuhler GM, Konstantinov SR,
Peppelenbosch MP, Kuipers EJ, de Haar C and van der Woude CJ:
Genomic ATG16L1 risk allele-restricted Paneth cell ER stress in
quiescent Crohn's disease. Gut. 63:1081–1091. 2014.PubMed/NCBI View Article : Google Scholar
|
|
34
|
Yang L, Li P, Fu S, Calay ES and
Hotamisligil GS: Defective hepatic autophagy in obesity promotes ER
stress and causes insulin resistance. Cell Metab. 11:467–478.
2010.PubMed/NCBI View Article : Google Scholar
|
|
35
|
Castellazzi M, Patergnani S, Donadio M,
Giorgi G, Bonora M, Bosi C, Brombo G, Pugliatti M, Seripa D,
Zuliani G and Pinton P: Autophagy and mitophagy biomarkers are
reduced in sera of patients with Alzheimer's disease and mild
cognitive impairment. Sci Rep. 9(20009)2019.PubMed/NCBI View Article : Google Scholar
|
|
36
|
Yu Y and Hann SS: Novel tumor suppressor
lncRNA growth arrest-specific 5 (GAS5) in human cancer. Onco
Targets Ther. 12:8421–8436. 2019.PubMed/NCBI View Article : Google Scholar
|
|
37
|
Yang L and Lin PC: Mechanisms that drive
inflammatory tumor microenvironment, tumor heterogeneity, and
metastatic progression. Semin Cancer Biol. 47:185–195.
2017.PubMed/NCBI View Article : Google Scholar
|
|
38
|
Li L, Huang C, He Y, Sang Z, Liu G and Dai
H: Knockdown of long non-coding RNA GAS5 increases miR-23a by
targeting ATG3 involved in autophagy and cell viability. Cell
Physiol Biochem. 48:1723–1734. 2018.PubMed/NCBI View Article : Google Scholar
|
|
39
|
Guillemin F, Briancon S, Pourel J and
Gaucher A: Long-term disability and prolonged sick leaves as
outcome measurements in ankylosing spondylitis. Possible predictive
factors. Arthritis Rheum. 33:1001–1006. 1990.PubMed/NCBI View Article : Google Scholar
|
|
40
|
Golder V and Schachna L: Ankylosing
spondylitis: An update. Aust Fam Physician. 42:780–784.
2013.PubMed/NCBI
|
|
41
|
Xu Z, Zhou X, Li H, Chen Q and Chen G:
Identification of the key genes and long noncoding RNAs in
ankylosing spondylitis using RNA sequencing. Int J Mol Med.
43:1179–1192. 2019.PubMed/NCBI View Article : Google Scholar
|
|
42
|
Yin Q, Wu A and Liu M: Plasma long
non-coding RNA (lncRNA) GAS5 is a new biomarker for coronary artery
disease. Med Sci Monit. 23:6042–6048. 2017.PubMed/NCBI View Article : Google Scholar
|
|
43
|
Chao Y and Zhou D: lncRNA-D16366 is a
potential biomarker for diagnosis and prognosis of hepatocellular
carcinoma. Med Sci Monit. 25:6581–6586. 2019.PubMed/NCBI View Article : Google Scholar
|
|
44
|
Dang X, Lian L and Wu D: The diagnostic
value and pathogenetic role of lncRNA-ATB in patients with
osteoarthritis. Cell Mol Biol Lett. 23(55)2018.PubMed/NCBI View Article : Google Scholar
|