Introduction
Prostate cancer (PCa) is the most frequently
diagnosed urologic malignancy worldwide (1). Prostate-specific antigen (PSA) is the
most widely employed biomarker for the screening for PCa since
several landmark trials were performed (2-5).
These studies demonstrated that increased PSA is associated with an
increased risk of PCa, particularly for patients with total PSA
(tPSA) of >10 ng/ml, whose risk of being diagnosed with PCa may
be up to 50-70%. Furthermore, PSA also has an important role in the
selection of treatment strategies and prediction of biochemical
recurrence (6,7). Of note, age is thought to be strongly
associated with the incidence of PCa and the European Association
of Urology recommends that males aged >40 years undergo regular
screening for PCa (8). However,
<60% of patients aged 40 years were estimated to have taken a
PSA test (9).
Renal function-associated parameters, including uric
acid, creatinine, urea and cystatin C, are important factors
assessed in routine blood tests. Studies have reported that these
parameters may impact the metabolism and proliferation of cancer
cells and predict the prognosis of patients treated for upper-tract
urothelial carcinoma, hepatocellular carcinoma and colon cancer
(10-14).
However, a limited number of studies investigated the significance
of these parameters in PCa and only one study investigated the
correlation between uric acid and tPSA levels (15). Therefore, the present study aimed to
explore the correlation between further renal function-associated
parameters and tPSA levels using big data of patients from
different Chinese ethnicities undergoing regular physical
examination at the Medical Examination Center of the largest
hospital in southwest China. The possible correlation between PSA
and these parameters was assessed, which may help identify patients
with an increased risk of PCa based on abnormal values determined
in different departments.
Patients and methods
Patients
The present study was a cross-sectional study.
Patients undergoing a general physical examination at the Medical
Examination Center of West China Hospital (Chengdu, China) between
January 2010 and May 2019 were retrospectively identified from the
system and screened for inclusion. The patients were classified
based on the 10 most common ethnicities in China, including the
Han, Zhuang, Hui, Miao, Tujia, Mongolian, Tibetan, Yi, Manchu and
Qiang ethnicities. Patient data, including age, tPSA and renal
function-associated parameters (cystatin C, uric acid, creatinine
and urea), were recorded. The ethics committee of West China
Hospital (Chengdu, China) approved the present study.
Statistical analysis
Mean values with standard deviations were calculated
for the above variables for the entire cohort and subpopulations.
The χ2 test or Fisher's test and the Kruskal-Wallis
rank-sum test was used to compare categorical and continuous
variables of different ethnicities. Pearson's correlation
coefficients (r) with 95% CI were also analyzed to assess the
correlation between tPSA and cystatin, uric acid, creatinine and
urea in the entire cohort and different ethnicities. Correlation
coefficient values (r) were calculated to indicate a positive (0 to
1) or negative (-1 to 0) correlation. The absolute value of
correlation coefficient was defined as 0-0.39 (weak), 0.4-0.6
(moderate) and 0.7-1 (strong) to indicate the strength of
correlation (16). P<0.05 was
considered to indicate a statistically significant difference.
Statistical analyses were performed using Empowerstats software
(X&Y Solutions, Inc.).
Results
Baseline characteristics of included
patients
The characteristics of patients undergoing physical
examination between 2010 and 2019 at the Medical Examination Center
of West China Hospital (Chengdu, China) are presented in Table I. A total of 259,146 male patients
were included and the mean age was 47.83±14.28 years. The mean tPSA
level in these patients was 1.15±1.88 ng/ml. Most of the patients
(96.99%) had tPSA levels of <4 ng/ml. Furthermore, 2.55% had
tPSA levels of 4-10 ng/ml and 0.46% had tPSA levels >10 ng/ml.
The mean levels of renal function-associated parameters were
0.91±0.19, 388.02±77.37, 83.94±55.89 and 5.23±1.23 ng/ml for
cystatin C, uric acid, creatinine and urea, respectively. In total,
255,914 patients of the present study were of the Han ethnicity,
representing 98.75% of the study population. In total, 180 (0.07%),
611 (0.24%), 203 (0.08%), 502 (0.19%), 139 (0.05%), 495 (0.19%),
152 (0.06%), 460 (0.18%) and 225 (0.09%) of the patients
represented the Zhuang, Hui, Miao, Tujia, Mongolian, Tibetan, Yi,
Manchu and Qiang ethnicities, respectively. Significant differences
were observed among the ethnicities in cystatin C (P<0.001),
uric acid (P<0.001), creatinine (P<0.001), urea (P<0.001)
and tPSA (P=0.007; Table II).
Furthermore, the distribution of patients with tPSA <4, 4-10 and
>10 ng/ml was also significantly different among the different
ethnicities (P=0.036).
 | Table ICharacteristics of patients of the
present study (n=259, 146). |
Table I
Characteristics of patients of the
present study (n=259, 146).
| Characteristics | Value | Normal range of
laboratory parameters |
|---|
| Age (years) | 47.83±14.28 | |
| Cystatin C
(mg/ml) | 0.91±0.19 | 0.51-1.09 |
| Uric acid
(µmol/l) | 388.02±77.37 | 149-416 |
| Creatinine
(µmol/l) | 83.94±55.89 | 54-133 |
| Urea (mmol/l) | 5.23±1.36 | 2.0-7.1 |
| tPSA (ng/ml) | 1.15±1.88 | 4-10 |
|
<4 | 245,654 (96.99) | |
|
4-10 | 6,468 (2.55) | |
|
>10 | 1,159 (0.46) | |
| Ethnicity | | |
|
Han | 255,914 (98.75) | |
|
Zhuang | 180 (0.07) | |
|
Hui | 611 (0.24) | |
|
Miao | 203 (0.08) | |
|
Tujia | 502 (0.19) | |
|
Mongolian | 139 (0.05) | |
|
Tibetan | 495 (0.19) | |
|
Yi | 152 (0.06) | |
|
Manchu | 460 (0.18) | |
|
Qiang | 225 (0.09) | |
|
Other | 265 (0.10) | |
| Table IICharacteristics of patients of the
present study by ethnicity (n=259,146). |
Table II
Characteristics of patients of the
present study by ethnicity (n=259,146).
| Parameter | Han (n=255,914) | Zhuang (n=180) | Hui (n=611) | Miao (n=203) | Tujia (n=502) | Mongolian
(n=139) | Tibet (n=495) | Yi (n=152) | Manchu (n=460) | Qiang (n=225) | Other (n=265) | P-value |
|---|
| Age (years) | 47.88±14.28 | 41.86±14.65 | 43.60±13.46 | 39.64±11.66 | 40.06±10.66 | 43.27±15.53 | 49.38±13.25 | 46.16±16.14 | 47.50±15.29 | 41.82±11.82 | 43.99±12.95 | <0.001 |
| Cystatin C
(mg/ml) | 0.91±0.19 | 0.87±0.12 | 0.88±0.12 | 0.87±0.11 | 0.86±0.11 | 0.87±0.17 | 0.88±0.14 | 0.87±0.10 | 0.90±0.17 | 0.88±0.12 | 0.87±0.15 | <0.001 |
| Uric acid
(µmol/l) | 387.90±77.34 | 392.74±72.56 | 401.68±84.14 | 394.51±83.25 | 398.65±70.92 | 384.03±78.27 | 386.90±77.98 | 410.42±87.70 | 398.60±79.26 | 388.12±71.34 | 414.51±87.03 | <0.001 |
| Creatinine
(µmol/l) | 83.97±56.22 | 85.63±13.32 | 80.92±12.35 | 82.32±13.12 | 81.94±12.70 | 78.78±14.95 | 80.91±14.33 | 84.10±20.30 | 81.49±12.77 | 82.23±11.56 | 81.88±14.85 | <0.001 |
| Urea (mmol/l) | 5.23±1.37 | 5.05±1.27 | 5.00±1.15 | 5.05±1.18 | 5.27±1.23 | 4.82±1.34 | 5.16±1.46 | 5.28±1.59 | 5.17±1.18 | 5.30±1.24 | 5.15±1.26 | <0.001 |
| tPSA (ng/ml) | 1.15±1.89 | 0.93±1.09 | 1.01±0.71 | 0.88±0.91 | 0.94±0.91 | 1.11±1.08 | 0.96±0.85 | 1.29±1.43 | 1.11±1.32 | 1.07±0.80 | 1.02±1.04 | 0.007 |
|
<4 | 242,495 (96.97) | 175 (97.77) | 599 (98.84) | 201 (99.50) | 493 (98.40) | 133 (95.68) | 487 (98.58) | 144 (94.74) | 444 (96.94) | 222 (98.67) | 261 (98.49) | |
|
4-10 | 6411 (2.56) | 4 (2.23) | 7 (1.16) | 0 (0.00) | 8 (1.60) | 6 (4.32) | 7 (1.42) | 7 (4.61) | 12 (2.62) | 3 (1.33) | 3 (1.13) | |
|
>10 | 1154 (0.46) | 0 (0.00) | 0 (0.00) | 1 (0.50) | 0 (0.00) | 0 (0.00) | 0 (0.00) | 1 (0.66) | 2 (0.44) | 0 (0.00) | 1 (0.38) | |
Correlation of tPSA with cystatin C,
creatinine, uric acid and urea in the total population and
different Chinese ethnicities
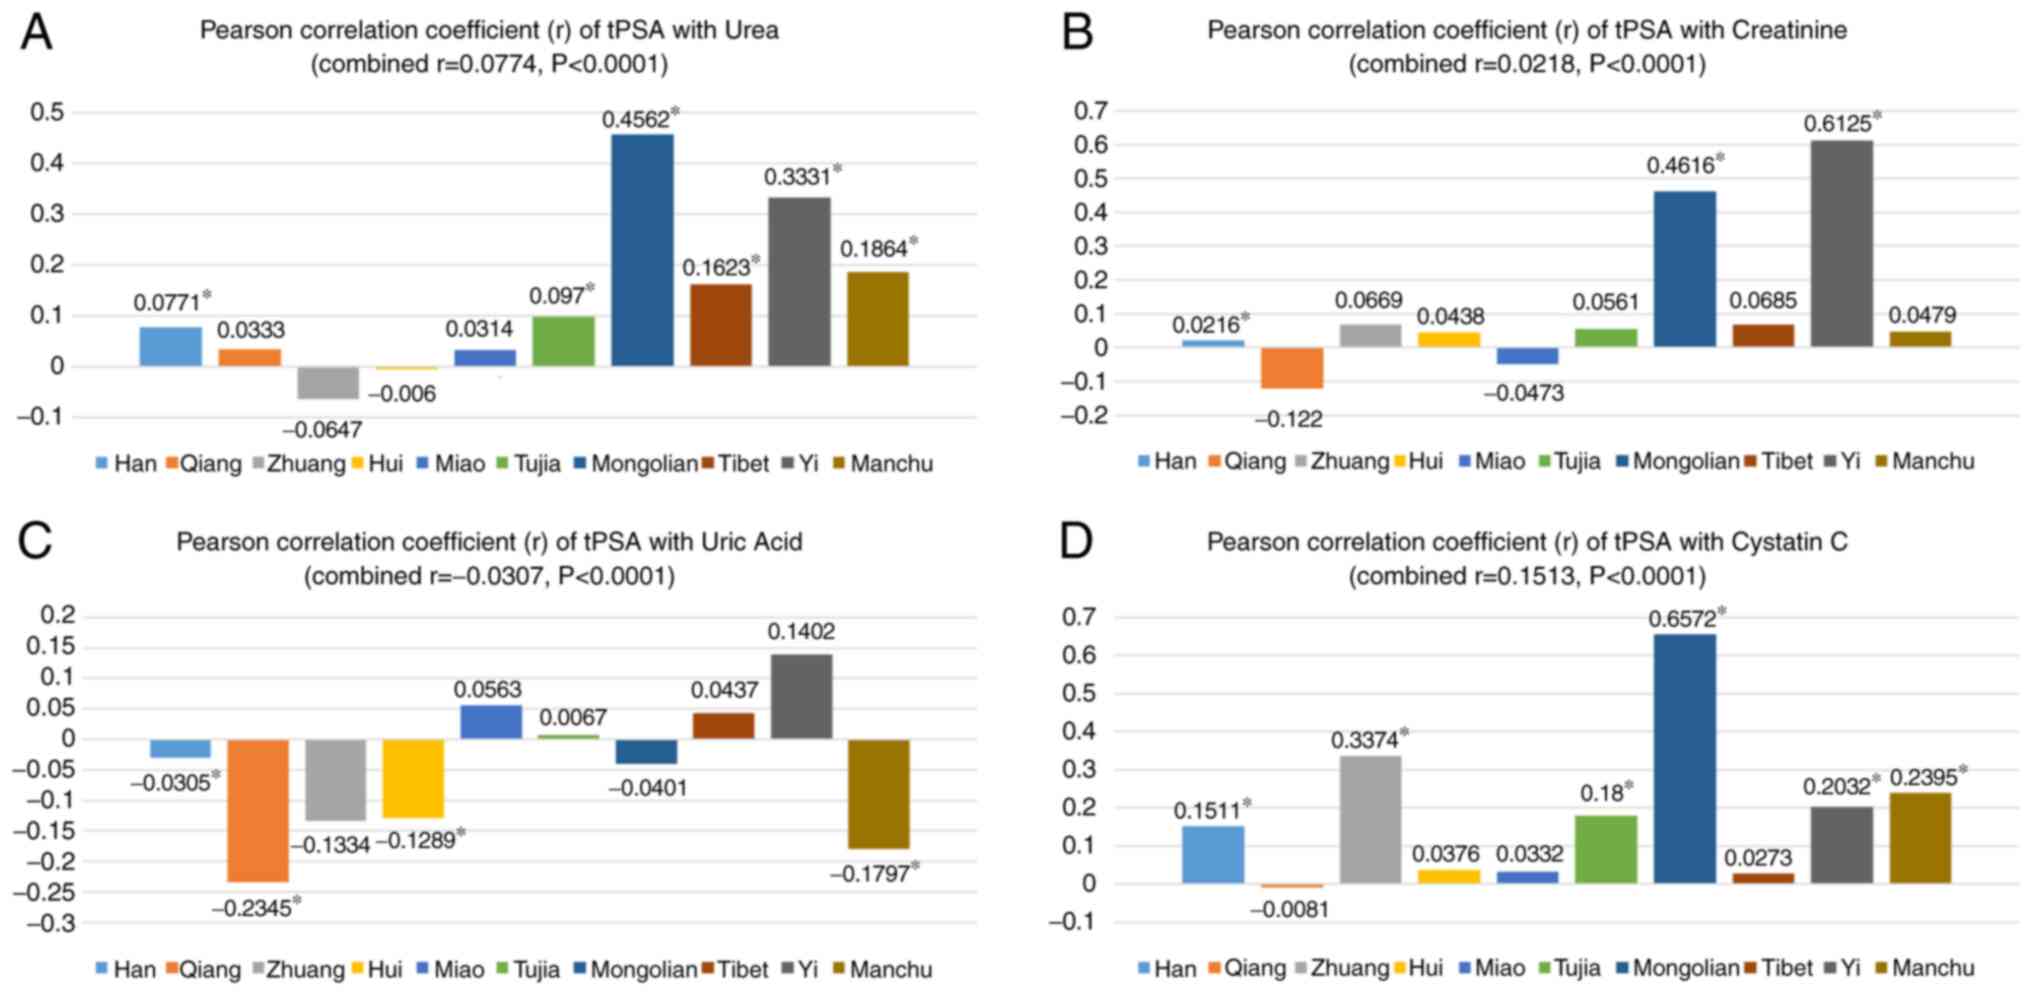
In the total population, all the four parameters,
urea (r=0.0774, P<0.0001), creatinine (r=0.0218, P<0.0001),
uric acid (r=-0.0307, P<0.0001) and cystatin C (r=0.1513,
P<0.0001), were weakly positively correlated with tPSA (Fig. 1). In the subgroup analysis, urea was
positively correlated with tPSA among the Mongolian (r=0.4562,
P<0.0001), Tibetan (r=0.1623, P=0.0003), Yi (r=0.3331,
P<0.0001) and Manchu ethnicities (r=0.1864, P=0.0001).
Similarly, a moderate positive correlation was noted between
creatinine and tPSA for the Mongolian (r=0.4616, P<0.0001) and
Yi ethnicities (r=0.6125, P<0.0001). In addition, cystatin C was
positively correlated with tPSA among the Han (r=0.1511,
P<0.0001), Zhuang (r=0.3374, P<0.0001), Tujia (r=0.1800,
P=0.0001), Mongolian (r=0.6572, P<0.0001), Yi (r=0.2032,
P=0.0301) and Manchu ethnicities (r=0.2395, P<0.0001). However,
uric acid was weakly negatively correlated with tPSA among the
Qiang (r=-0.2345, P=0.0004), Hui (r=-0.1289, P=0.0015) and Manchu
ethnicities (r=-0.1797, P<0.0001; Fig. 1).
Discussion
In the present study, the correlation between tPSA
levels and uric acid, creatinine, cystatin C and urea levels was
investigated in a large patient population. Overall, a generally
significant and slightly positive correlation was noted between
tPSA levels and cystatin C levels among the 10 most common Chinese
ethnicities. A potential reason accounting for the correlation
being present in the total population but moderate in certain
subgroups may be that the majority of the total population belonged
to the Han ethnicity and the correlation was weak among Han
Chinese. Subgroup analyses indicated that tPSA levels were
moderately positively correlated with creatinine levels in
Mongolian and Yi ethnicities, and cystatin C levels were positively
correlated in the Mongolian ethnicity.
Multiple studies have reported the role of the four
renal function-associated parameters in different cancer types.
Cystatin C is an inhibitor of cancer invasion and metastasis by
inactivating cathepsin protease activity (17,18),
and a previous study by Wegiel et al (19) reported that cystatin expression was
significantly reduced in PCa tissues compared with benign
non-malignant tissues as determined by immunohistology analysis.
However, the present study indicated that the correlation between
cystatin levels and tPSA levels (potential risk of PCa) was weak
among different Chinese ethnicities except Mongolians. A possible
explanation for the moderate correlation in Mongolians is that the
homogeneous population exhibits increased expression of cystatin C
in patients with PCa and higher tPSA levels. Another study by
Weinstein et al (20),
reported that creatinine levels within the normal range were
positively associated with PCa, while Wang (21) also indicated that the
sarcosine/creatinine ratio was significantly different in the PCa
group compared with that in the benign prostate hyperplasia group.
Consistently with this, the present study indicated that creatinine
levels were positively correlated with tPSA levels; however, the
effect size was small except in the Mongolian and Yi ethnicities.
Uric acid is an antioxidant and exhibits a strong protective effect
against cancer by exerting a role in the suppression of lipid
peroxidation and free oxygen radical formation (22,23).
These properties were supported by a study in which the control
group (tPSA, 0.91±0.6 ng/ml) had significantly higher uric acid
levels compared with the PCa group (tPSA, 6.87±7.27 ng/ml)
(15). In accordance with this, the
present study verified a negative correlation between tPSA levels
and uric acid levels in a large population. To date, only few
studies have explored the correlation of urea levels with tPSA
levels and PCa (15). The present
study demonstrated only a slightly positive correlation between
urea levels and tPSA levels, and further high-quality studies are
required for clarification in the future.
The strength of the present study was the large
population, as well as the differentiation between various Chinese
minority ethnicities. the present study demonstrated only a slight
correlation between tPSA levels and cystatin C, creatinine, uric
acid and urea levels compared with the studies mentioned above.
Thus, a clinically significant notion deduced from the present
results is that patients who are only examined for those four
parameters in different departments and exhibit abnormal cystatin C
values should also be assessed for their PSA levels and risk of
PCa. In particular, when creatinine, urea or cystatin C levels are
increased in Mongolian patients, a PSA test should be considered.
To the best of our knowledge, the present study was the first to
investigate the correlation between tPSA levels and these four
parameters among different Chinese ethnicities using
population-based data.
The limitations of the present study should be
considered when interpreting the results. First, as a key parameter
of renal function, the estimated glomerular filtration rate was not
included in the analysis. Furthermore, the diagnosis of PCa was not
followed up, limiting further analysis of the correlation between
those parameters and PCa. In addition, as the Han ethnicity
accounted for 98.75% of the entire population of the present study,
the number of patients of other minority ethnic groups was far less
than that of the Han ethnicity, which may have led to potential
bias. Given that the present study included 10 different
ethnicities, it was not possible to further assess the data using
measures such as propensity score matching for subsequent analysis.
In addition, because the present study was a population-based
real-world study with the goal of demonstrating differences between
ethnicities, it is necessary to present the exact number of
patients with different ethnicities. Furthermore, only a limited
number of baseline characteristics was recorded and analyzed. Other
potential confounding factors, including the age and presence of
other diseases at the time of physical examination, may have also
impacted the present results. Last but not the least, the present
study lacked any follow-up and future studies with more complete
baseline information and follow-up of PCa occurrence are
required.
In conclusion, the present study used data from a
large population to reveal a generally significant but slightly
positive correlation between tPSA and cystatin C levels among the
10 most common ethnicities in China. Subgroup analyses indicated
that the tPSA levels were moderately positively correlated with the
creatinine level in the Mongolian and Yi ethnicities and that the
cystatin C level was positively correlated in the Mongolian
ethnicity. The present results indicated that patients with
abnormal values for these parameters should be further assessed to
determine their PSA levels and subsequent risk for PCa. Future
studies are certainly required to confirm and expand the present
results.
Acknowledgements
Not applicable.
Funding
This program was supported by the National Key
R&D Program of China (grant nos. 2017YFC0907504 and
2017YFC0907501) and Programs from the Science and Technology
Department of Sichuan Province (grant no. 2019JDR0144).
Availability of data and materials
The datasets used and/or analyzed during the current
study are available from the corresponding author on reasonable
request.
Authors' contributions
RL collected and analyzed data, drafted the
manuscript. TB and HY conducted the statistical analysis and
revised the manuscript. HT and TJ conceived the project and revised
the manuscript. All authors read and approved the final manuscript
and agreed to be accountable for all aspects of the work.
Ethics approval and consent to
participate
The Ethics Committee of West China Hospital
(Chengdu, China) approved the present study. There was no
requirement for informed consent from the patients due to the
retrospective nature of the study.
Patient consent for publication
Not applicable.
Competing interests
The authors declare that they have no competing
interests.
References
|
1
|
Bray F, Ferlay J, Soerjomataram I, Siegel
RL, Torre LA and Jemal A: Global cancer statistics 2018: GLOBOCAN
estimates of incidence and mortality worldwide for 36 cancers in
185 countries. CA Cancer J Clin. 68:394–424. 2018.PubMed/NCBI View Article : Google Scholar
|
|
2
|
Aus G, Damber JE, Khatami A, Lilja H,
Stranne J and Hugosson J: Individualized screening interval for
prostate cancer based on prostate-specific antigen level: Results
of a prospective, randomized, population-based study. Arch Intern
Med. 165:1857–1861. 2005.PubMed/NCBI View Article : Google Scholar
|
|
3
|
Thompson IM, Pauler DK, Goodman PJ, Tangen
CM, Lucia MS, Parnes HL, Minasian LM, Ford LG, Lippman SM, Crawford
ED, et al: Prevalence of prostate cancer among men with a
prostate-specific antigen level < or =4.0 ng per milliliter. N
Engl J Med. 350:2239–2246. 2004.PubMed/NCBI View Article : Google Scholar
|
|
4
|
Schroder FH, van der Cruijsen-Koeter I, de
Koning HJ, Vis AN, Hoedemaeker RF and Kranse R: Prostate cancer
detection at low prostate specific antigen. J Urol. 163:806–812.
2000.
|
|
5
|
Antenor JA, Han M, Roehl KA, Nadler RB and
Catalona WJ: Relationship between initial prostate specific antigen
level and subsequent prostate cancer detection in a longitudinal
screening study. J Urol. 172:90–93. 2004.PubMed/NCBI View Article : Google Scholar
|
|
6
|
Botchorishvili G, Matikainen MP and Lilja
H: Early prostate-specific antigen changes and the diagnosis and
prognosis of prostate cancer. Curr Opin Urol. 19:221–226.
2009.PubMed/NCBI View Article : Google Scholar
|
|
7
|
Schröder FH, Hugosson J, Carlsson S,
Tammela T, Määttänen L, Auvinen A, Kwiatkowski M, Recker F and
Roobol MJ: Screening for prostate cancer decreases the risk of
developing metastatic disease: Findings from the European
Randomized Study of Screening for Prostate Cancer (ERSPC). Eur
Urol. 62:745–752. 2012.PubMed/NCBI View Article : Google Scholar
|
|
8
|
Heidenreich A, Abrahamsson PA, Artibani W,
Catto J, Montorsi F, Van Poppel H, Wirth M and Mottet N: European
Association of Urology: Early detection of prostate cancer:
European Association of Urology recommendation. Eur Urol.
64:347–354. 2013.PubMed/NCBI View Article : Google Scholar
|
|
9
|
Kilmer G, Roberts H, Hughes E, Li Y,
Valluru B, Fan A, Giles W, Mokdad A and Jiles R: Centers for
Disease Control and Prevention (CDC): Surveillance of certain
health behaviors and conditions among states and selected local
areas-Behavioral Risk Factor Surveillance System (BRFSS), United
States, 2006. MMWR Surveill Summ. 57:1–188. 2008.PubMed/NCBI
|
|
10
|
Nagamani SC and Erez A: A metabolic link
between the urea cycle and cancer cell proliferation. Mol Cell
Oncol. 3(e1127314)2016.PubMed/NCBI View Article : Google Scholar
|
|
11
|
Keshet R, Szlosarek P, Carracedo A and
Erez A: Rewiring urea cycle metabolism in cancer to support
anabolism. Nat Rev Cancer. 18:634–645. 2018.PubMed/NCBI View Article : Google Scholar
|
|
12
|
Tan P, Shi M, Chen J, Xu H, Xie N, Xu H,
Jiang Y, Ai JZ, Liu LR, Yang L and Wei Q: The preoperative serum
cystatin-C as an independent prognostic factor for survival in
upper tract urothelial carcinoma. Asian J Androl. 21:163–169.
2019.PubMed/NCBI View Article : Google Scholar
|
|
13
|
Evans TRJ, Kudo M, Finn RS, Han KH, Cheng
AL, Ikeda M, Kraljevic S, Ren M, Dutcus CE, Piscaglia F and Sung
MW: Urine protein:creatinine ratio vs. 24-hour urine protein for
proteinuria management: Analysis from the phase 3 REFLECT study of
lenvatinib vs. sorafenib in hepatocellular carcinoma. Br J Cancer.
121:218–221. 2019.PubMed/NCBI View Article : Google Scholar
|
|
14
|
Selcukbiricik F, Kanbay M, Solak Y, Bilici
A, Kanitez M, Balik E and Mandel NM: Serum uric acid as a surrogate
marker of favorable response to bevacizumab treatment in patients
with metastatic colon cancer. Clin Transl Oncol. 18:1082–1087.
2016.PubMed/NCBI View Article : Google Scholar
|
|
15
|
Benli E, Cirakoglu A, Ayyildiz SN and Yüce
A: Comparison of serum uric acid levels between prostate cancer
patients and a control group. Cent European J Urol. 71:242–247.
2018.PubMed/NCBI View Article : Google Scholar
|
|
16
|
Hashmi A, Cahill GL, Zaldana M, Davis G,
Cronin BJ, Brandel MG, Beletsky A, Taj R, Buckstaff TM, Vinocur D,
et al: Can head circumference be used as a proxy for intracranial
volume in patients with craniosynostosis? Ann Plast Surg. 82 (5S
Suppl 4):S295–S300. 2019.PubMed/NCBI View Article : Google Scholar
|
|
17
|
Ebert E, Werle B, Jülke B, Kopitar-Jerala
N, Kos J, Lah T, Abrahamson M, Spiess E and Ebert W: Expression of
cysteine protease inhibitors stefin A, stefin B, and cystatin C in
human lung tumor tissue. Adv Exp Med Biol. 421:259–265.
1997.PubMed/NCBI View Article : Google Scholar
|
|
18
|
Friedrich B, Jung K, Lein M, Türk I,
Rudolph B, Hampel G, Schnorr D and Loening SA: Cathepsins B, H, L
and cysteine protease inhibitors in malignant prostate cell lines,
primary cultured prostatic cells and prostatic tissue. Eur J
Cancer. 35:138–144. 1999.PubMed/NCBI View Article : Google Scholar
|
|
19
|
Wegiel B, Jiborn T, Abrahamson M,
Helczynski L, Otterbein L, Persson JL and Bjartell A: Cystatin C is
downregulated in prostate cancer and modulates invasion of prostate
cancer cells via MAPK/Erk and androgen receptor pathways. PLoS One.
4(e7953)2009.PubMed/NCBI View Article : Google Scholar
|
|
20
|
Weinstein SJ, Mackrain K,
Stolzenberg-Solomon RZ, Selhub J, Virtamo J and Albanes D: Serum
creatinine and prostate cancer risk in a prospective study. Cancer
Epidemiol Biomarkers Prev. 18:2643–2649. 2009.PubMed/NCBI View Article : Google Scholar
|
|
21
|
Wang M, Zou L, Liang J, Wang X, Zhang D,
Fang Y, Zhang J, Xiao F and Liu M: The urinary sarcosine/creatinine
ratio is a potential diagnostic and prognostic marker in prostate
cancer. Med Sci Monit. 24:3034–3041. 2018.PubMed/NCBI View Article : Google Scholar
|
|
22
|
Kolonel LN, Yoshizawa C, Nomura AM and
Stemmermann GN: Relationship of serum uric acid to cancer
occurrence in a prospective male cohort. Cancer Epidemiol
Biomarkers Prev. 3:225–228. 1994.PubMed/NCBI
|
|
23
|
Ames BN, Cathcart R, Schwiers E and
Hochstein P: Uric acid provides an antioxidant defense in humans
against oxidant- and radical-caused aging and cancer: A hypothesis.
Proc Natl Acad Sci USA. 78:6858–6862. 1981.PubMed/NCBI View Article : Google Scholar
|