Introduction
Colorectal cancer (CRC) is the third most commonly
occurring cancer in men and the second most common cancer in women.
In total, >1.8 million new cases were diagnosed in 2018(1). Although patients with CRC can be
successfully cured by undergoing curative resection when diagnosed
at the early stage, 20-45% of patients still develop recurrence or
metastasis (2). In fact, the 1-year
survival rate of patients with CRC remains at ~36% (3). Numerous previous studies have
suggested the possible mechanisms of CRC progression, such as the
impact of circulating eosinophils and basophils, olfactomedin 1 and
microRNA-497 on progression of CRC (4-6);
however, these findings do not comprehensively explain the
mechanisms behind the tumor progression and the effective treatment
of this malignancy. Therefore, further investigations to determine
the underlying mechanisms of the initiation and development of CRC
are required.
The local colonic environment and genetic
alterations may be associated with the pathogenesis of CRC. For
example, Fusobacterium nucleatum was reported to promote CRC
development in mice by upregulating the expression levels of
microRNA-21, indicating that bacteria may participate in human CRC
progression (7). In addition,
multiple genetic and epigenetic events have been identified to
stimulate the initiation, progression and metastasis of CRC in
patients, including the hypermutation of BRAF (V600E), somatic copy
number alterations and microsatellite alterations (8,9).
Multiple studies have frequently observed the BRAF (V600E) mutation
in CRC tissues, where it was discovered to predict the prognosis
and drug responsiveness for patients with CRC (10,11).
Furthermore, chromosomal instability has been illustrated to result
in copy number alterations in patients with CRC, including losses
at 1p36, 1p12, 1q21, 9p13, 14q11, 16p13 and 16p12, and gains at
7q11 and 7q22(12). Microsatellite
alterations with allelic loss at 9p24.2 were also discovered to be
associated with the less aggressive metastasis of CRC (13). However, the identification of tumor
suppressor genes in CRC is lacking. It has been reported that SMAD4
expression was frequently lost in CRC, and that alterations in bone
morphogenetic protein signaling promoted the switch from its tumor
suppressive properties to promoting metastasis (14). Notably, the adenomatous polyposis
coli (APC) tumor suppressor is mutated in ~80-90% of human CRCs,
and the restoration of full-length APC was discovered to
sufficiently promote cellular differentiation and inhibit CRC
progression (15). However, to the
best of our knowledge, the present study was the first to identify
glutamate receptor ionotropic, kainate 1 (GRIK1) as a novel tumor
suppressor in CRC and investigated its function both in
vitro and in vivo.
Materials and methods
Clinical samples
The study was approved by the Research Ethics
Committee of Zhongshan Hospital, Fudan University (Shanghai, China)
and written, informed consent was obtained from all patients. All
specimens were handled and anonymized according to the ethical
standards of Fudan University.
CRC and adjacent normal colon tissues from 50
patients (age range, 38-74 years; 16 females and 34 males)
undergoing resection for primary CRC at Zhongshan Hospital, Fudan
University between May 2002 and July 2005 were used in the present
study. Adjacent normal tissue was dissected from the proximal
tumour resection margin with a minimum distance of 10 cm to the
tumour lesion. Tissues from 80 patients (age, 22-87 years; 33
females and 47 males) with CRC who underwent curative resection
between January 2002 and February 2005 at Zhongshan Hospital, Fudan
University were used for tissue microarrays (TMAs) construction and
prognostic analysis. The patients had not received neoadjuvant
therapy prior to surgery and patients who had no follow-up
information were not included in the study. The TNM stage of the
patients with CRC was defined according to the 6th edition of the
TNM staging system of the American Joint Committee on
Cancer/International Union Against Cancer (16).
Immunohistochemistry (IHC)
IHC analysis of GRIK1, proliferating cell nuclear
antigen (PCNA) and cleaved caspase-3 expression levels in clinical
samples was performed. Formalin-fixed, paraffin embedded specimens
of tumor and adjacent normal tissues were cut into 3 µm thick
sections. Slides were heated for 20 h at 37˚C. The tissue sections
were deparaffinized in xylene (3 times, 5 sec each) and dehydrated
via immersion in graded dilutions of alcohol solutions (absolute,
80%, 60% and water). Subsequently, the samples were boiled in
citrate buffer (pH 6.0) in a microwave oven at 100˚C for 20 sec. To
block endogenous peroxidase activity, the sections were treated
with 3% H2O2 for 15 sec at room temperature.
Subsequently, the sections were incubated with either an anti-GRIK1
(1:80; cat. no. 25779-1-AP; ProteinTech Group, Inc.), anti-PCNA
(1:100; cat. no. ab19166; Abcam) or an anti-cleaved caspase-3
(1:100; cat. no. ab2302) primary antibody overnight at 4˚C, which
was followed by incubation with horseradish peroxidase-labeled
secondary antibody (1:150; cat. no. ab6721; Abcam) for 1.5 h at
37˚C. Stained cells were visualized in three randomly selected
fields using a light microscope (magnification, x100, x200 or x400)
and the mean Integrated Optical Density value was obtained using
Image-Pro Plus version 6.0 software (Media Cybernetics, Inc.).
Semi-quantitative scores of GRIK1 expression levels (negative,
weak, moderate or strong staining) were used to analyze the
immunostaining of each CRC sample in the TMA. The IHC staining was
scored as follows: Negative (0-5% staining), weak (6-25% staining),
moderate (26-50% staining) and strong (>51% staining) (17).
Cell culture
The human CRC cell lines HCT116, SW480 and SW620
were purchased from the American Type Culture Collection. All cell
lines were cultured in RPMI-1640 medium (Gibco; Thermo Fisher
Scientific, Inc.), supplemented with 10% FBS (Invitrogen; Thermo
Fisher Scientific, Inc.), 100 U/ml penicillin and 100 g/ml
streptomycin, and maintained at 37˚C in a 5% CO2
humidified atmosphere.
Construction of GRIK1 overexpressing
or short hairpin RNA (shRNA/sh) knockdown cell lines
The GRIK1 open reading frame sequence (accession no.
NM_000830.4) was constructed and cloned into a lentiviral
expression vector pWPXL (Addgene). The recombinant vector (5 µg)
was co-transfected into 293T cells (5x10⁶) alongside
packaging plasmid psPAX2 (Addgene) and envelope plasmid pMD2.G
(Addgene) using Lipofectamine® 2000 reagent (Invitrogen;
Thermo Fisher Scientific, Inc.). The empty pWPXL vector was used as
a control for the infection. Following 48 h after the transfection
at 37˚C, the 293T lentiviral supernatant was harvested using a 0.45
µm filter, and subsequently infected into HCT116 cells (60 mm cell
culture dish; 2x10⁶ cells) in the presence of 2 µg/ml
polybrene (Sigma-Aldrich; Merck KGaA). Subsequent experiments were
performed 2 days following infection.
shRNAs targeting GRIK1 were synthesized and cloned
into the shRNA expression vector pGreenPuro (System Biosciences,
LLC). The shRNA with a non-targeting sequence was used as the
negative control (NC; shNC). Lentiviruses were produced in 293T
cells via co-transfection of shNC, shGRIK1#1 or shGRIK1#2 (all 5
µg) with the packaging plasmid psPAX2 and envelope plasmid pMD2.G
(Addgene) using Lipofectamine® 2000 (Invitrogen; Thermo
Fisher Scientific, Inc.). Firstly, 293T cells (1x10⁶)
were seeded onto six-well plates in 2 ml of DMEM medium (Gibco;
Thermo Fisher Scientific, Inc.) supplemented with 10% FBS and 5
µg/ml polybrene and incubated at 37˚C for 1 h. Subsequently, the
medium was removed and 2 ml of fresh DMEM medium supplemented with
10% FBS were added. Viruses were harvested at 48 h after
transfection, and the viral titers were determined using One-Wash
Lentivirus Titer kit (OriGene Technologies, Inc.). Subsequently,
SW620 cells (1x10⁶ cells; 60 mm cell culture dish) were
infected with 1x10⁶ recombinant lentivirus-transducing
units in the presence of 5 µg/ml polybrene (Sigma-Aldrich; Merck
KGaA). The sequences for the shRNAs used were as follows: shGRIK1#1
sense, 5'-GATCCCTGGAGCTCATCAGGCTTGCTCAGAGCCCC
TGCACCAACTCACCCTGTACTTTTG-3' and antisense,
5'-AATTCAAAAGTACAGGGTGAGTTGGTGCAGGGG
CTCTGAGCAAGCCTGATGAGCTCCAGGGATCG-3'; shGRIK1#2 sense,
5'-GATCCGTGCAGTCTATTTGCAA TGCTCTCGAAGTTCCACACATACAGACCCGCTGT
TTTG-3' and antisense, 5'-AATTCAAAACAGCGGGTC
TGTATGTGTGGAACTTCGAGAGCATTGCAAATAGAC TGCACG-3'; and shNC sense,
5'-GATCCCCTTCTC CGAACGTGTCACGTTTCAAGAGAACGTGACACGT TCGGAGAATTTT-3'
and antisense, 5'-AGCTAAAAATTC TCCGAACGTGTCACGTTCTCTTGAAACGTGACACG
TTCGGAGAAGGG-3'.
Reverse transcription-quantitative PCR
(RT-qPCR)
Total RNA was extracted from HCT116 and SW620 cells
and tissues from patients with CRC using TRIzol® reagent
(Invitrogen; Thermo Fisher Scientific, Inc.). Total RNA was reverse
transcribed (37˚C for 15 min; 85˚C for 5 sec) into cDNA using a
Prime-Script™ RT Reagent Kit (Takara Biotechnology Co., Ltd.) qPCR
was subsequently performed to analyze the mRNA expression levels of
the indicated genes using SYBR Premix Ex Taq™ II (Takara
Biotechnology Co., Ltd.), according to the manufacturer's protocol,
on an iCycler thermal cycler (Bio-Rad Laboratories, Inc.). The
following primer pairs were used for the qPCR:GRIK1 forward,
5'-TGTCCCAGGTCAGAGT TCAC-3' and reverse, 5'-CAATCACACTTGAACTCTTTT
GGT-3'; E-cadherin forward, 5'-CACCACGTACAAGGG TCAGG-3' and
reverse, 5'-TCCAAGCCCTTTGCTGTT TTC-3'; N-cadherin forward,
5'-GCCAGAAAACTCCAG GGGAC-3' and reverse, 5'-TGGCCCAGTTACACGTA
TCC-3'; Vimentin forward, 5'-TCCGCACATTCGAGCAAA GA-3' and reverse,
5'-TGAGGGCTCCTAGCGGTTTA-3'; Snail forward,
5'-CATAGGGCTTTGGAGTCCTGG-3' and reverse,
5'-TGAAGAGCTCGTATGGATGCC-3'; and GAPDH forward,
5'-AAGGTGAAGGTCGGAGTCAA-3' and reverse, 5'-AATGAAGGGGTCATTGATGG-3'.
The relative expression levels were quantified using the
2-ΔΔCq method (ΔΔCq = Cqtarget
gene-CqGAPDH) (18).
Western blotting
Total protein of tumor samples and cell lines was
extracted using protein extraction reagent (RIPA; Thermo Fisher
Scientific, Inc.) with a cocktail of proteinase inhibitors (Roche
Applied Science) and a cocktail of phosphatase inhibitors (Roche
Applied Science). A BCA Protein Assay kit (Pierce; Thermo Fisher
Scientific, Inc.) was utilized to determine the protein
concentration of the lysates. Equal amounts of total proteins (20
µg) were separated using 10% SDS-PAGE. The separated proteins were
subsequently transferred onto polyvinylidene fluoride membranes
(EMD Millipore) and blocked with TBS (pH 7.4) containing 8% non-fat
milk and 0.1% Tween-20 at 37˚C for 1.5 h. The membranes were then
incubated with the following primary antibodies overnight at 4˚C:
Anti-GRIK1 (1:1,500; cat. no. 25779-1-AP; ProteinTech Group, Inc.),
anti-E-cadherin: (1:1,000; cat. no. 14472; Cell Signaling
Technology, Inc.), anti-N-cadherin (1:1,000; cat. no. 13116; Cell
Signaling Technology, Inc.), anti-Vimentin (1:1,000; cat. no. 5741;
Cell Signaling Technology, Inc.), anti-Snail (1:1,000; cat. no.
3879; Cell Signaling Technology, Inc.) and anti-GAPDH (1:2,000;
cat. no. AB2302, Sigma-Aldrich; Merck KGaA). Following the primary
antibody incubation, the membranes were washed with PBS-Tween-20
(0.1%) and incubated with HRP-conjugated secondary antibodies
(rabbit anti-mouse HRP-conjugated IgG antibody; 1:5,000; cat. no.
AP160P; and mouse anti-rabbit HRP-conjugated IgG antibody; 1:5,000,
cat. no. MAB201P; both from Sigma-Aldrich; Merck KGaA) at room
temperature for 2 h. Total protein was visualized using an ECL
reagent (cat. no. 32106, Pierce; Thermo Fisher Scientific, Inc.)
and a ChemiDoc MP Imaging System (Bio-Rad Laboratories, Inc.).
Colony formation assay
For the soft agar assay, 800 µl RPMI-1640 medium
containing 0.8% sea plaque agar and 10% FBS was plated into a
six-well plate and incubated at room temperature overnight. The
following day, 2x10³/well HCT116 or SW620 cells were
resuspended in adjusted 0.5% agar media (500 µl) and seeded onto
the 0.8% agar plate. Following incubation at 37˚C with 5%
CO2 for 10 days, the plates were analyzed for the
presence of viable colonies using a light microscope
(magnification, x200).
For the plate colony formation assay, 800 HCT116
cells/well overexpressing GRIK1 or transfected with the control
vector were seeded into six-well plates at 37˚C with 5%
CO2. Following incubation for 10 days, the cells were
washed with PBS, fixed with 4% paraformaldehyde at room temperature
for 12 h) and stained with 2% crystals violet (Sigma-Aldrich; Merck
KGaA) at room temperature for 4 h). The total number of colonies
containing >50 cells were counted using a light microscope
(magnification, x100).
Cell proliferation assay
Cell proliferation was performed using Cell Counting
Kit-8 (CCK-8) reagent (Dojindo Molecular Technologies, Inc.)
according to the manufacturer's protocol. Briefly, 2x10³
HCT116 or SW620 cells/well were seeded into 96-well culture plates.
Following incubation for 0-96 h at room temperature, 100 µl CCK-8
reagent was added to each well and incubated at 37˚C for 2 h. The
absorbance was measured at a wavelength of 450 nm using a
microplate reader (BioTek Instruments, Inc.).
Migration and invasion assays
A total of 2x10⁵ HCT116 or SW620 cells
were plated into the upper chambers of 24-well Transwell plates
(8-µm pore size; BD Biosciences) with (invasion) or without
(migration) a thin layer of Matrigel (37˚C for 1 h; BD Biosciences)
in RPMI-1640 medium (1% FBS). Complete RPMI-1640 medium (15% FBS)
was plated into the lower chambers to act as a chemoattractant.
Following incubation at 37˚C for 36 h, the invasive or migratory
cells in the lower chamber were fixed with 4% paraformaldehyde at
room temperature for 12 h), stained with 2% crystal violet
(Sigma-Aldrich; Merck KGaA) at room temperature for 4 h, and
visualized under a light microscope (magnification, x200).
Tumor growth model
Male BALB/c-nude mice (n=14; body weight, 18-20 g;
age, 4 weeks; 7 mice/group) were purchased from Shanghai Laboratory
Animal Center (China) and maintained in a pathogen-free animal
facility with controlled temperature (25˚C) and humidity (45-55%)
with alternating 12h light and dark cycle. Mice were allowed to
drink and eat ad libitum. Mice (6-week old) were
subcutaneously injected with 5x10⁶ HCT116 cells
overexpressing GRIK1 or the control vector (resuspended in PBS)
into the right flanks. After 4 weeks, tumors (64-1,372
mm3) were measured with calipers and the volume was
calculated using the following formula: Volume (mm3) =
[width2 (mm2) x length (mm)] /2. Mice were
euthanized via CO2 gas asphyxiation at an air
displacement rate of 10-30% per minute at the end of experiments.
To confirm the death of mice, the CO2 flow persisted for
at least 1 min after the animals had ceased breathing. Finally,
tumors were dissected and weighed.
Tumor metastasis model
For the surgery, mice were anesthetized by
inhalation of 2% isoflurane and were given meloxicam (2 mg/kg
subcutaneously) analgesia after the surgical intervention. For the
hepatic metastasis model, 16 male BALB/c-nude mice were slowly
injected with 2x10⁶ HCT116 cells overexpressing GRIK1 or
the control vector into the spleen, respectively. For the lung
metastasis model, 2x10⁶ HCT116 cells overexpressing
GRIK1 or the control vector were injected into the tail vein of
male BALB/c-nude mice. After 8-10 weeks, the mice were euthanized,
and the livers and lungs were collected for pathological
examination. Metastatic nodules in the liver and lung tissues were
analyzed using hematoxylin and eosin staining. Briefly, tissues
were immersed in 4% paraformaldehyde at room temperature for 4 h
and transferred to 70% ethanol. Individual biopsy material was
placed in processing cassettes, dehydrated in a serial alcohol
gradient, and embedded in paraffin wax blocks. Before
immunostaining, 5-µm thick lung tissue sections were dewaxed in
xylene, rehydrated in decreasing concentrations of ethanol, and
washed in PBS. Subsequently, the sections were stained with
hematoxylin and eosin (H&E Staining kit; cat no. ab245880;
Abcam) at room temperature for 5 min. After staining, sections were
dehydrated in increasing concentrations of ethanol and xylene, and
visualized under a light microscope (magnifications, x40 and x100).
All animal studies were approved by the Medical Experimental Animal
Care Commission of Zhongshan Hospital, Fudan University (Shanghai,
China).
Statistical analysis
The experiments were repeated at least twice.
Statistical analysis was performed using SPSS 17.0 software (SPSS
Inc.) and results are presented as the mean ± SD. P<0.05 was
considered to indicate a statistically significant difference.
Statistical differences between data with 2 groups were determined
using an unpaired Student's t-test. The data with multiple groups
was analyzed using one-way ANOVA followed by Tukey's post hoc test.
The box and whisker plots were analyzed using a Wilcoxon signed
rank test (Fig. 1B), U-Mann Whitney
test (Fig. 4A, C and D) or
a Kruskal-Wallis test with a Dunn's post hoc test (Fig. 1A). Kaplan-Meier analysis was used to
assess survival and a log-rank test was performed to obtain the
P-value. A χ2 test was used to analyze the association
between GRIK1 expression levels and the clinicopathological
features of patients. Univariate analysis (log-rank test) was used
to compare the survival of patients between subgroups. Multivariate
analyses were performed using a multivariate Cox proportional
hazard regression model.
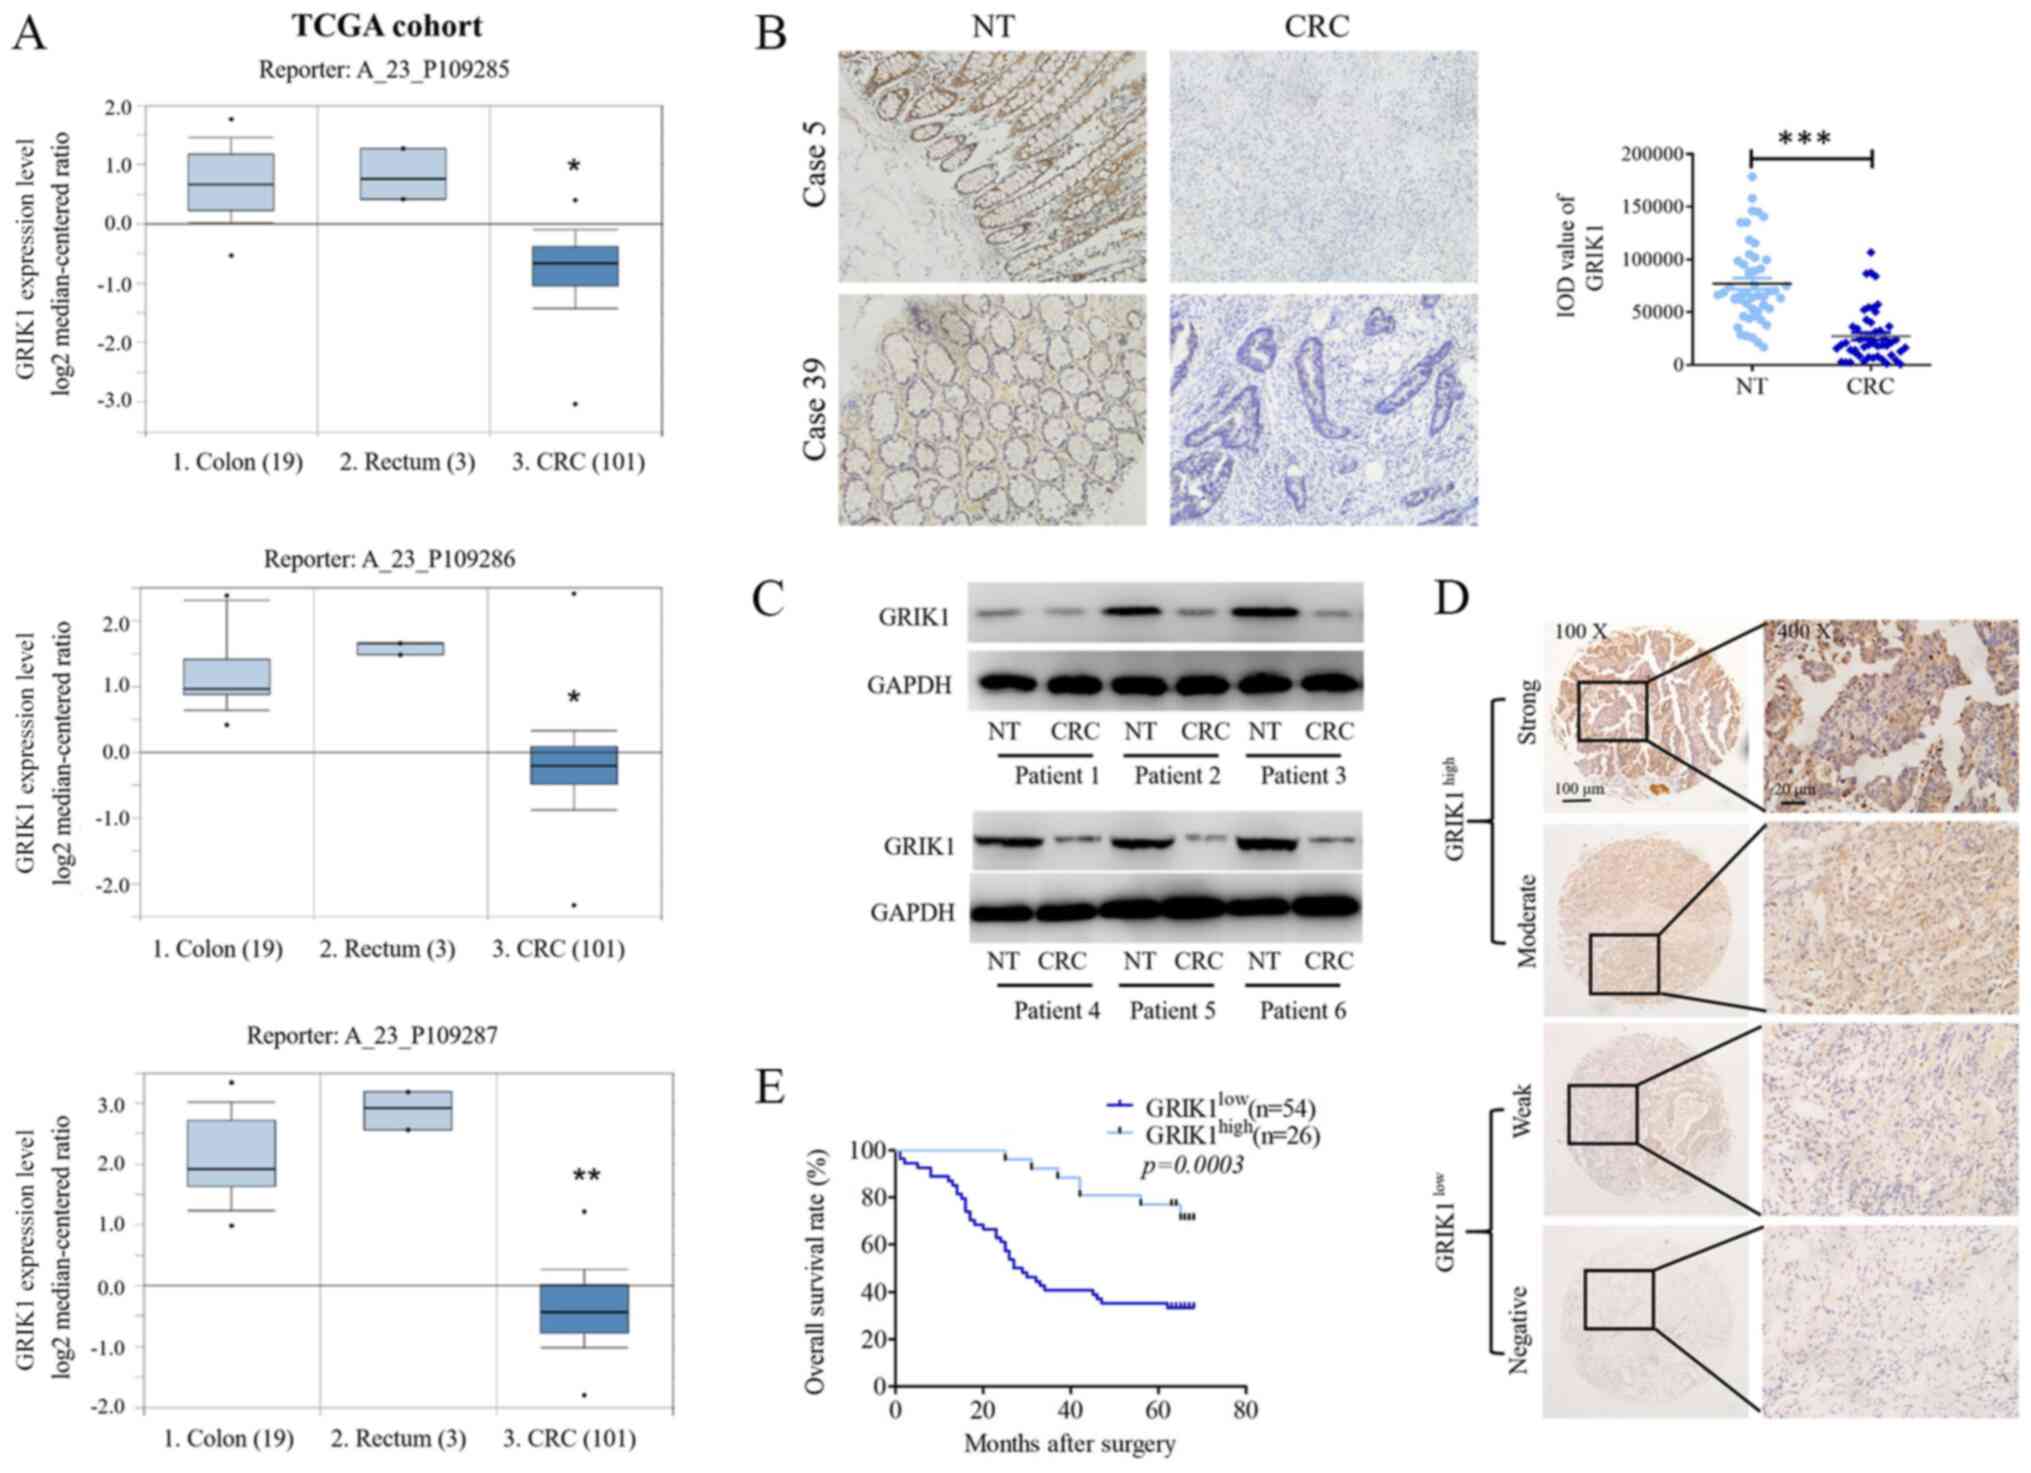 | Figure 1GRIK1 expression levels are
downregulated in CRC tissues. (A) GRIK1 expression levels from TCGA
dataset. Reporter probes hybridized with GRIK1: A_23_P109285;
A_23_P109286; A_23_P109287). (B) Immunohistochemistry staining of
GRIK1 expression levels in 50 pairs of CRC tissues and matched NT
colon tissues (magnification, x100). (C) Western blotting analysis
of GRIK1 expression levels in 6 pairs of CRC tissues and matched NT
colon tissues. (D) GRIK1 protein expression levels were analyzed
using immunohistochemistry in 80 CRC samples. Representative
micrographs are shown of negative, weak, moderate and strong
immunostaining of GRIK1 expression levels in CRC specimens
(magnification, x100 and x400). (E) Kaplan Meier survival analysis
was performed according to GRIK1 expression levels in patients with
CRC. A log-rank test was used to analyze the data. GRIK1 was
discovered to an independent prognostic factor for the survival of
patients with CRC. *P<0.05 and **P<0.01
vs. colon or rectum tissue; ***P<0.001 vs. NT. GRIK1,
glutamate receptor ionotropic, kainate 1; CRC, colorectal
carcinoma; NT, non-tumorous; TCGA, The Cancer Genome Atlas; IOD,
Integrated Optical Density. |
Results
GRIK1 expression levels are
downregulated in CRC tissues and predict a prognosis for patients
with CRC
To investigate the role of GRIK1 in CRC progression,
the expression levels of GRIK1 in tissues from The Cancer Genome
Atlas (TCGA) database were analyzed (https://www.oncomine.org/resource/login.html; TCGA
Colorectal Dataset). The results revealed that the CRC tumor
tissues had markedly downregulated expression levels of GRIK1
compared with the normal colon and rectum tissues in TGGA dataset
(three different reporters of GRIK1; Fig. 1A). The expression levels of GRIK1 in
50 pairs of CRC specimens (tumor and corresponding non-tumor
tissues) were subsequently analyzed using IHC analysis. Similarly,
the protein expression levels of GRIK1 were significantly
downregulated in the CRC tissues compared with the adjacent normal
tissues (Fig. 1B). Moreover, the
results from the western blotting assays revealed that the
expression levels of GRIK2 were downregulated in CRC tissues
compared with their corresponding non-tumor tissues (Fig. 1C).
Subsequently, IHC staining was used to analyze the
expression levels of GRIK1 in a TMA containing 80 CRC tissues; the
intensity of GRIK1 staining was categorized into negative, weak,
moderate or strong staining. Samples with negative and weak
staining were defined as having low expression levels of GRIK1
(n=54), while those with moderate and strong staining were defined
as having high expression levels of GRIK1 (n=26) (Fig. 1D). The relationship between GRIK1
expression levels and the clinicopathological features was
determined. The results revealed that low expression levels of
GRIK1 were significantly associated with lymphovascular invasion
and tumor size (Table I).
Kaplan-Meier survival analysis also discovered that patients with
CRC with low expression levels of GRIK1 had a shorter overall
survival (OS; Fig. 1E). Moreover,
univariate analysis indicated that the node stage, metastasis
stage, lymphovascular invasion, tumor size, tumor grade and GRIK1
expression levels were significantly associated with the OS of
patients with CRC (Table II).
Multivariate analysis further indicated that GRIK1 expression
levels, N stage and tumor size were an independent prognostic
factor for patients with CRC (Table
II).
 | Table IAssociation between GRIK1 expression
levels and patient clinicopathological features. |
Table I
Association between GRIK1 expression
levels and patient clinicopathological features.
| | Glutamate receptor
ionotropic, kainate 1 protein expression levels | |
|---|
| Variable | Low | High | P-value |
|---|
| Sex | | | 0.894 |
|
Male | 32 | 15 | |
|
Female | 22 | 11 | |
| Age | | | 0.463 |
|
≤60 | 19 | 12 | |
|
>60 | 35 | 14 | |
| T stage | | | 0.259 |
|
T1/T2 | 10 | 8 | |
|
T3/T4 | 44 | 18 | |
| N stage | | | 0.162 |
|
N0 | 21 | 16 | |
|
N1 | 24 | 7 | |
|
N2 | 9 | 3 | |
| M stage | | | 0.125 |
|
M0 | 41 | 24 | |
|
M1 | 13 | 2 | |
| Lymphovascular
invasion | | | 0.003 |
|
Negative | 32 | 24 | |
|
Positive | 22 | 2 | |
| Tumor size, cm | | | 0.008 |
|
≤5 | 21 | 19 | |
|
>5 | 33 | 7 | |
| G | | | 0.681 |
|
G1 | 10 | 6 | |
|
G2 | 22 | 12 | |
|
G3 | 22 | 8 | |
| Table IIUnivariate and multivariate analysis
of patient parameters. |
Table II
Univariate and multivariate analysis
of patient parameters.
| | Univariate
analysis | Multivariate
analysis |
|---|
| Variable | HR (95% CI) | P-value | HR (95% CI) | P-value |
|---|
| Sex | 1.397
(0.766-2.547) | 0.276 | | |
| Age | 1.269
(0.670-2.403) | 0.466 | | |
| Tumor stage | 1.262
(0.585-2.277) | 0.553 | | |
| Node stage | 1.526
(1.052-2.214) | 0.026 | 1.966
(1.237-3.126) | 0.004 |
| Metastasis
stage | 2.094
(1.030-4.260) | 0.041 | | |
| Lymphovascular
invasion | 1.979
(1.060-3.694) | 0.032 | | |
| Tumor size | 2.943
(1.549-5.591) | 0.001 | 3.690
(1.740-7.823) | 0.001 |
| Grade | 1.479
(0957-2.285) | 0.078 | | |
| Expression level of
glutamate receptor ionotropic, kainate 1 | 0.462
(0.237-0.900) | 0.001 | 0.251
(0.111-0.567) | 0.020 |
Overexpression of GRIK1 inhibits the
proliferation, colony formation, migration, invasion and
epithelial-mesenchymal transition (EMT) of CRC cells in vitro
The expression levels of GRIK1 were investigated in
three CRC cell lines, HCT116, SW480 and SW620. Western blotting
analysis revealed that HCT116 cells demonstrated relatively low
expression levels of GRIK1, while in comparison, the other two cell
lines expressed relatively high expression levels of GRIK1
(Fig. 2A). Subsequently, the
biological functions of GRIK1 in vitro were determined.
Considering that HCT116 cells were indicated to express GRIK1 at a
relative low level, GRIK1 was overexpressed in this cell line.
Following the transfection of HCT116 cells with GRIK1
overexpression vectors, the expression levels of GRIK1 were
discovered to be upregulated compared with the vector
control-transfected cells (Fig. 2B
and C). The results from the CCK-8
assay further illustrated that the overexpression of GRIK1
significantly inhibited the proliferation of HCT116 cells compared
with the vector control after 72 and 96 h culture (Fig. 2D). In addition, the overexpression
of GRIK1 also significantly inhibited the colony forming ability of
HCT116 cells compared with the vector control (Fig. 2E and F). Similarly, the overexpression of GRIK1
significantly reduced the migratory and invasive abilities of
HCT116 cells compared with the vector control (Fig. 2G and H).
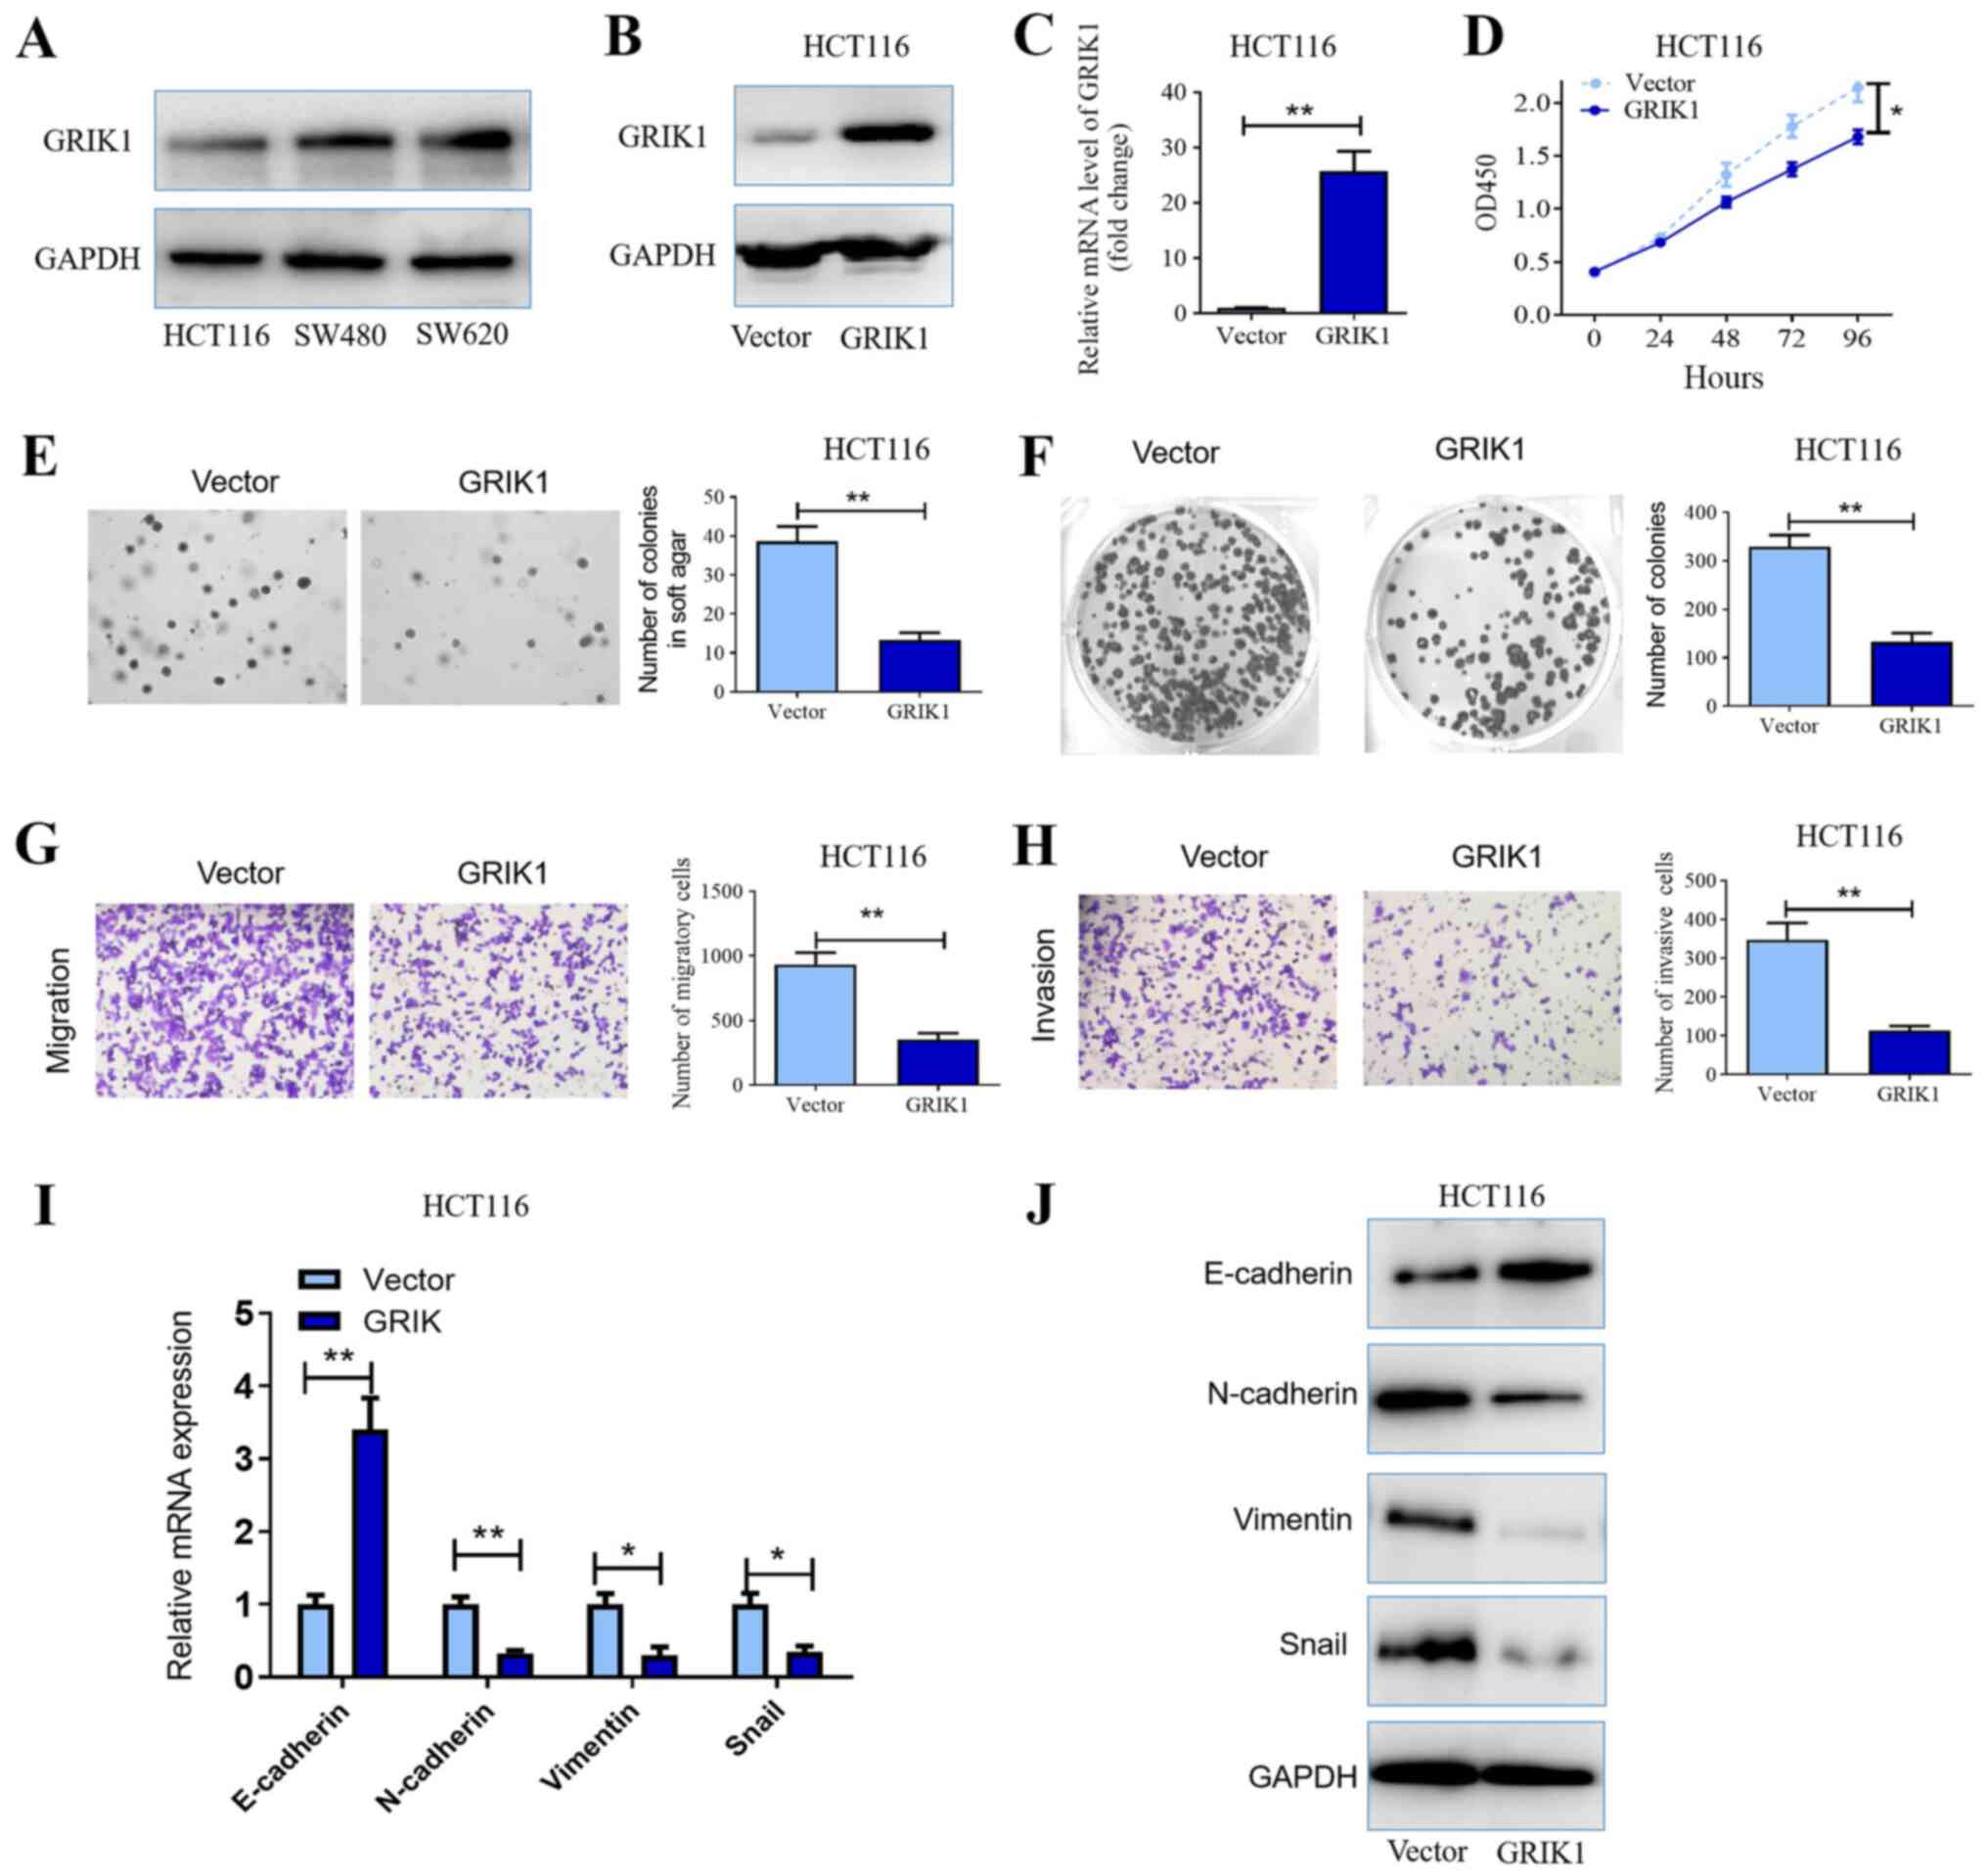 | Figure 2Overexpression of GRIK1 inhibits the
proliferative, colony forming, migratory and invasive abilities of
CRC cells in vitro. (A) GRIK1 protein expression levels in
HCT116, SW480 and SW620 cell lines were determined using western
blotting. Transfection efficiency of the GRIK1 overexpression
vector transfected into HCT116 cells was determined using (B)
western blotting and (C) RT-qPCR. (D) Cell Counting Kit-8 assay was
used to determine the proliferative ability of HCT116 cells
following the overexpression of GRIK1. (E) Effects of GRIK1
overexpression on the colony forming ability of HCT116 cells was
analyzed using a soft agar assay (magnification, x100). (F) Plate
colony formation assay was used to monitor the growth of HCT116
cells following the transfection with the GRIK1 overexpression
vector. (G) Effects of GRIK1 overexpression on the migratory
ability of HCT116 cells in vitro was determined using a
Transwell assay (magnification, x400). (H) Effects of GRIK1
overexpression on the invasive ability of HCT116 cells in
vitro was determined using a Transwell Matrigel assay
(magnification, x400). (I) mRNA expression levels of EMT-related
genes following the overexpression of GRIK1 were analyzed using
RT-qPCR. Expression levels were normalized to the reference gene
GAPDH. (J) Expression levels of EMT-related proteins following the
overexpression of GRIK1 were analyzed using western blotting.
*P<0.05, **P<0.01. GRIK1, glutamate
receptor ionotropic, kainate 1; CRC, colorectal carcinoma; RT-qPCR,
reverse transcription-quantitative PCR; EMT, epithelial-mesenchymal
transition; OD, optical density. |
Furthermore, the expression levels of EMT markers
were also analyzed following the overexpression of GRIK1. The
results revealed that the overexpression of GRIK1 downregulated
N-cadherin, Vimentin and snail expression levels, while
upregulating E-cadherin expression levels in HCT116 cells at both
the mRNA and protein level compared with the vector control group
(Fig. 2I and J). Taken together, these data suggested
that GRIK1 may exert a tumor suppressive function in CRC cells
in vitro.
Knockdown of GRIK1 promotes the
proliferation, colony formation, migration and invasion of CRC
cells in vitro
To further confirm the tumor suppressive function of
GRIK1, GRIK1 was knocked down in SW620 cells, which expressed GRIK1
at a relatively high level, using two different shRNAs. Western
blotting and RT-qPCR analysis confirmed that the expression levels
of GRIK1 were efficiently knocked down in SW620 cells transfected
with shGRIK1#1/2 compared with the shNC group (Fig. 3A and B). The results of the CCK-8 assay further
illustrated that the knockdown of GRIK1 with both shGRIK1#1 and
shGRIK1#2 significantly promoted the proliferation of SW620 cells
compared with the shNC group after 48 or 72 h culture (Fig. 3C). In addition, the knockdown of
GRIK1 also enhanced the colony forming ability of SW620 cells
compared with the shNC group (Fig.
3D and E). In contrast to the
overexpression of GRIK1, the knockdown of GRIK1 significantly
promoted the migratory and invasive abilities of SW620 cells
compared with the shNC group (Fig.
3F and G). Taken together,
these data further suggested that GRIK1 may exert tumor suppressive
functions in CRC cells in vitro.
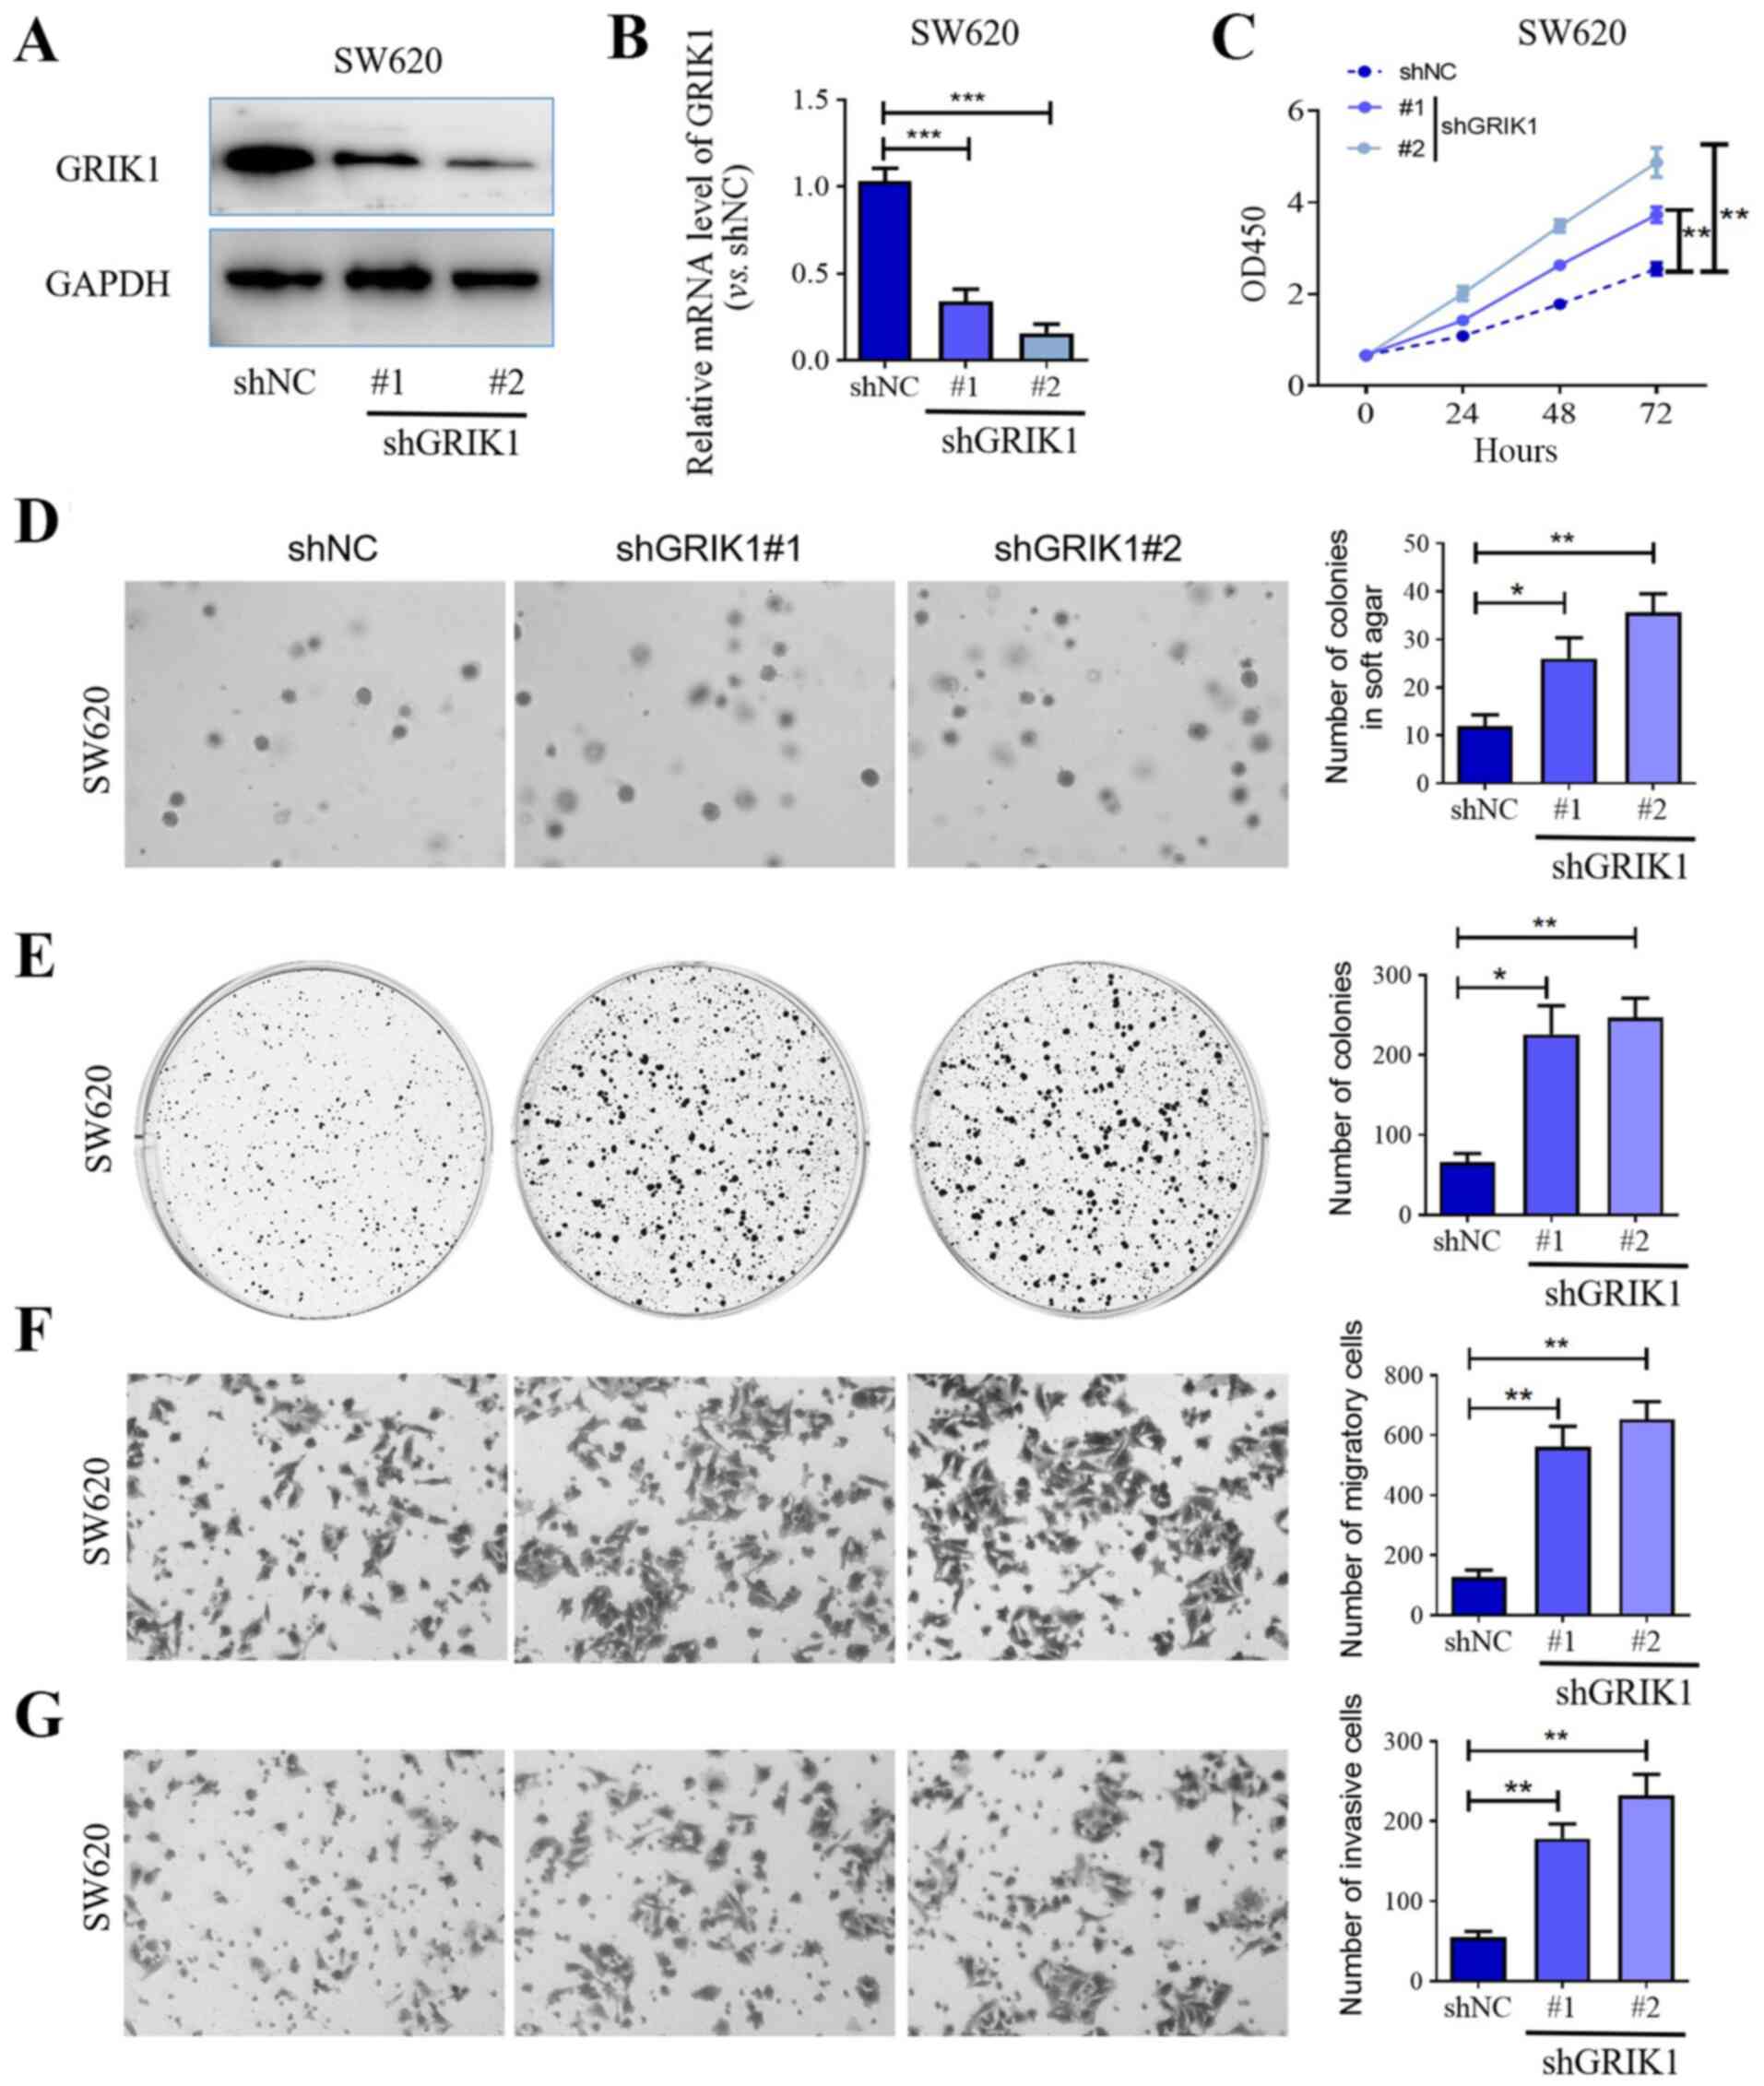 | Figure 3Knockdown of GRIK1 promotes the
proliferative, colony forming, migratory and invasive abilities of
colorectal carcinoma cells in vitro. Transfection efficiency
of shGRIK1#1 and shGRIK1#2 in SW620 cells was determined using (A)
western blotting and (B) reverse transcription-quantitative PCR.
(C) Cell Counting Kit-8 assay was used to determine the
proliferation of SW620 cells following GRIK1 knockdown. (D) Effects
of GRIK1 knockdown on the colony formation of SW620 cells in soft
agar assay (magnification, x100). (E) Plate colony formation assay
was used to determine growth of SW620 cells following GRIK1
knockdown. (F) Effects of GRIK1 knockdown on the migratory ability
of SW620 cells in vitro was determined using a Transwell
assay (magnification, x400). (G) Effects of GRIK1 knockdown on the
invasive ability of SW620 cells in vitro was determined
using a Transwell Matrigel assay (magnification, x400).
*P<0.05, **P<0.01,
***P<0.001. GRIK1, glutamate receptor ionotropic,
kainate 1; sh, short hairpin RNA; NC, negative control. |
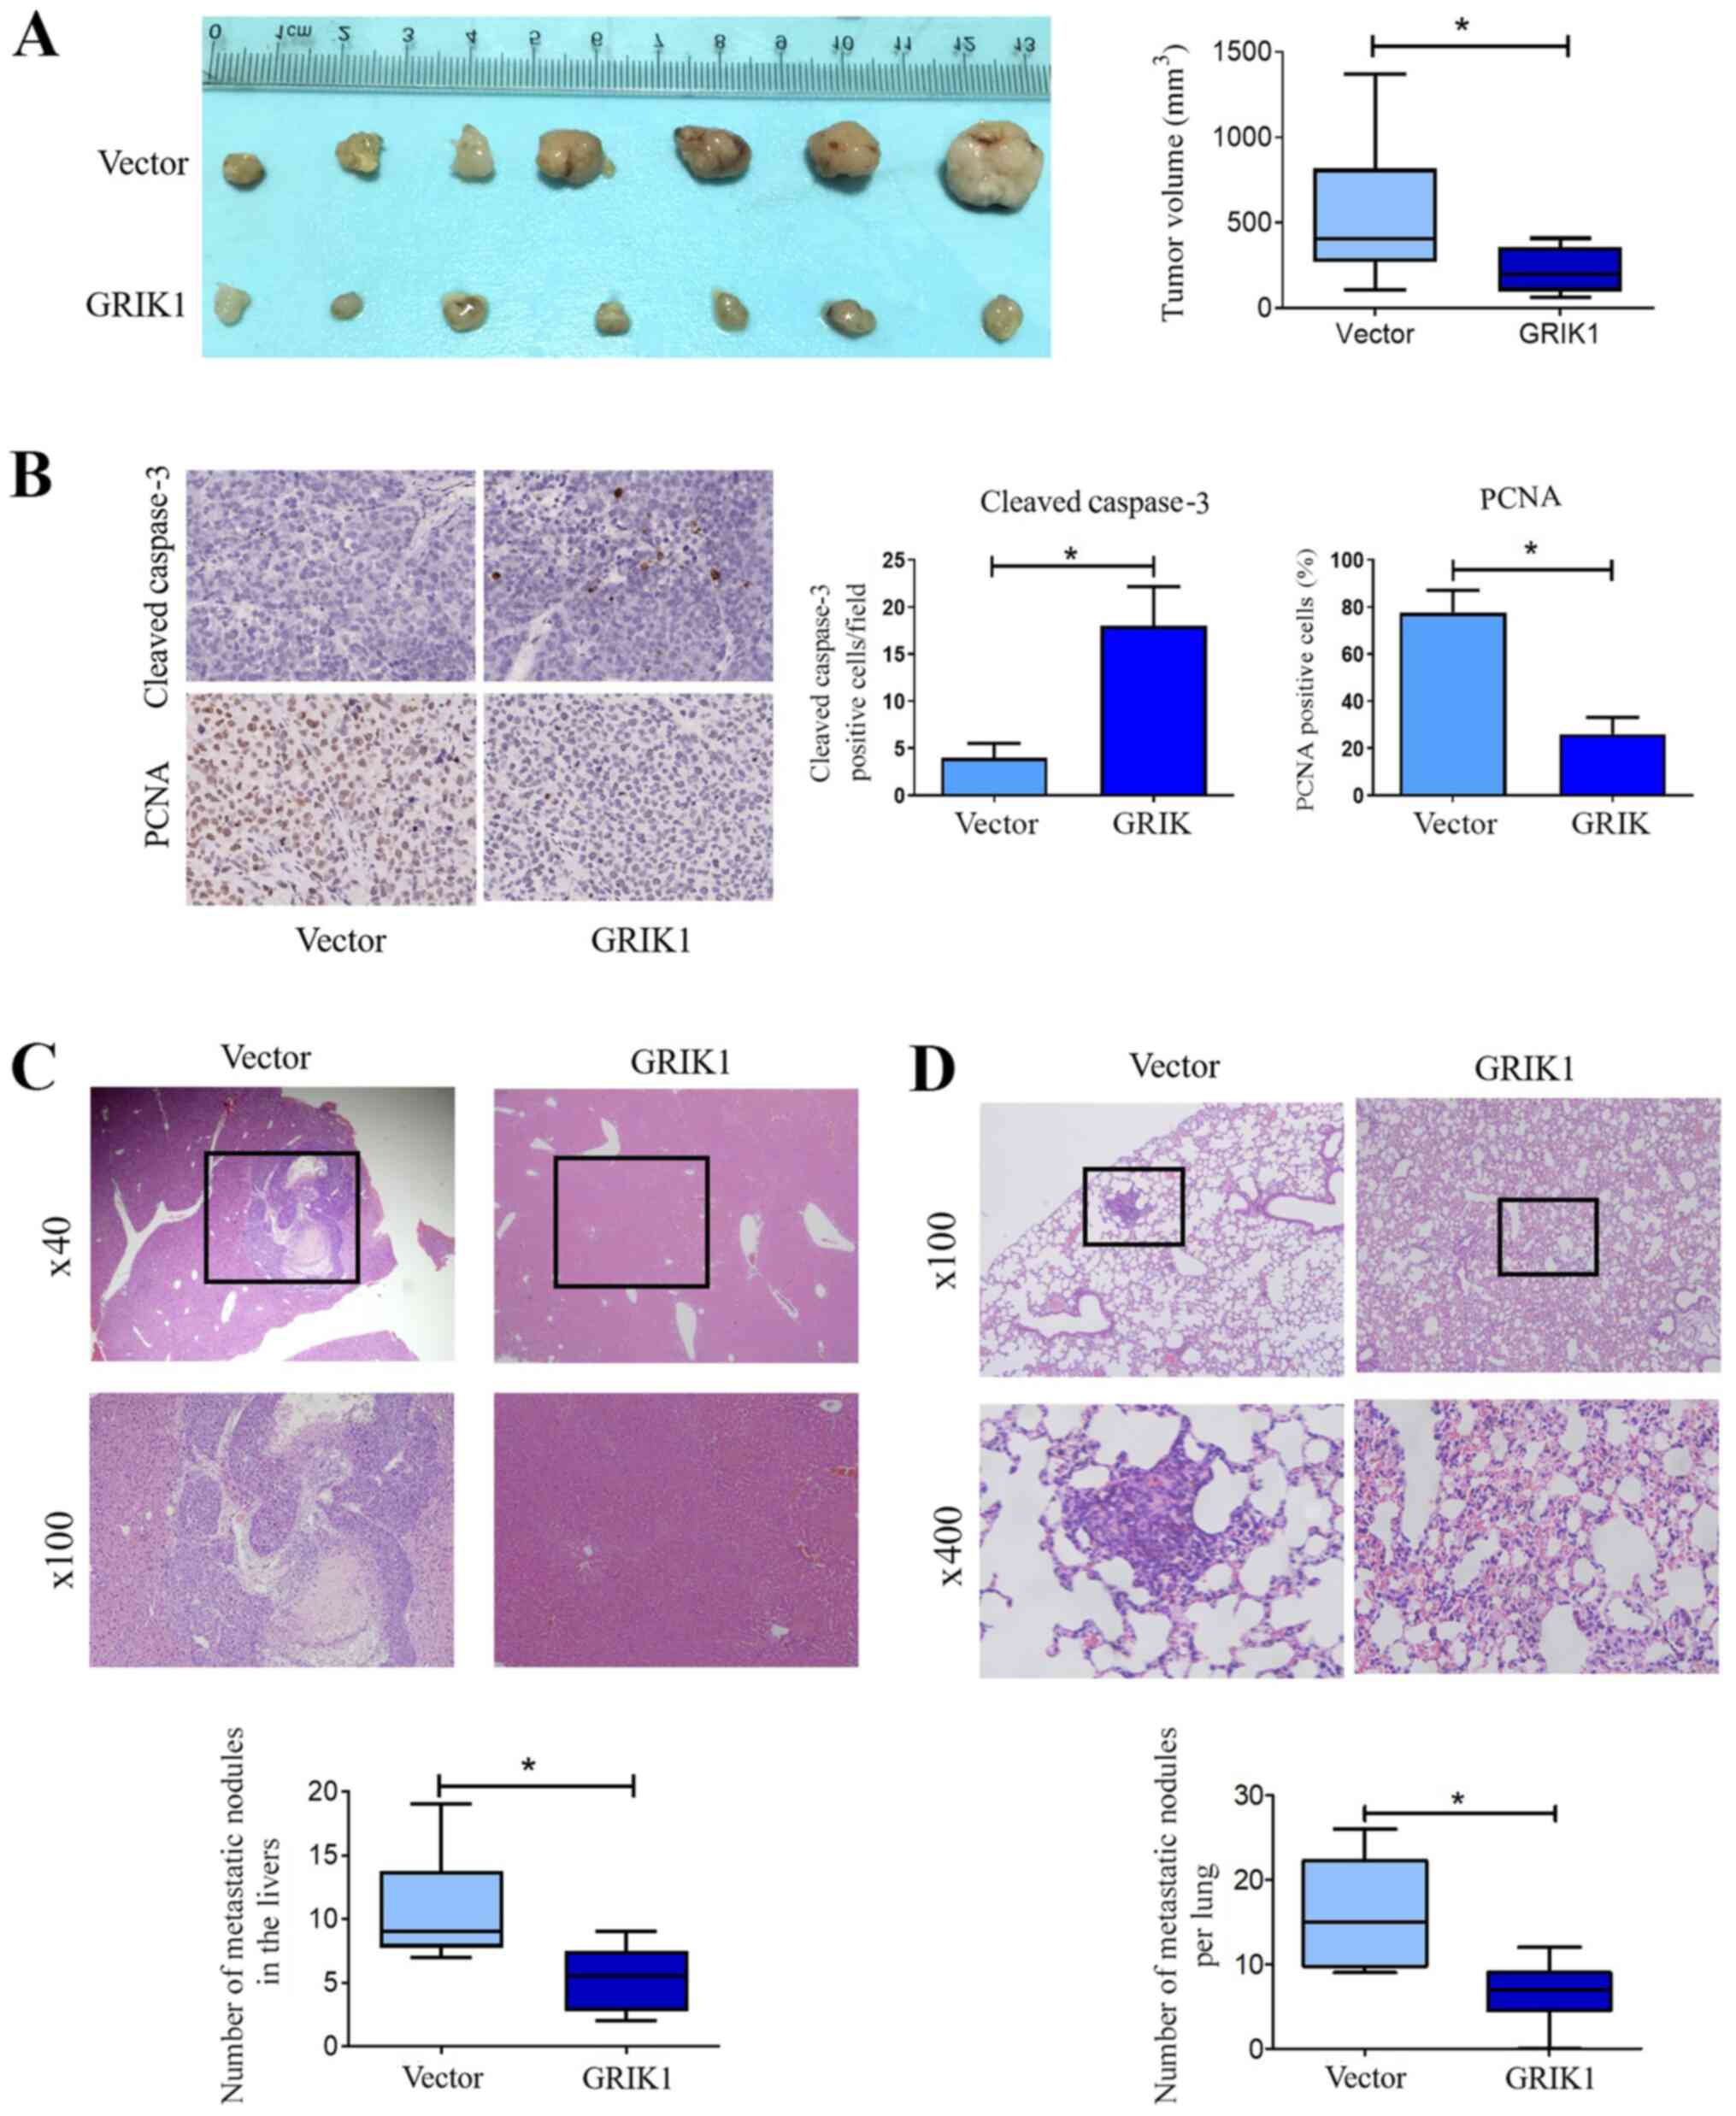
Overexpression of GRIK1 inhibits tumor
growth and the metastasis of CRC in vivo
To investigate the role of GRIK1 in vivo,
HCT116 cells stably overexpressing GRIK1 were subcutaneously
injected into the flanks of nude mice. The results revealed that
the overexpression of GRIK1 significantly inhibited tumor growth
in vivo compared with the vector group (Fig. 4A). In addition, IHC analysis further
demonstrated that the overexpression of GRIK1 significantly
upregulated the expression levels of cleaved caspase-3, while
downregulating those of PCNA in tumor tissues overexpressing GRIK1
compared with the vector group (Fig.
4B).
Subsequently, hepatic and lung metastases were also
analyzed in vivo. The results demonstrated that the
overexpression of GRIK1 decreased the number and size of metastatic
liver (Fig. 4C) and pulmonary
nodules (Fig. 4D) compared with the
vector group. Collectively, these results indicated that GRIK1 may
inhibit the growth and metastasis of CRC cells in vivo.
Discussion
It has been previously reported that individuals
with Down's syndrome (trisomy 21) exhibited remarkably reduced
incidence rates of a large proportion of solid tumors, including
colon, pancreatic and breast cancer (19-21).
It was suggested that the upregulated expression levels of 534
genes located on the extra copy of chromosome 21 (HSA21) conferred
this broad cancer protection to individuals with Down's syndrome
(20). These findings have provided
an opportunity to identify tumor suppressor genes located on HSA21.
Accumulating evidence has supported the association between HSA21
genes and the suppression of numerous types of malignant solid
tumor (22-24).
Previously, Jin et al (22)
demonstrated that the HSA21 gene, calcipressin-1 isoform 4
(RCAN1.4), functioned as a novel tumor suppressor of hepatocellular
carcinoma (HCC) through preventing the angiogenesis, growth and
metastasis of HCC. Kuwahara et al (24) reported that the germinal-center
associated nuclear protein encoded on HSA21 was associated with
tumorigenesis and development of breast cancer. The human GRIK1
gene is a HSA21 gene, located on the q21.3 region of the chromosome
(25). Similar to other HSA21 genes
such as RCAN1.4, the GRIK1 gene was considered to be a strong
candidate gene responsible for the Down's syndrome phenotype
(26). In addition, TCGA data of
HCC samples revealed that GRIK1 was one of the HSA21 genes
identified to be downregulated (22). The results of the present study
supported that GRIK1 may be another candidate tumor suppressor of
numerous types of solid tumor. The clinical data of the present
study demonstrated that the expression levels of GRIK1 were
downregulated in CRC samples compared with normal colon or rectum
tissues. Furthermore, the expression levels of GRIK1 were
associated with lymph node status and tumor size. In addition,
patients with CRC and low GRIK1 expression levels demonstrated a
consistently poor overall survival rate compared with patients with
CRC and high GRIK1 expression levels, indicating a possible tumor
suppressive function of GRIK1 in CRC progression. Therefore, it
would be worth investigating the biological function of GRIK1 in
other types of solid tumor, including HCC, breast cancer or
pancreatic cancer. Likewise, the tumor suppressive functions of
other downregulated HSA21 genes should be investigated in future
studies.
The gene product of GRIK1 belongs to the kainate
family of glutamate receptors, which consist of four subunits and
function as ligand-activated ion channels (27). Allelic variants of GRIK1 were
reported to contribute a major genetic determinant to the
pathogenesis of juvenile absence epilepsy-related phenotypes
(28). In addition, the single
nucleotide polymorphism rs455804 on 21q21.3, which is located
within intron 1 of GRIK1, was previously reported to be associated
with hepatitis B-induced HCC (29).
However, to the best of our knowledge, the biological function of
GRIK1 has never been reported before. The present study
demonstrated for the first time that the overexpression of GRIK1
significantly inhibited the colony forming, proliferative,
migratory and invasive abilities of CRC cells. By contrast,
knockdown of GRIK1 promoted theses malignant functions of CRC cells
in vitro. In addition, GRIK1 was also associated with
EMT-induced malignant transformation, which was supported by the
downregulated N-cadherin, Vimentin and Snail expression, and the
upregulated E-cadherin expression in HCT116 cells at both the mRNA
and protein level following overexpression of GRIK1. Furthermore,
in vivo tumor models were also used to validate the tumor
suppressive function of GRIK1. As expected, the overexpression of
GRIK1 potently prevented the growth and metastasis of CRC tumors
in vivo. Moreover, IHC analysis further demonstrated that
the overexpression of GRIK1 significantly upregulated the
expression levels of cleaved caspase-3, while it downregulated
those of PCNA in tumor tissues overexpressing GRIK1, compared with
the vector group. All these results indicated that GRIK1 may act as
a tumor suppressor in vivo. However, the limitations of the
present study were the lack of mechanistic investigations and
additional animal tumor models, such as the immune-competent
transgenic model (30). Minbay
et al (31) reported that
homomeric or heteromeric functional receptor channels were formed
through the combination of different ionotropic glutamate receptor
subunits in red nucleus neurons in normal adult female
Sprague-Dawley rats. Therefore, further functional and
pharmacological studies should determine whether GRIK1 combines to
other subunits to serve tumor suppressive functions in CRC.
On the other hand, GRIK1 is involved in glutamate
signaling; several studies have reported that glutamate signaling
served a central role in the malignant phenotype of numerous types
of tumor, such as liver and breast cancer, via multiple molecular
mechanisms, including the regulation of Snail expression or STAT3
signaling pathways (32-34).
Considering these findings, the role of GRIK1 in regulating the
glutamate signaling pathway in CRC should also be further
investigated.
In conclusion, the findings of the present study
indicated that the downregulation of GRIK1 may predict a poor
prognosis for patients with CRC, which may be due to its
association with malignant features of CRC, such as tumor growth,
metastasis and EMT. Thus, GRIK1 was identified as a potential novel
tumor suppressor in CRC and may represent a putative therapeutic
target for CRC.
Acknowledgements
Not applicable.
Funding
The present study was funded by grants from the
Shanghai Engineering and Research Center of Diagnostic and
Therapeutic Endoscopy (grant no. 16DZ2280900) and The Project of
Shanghai Science and Technology Commission: The Research of the Use
of Antibiotics in POEM for Esophageal Achalasia (grant no.
16411950409)
Availability of data and materials
The datasets used and/or analyzed during the current
study are available from the corresponding author on reasonable
request. The datasets generated and/or analyzed during the current
study are available in the Oncomine repository (https://www.oncomine.org/resource/login.html).
Authors' contributions
LY and ZR conceptualized and designed the study; ZR,
JZL, JL and ZQ performed the experiments; ZQ and BL analyzed and
interpreted the data; ZR and JL drafted the manuscript; and JZL and
ZQ critically revised the manuscript for important intellectual
content. All authors read and approved the final manuscript.
Ethics approval and consent to
participate
All animal studies were approved by the Medical
Experimental Animal Care Commission of Zhongshan Hospital, Fudan
University (Shanghai, China). The patient studies (approval no.
Y2020-145) were approved by the Research Ethics Committee of
Zhongshan Hospital, Fudan University (Shanghai, China) and written,
informed consent was obtained from all patients.
Patient consent for publication
Not applicable.
Competing interests
The authors declare that they have no competing
interests.
References
|
1
|
Rawla P, Sunkara T and Barsouk A:
Epidemiology of colorectal cancer: Incidence, mortality, survival,
and risk factors. Prz Gastroenterol. 14:89–103. 2019.PubMed/NCBI View Article : Google Scholar
|
|
2
|
Winawer S, Fletcher R, Rex D, Bond J, Burt
R, Ferrucci J, Ganiats T, Levin T, Woolf S, Johnson D, et al:
Gastrointestinal Consortium Panel: Colorectal cancer screening and
surveillance: Clinical guidelines and rationale-Update based on new
evidence. Gastroenterology. 124:544–560. 2003.PubMed/NCBI View Article : Google Scholar
|
|
3
|
Rees M, Tekkis PP, Welsh FK, O'Rourke T
and John TG: Evaluation of long-term survival after hepatic
resection for metastatic colorectal cancer: A multifactorial model
of 929 patients. Ann Surg. 247:125–135. 2008.PubMed/NCBI View Article : Google Scholar
|
|
4
|
Wei Y, Zhang X, Wang G, Zhou Y, Luo M,
Wang S and Hong C: The impacts of pretreatment circulating
eosinophils and basophils on prognosis of stage Ⅰ-Ⅲ colorectal
cancer. Asia Pac J Clin Oncol. 14:e243–e251. 2018.PubMed/NCBI View Article : Google Scholar
|
|
5
|
Shi W, Ye Z, Zhuang L, Li Y, Shuai W, Zuo
Z, Mao X, Liu R, Wu J, Chen S, et al: Olfactomedin 1 negatively
regulates NF-κB signalling and suppresses the growth and metastasis
of colorectal cancer cells. J Pathol. 240:352–365. 2016.PubMed/NCBI View Article : Google Scholar
|
|
6
|
Qiu YY, Hu Q, Tang QF, Feng W, Hu SJ,
Liang B, Peng W and Yin PH: MicroRNA-497 and bufalin act
synergistically to inhibit colorectal cancer metastasis. Tumour
Biol. 35:2599–2606. 2014.PubMed/NCBI View Article : Google Scholar
|
|
7
|
Yang Y, Weng W, Peng J, Hong L, Yang L,
Toiyama Y, Gao R, Liu M, Yin M, Pan C, et al: Fusobacterium
nucleatum increases proliferation of colorectal cancer cells
and tumor development in mice by activating toll-like receptor 4
signaling to nuclear factor-κB, and up-regulating expression of
microRNA-21. Gastroenterology. 152:851–866.e24. 2017.PubMed/NCBI View Article : Google Scholar
|
|
8
|
Carethers JM and Jung BH: Genetics and
genetic biomarkers in sporadic colorectal cancer. Gastroenterology.
149:1177–1190.e3. 2015.PubMed/NCBI View Article : Google Scholar
|
|
9
|
Okugawa Y, Grady WM and Goel A: Epigenetic
alterations in colorectal cancer: Emerging biomarkers.
Gastroenterology. 149:1204–1225.e12. 2015.PubMed/NCBI View Article : Google Scholar
|
|
10
|
Prahallad A, Sun C, Huang S, Di
Nicolantonio F, Salazar R, Zecchin D, Beijersbergen RL, Bardelli A
and Bernards R: Unresponsiveness of colon cancer to BRAF(V600E)
inhibition through feedback activation of EGFR. Nature.
483:100–103. 2012.PubMed/NCBI View Article : Google Scholar
|
|
11
|
Barras D, Missiaglia E, Wirapati P, Sieber
OM, Jorissen RN, Love C, Molloy PL, Jones IT, McLaughlin S, Gibbs
P, et al: BRAF V600E mutant colorectal cancer subtypes based on
gene expression. Clin Cancer Res. 23:104–115. 2017.PubMed/NCBI View Article : Google Scholar
|
|
12
|
Arriba M, García JL, Inglada-Pérez L,
Rueda D, Osorio I, Rodríguez Y, Álvaro E, Sánchez R, Fernández T,
Pérez J, et al: DNA copy number profiling reveals different
patterns of chromosomal instability within colorectal cancer
according to the age of onset. Mol Carcinog. 55:705–716.
2016.PubMed/NCBI View
Article : Google Scholar
|
|
13
|
Koi M, Garcia M, Choi C, Kim HR, Koike J,
Hemmi H, Nagasaka T, Okugawa Y, Toiyama Y, Kitajima T, et al:
Microsatellite alterations with allelic loss at 9p24.2 signify
less-aggressive colorectal cancer metastasis. Gastroenterology.
150:944–955. 2016.PubMed/NCBI View Article : Google Scholar
|
|
14
|
Voorneveld PW, Kodach LL, Jacobs RJ, Liv
N, Zonnevylle AC, Hoogenboom JP, Biemond I, Verspaget HW, Hommes
DW, de Rooij K, et al: Loss of SMAD4 alters BMP signaling to
promote colorectal cancer cell metastasis via activation of Rho and
ROCK. Gastroenterology. 147:196–208.e13. 2014.PubMed/NCBI View Article : Google Scholar
|
|
15
|
Dow LE, O'Rourke KP, Simon J,
Tschaharganeh DF, van Es JH, Clevers H and Lowe SW: Apc restoration
promotes cellular differentiation and reestablishes crypt
homeostasis in colorectal cancer. Cell. 161:1539–1552.
2015.PubMed/NCBI View Article : Google Scholar
|
|
16
|
Li X, Chen T, Shi Q, Li J, Cai S, Zhou P,
Zhong Y and Yao L: Angiopoietin-like 4 enhances metastasis and
inhibits apoptosis via inducing bone morphogenetic protein 7 in
colorectal cancer cells. Biochem Biophys Res Commun. 467:128–134.
2015.PubMed/NCBI View Article : Google Scholar
|
|
17
|
Yang C, Wang S, Ruan H, Li B, Cheng Z, He
J, Zuo Q, Yu C, Wang H, Lv Y, et al: Downregulation of PDK4
increases lipogenesis and associates with poor prognosis in
hepatocellular carcinoma. J Cancer. 10:918–926. 2019.PubMed/NCBI View Article : Google Scholar
|
|
18
|
Livak KJ and Schmittgen TD: Analysis of
relative gene expression data using real-time quantitative PCR and
the 2(-Δ Δ C(T)) method. Methods. 25:402–408. 2001.PubMed/NCBI View Article : Google Scholar
|
|
19
|
Hasle H, Clemmensen IH and Mikkelsen M:
Risks of leukaemia and solid tumours in individuals with Down
syndrome. Lancet. 355:165–169. 2000.PubMed/NCBI View Article : Google Scholar
|
|
20
|
Hasle H, Friedman JM, Olsen JH and
Rasmussen SA: Low risk of solid tumors in persons with Down
syndrome. Genet Med. 18:1151–1157. 2016.PubMed/NCBI View Article : Google Scholar
|
|
21
|
Pussegoda KA: Down syndrome patients are
less likely to develop cancer. Clin Genet. 78:35–37.
2010.PubMed/NCBI View Article : Google Scholar
|
|
22
|
Jin H, Wang C, Jin G, Ruan H, Gu D, Wei L,
Wang H, Wang N, Arunachalam E, Zhang Y, et al: Regulator of
calcineurin 1 gene isoform 4, down-regulated in hepatocellular
carcinoma, prevents proliferation, migration, and invasive activity
of cancer cells and metastasis of orthotopic tumors by inhibiting
nuclear translocation of NFAT1. Gastroenterology. 153:799–811.e33.
2017.PubMed/NCBI View Article : Google Scholar
|
|
23
|
Dey N, Krie A, Klein J, Williams K,
McMillan A, Elsey R, Sun Y, Williams C, De P and Leyland-Jones B:
Down syndrome and triple negative breast cancer: A rare occurrence
of distinctive clinical relationship. Int J Mol Sci.
18(E1218)2017.PubMed/NCBI View Article : Google Scholar
|
|
24
|
Kuwahara K, Yamamoto-Ibusuki M, Zhang Z,
Phimsen S, Gondo N, Yamashita H, Takeo T, Nakagata N, Yamashita D,
Fukushima Y, et al: GANP protein encoded on human chromosome
21/mouse chromosome 10 is associated with resistance to mammary
tumor development. Cancer Sci. 107:469–477. 2016.PubMed/NCBI View Article : Google Scholar
|
|
25
|
Hattori M, Fujiyama A, Taylor TD, Watanabe
H, Yada T, Park HS, Toyoda A, Ishii K, Totoki Y, Choi DK, et al:
Chromosome 21 mapping and sequencing consortium: The DNA sequence
of human chromosome 21. Nature. 405:311–319. 2000.PubMed/NCBI View
Article : Google Scholar
|
|
26
|
Li W, Wang X and Li S: Investigation of
copy number variations on chromosome 21 detected by comparative
genomic hybridization (CGH) microarray in patients with congenital
anomalies. Mol Cytogenet. 11(42)2018.PubMed/NCBI View Article : Google Scholar
|
|
27
|
Barbon A and Barlati S: Genomic
organization, proposed alternative splicing mechanisms, and RNA
editing structure of GRIK1. Cytogenet Cell Genet. 88:236–239.
2000.PubMed/NCBI View Article : Google Scholar
|
|
28
|
Sander T, Hildmann T, Kretz R, Fürst R,
Sailer U, Bauer G, Schmitz B, Beck-Mannagetta G, Wienker TF and
Janz D: Allelic association of juvenile absence epilepsy with a
GluR5 kainate receptor gene (GRIK1) polymorphism. Am J Med Genet.
74:416–421. 1997.PubMed/NCBI
|
|
29
|
Matsuda K: Novel susceptibility loci for
hepatocellular carcinoma in chronic HBV carriers. Hepatobiliary
Surg Nutr. 1:59–60. 2012.PubMed/NCBI View Article : Google Scholar
|
|
30
|
Luo Y, Xie C, Brocker CN, Fan J, Wu X,
Feng L, Wang Q, Zhao J, Lu D, Tandon M, et al: Intestinal PPARα
protects against colon carcinogenesis via regulation of
methyltransferases DNMT1 and PRMT6. Gastroenterology.
157:744–759.e4. 2019.PubMed/NCBI View Article : Google Scholar
|
|
31
|
Minbay Z, Serter Kocoglu S, Gok Yurtseven
D and Eyigor O: Immunohistochemical localization of ionotropic
glutamate receptors in the rat red nucleus. Bosn J Basic Med Sci.
17:29–37. 2017.PubMed/NCBI View Article : Google Scholar
|
|
32
|
Kuo TC, Chen CK, Hua KT, Yu P, Lee WJ,
Chen MW, Jeng YM, Chien MH, Kuo KT, Hsiao M, et al: Glutaminase 2
stabilizes Dicer to repress Snail and metastasis in hepatocellular
carcinoma cells. Cancer Lett. 383:282–294. 2016.PubMed/NCBI View Article : Google Scholar
|
|
33
|
Cacace A, Sboarina M, Vazeille T and
Sonveaux P: Glutamine activates STAT3 to control cancer cell
proliferation independently of glutamine metabolism. Oncogene.
36:2074–2084. 2017.PubMed/NCBI View Article : Google Scholar
|
|
34
|
Christa L, Simon MT, Flinois JP, Gebhardt
R, Brechot C and Lasserre C: Overexpression of glutamine synthetase
in human primary liver cancer. Gastroenterology. 106:1312–1320.
1994.PubMed/NCBI View Article : Google Scholar
|