Introduction
At present, reverse transcription-quantitative PCR
(RT-qPCR) is an extremely sensitive method for studying absolute or
relative gene expression. In absolute quantification of a
particular transcript, the input copy number is calculated, whereas
for relative quantification, the expression of a reference gene is
measured and compared against the expression level of the target
gene. Setting up and using a standard curve for relative expression
can allow you to accurately estimate absolute quantification from
relative quantification (1). qPCR
data of target genes can be achieved by relative quantification
when internal control genes are used as a reference (2). Absolute quantification is not
extensively used by most researchers, whereas relative
quantification is frequently used in numerous studies for analysis
of gene expression (3). Without
considering the experimental conditions, reference genes are
designated as internal controls for which, among different samples,
gene expression has to be relatively stable. Standardizing the
expression profile and making use of suitable reference genes may
improve the precision and consistency of qPCR (4,5).
However, the expression of the reference genes may vary based on
differing experimental settings, sample species, tissues,
treatments, developmental stages or genotypes (6,7).
Therefore, the use of a precise and consistently expressed
reference gene under certain conditions is essential for reliable
analysis of qPCR.
Influenza is a contagious viral infection that
infects millions of people per year worldwide, and has resulted in
~1 million mortalities as a result of pandemics in the 2009 swine
flu (8). Influenza virus results in
a severe respiratory tract infection, and has a high rate of
morbidity and mortality, particularly in high-risk populations,
such as elderly people (9,10). Kidney-yang deficiency syndrome
(KYDS) is one of the classical syndrome patterns in Traditional
Chinese Medicine (TCM) and is characterized by tenderness and
weakness in the knees and lumbar regions, mental fatigue,
difficulty in urinating, enuresis, female sterility, problems in
hearing and teeth (11). A study
investigating 2,067 elderly Chinese individuals (>60 years)
revealed that 45.33% of these patients suffered from KYDS,
suggesting that KYDS is the predominant TCM syndrome in high-risk
populations (12). Another
epidemiological investigation was conducted on 2,137 healthy
elderly individuals (>60 years in age), and the results
indicated that the rate of kidney deficiency was 78.80% (13). These data show that there is an
increasing trend for elderly patients with a deteriorating health
status to suffer from KYDS (14).
Therefore, KYDS is the predominant TCM syndrome in high-risk
populations (13,15). It is concerning that these elderly
patients who suffer from KYDS are also at an increased risk of
contracting seasonal influenza infections.
KYDS and influenza A virus subtype H1N1 (A/H1N1)
virus infection causes broad ranging variations in gene expression,
which form the molecular basis of the biological effects of KYDS
following infection with influenza A virus (16-23).
To further understand the mechanisms underlying KYDS following
infection with influenza A, with the aim of developing an effective
treatment for this disease, the changes in gene transcription
during infection need to be determined and understood. Our previous
study showed that certain commonly used reference genes (GAPDH or
Actβ) were actually unstable in the lung tissue of KYDS infection
with influenza, compared with normal control mice (24). In addition, evaluation of the
stability of reference genes in tissues other than the lungs, such
as the hearts, livers, and kidneys, following KYDS and infection is
important as they are closely associated with and notably affected
by KYDS (25-27).
In the present study, 10 candidate reference genes
[β-actin (Actβ), β2 microglobulin (β2m), GAPDH, β-glucuronidase
(Gusβ), α-tubulin (Tubα), Gene rich cluster, C10 gene (Grcc10),
eukaryotic translation initiation factor 4H (Eif4h), ring finger
protein 187 (Rnf187), neural precursor cell expressed,
developmentally down-regulated gene 8 (Nedd8), and tyrosine
3-monooxygenase/tryptophan 5-monooxygenase activation protein,
epsilon polypeptide (Ywhae)] that are suitable for use as internal
reference genes for normalizing gene expression were selected
(17,20,22,28,29).
The consistency of expression of these genes in a mouse model of
KYDS subsequently infected with A/H1N1 virus, or with a mock
control, were assessed in tissue samples from four different organs
using 4 statistical algorithms: NormFinder; geNorm; Bio-Rad
Maestro; and BestKeeper. The aim of the present study was to
determine the most accurate reference gene for the calculation of
target gene expression in studies investigating KYDS and viral
infection.
Materials and methods
Animals
The present study was performed in accordance with
the protocols provided by the Guide for the Care and Use of
Laboratory Animals of the National Institutes of Health. The
procedure was approved by the Ethic Committee of Shandong
University of Traditional Chinese Medicine (approval no.
SDUTCM2018091901). Mice were regularly observed by staff
veterinarians (Experimental Center, Shandong University of
Traditional Chinese Medicine) in specific pathogen-free conditions,
at 21-23˚C, with 60-70% humidity with a 12/12 h light/dark cycle.
Isoflurane was used for anesthesia prior to surgery, and suffering
was reduced to a minimum. Male SPF BALB/c mice weighing (18-20 g)
were purchased from the Jinan Pengyue Experimental Animal Breeding
Co., Ltd. A total of 40 animals were used in the present study. The
mice were acclimated for 3 days, and separated into two groups,
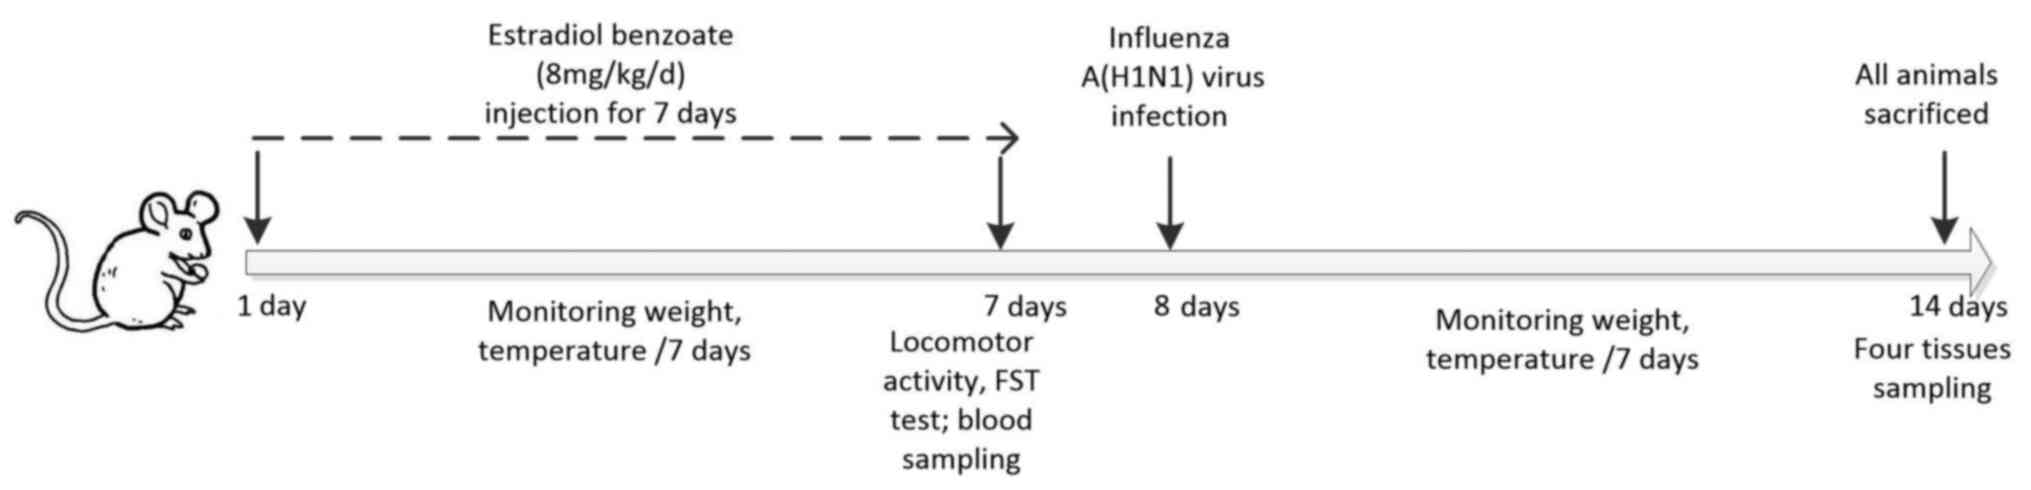
with 20 animals in each group. The mice were treated for 2 weeks as
follows: The model group received serial intraperitoneal
inoculation with 8 mg/kg estradiol benzoate for 7 days for mice in
the KYDS group, as described previously (30,31);
and the normal control group received intraperitoneal injection
with 0.1 ml saline. The rectal temperature and body weight were
examined prior and subsequent to infection. The levels of
spontaneous locomotor activity of the mice were evaluated in open
field tests in an automated mode using a mouse autonomic activity
instrument (ZIL-2 locomotor activity automatic measuring
instrument; Institute of Materia Medica, Chinese Academy of Medical
Sciences), as described previously (32). Animals were placed individually into
a chamber with opaque Perspex® walls and floors and a
transparent Perspex® lid. The chamber was equipped with
infrared photobeams connected to a computer to collect spontaneous
locomotor activity. Mice were acclimated to the chambers for 3 min.
The spontaneous locomotor activity, defined as the total
accumulated counts of a horizontal single photobeam interruption,
was collected for a period of 10 min. The swimming time was
measured with forced swim test (FST), as described previously
(33). FST is often used as a
method of measuring the degree of exercise fatigue in rodents. For
the FST, mice were placed individually into a plastic cylinder
containing water (24±1˚C). The cylinder water was sufficiently deep
to ensure that the animals' hind paws could not touch the bottom of
the cylinder. An iron weight, weighing 5% of mouse body weight, was
attached to animals' tail using masking tape. The swimming time was
recorded until the mice became exhausted and were rescued within 1
h. A total of 10 animals were selected randomly in each group to
measure the serum steroid hormones (estradiol and progesterone) and
thyroid hormones (T3 and T4) by xMAP® technology in a
flow cytometry-based Luminex 200 instrument with xPONENT software
3.1 for analysis (Luminex Corporation). This kit was Multi-Species
Hormone Magnetic Bead Panel (cat. no. MSHMAG-21K) and was purchased
from EMD Millipore, including Multi-Species Hormone Standard (cat.
no. MSPHM-8021), Multi-Species Hormone Quality Controls 1 and 2
(cat. no. MSPHM-6021), Multi-Species Hormone HRP Conjugate (cat.
no. MSPHM-HRP), Streptavidin-Phycoerythrin (cat. no. MC-SAPE2). The
Multi-Species Hormone Magnetic Bead Panel Assay was performed
according to the manufactuer's protocol (http://www.millipore.com), using the following
antibody beads and dilutions: Anti-Estradiol Bead (cat. no.
ESTRDL-MAG, 40:1), Anti-Progesterone Bead (cat. no. PRGST-MAG;
40:1), Anti-T3 Bead (cat. no. T3-MAG; 40:1) and Anti-T4 Bead (cat.
no. T4-MAG; 40:1) and Multi-Species Hormone Detection Antibody
(cat. no. MSPHM-1021). These animals were anesthetized with
3.5-4.5% isoflurane for induction when observed for loss of
righting reflex and the breathing pattern had become deeper and
slower on the 7th day post-injection, and 0.5-0.8 ml blood samples
were collected via retro-orbital bleeding procedure. The animals
were then sacrificed by cervical dislocation following blood
collection. On the 8th day, mice in the model group were
anaesthetized with 3.5-4.5% isoflurane for induction (when animals
should not respond to noxious stimuli via a toe pinch or loss of
righting reflex), and 20 µl viral suspension containing a
hemagglutination titer of 1:320 of virus influenza A/FM/1/47
(donated by Professor Hong Meng, Shandong Academy of Medical
Sciences) was dropped into the nose. The mice in the control group
were inoculated with 20 µl normal saline. All mice were
subsequently given ad libitum access to food and water.
Three mice that had lost 25% of their original weight during the
course of infection were sacrificed, and one mouse succumbed during
the entire study period. Schematic illustration of the experimental
timeline was displayed in Fig.
1.
Tissue preparation
On the 14th day, mice were subjected to anesthesia
with 3.5-4.5% isoflurane, when animals were monitored for loss of
righting reflex and the breathing pattern had become deeper and
slower, then sacrificed by cervical dislocation. The lung, heart,
liver, and kidney tissues were isolated, and weighed for the organ
index calculation, using the following formula: Visceral
index=weight of organ x100/bodyweight. Following harvesting, small
tissue samples were immediately submerged in RNAstore Reagent
(Tiangen Biotech Co., Ltd.) at a dilution ratio of 1:10 (w/v), and
stored at 4˚C until use.
Total RNA extraction
RNAprep Pure Tissue kit (Tiangen Biotech Co., Ltd.)
was used for total RNA extraction from 10-20 mg tissue samples
according to the manufacturer's protocol. Production and purity of
RNA was estimated using a Quawell 5,000 spectrophotometer (Quawell
Technology, Inc.). Samples with an optical density between 1.9-2.1
when measured with an absorbance ratio of 260/280 were used for
subsequent analysis. Subsequently, 1% agarose gel electrophoresis
was used to assess the integrity of RNA with GeneRed nucleic acid
dye (Tiangen Biotech Co., Ltd.).
Reverse transcription-quantitative
(RT-q)PCR
A reverse transcription FastQuant RT kit with gDNase
(Tiangen Biotech Co., Ltd.) was used with random hexamer
oligonucleotide primers according to the manufacturer's protocol
with 2 µg total RNA for 3 min at 42˚C. Reverse transcription was
performed using a FastQuant RT enzyme for 15 min at 42˚C. Samples
were subsequently stored at -20˚C. For qPCR analysis, nuclease-free
water was used to dilute the cDNA samples 10-fold, and the samples
were amplified using a Bio-Rad CFX Connect Real-Time system.
Samples were prepared using 6 pmol of both forward and reverse
primers, 2 µl cDNA and 10 µl 2x SuperReal PreMix Plus with
SYBR-Green I (Tiangen Biotech Co., Ltd.), made to a final volume of
20 µl. The thermocycling conditions were as follows: Initial
denaturation 15 min at 95˚C; followed by 40 cycles of 95˚C for 10
sec and 60˚C for 32 sec; then annealing and elongation 65˚C for 5
sec. Following amplification, the dissociation curves of the PCR
products were obtained by addition of a thermal denaturing cycle
followed by 65-95˚C with an increment of 0.5˚C. This was important
for verification of amplification specificity.
For each primer pair, computation of qPCR
efficiencies in the exponential phase was performed using the
standard curves (pooled cDNA was diluted 4-fold serially, which
contained equivalent numbers of various sample sets). For every
serial dilution, the mean quantification cycle (Cq) values were
plotted against the logarithm of the cDNA dilution factor, and the
equation: E=10 (-1/slope) x100 was used for calculation, where the
gradient of the linear regression line was represented by the
slope. The standard curve and correlation coefficients
(R2) for each gene were used for determination of linear
dynamic range.
Primers
Based on previous studies, 10 genes frequently used
as endogenous controls were selected as the reference genes. The
selected genes were: Actβ; Gusβ; GAPDH; β2m; Tubα; Grcc10; Eif4h;
Rnf187; Nedd8; and Ywhae. NCBI BLAST (blast.ncbi.nlm.nih.gov/Blast.cgi) was used for
identification of nucleotide sequences to design primers. Primers
were purchased from Beijing Liuhe BGI Technology Company. Table I presents the primer characteristics
of candidate reference genes. The sequences of the primers used for
analysis of an immune response were: Toll-like receptor 3 (TLR3)
forward, CAGGATACTTGATCTCGGCCTT; TLR3 reverse,
TGGCCGCTGAGTTTTTGTTC; TLR7 forward, CTGGAGTTCAGAGGCAACCATT; TLF7
reverse, GTTATCACCGGCTCTCCATAGAA; retinoic acid inducible gene-I
(RIG-I) forward, GCAGGTTACTGTGGACTTTGTG; RIG-I reverse,
TGCCATTCTCCCTTTAGTGTCT; A/H1N1 virus M forward,
5'-CTGAGAAGCAGATACTGGGC-3'; and A/H1N1 virus M reverse,
5'-CTGCATTGTCTCCGAAGAAAT-3'.
 | Table IPrimers sequences and
characteristics. |
Table I
Primers sequences and
characteristics.
| Gene symbol | Gene name | Accession
number | Primer
sequence | Amplicon size | Efficiency, % | R2 |
|---|
| Actβ | β-actin | NM_007393.5 | F:
CCTTCTTGGGTATGGAATCCTGT | 101 | 98.9 | 0.997 |
| | | | R:
CACTGTGTTGGCATAGAGGTCTTTAC | | | |
| β2m | β2
microglobulin | NM_009735.3 | F:
CATGGCTCGCTCGGTGAC | 135 | 97.3 | 0.994 |
| | | | R:
CAGTTCAGTATGTTCGGCTTCC | | | |
| GAPDH |
Glyceraldehyde-3-phosphate
dehydrogenase | NM_008084.3 | F:
TGCACCACCAACTGCTTAG | 177 | 98.1 | 0.999 |
| | | | R:
GGATGCAGGGATGATGTTC | | | |
| Gusβ |
β-glucuronidase | NM_010368.1 | F:
CCGACCTCTCGAACAACCG | 169 | 93 | 0.998 |
| | | | R:
GCTTCCCGTTCATACCACACC | | | |
| Tubα | α-tubulin | NM_011653.2 | F:
TGTCCTGGACAGGATTCGC | 115 | 97.2 | 0.997 |
| | | | R:
CTCCATCAGCAGGGAGGTG | | | |
| Grcc10 | Gene rich cluster,
C10 gene | NM_013535.1 | F:
GCGGAGGTGATTCAAGCG | 196 | 94 | 0.993 |
| | | | R:
TGACCAGGCGGGCAAACT | | | |
| Eif4h | Eukaryotic
translation initiation factor 4H | NM_033561.2 | F:
CCTTGGCTCGGGATTGTC | 198 | 92.9 | 0.999 |
| | | | R:
TCCGCATTGGAGATGGATTA | | | |
| Rnf187 | Ring finger protein
187 | NM_022423.2 | F:
CTGGCACCACCCTTCATC | 155 | 93.5 | 0.990 |
| | | | R:
ACAAGCCCGAGCACATTC | | | |
| Nedd8 | Neural precursor
cell expressed, developmentally down-regulated gene 8 | NM_008683.3 | F:
TGGGAAGGAGATTGAGATAG | 121 | 93 | 0.997 |
| | | | R:
TTGCTTGCCACTGTAGATG | | | |
| Ywhae | Tyrosine
3-monooxygenase/tryptophan 5-monooxygenase activation protein,
epsilon polypeptide | NM_009536.4 | F:
CCCATTCGTTTAGGTCTT | 193 | 95.3 | 0.993 |
| | | | R:
TCCACAGCGTCAGGTTAT | | | |
Data analysis
CFX Maestro™ software 1.0 (Bio-Rad
Laboratories, Inc.) automatic calculation was used to perform
threshold setting and baseline correction. CFX Maestro software was
also used to determine the Cq values using the means of the single
threshold mode.
A total of 3 common statistical programs, geNorm,
BestKeeper. and NormFinder, as well as Bio-Rad Maestro™
software were used to evaluate the stability of the reference
genes. A reference gene selector tool in CFX Maestro Software
(version 1.1) was used to analyze a run with multiple genes
stability. The 2-ΔΔCq formula (3) was used to transform Cq values into
non-normalized relative quantities, where: ΔCq=corresponding Cq
value-minimum Cq value. These transformed quantities were based on
geNorm and NormFinder calculations. BestKeeper and Bio-Rad Maestro
software were selected for evaluation of the raw Cq values. A
Student's t-test was used for statistical analysis of gene
expression data using SPSS Software version 22 (IBM Corp.).
P<0.05 was considered to indicate a statistically significant
difference. A variance analysis was performed using Microsoft
Office Excel (Microsoft Corporation).
Results
Establishment of a KYDS-virus mice
model
The KYDS mice model was commonly generated by the
classical method of intraperitoneal injection with estradiol
benzoate (34,35). The body weight measurements of the
mice in the KYDS model group were decreased significantly compared
with the mice in the normal group from the 4th to the 7th day
(Fig. S1A). The rectal
temperatures of KYDS mice were also significantly decreased from
the 2nd to the 7th day compared with the normal group (Fig. S1B). Spontaneous locomotor activity
and swimming time were measured; in the KYDS mice, both values were
decreased significantly compared with the mice in the normal group
(Fig. S1C and D). We also measured the levels of serum
steroid hormones (estradiol and progesterone) and thyroid hormones
(T3 and T4) by XMAP-technology in a flow cytometry-based Luminex
200 instrument. The levels of estradiol in the mice in the KYDS
model group were increased significantly compared with the mice in
the normal group (Fig. S2A), but
the expression levels of progesterone and T4 were significantly
decreased in the KYDS mice, compared with the mice in the normal
group (Fig. S2B and D). These data suggested that the KYDS
model was established successfully. The data also suggest the
presence of typical KYDS symptoms, including mental fatigue, lumbar
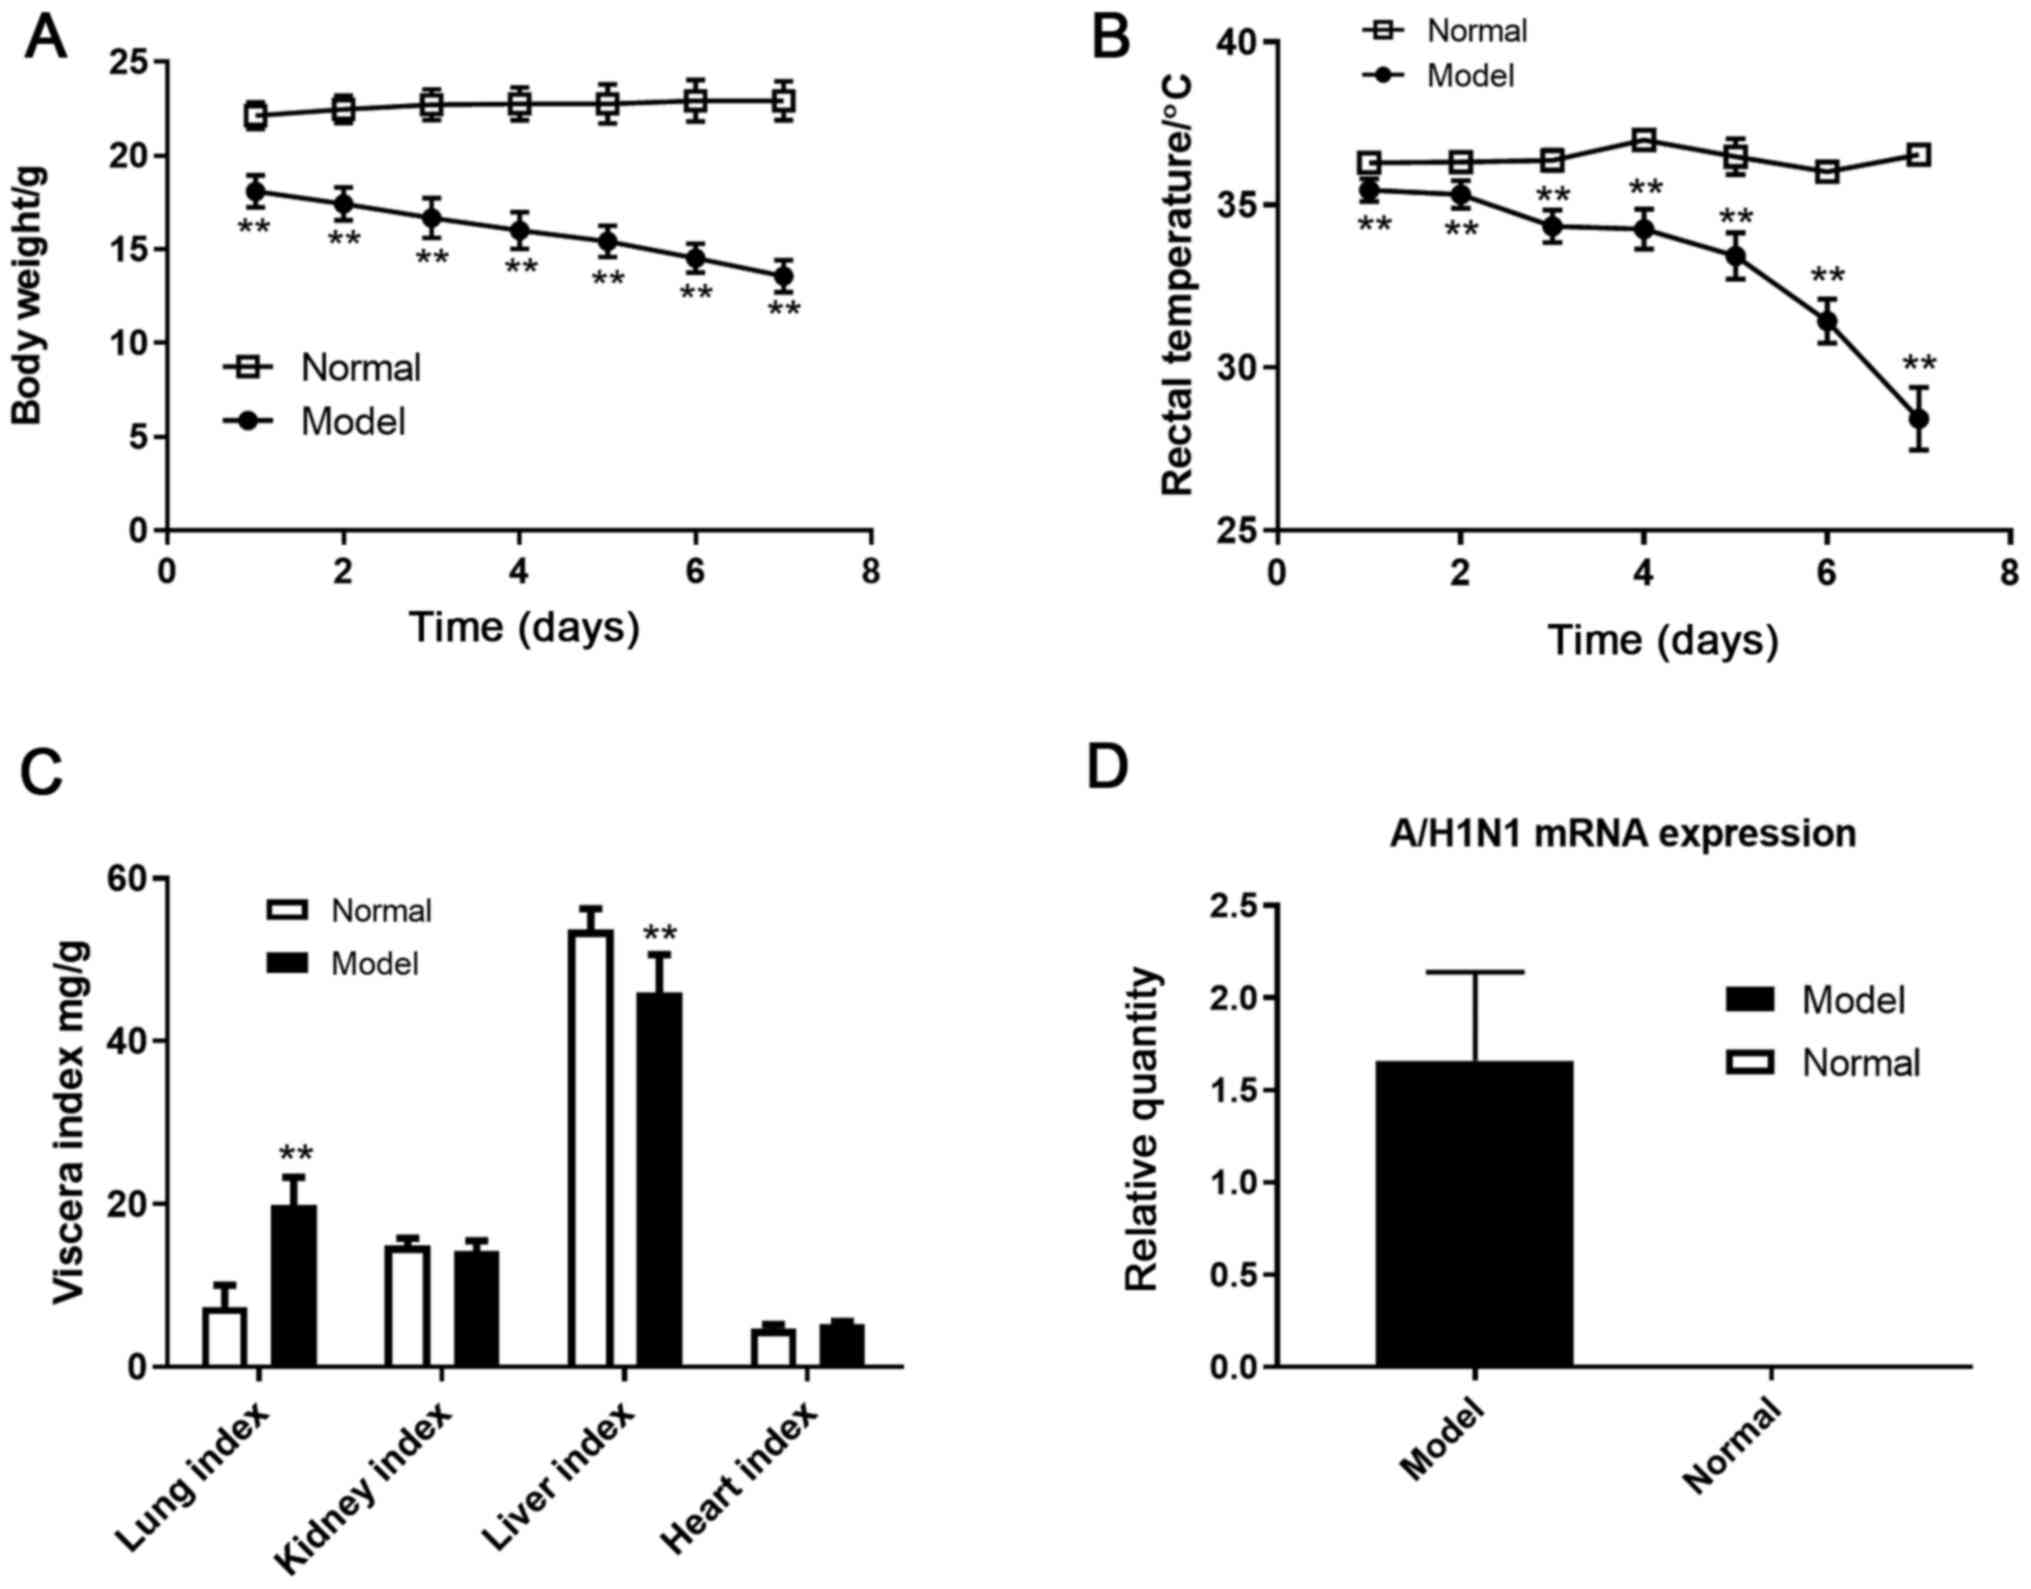
debility, chill sensations and cold limbs. A total of 14 days
post-treatment, the body weight and rectal temperature values in
the KYDS-virus group were significantly decreased compared with the
normal control group from day 1-7 following inoculation with the
A/H1N1 virus (P<0.01; Fig. 2A
and B). As shown in Fig. 2C, compared with the normal group,
the model group liver index decreased significantly (P<0.01),
whereas the lung index increased significantly (P<0.01). A/H1N1
virus mRNA expression was also assessed. Total RNA was isolated
from lung and converted into cDNA, and the relative expression of
A/H1N1 M gene RNA was determined using qPCR and compared with the
normal group (Fig. 2D). These
results confirmed that a KYDS-virus mice model had been established
successfully.
Expression profiles of candidate
reference genes
For the evaluation of the expression of the
KYDS-virus infection patterns, the 10 most frequently used and
recommended candidate reference genes from literature were selected
(17,20,22,28,29).
Following the qPCR assays, the performance of each amplification
primer set was examined. For all reactions, the range of
amplification efficiency was 99.0-99.9%; and the variation of the
standard curve for correlation coefficients (R2) was
0.9913-0.9999 (Table I). All tested
primer pairs were highly efficient and excellently correlated.
There were no primer dimer formations, and only 1 peak was formed
that confirmed the specificity of the amplification of the entire
transcript by melt curve analysis. When the template was absent, no
amplification was observed.
Both groups were comprised of 4 tissues and were
assessed for the expression profiles of the candidate reference
genes. It was observed that samples in different tissues exhibited
inconsistent ranges of expression for each reference gene (Fig. 3). For the 10 candidate reference
genes, expression levels are represented as Cq values, and varied
between 13-29, with the majority ranging from 18-20. For every
reference gene, a box plot was used to represent the Cq value
distribution in different tissues.
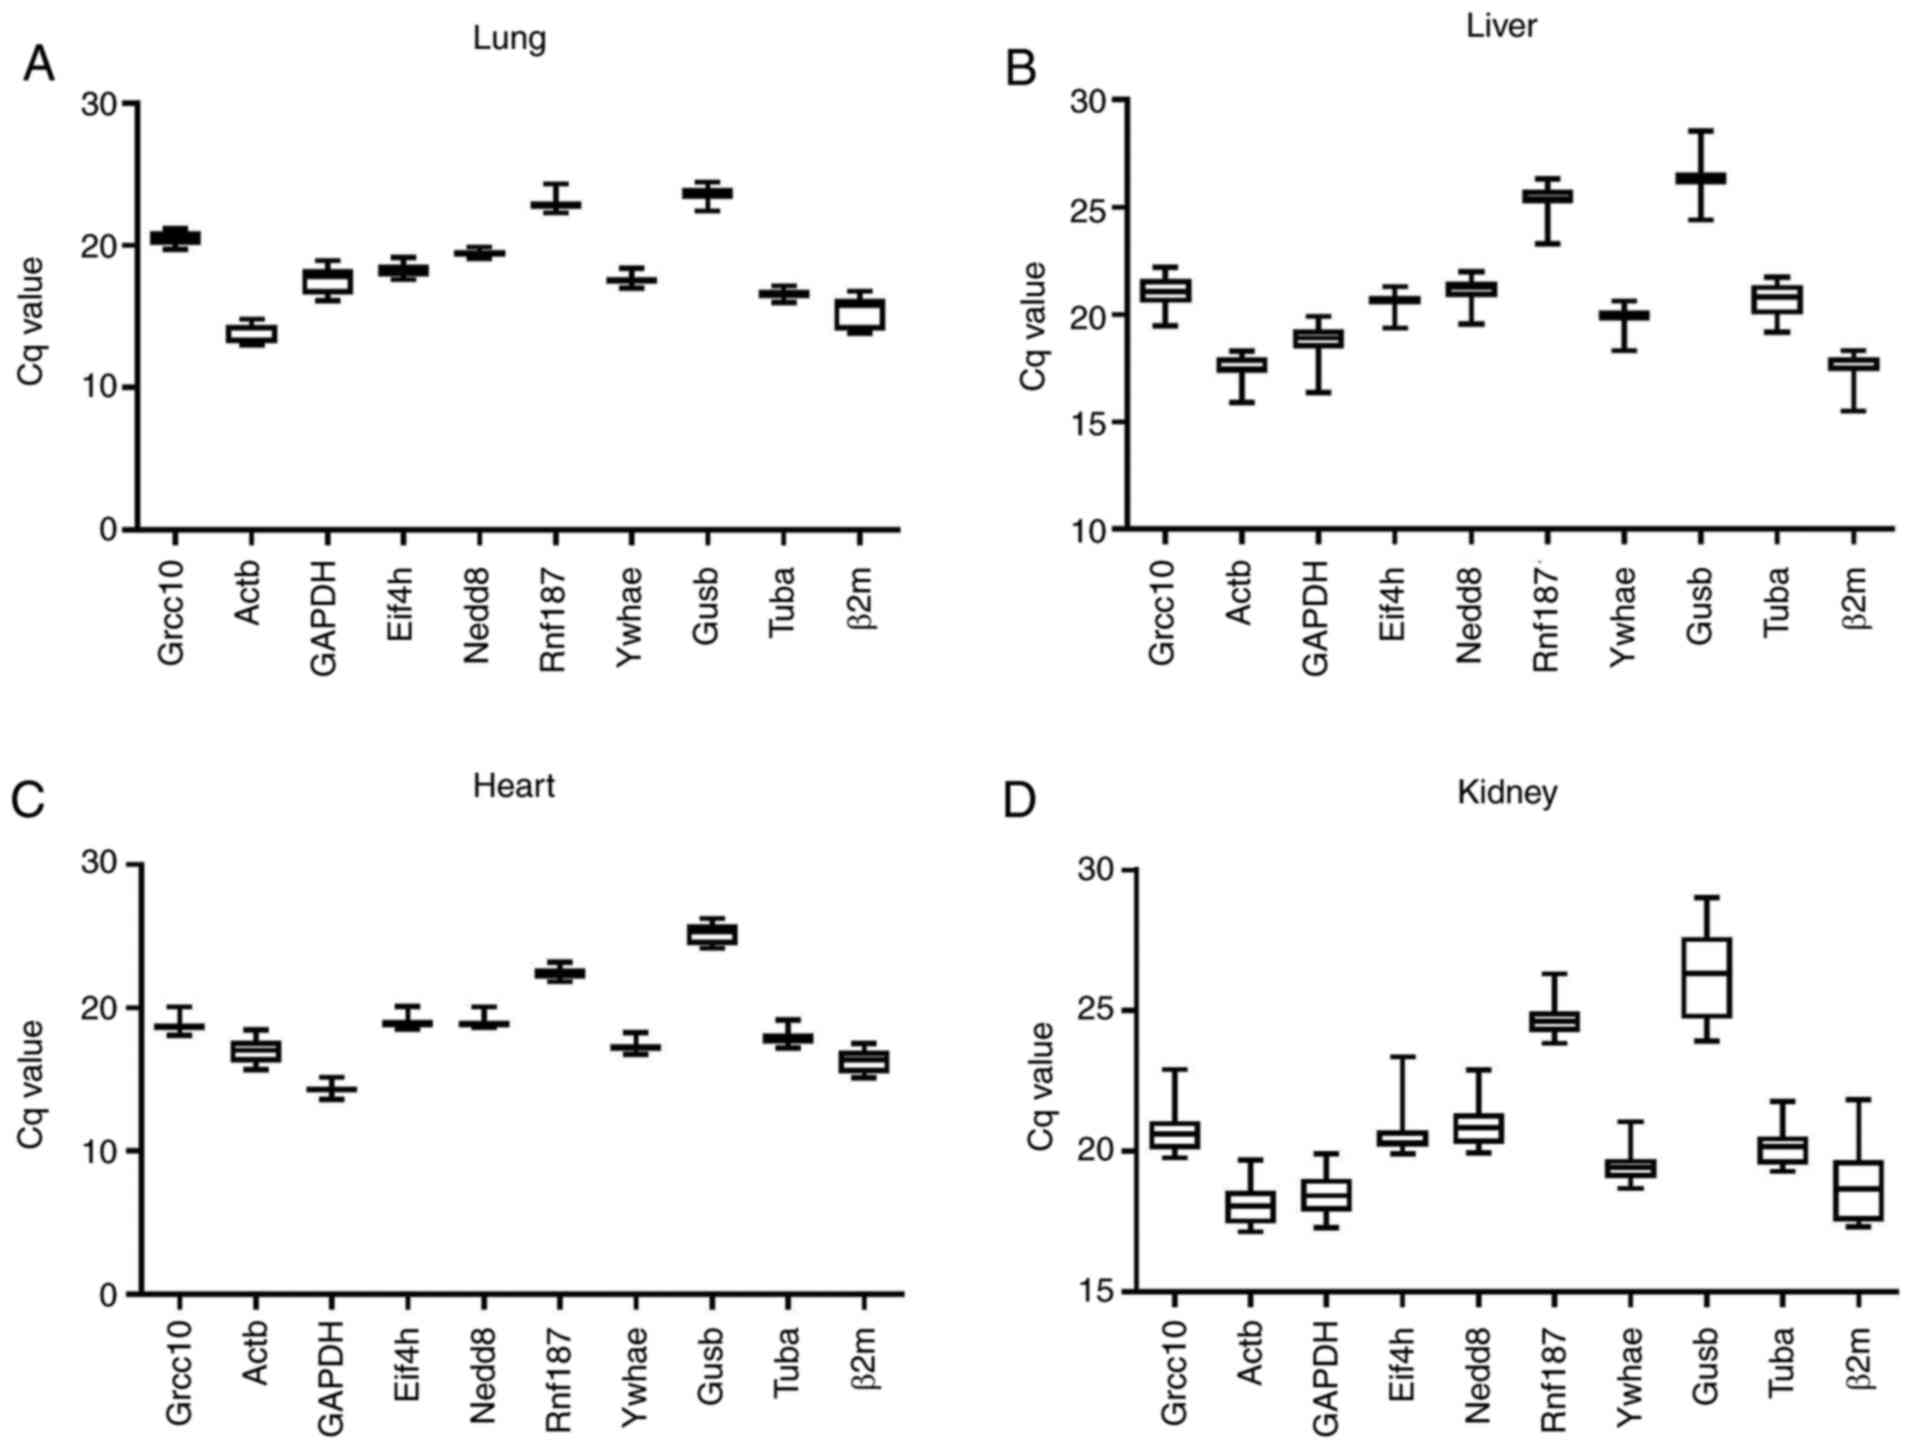 | Figure 3Distribution of Cq values for each
reference gene. For (A) lung, (B) liver, (C) heart, and (D) kidney
tissues, the distribution of the Cq values of the reference genes
is represented using a box and whisker plots. Boxes represent the
quartiles and medians, and the maximum and minimum values are
represented by the whiskers. Cq, quantification cycle; Actβ,
β-actin; β2m, β2 microglobulin; Gusβ, β-glucuronidase; Tubα,
α-tubulin; Grcc10, Gene rich cluster, C10 gene; Eif4h, eukaryotic
translation initiation factor 4H; Rnf187, ring finger protein 187;
Nedd8, neural precursor cell expressed, developmentally
down-regulated gene 8; Ywhae, tyrosine 3-monooxygenase/tryptophan
5-monooxygenase activation protein, epsilon polypeptide. |
geNorm algorithm
The gene expression stability (M) was calculated as
the average pair-wise variation between all examined genes, and
geNorm software was selected for the analysis of expression
stability of the candidate reference genes. The gene with the most
parallel levels of expression in all samples without consideration
of the conditions of experiment was considered the most stable
reference gene and had the lowest M value, where an M value of
<1.5 was a criterion for stability (Fig. 4).
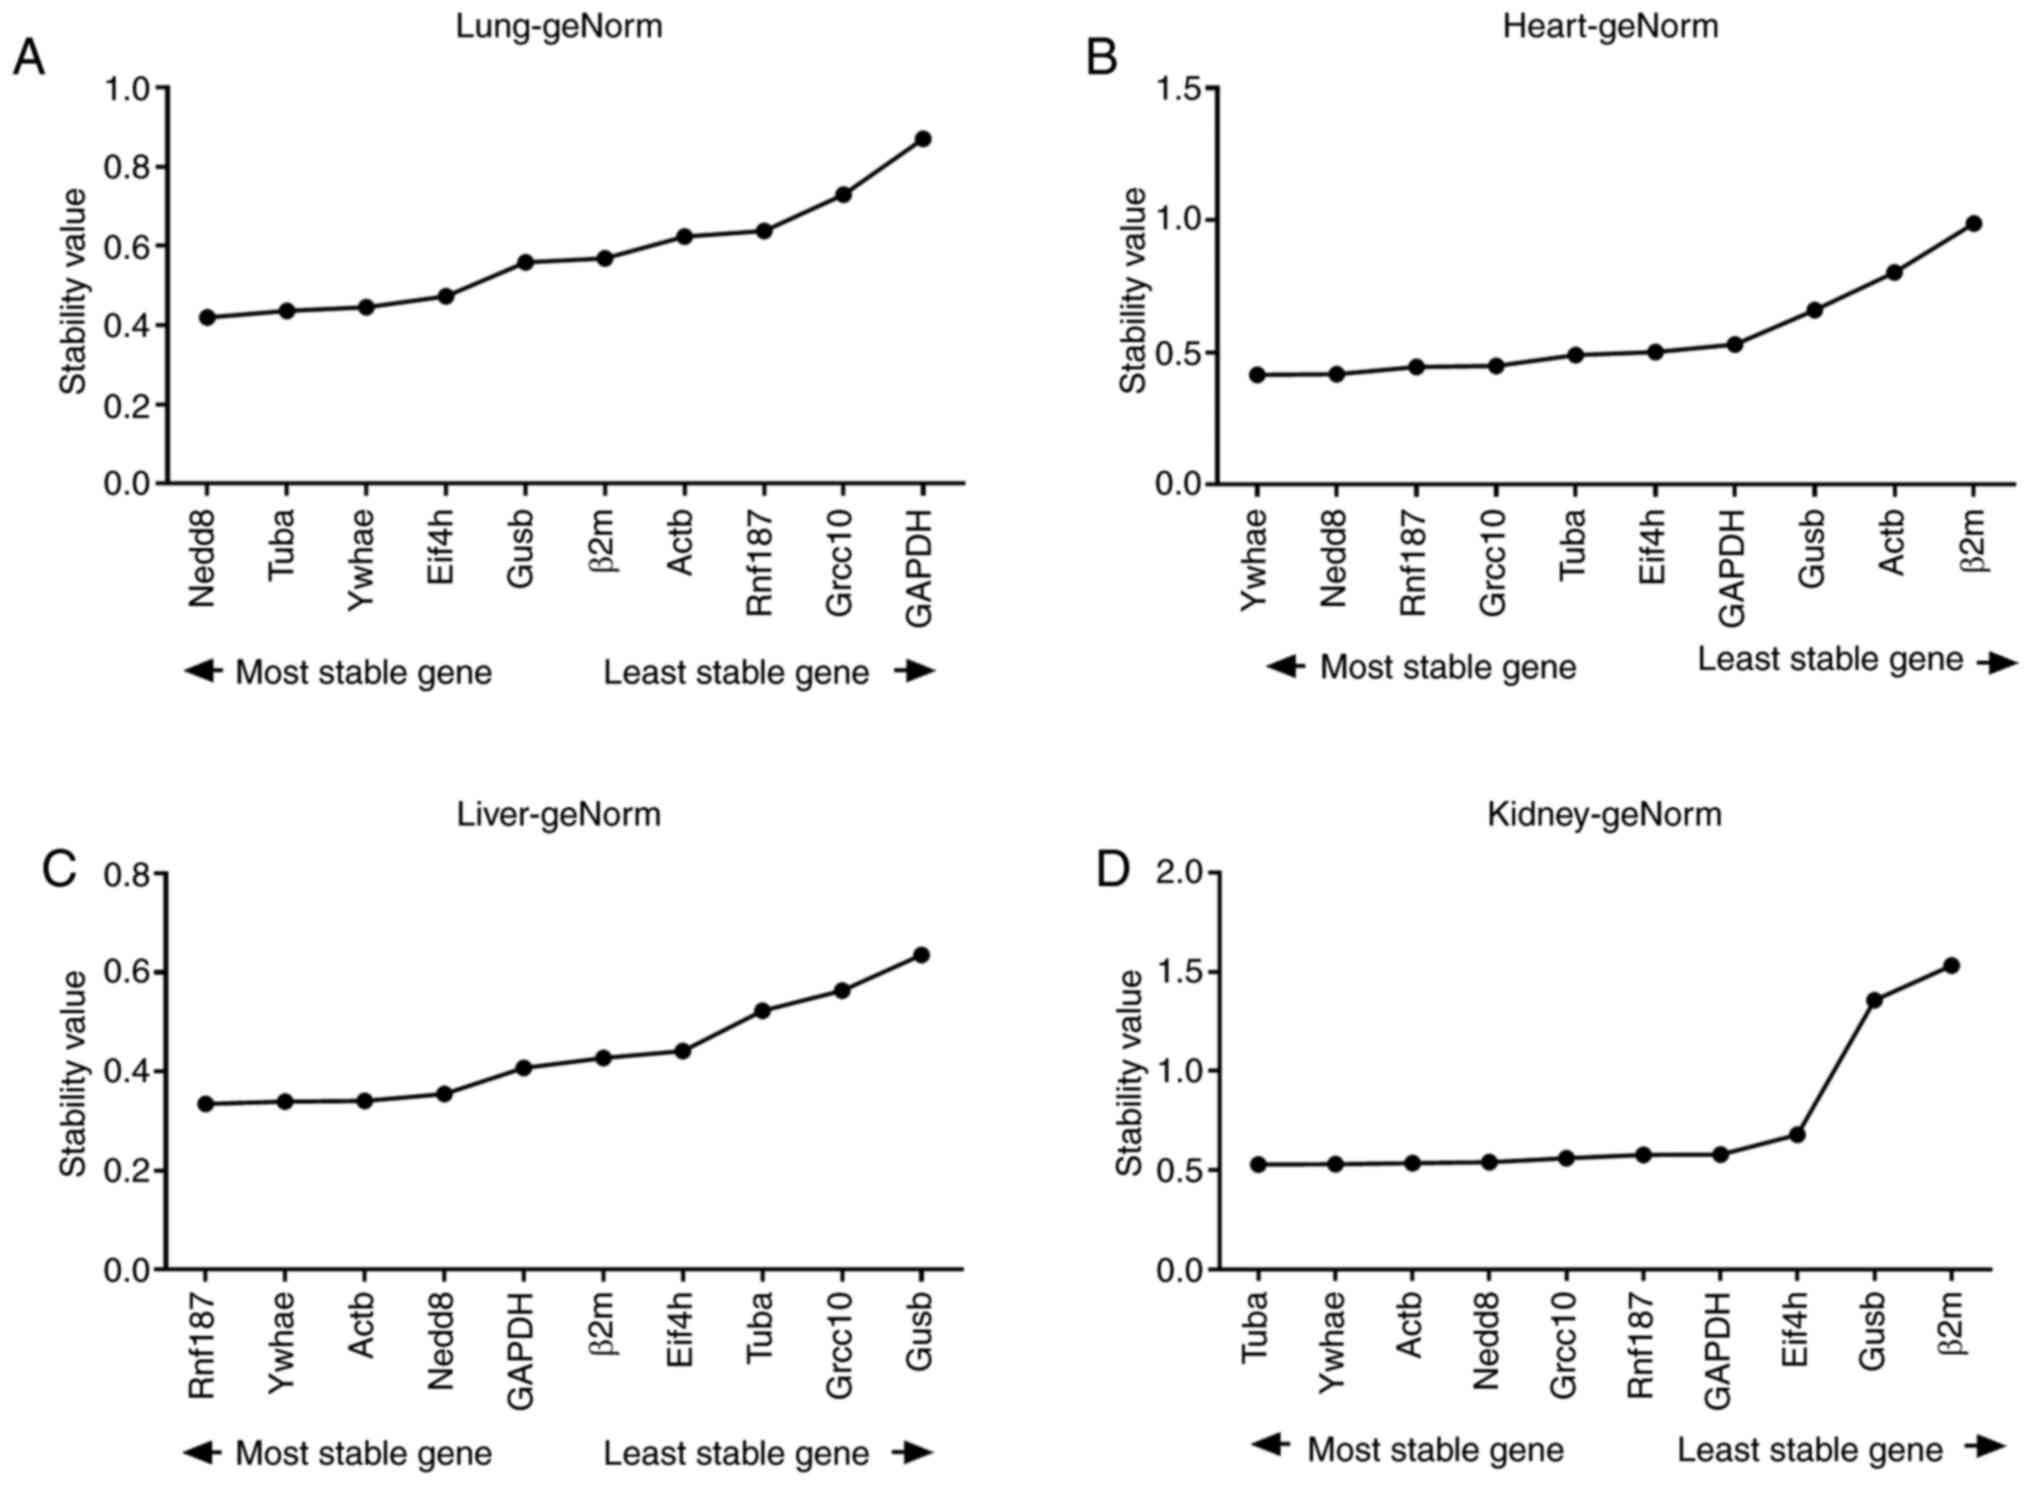 | Figure 4Average expression stability
evaluated by GeNorm. For (A) lung tissue, (B) heart tissue, (C)
liver tissue, and (D) kidney tissue under variable conditions, the
M values and grading are designated for mice. M, GeNorm-evaluated
average expression stability; Actβ, β-actin; β2m, β2 microglobulin;
Gusβ, β-glucuronidase; Tubα, α-tubulin; Grcc10, Gene rich cluster,
C10 gene; Eif4h, eukaryotic translation initiation factor 4H;
Rnf187, ring finger protein 187; Nedd8, neural precursor cell
expressed, developmentally down-regulated gene 8; Ywhae, tyrosine
3-monooxygenase/tryptophan 5-monooxygenase activation protein,
epsilon polypeptide. |
For the reference genes assessed, the calculated
average expression M values using geNorm are presented in Table II. The reference genes in lung
tissues with the lowest M values, and therefore considered the most
stable, were Nedd8 (M=0.42) and Tubα (M=0.436), whereas the least
stable were GAPDH (M=0.87) and Grcc10 (M=0.73). Ywhae and Nedd8
were identified to be stable in the heart tissues, with M values of
0.416 and 0.418, respectively, whereas β2m (M=0.988) exhibited the
poorest stability. In liver tissue samples, Ywhae and Rnf187, with
M values of 0.34 and 0.335, respectively, were the most stable. In
comparison, the most variable genes were Gusβ (M=0.636) and Grcc10
(M=0.564). For the kidney tissues, the genes considered to be the
most stable were Tubα (M=0.529) and Ywhae (M=0.53). The least
stable genes were β2m and Gusβ (M=1.532 and 1.358,
respectively).
| Table IIAnalysis of gene expression in the
KYDS-virus mouse model using geNorm, NormFinder, BestKeeper, and
Bio-Rad CFX Maestro™ software programs. |
Table II
Analysis of gene expression in the
KYDS-virus mouse model using geNorm, NormFinder, BestKeeper, and
Bio-Rad CFX Maestro™ software programs.
| | | geNorm | NormFinder | BestKeeper | Bio-Rad | |
|---|
| Tissue | Rank | Gene | M | Gene | Stability
value | Gene | std dev [± CP] | Gene | Stability
(Ln(1/AvgM)) | Comprehensive
ranking by geoMean |
|---|
| Lung | 1 | Nedd8 | 0.420 | Nedd8 | 0.025 | Nedd8 | 0.196 | Tubα | 1.815 | Nedd8 |
| | 2 | Tubα | 0.436 | Ywhae | 0.055 | Ywhae | 0.278 | Ywhae | 1.815 | Ywhae |
| | 3 | Ywhae | 0.445 | Tubα | 0.091 | Tubα | 0.312 | Nedd8 | 1.653 | Tubα |
| | 4 | Eif4h | 0.473 | Eif4h | 0.169 | Rnf187 | 0.355 | Eif4h | 1.512 | Eif4h |
| | 5 | Gusβ | 0.559 | Gusβ | 0.260 | Eif4h | 0.383 | Gusβ | 1.277 | Gusβ |
| | 6 | β2m | 0.569 | β2m | 0.284 | Gusβ | 0.431 | Actβ | 1.089 | Rnf187 |
| | 7 | Actβ | 0.624 | Rnf187 | 0.345 | Grcc10 | 0.432 | GAPDH | 0.888 | Actβ |
| | 8 | Rnf187 | 0.638 | Actβ | 0.345 | Actβ | 0.624 | Rnf187 | 0.733 | β2m |
| | 9 | Grcc10 | 0.730 | Grcc10 | 0.449 | GAPDH | 0.874 | β2m | 0.603 | Grcc10 |
| | 10 | GAPDH | 0.870 | GAPDH | 0.554 | β2m | 1.025 | Grcc10 | 0.483 | GAPDH |
| Heart | 1 | Ywhae | 0.416 | Nedd8 | 0.063 | Nedd8 | 0.182 | Nedd8 | 1.865 | Nedd8 |
| | 2 | Nedd8 | 0.418 | Ywhae | 0.077 | Ywhae | 0.232 | Grcc10 | 1.865 | Ywhae |
| | 3 | Rnf187 | 0.446 | Grcc10 | 0.088 | Eif4h | 0.248 | Ywhae | 1.706 | Grcc10 |
| | 4 | Grcc10 | 0.449 | Rnf187 | 0.094 | Grcc10 | 0.257 | Rnf187 | 1.513 | Rnf187 |
| | 5 | Tubα | 0.490 | Tubα | 0.209 | GAPDH | 0.263 | Eif4h | 1.349 | Eif4h |
| | 6 | Eif4h | 0.502 | Eif4h | 0.221 | Rnf187 | 0.325 | GAPDH | 1.246 | Tubα |
| | 7 | GAPDH | 0.531 | GAPDH | 0.247 | Tubα | 0.446 | Tubα | 1.130 | GAPDH |
| | 8 | Gusβ | 0.660 | Gusβ | 0.399 | β2m | 0.644 | Gusβ | 0.932 | Gusβ |
| | 9 | Actβ | 0.803 | Actβ | 0.507 | Gusβ | 0.660 | Actβ | 0.765 | Actβ |
| | 10 | β2m | 0.988 | β2m | 0.629 | Actβ | 0.828 | β2m | 0.561 | β2m |
| Liver | 1 | Rnf187 | 0.335 | Rnf187 | 0.044 | Eif4h | 0.327 | Ywhae | 1.967 | Rnf187 |
| | 2 | Ywhae | 0.34 | Actβ | 0.089 | Ywhae | 0.343 | Actβ | 1.967 | Ywhae |
| | 3 | Actβ | 0.341 | Nedd8 | 0.092 | Actβ | 0.395 | Rnf187 | 1.733 | Actβ |
| | 4 | Nedd8 | 0.355 | Ywhae | 0.106 | Rnf187 | 0.464 | Nedd8 | 1.528 | Eif4h |
| | 5 | GAPDH | 0.408 | GAPDH | 0.121 | Gusβ | 0.468 | GAPDH | 1.406 | Nedd8 |
| | 6 | β2m | 0.428 | β2m | 0.143 | β2m | 0.471 | Eif4h | 1.301 | GAPDH |
| | 7 | Eif4h | 0.442 | Eif4h | 0.204 | Nedd8 | 0.488 | β2m | 1.219 | β2m |
| | 8 | Tubα | 0.523 | Gusβ | 0.224 | GAPDH | 0.579 | Grcc10 | 1.124 | Gusβ |
| | 9 | Grcc10 | 0.564 | Grcc10 | 0.250 | Grcc10 | 0.651 | Tubα | 1.019 | Grcc10 |
| | 10 | Gusβ | 0.636 | Tubα | 0.258 | Tubα | 0.705 | Gusβ | 0.878 | Tubα |
| Kidney | 1 | Tubα | 0.529 | Tubα | 0.071 | Ywhae | 0.429 | Tubα | 1.593 | Tubα |
| | 2 | Ywhae | 0.530 | Ywhae | 0.089 | Rnf187 | 0.459 | Actβ | 1.593 | Ywhae |
| | 3 | Actβ | 0.536 | Rnf187 | 0.112 | Tubα | 0.496 | Nedd8 | 1.383 | Actβ |
| | 4 | Nedd8 | 0.540 | Grcc10 | 0.112 | Eif4h | 0.505 | Grcc10 | 1.338 | Rnf187 |
| | 5 | Grcc10 | 0.560 | Actβ | 0.134 | Nedd8 | 0.549 | Ywhae | 1.290 | Nedd8 |
| | 6 | Rnf187 | 0.577 | Nedd8 | 0.137 | Grcc10 | 0.555 | GAPDH | 1.234 | Grcc10 |
| | 7 | GAPDH | 0.580 | GAPDH | 0.203 | GAPDH | 0.574 | Rnf187 | 1.190 | Eif4h |
| | 8 | Eif4h | 0.679 | Eif4h | 0.285 | Actβb | 0.584 | Eif4h | 1.042 | GAPDH |
| | 9 | Gusβ | 1.358 | Gusβ | 0.881 | β2m | 1.085 | Gusβ | 0.608 | Gusβ |
| | 10 | β2m | 1.532 | β2m | 0.975 | Gusβ | 1.330 | β2m | 0.298 | β2m |
NormFinder algorithm
For the calculation of M value of the reference
genes, NormFinder was used. NormFinder performs separate analysis
of sample subgroups as a mathematical model, and also evaluates
both inter- and intragroup expression variations. The genes with
the lowest M value were considered the most stable and thus
suitable for use as reference genes for such specific experimental
conditions (Fig. 5).
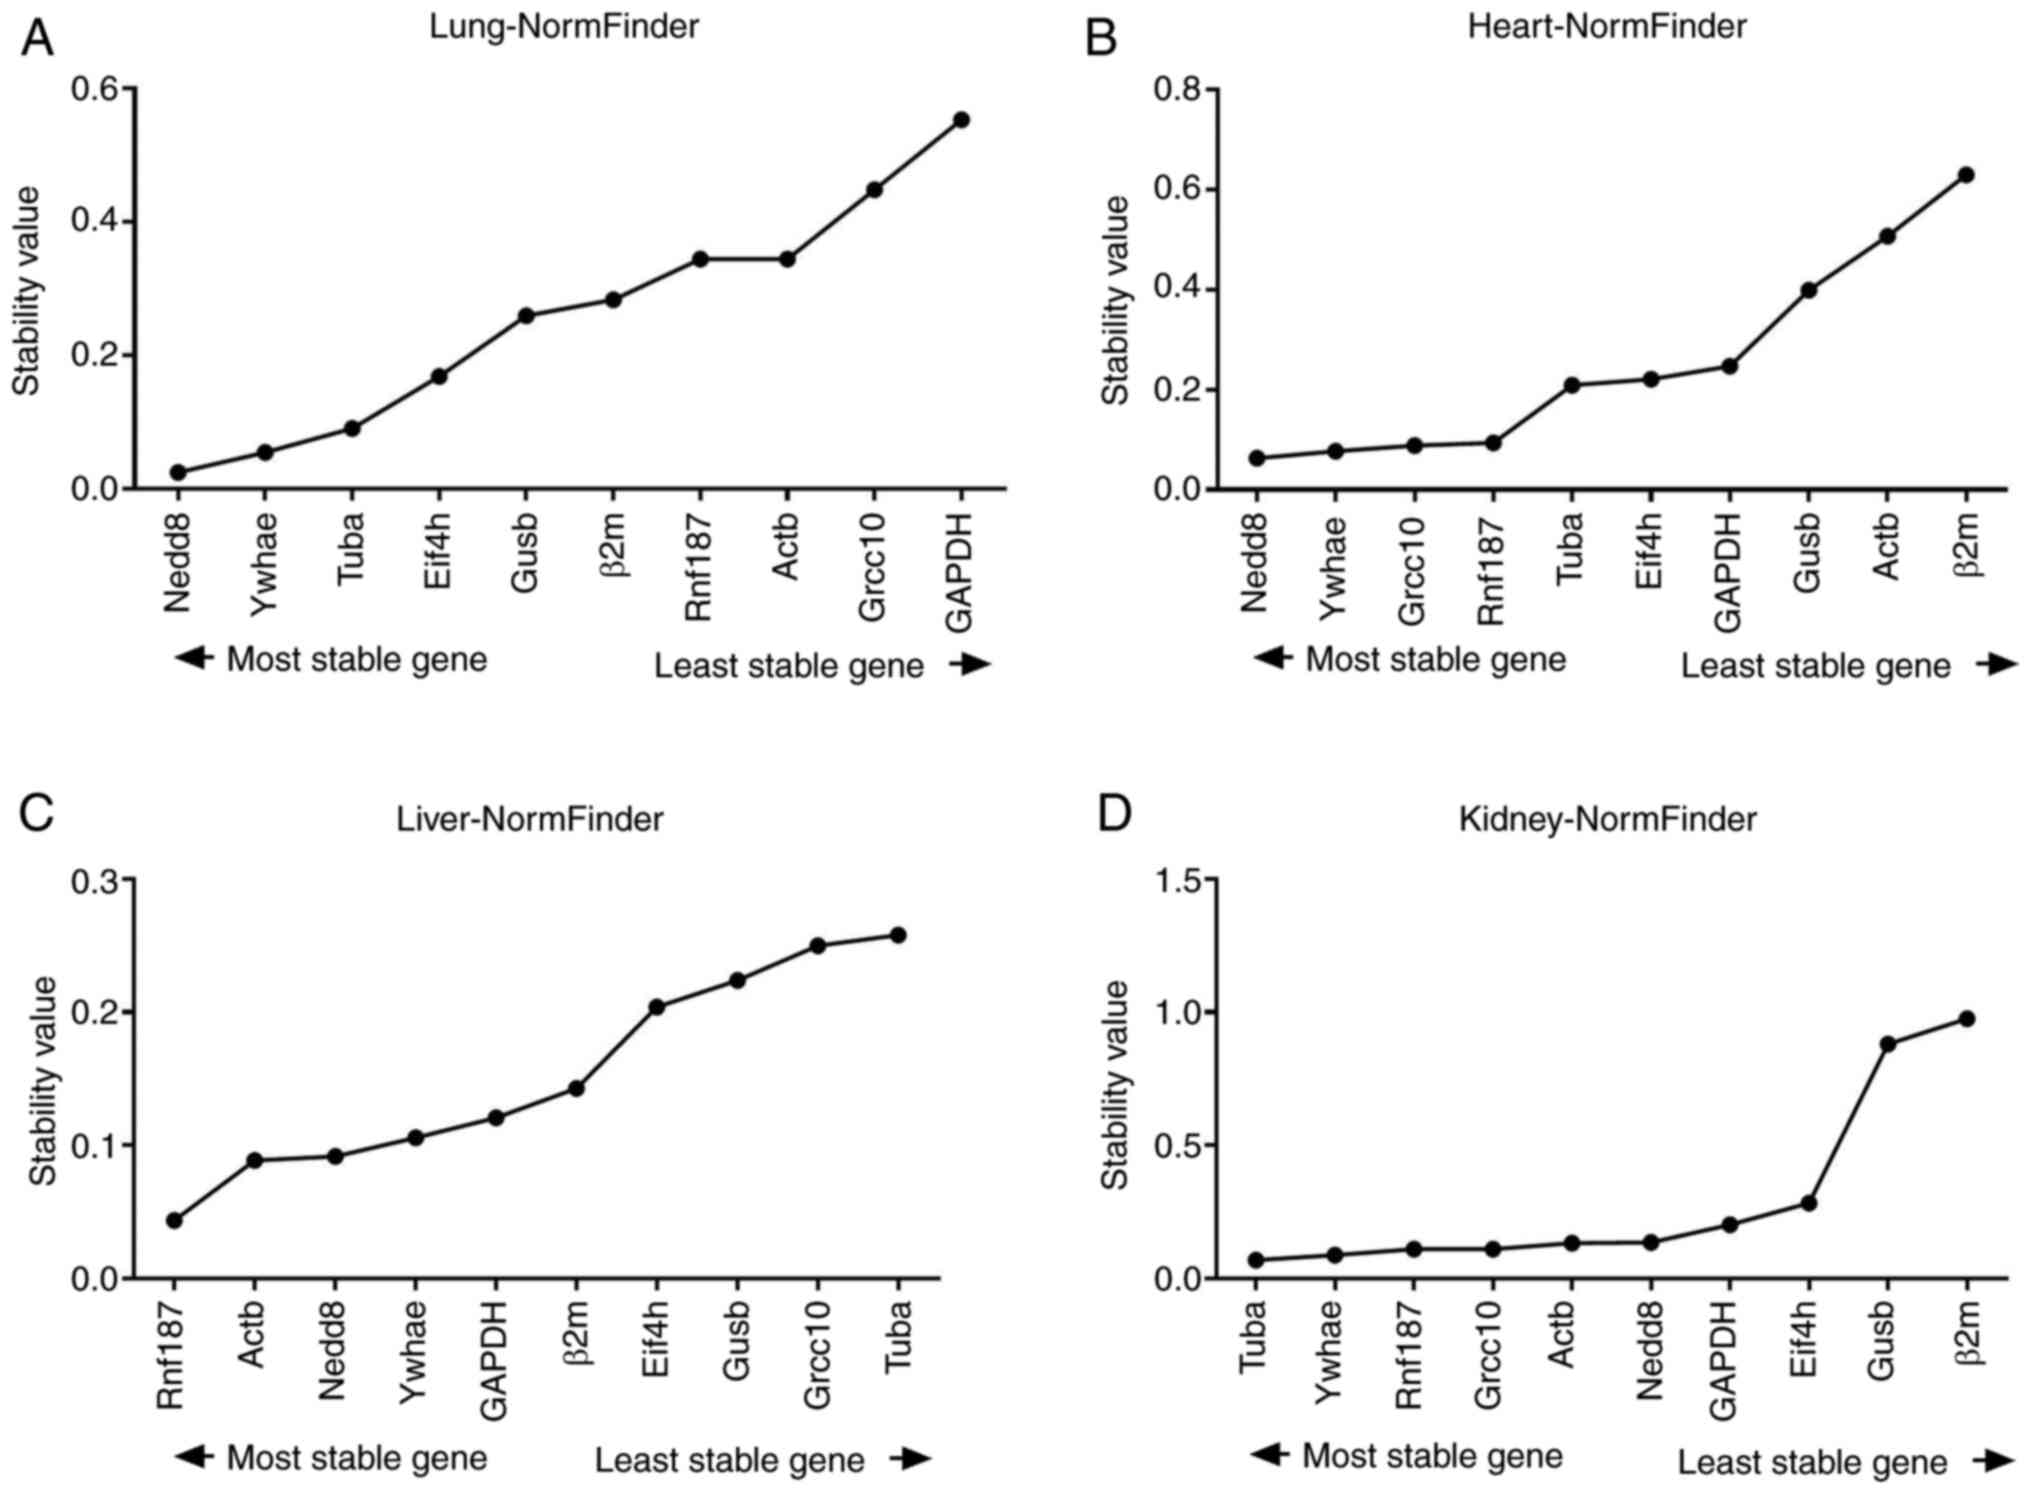 | Figure 5Average expression stability
evaluated by NormFinder. For (A) lung tissue, (B) heart tissue, (C)
liver tissue, and (D) kidney tissue under variable conditions, the
M values and grading are designated for mice. M,
NormFinder-evaluated average expression stability; Actβ, β-actin;
β2m, β2 microglobulin; Gusβ, β-glucuronidase; Tubα, α-tubulin;
Grcc10, Gene rich cluster, C10 gene; Eif4h, eukaryotic translation
initiation factor 4H; Rnf187, ring finger protein 187; Nedd8,
neural precursor cell expressed, developmentally down-regulated
gene 8; Ywhae, tyrosine 3-monooxygenase/tryptophan 5-monooxygenase
activation protein, epsilon polypeptide. |
A total of 3 genes were ranked with peak values by
NormFinder (Table II). In the lung
tissues, the 3 most stable genes were Nedd8, Ywhae, and Tubα; in
the heart tissue, Nedd8, Ywhae, and Grcc10; in the liver tissue,
Rnf187, Actβ, and Nedd8; and in the kidney tissue, Tubα, Ywhae, and
Rnf187. The least stable genes, as determined by NormFinder, were
the same as those identified using geNorm: In the liver tissue,
they were Grcc10 and GAPDH; in the heart tissue, they were Actβ and
β2m; and in the kidney tissue, they were Gusβ and β2m.
BestKeeper algorithm
In regard to the gene-correlation analysis of
candidate gene pairs, the expression standard of reference genes
was assessed using BestKeeper software, using the grading of the
standard deviation ± crossing point (SD ± CP). The genes with the
lowest SD values were considered the most stable by this algorithm,
and a grading of SD value <1 was considered an acceptable range
of variation (Fig. 6).
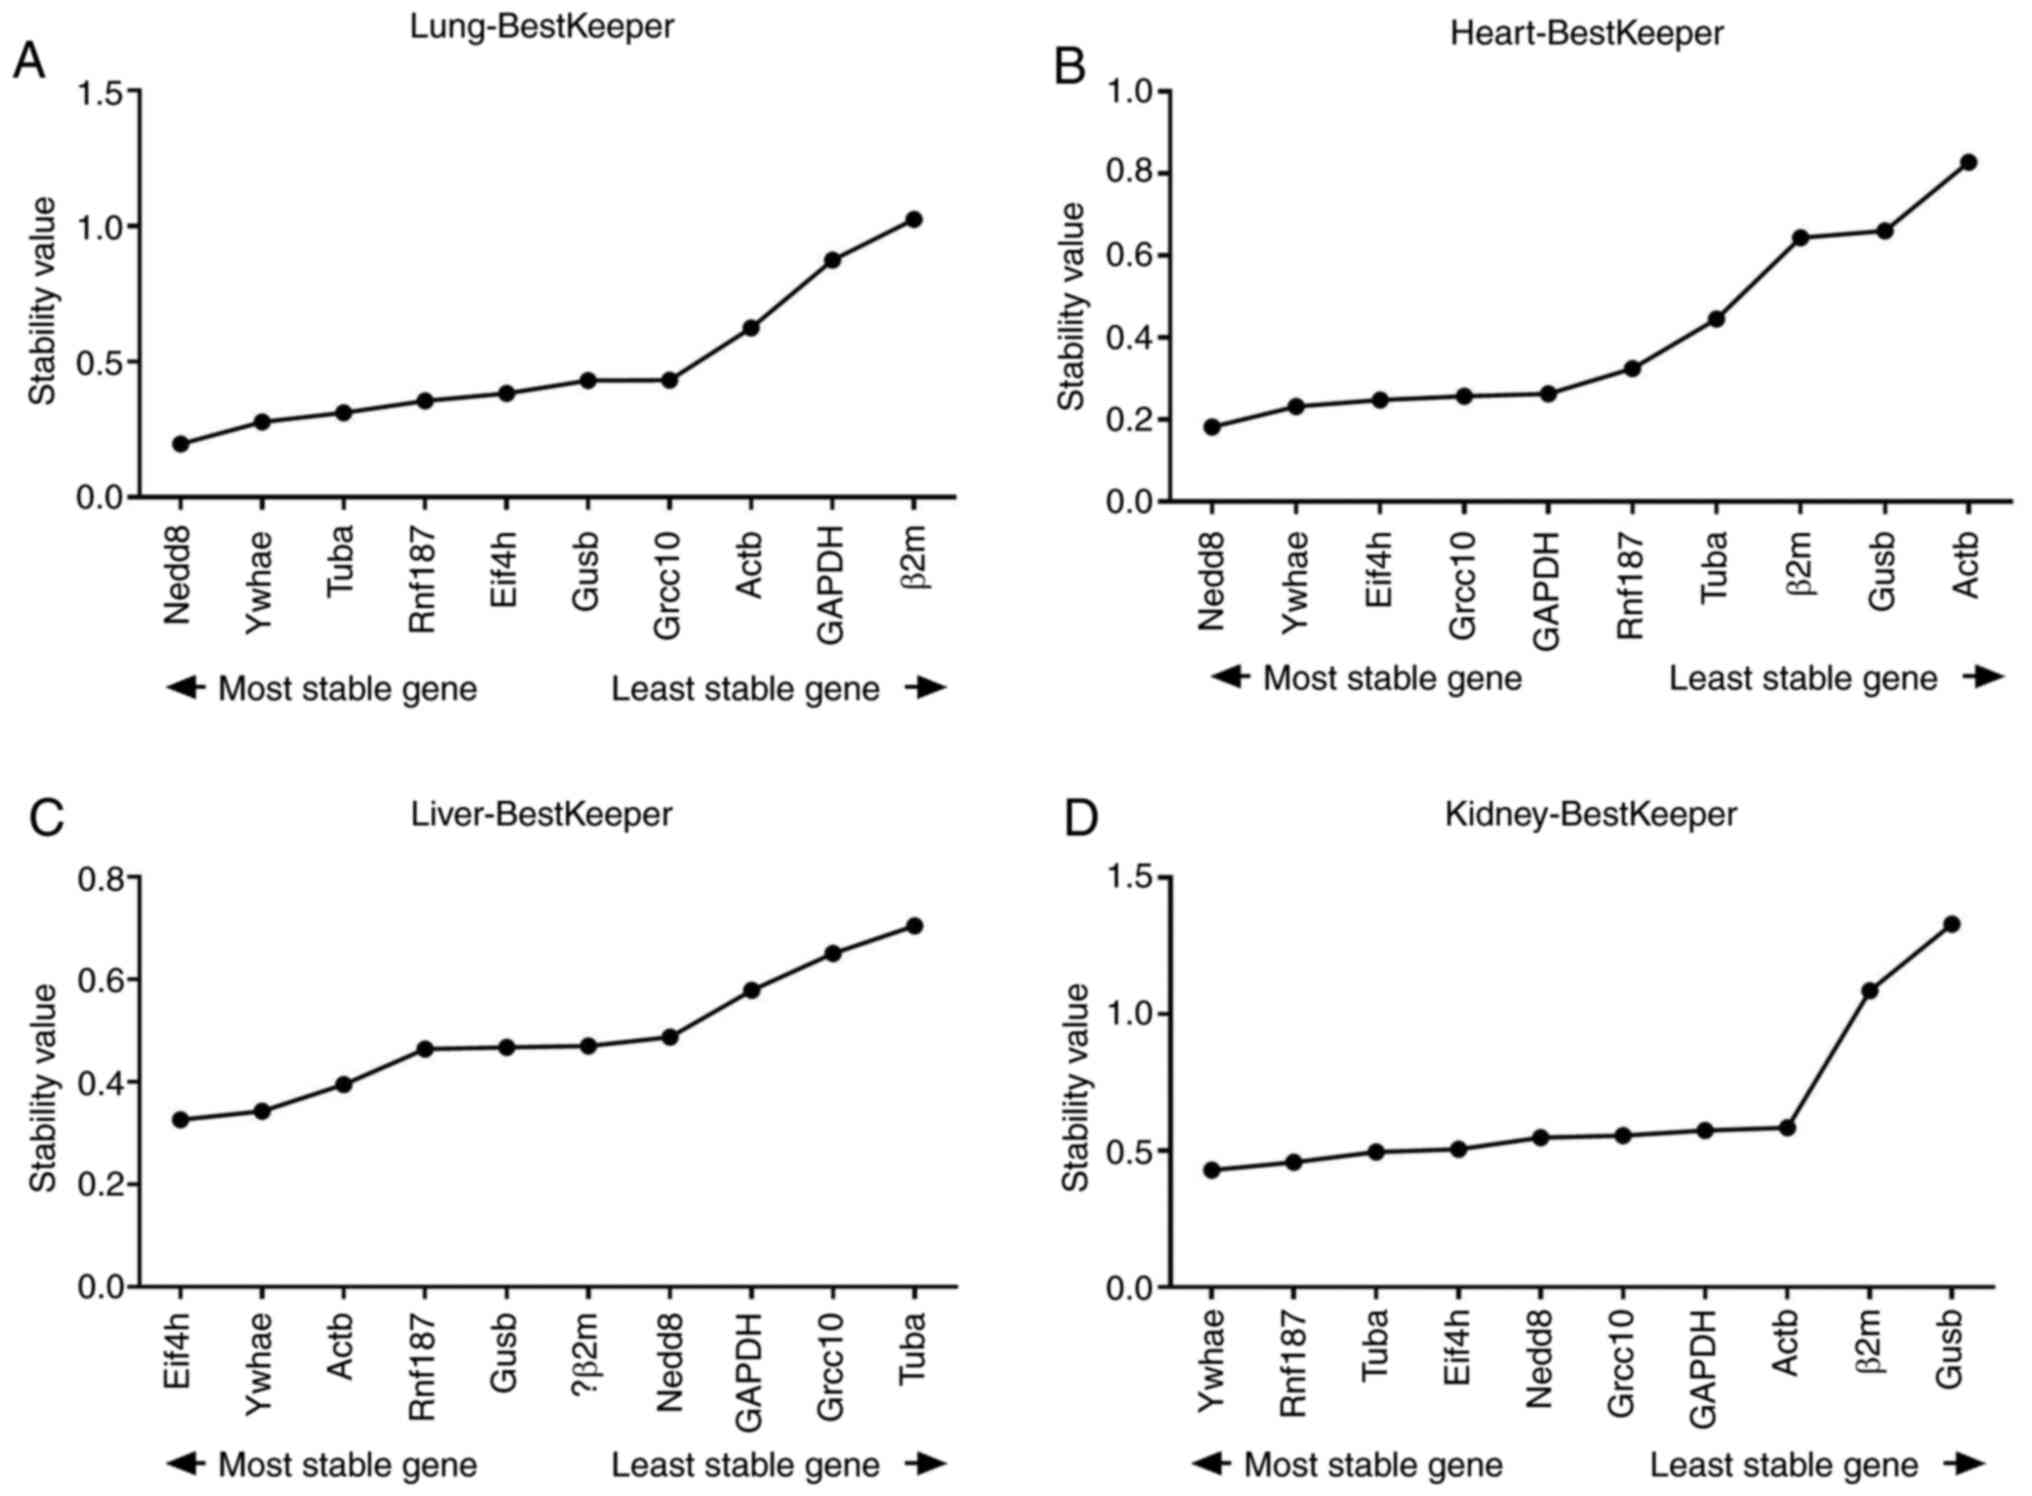 | Figure 6Average expression stability
evaluated using BestKeeper. SD values and grading are represented
for mice under variable settings. (A) Lung tissue, (B) heart
tissue, (C) liver tissue, and (D) kidney tissue. Stability was
calculated using the following formula: SD [± CP]. SD, standard
deviation; CP, crossing point; Actβ, β-actin; β2m, β2
microglobulin; Gusβ, β-glucuronidase; Tubα, α-tubulin; Grcc10, Gene
rich cluster, C10 gene; Eif4h, eukaryotic translation initiation
factor 4H; Rnf187, ring finger protein 187; Nedd8, neural precursor
cell expressed, developmentally down-regulated gene 8; Ywhae,
tyrosine 3-monooxygenase/tryptophan 5-monooxygenase activation
protein, epsilon polypeptide. |
As shown in Table
II, the genes considered most stable using the BestKeeper
algorithm were Nedd8 and Ywhae in the lung and heart tissue. Eif4h
exhibited the lowest SD values in the liver tissue samples, and
Ywhae and Rnf187 were the most stable in the kidney tissue.
Following the analysis of all samples, Ywhae had the lowest SD
values and was considered the most stable.
Analysis using the CFX Maestro
software
Bio-Rad CFX Maestro (v.1.1) software is based on the
geNorm algorithm (36), but
optimized for certain functions. The genes considered the most
stable exhibited higher [Ln(1/AvgM)] values, where values >1
were considered as acceptable (Fig.
7).
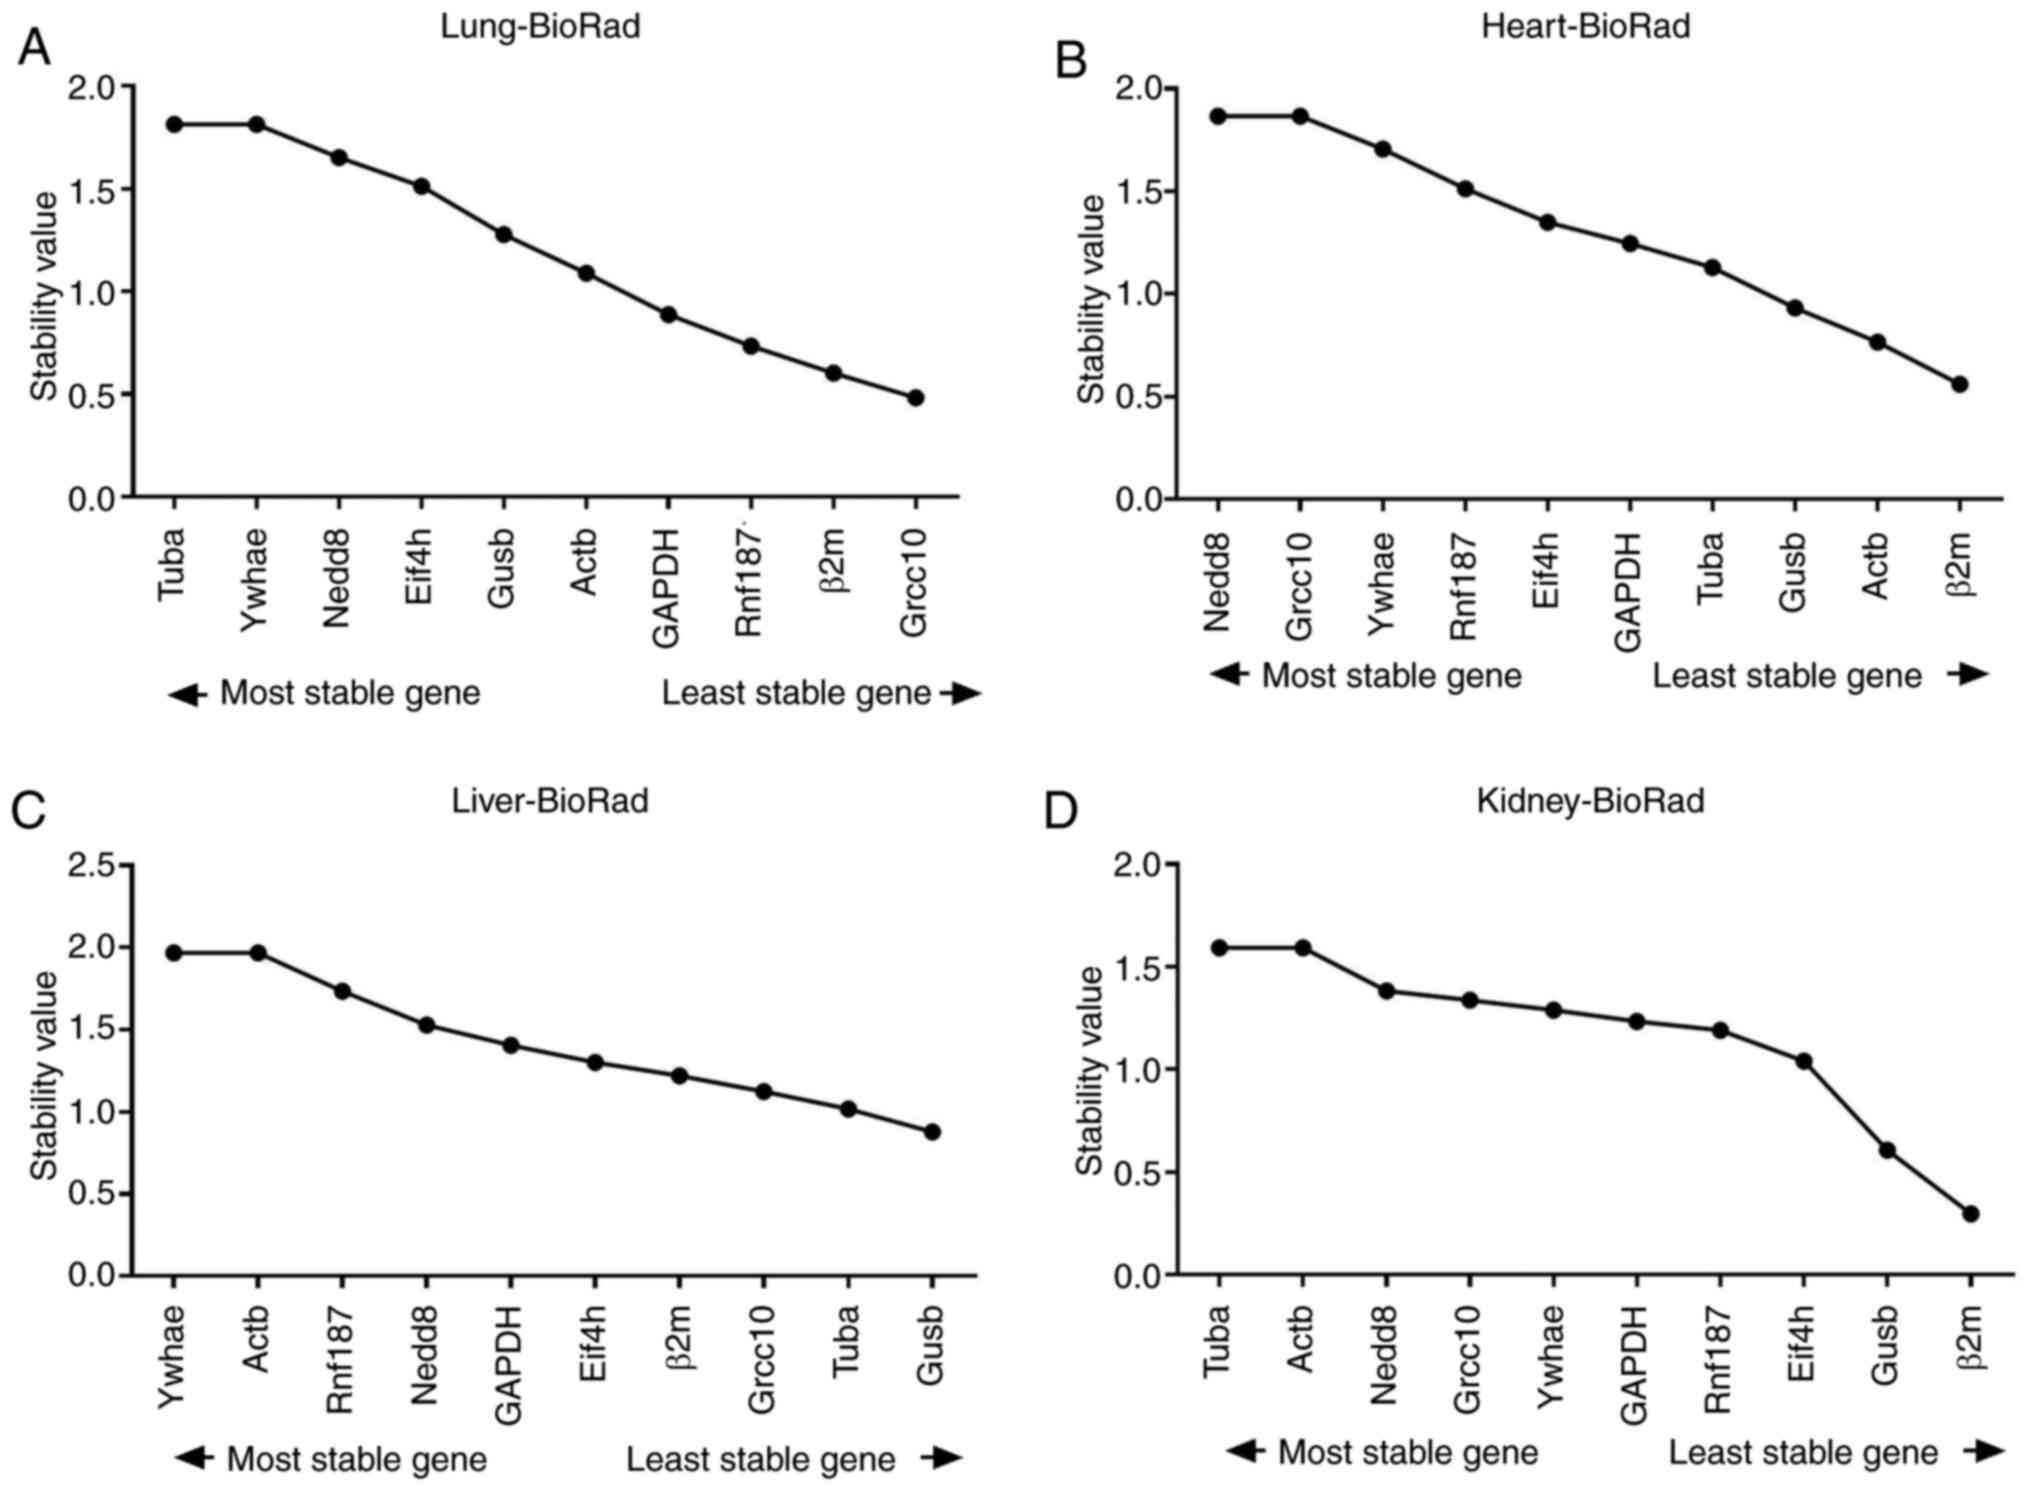 | Figure 7Average expression stability
evaluated using Bio-Rad CFX Maestro™ software. Stability
values and rankings are indicated for mice under different
conditions for (A) lung tissue, (B) heart tissue, (C) liver tissue
and (D) kidney tissue. Average expression stability was calculated
as follows: [Ln(1/AvgM)]. M, expression stability; Actβ, β-actin;
β2m, β2 microglobulin; Gusβ, β-glucuronidase; Tubα, α-tubulin;
Grcc10, Gene rich cluster, C10 gene; Eif4h, eukaryotic translation
initiation factor 4H; Rnf187, ring finger protein 187; Nedd8,
neural precursor cell expressed, developmentally down-regulated
gene 8; Ywhae, tyrosine 3-monooxygenase/tryptophan 5-monooxygenase
activation protein, epsilon polypeptide. |
The results of analysis from CFX Maestro software
are presented in Table II. Tubα
was considered the most stable reference gene in lung and kidney
tissues. Nedd8 and Grcc10 [Ln(1/AvgM)=1.8652] were considered the
most stable for heart tissue, and in the liver tissue, Ywhae and
Actβ [Ln(1/AvgM)=1.9668], were considered the most stable
genes.
Ranking order of the most stable
genes
In order to identify reference genes that would be
appropriate for various tissue types following KYDS-virus treatment
compared with the normal group, NormFinder, geNorm, BestKeeper, and
CFX Maestro software were used to determine the stability of each
gene. Due to the dependence on analytical procedures as well as
different algorithms, these statistical programs are considered
more acceptable to create distinct levels of reference genes
ranks.
In relation to their geoMean ranking positions,
genes were ranked from 1-10 (Table
III). Ywhae was positioned as peak stable gene across all four
tissues, followed by Nedd8 and Rnf187, with a low-ranking mean
value (1.74, 2.19 and 3.10, respectively). GAPDH and β2m were
considered the least stable according to all 4 algorithms, with a
higher ranking mean value (7.87 and 8.91, respectively).
| Table IIIExpression stability of the candidate
reference genes following treatment of the KYDS-virus mice ranked
based on the geoMean of the gene grade in every tissue. The
suitability of the candidate genes are ranked from top to
bottom. |
Table III
Expression stability of the candidate
reference genes following treatment of the KYDS-virus mice ranked
based on the geoMean of the gene grade in every tissue. The
suitability of the candidate genes are ranked from top to
bottom.
| Gene | Comprehensive
ranking by geoMean | Rank in lung | Rank in heart | Rank in liver | Rank in kidney |
|---|
| Ywhae | 1 | 2 | 2 | 2 | 2 |
| Nedd8 | 2 | 1 | 1 | 5 | 5 |
| Rnf187 | 3 | 6 | 4 | 1 | 4 |
| Tubα | 4 | 3 | 6 | 10 | 1 |
| Eif4h | 5 | 4 | 5 | 4 | 7 |
| Actβ | 6 | 7 | 9 | 3 | 3 |
| Grcc10 | 7 | 9 | 3 | 9 | 6 |
| Gusβ | 8 | 5 | 8 | 8 | 9 |
| GAPDH | 9 | 10 | 7 | 6 | 8 |
| β2m | 10 | 8 | 10 | 7 | 10 |
Validation of the selected reference
genes
For validation of the consistency of selected
reference genes, the expression of these genes was determined in
the KYDS-virus samples. The analysis of comparative expression
levels of the target genes was performed for validation of
reference genes selection. The expression levels of TLR3, TLR7, and
cytosolic RIG-I, which serve important roles in the innate immune
response of the host, were examined. They all belong to host
pattern recognition receptors and recognize pathogen-associated
molecular patterns during viral infection (37,38).
Recognition of a pathogen-associated molecular pattern enhances the
transcription factor for interferon regulation and stimulates
NF-κB, which in turn is responsible for the secretion of
inflammatory mediators, such as cytokines and chemokines.
Therefore, the expression levels of TLR3, TLR7, and RIG-I in the 4
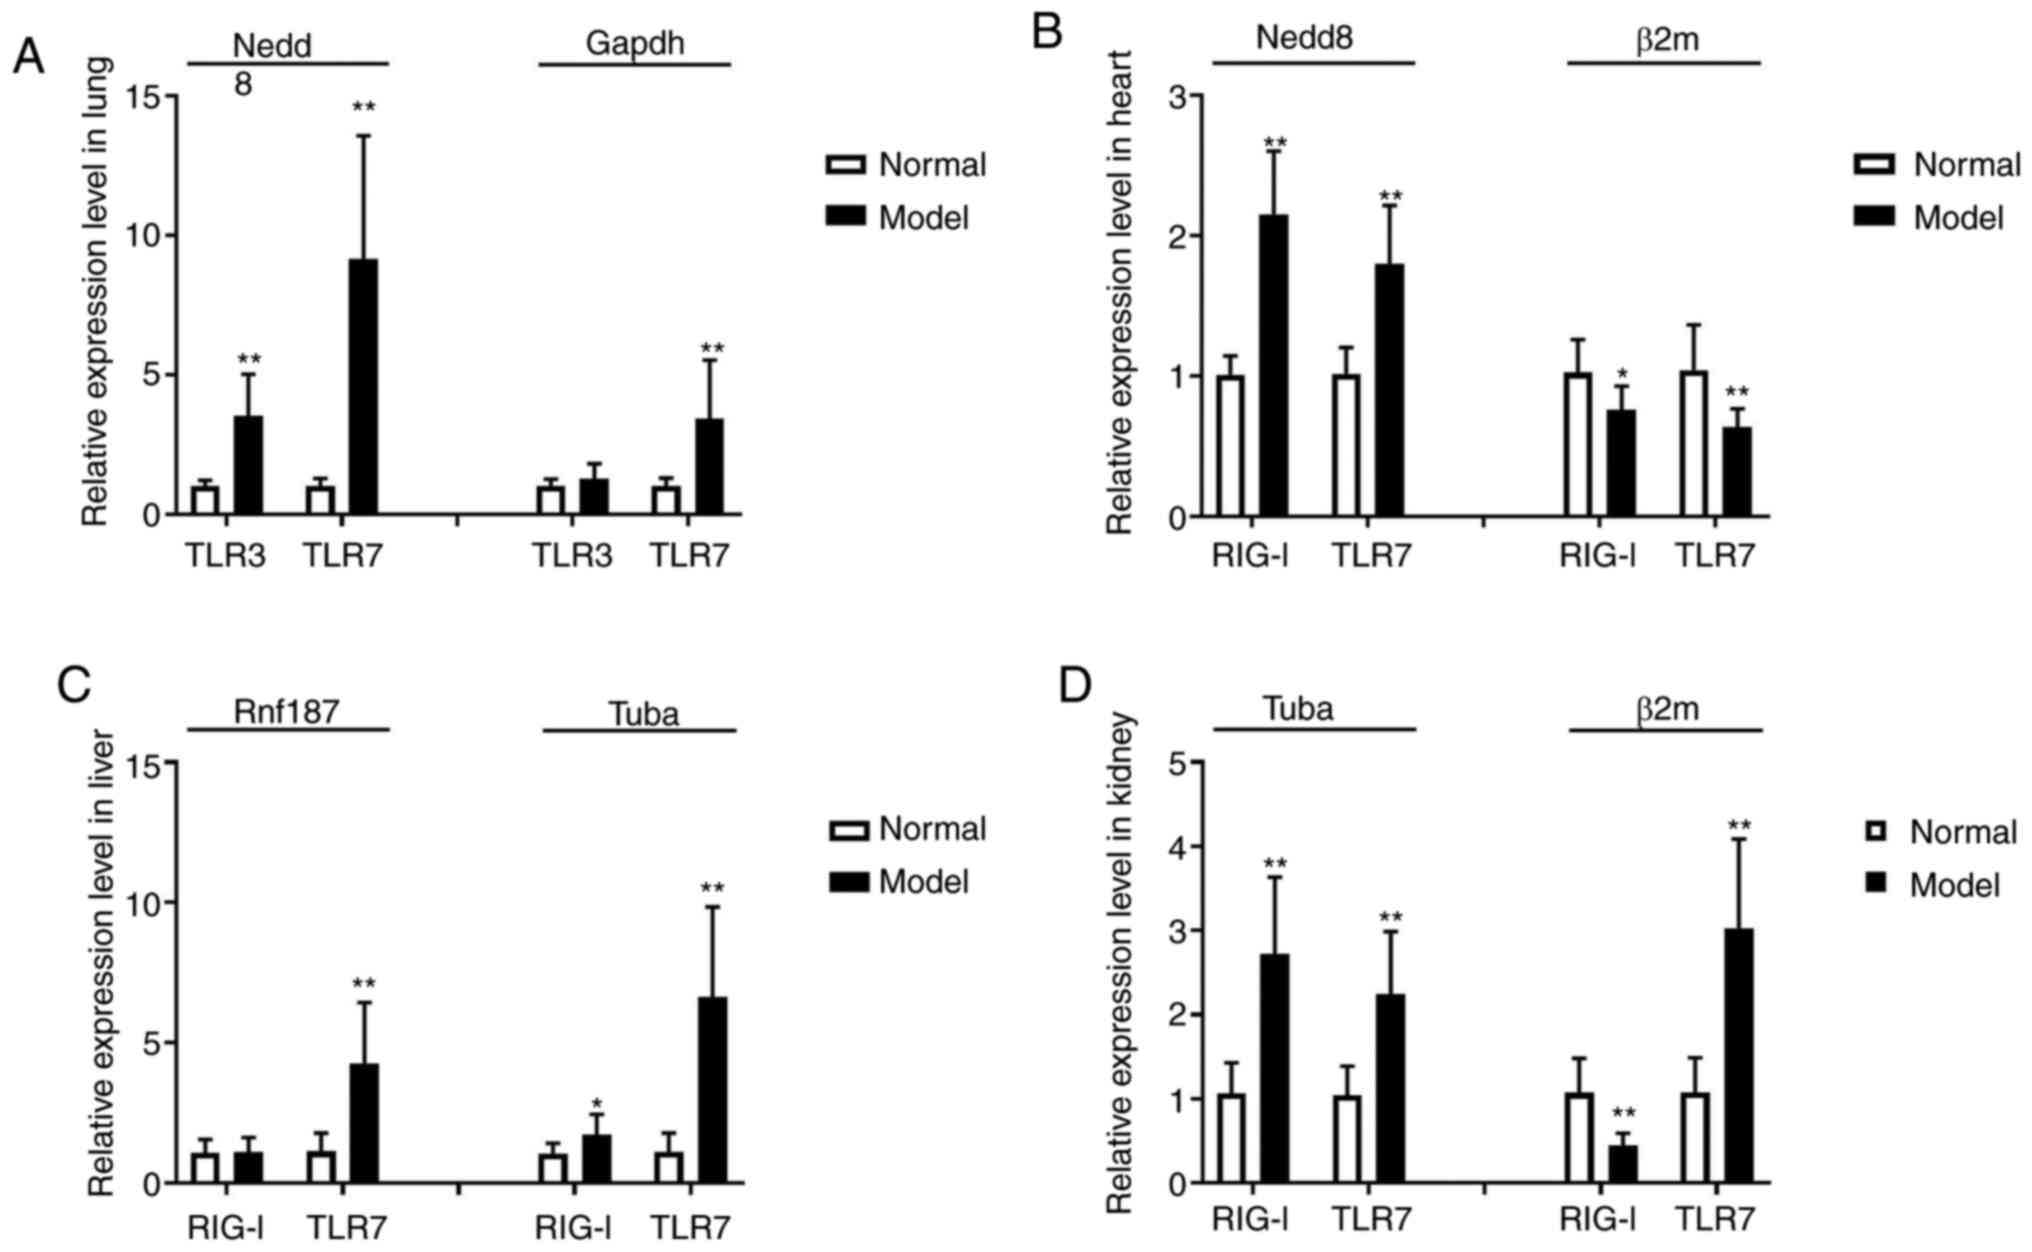
types of tissues were assessed (Fig.
8). Using Nedd8 expression levels in the lung and heart, Rnf187
expression levels in the liver and Tubα expression levels in the
kidney as reference genes, there was a significant increase in TLR3
and TLR7 expression (P<0.01) in the lungs, an increase of TLR7
expression in liver, and increased RIG-I and TLR7 expression in
heart and kidney (P<0.01) following infection (Fig. 8A). This data confirms that the
selected reference genes are reliable in each of the tissues.
Alternatively, the references genes considered to be the least
stable were: GAPDH for the lung samples; β2m in the heart and
kidney; and Tubα in the liver (Fig.
8B). Using these reference genes, no marked changes in TLR3
expression were observed in the lung tissue, RIG-I and TLR7
expression was considered decreased in the heart tissue samples
(P<0.05 or P<0.01; Fig. 8B),
and RIG-I either exhibited a reverse in the direction of expression
in kidney tissue (Fig. 8D;
P<0.01), or was not altered significantly in liver tissue
(Fig. 8D; P<0.05). For this
experiment in qPCR analysis, the appropriate reference gene was
shown to be paramount to obtain reliable results when studying the
expression of genes in the assessment of KYDS-virus treatment.
Discussion
In molecular biology, gene expression analysis is
one of the most frequently used strategies to study expression of
genes. Its accuracy and versatility make qPCR suitable for analysis
of relative gene expression. However, the results obtained from
qPCR are strongly affected by the stability of the reference gene
selected for normalization of gene expression data; therefore, it
is crucial to select stably expressed genes as internal
references.
In the present study, a screen for suitable genes
for data normalization in a KYDS-virus model was performed in lung,
heart, liver, and kidney tissues. The expression stability of 10
housekeeping genes (Actβ, β2m, GAPDH, Gusβ, Tubα, Grcc10, Eif4h,
Rnf187, Nedd8 and Ywhae) were analyzed using 4 software packages:
geNorm; NormFinder; BestKeeper; and CFX Maestro software. The 4
statistical algorithms have been used to select and validate
reference genes for qPCR data normalization across a variety of
tissues, species and different treatments (39-41).
Grcc10, Eif4h, Rnf187, Nedd8 and Ywhae are all considered
consistently and highly expressed genes that can be used as
reference controls in expression-profiling analysis when using
RNA-seq in various tissues, including lung tissue of mice (28,42).
Tubα has been identified in almost all organisms (43,44);
it polymerizes into microtubules, a major component of the
eukaryotic cytoskeleton (45). β2m
is a component of the MHC class I molecule (46); it is necessary for cell surface
expression of MHC class I and stability of the peptide binding
groove. β-glucuronidase (Gusβ) is a member of the glycosidase
family and is involved in the breakdown of glycosaminoglycan
(47). Actβ is a actin cytoskeleton
protein, and is crucial for maintaining cell morphology. GAPDH is
associated with the metabolism of carbohydrates (48), but is also important in several
other processes. The present study evaluated 10 frequently used
reference genes, which are involved in basic biochemical metabolic
processes in the majority of cells. However, in most studies GAPDH
and Actβ show variability under different experimental conditions
in various types of cells and tissues (49). This is particularly true with
infection with the influenza virus, which inhibits cellular
synthesis of macromolecular compounds (shut-off) and results in
whole body changes to gene expression (29,50),
and affects the mRNA expression levels of several other genes. Our
previous study showed that traditional reference genes, for example
GAPDH or Actβ, are not stable in lung tissues of a mouse model of
KYDS following infection with influenza A virus compared with
normal control mice. It also has been reported that the expression
levels of the Actβ and GAPDH as housekeeping genes are
significantly affected by influenza virus infection, and therefore
are not suitable as reference genes for normalization (51). Different statistical algorithms
generate varied results for stability ranking in different tissues,
and this was observed in the present study where, in KYDS mice
tissues, the 3 statistical algorithms geNorm, CFX Maestro, and
NormFinder recommended the most stable reference gene as Tubα.
However, Ywhae was considered the most stable gene by BestKeeper.
Different statistical algorithms have different bases for ranking
the stability of reference genes, and this underlies the
variability between the results. geNorm analysis depends on the
similarity in the ratio of expression between the 2 best internal
control genes amongst all genes selected for analysis. By contrast,
in NormFinder, both inter- and intra-group variation is combined in
for calculation of a stability value. The expression standard of
reference genes was ranked by BestKeeper software with the grading
of the standard deviation [±CP] of Cq values. This variability in
the results represents the difference in the manner in which the
programs determine stability. The use of multiple techniques
improves the accuracy of stability of reference genes and
integration of data to produce an absolute ranking, thereby
improving the reliability of the results. Therefore, it is
suggested to use algorithms together, rather than relying on a
single one.
The present study showed that different reference
genes are recommended for different conditions, such as different
tissues and different treatment groups. Therefore, it is concluded
that the ideal reference gene for specific conditions varies. As
the suitability of reference genes varies, it is important to
verify the suitability of the reference gene for normalization, and
determine the degree of variability in expression, as this
variability may underlie differences in expression. Alterations of
TLR7, TLR3, and RIG-I were observed using the assessed reference
genes in the KYDS-virus mouse model in our previous study, and the
observed differences in expression of these genes may in fact be
the result of variations in the expression of the reference genes.
However, using a range of reference genes may result in
false-negative results. In the present study, this phenomenon was
observed when the data was normalized with a single reference gene.
In different tissues, or treatment groups, the target genes
expression appeared to be significantly different, which may affect
the results. The data of the present study indicated that it is
essential to determine and use validated reference genes to ensure
stability of their expression for normalizing qPCR data. KYDS is a
type of syndrome model used in order to mimic the high-risk,
susceptible population in flu season. Following viral infection,
mice in the KYDS-virus group demonstrated symptoms of infection,
with some reaching critical condition. It was identified that the
body weight and rectal temperature values in the KYDS-virus model
group decreased significantly (P<0.01). In the KYDS-virus group,
certain mice experienced serious symptoms, with some mice
succumbing after 7 days. The changes in KYDS condition in
individual mice were minor during the short study period.
Therefore, the changes in KYDS following viral infection in each
mouse were not measured. In the present study, only normal and
KYDS-virus groups were used; the lack of ‘KYDS only’ and ‘virus
only’ groups represent a limitation of the study design. In future
studies, comparison among more groups may produce more reliable
reference results.
In conclusion, the present study was designed
evaluate the effects of KYDS-virus in lung, heart, liver, and
kidney tissues on the expression of several candidate reference
genes used for normalization of gene expression when using qPCR in
BALB/c mice. The significance of using multiple software packages
to obtain more reliable results was observed by using 4 algorithms,
which yielded different results on the suitability of each gene in
each tissue.
For individual tissues, there should be specifically
selected reference genes, which should be determined following
examination of the stability of several reference genes. Based on
the results of the present study, the most suitable reference genes
for each tissue assessed were Nedd8 in the lung and heart, Rnf187
in the liver, and Tubα in the kidney. Across all 4 tissues types,
Ywhae and Nedd8 were identified to be the top 2 stable genes for
KYDS mice infected with A/H1N1. By contrast, the least stable genes
in all 4 tissues were GAPDH and β2m. The validation of the selected
reference genes was shown using 3 target genes (TLR3, TLR7 and
RIG-I) for certain experimental conditions. The present study
highlights the importance of using a suitable reference gene to
obtain reliable results when assessing gene expression. The present
study provides a direction for designing future studies where gene
expression is assessed, particularly for studies of KYDS combined
with A/H1N1 infection.
Supplementary Material
Figure S1. The assessment of KYDS
mouse model. (A) Whole body weight and (B) rectal temperature were
measured for 7 days, to monitor establishment of the KYDS mouse
model. (C) Spontaneous activity and (D) swimming time were
calculated in the model and normal groups. *P<0.05
and *P<0.01vs. normal control. n=10 in each
group.
Figure S2. The assessment of KYDS mice
model with serum hormones. Serum (A) estradiol, (B) progesterone,
(C) T3, and (D) T4 levels were measured by xMAP® technology in a
flow cytometry-based Luminex 200 instrument. *P<0.05 and
***P<0.001 vs. normal control. n=8‑10 in each group. KYDS,
Kidney‑yang deficiency syndrome.
Acknowledgements
Not applicable.
Funding
This work was financially supported, in part, by
grants from the National Natural Science Foundation of China (grant
nos. 81873220 and 81774167), and Key Research and Development
Program in Shandong Province (grant no. 2018CXGC1307).
Availability of data and material
The datasets used and/or analyzed during the present
study are available from the corresponding author on reasonable
request.
Authors' contributions
YY designed the study, performed the experiments and
data analysis, and wrote the manuscript. YF and JY designed the
study, performed the animal experiments and the data analysis. SF,
SZ, RD and RR participated in performing the experiments and data
analysis. SMAS and MA analyzed the target gene expressions and
critically revised the manuscript for important intellectual
content. All authors read and approved the final manuscript.
Ethics approval and consent to
participate
All experimental procedures were performed in strict
accordance with the guidelines for the care and use of laboratory
animals of Shandong University of Traditional Chinese Medicine and
were approved by the Ethics Committee of Laboratory Animals of
Shandong University of Traditional Chinese Medicine (approval no.
SDUTCM2018091901).
Patient consent for publication
Not applicable.
Competing interests
The authors declare that they have no competing
interests.
References
|
1
|
Leong DT, Gupta A, Bai HF, Wan G, Yoong
LF, Too HP, Chew FT and Hutmacher DW: Absolute quantification of
gene expression in biomaterials research using real-time PCR.
Biomaterials. 28:203–210. 2007.PubMed/NCBI View Article : Google Scholar
|
|
2
|
Pfaffl MW: A new mathematical model for
relative quantification in real-time RT-PCR. Nucleic Acids Res.
29(e45)2001.PubMed/NCBI View Article : Google Scholar
|
|
3
|
Livak KJ and Schmittgen TD: Analysis of
relative gene expression data using real-time quantitative PCR and
the 2(-Delta Delta C(T)) method. Methods. 25:402–408.
2001.PubMed/NCBI View Article : Google Scholar
|
|
4
|
Bustin SA, Benes V, Garson JA, Hellemans
J, Huggett J, Kubista M, Mueller R, Nolan T, Pfaffl MW, Shipley GL,
et al: The MIQE guidelines: Minimum information for publication of
quantitative real-time PCR experiments. Clin Chem. 55:611–622.
2009.PubMed/NCBI View Article : Google Scholar
|
|
5
|
Udvardi MK, Czechowski T and Scheible WR:
Eleven golden rules of quantitative RT-PCR. Plant Cell.
20:1736–1737. 2008.PubMed/NCBI View Article : Google Scholar
|
|
6
|
Havelda Z, Várallyay É, Válóczi A and
Burgyán J: Plant virus infection-induced persistent host gene
downregulation in systemically infected leaves. Plant J.
55:278–288. 2008.PubMed/NCBI View Article : Google Scholar
|
|
7
|
Taylor S, Wakem M, Dijkman G, Alsarraj M
and Nguyen M: A practical approach to RT-qPCR-publishing data that
conform to the MIQE guidelines. Methods. 50:S1–S5. 2010.PubMed/NCBI View Article : Google Scholar
|
|
8
|
Cox NJ and Subbarao K: Global epidemiology
of influenza: Past and present. Annu Rev Med. 51:407–421.
2000.PubMed/NCBI View Article : Google Scholar
|
|
9
|
Whitley RJ and Monto AS: Prevention and
treatment of influenza in high-risk groups: Children, pregnant
women, immunocompromised hosts, and nursing home residents. J
Infect Dis. 194 (Suppl 2):S133–S138. 2006.PubMed/NCBI View
Article : Google Scholar
|
|
10
|
Zelaya H, Alvarez S, Kitazawa H and
Villena J: Respiratory antiviral immunity and immunobiotics:
Beneficial effects on inflammation-coagulation interaction during
influenza virus infection. Front Immunol. 7(633)2016.PubMed/NCBI View Article : Google Scholar
|
|
11
|
Chen Q: Experimental methodology of
pharmacological research in traditional Chinese medicine. People's
Health Publishing House, Beijing, 1993.
|
|
12
|
Huai-Chang F, Wei-hong L and Shi-hong Y:
Study on the diagnosis of kidney-‘Yang’ deficiency by 2067 cases of
epidemiological survery. LIshizhen Med Mater Med Res. 21:952–954.
2010.
|
|
13
|
Lu JB, Zhou RQ, Liu RR and Xue RH:
Investigation and analysis of kidney deficiency and patterns in the
elderly. J Shanghai Univ Tradit Chin Med. 16:22–23. 2002.
|
|
14
|
Yin Z, Yue L, Li X, Chen Y, Ye H, Li X,
Lin Z, Wang Z, Huang W and Ding X: Age-related changes in
prevalence and symptom characteristics in kidney deficiency
syndrome with varied health status: A cross-sectional observational
study. J Tradit Chin Med Sci. 1:20–27. 2014.
|
|
15
|
Tang ZH, Chen HB, Li WH, Su LX, Chen W,
Qiong Z and Jan SL: Comparative study of epidemiological
investigation and expert-evaluation system of kidney-yang
insufficiency syndrome with old-aging. Liaoning J Tradit Chin Med.
38:611–613. 2011.
|
|
16
|
Gong Y, Liu L, He X, Zhao H, Yang J, Li L,
Lu A, Lin Y and Jiang M: The th17/treg immune balance in ulcerative
colitis patients with two different chinese syndromes:
Dampness-heat in large intestine and spleen and kidney yang
deficiency syndrome. Evid Based Complement Alternat Med.
2015(264317)2015.PubMed/NCBI View Article : Google Scholar
|
|
17
|
Ding WJ, Yan SL, Zeng YZ, Li WH, Duan A,
Zheng TE, Liu M, Tan CE Teng X and Wan J: Insufficient activity of
MAPK pathway is a key monitor of kidney-yang deficiency syndrome. J
Altern Complement Med. 15:653–660. 2009.PubMed/NCBI View Article : Google Scholar
|
|
18
|
Yang J, Wang Y, Bao Y and Guo J: The total
flavones from Semen cuscutae reverse the reduction of testosterone
level and the expression of androgen receptor gene in kidney-yang
deficient mice. J Ethnopharmacol. 119:166–171. 2008.PubMed/NCBI View Article : Google Scholar
|
|
19
|
Julkunen I, Sareneva T, Pirhonen J, Ronni
T, Melén K and Matikainen S: Molecular pathogenesis of influenza A
virus infection and virus-induced regulation of cytokine gene
expression. Cytokine Growth Factor Rev. 12:171–180. 2001.PubMed/NCBI View Article : Google Scholar
|
|
20
|
Zaas AK, Chen M, Varkey J, Veldman T, Hero
AO III, Lucas J, Huang Y, Turner R, Gilbert A, Lambkin-Williams R,
et al: Gene expression signatures diagnose influenza and other
symptomatic respiratory viral infections in humans. Cell Host
Microbe. 6:207–217. 2009.PubMed/NCBI View Article : Google Scholar
|
|
21
|
Wareing MD, Lyon AB, Lu B, Gerard C and
Sarawar SR: Chemokine expression during the development and
resolution of a pulmonary leukocyte response to influenza A virus
infection in mice. J Leukoc Biol. 76:886–895. 2004.PubMed/NCBI View Article : Google Scholar
|
|
22
|
Tang N, Liu L, Qiu H, Shi W and Mao D:
Analysis of gene expression and functional changes of adrenal gland
in a rat model of kidney yang deficiency syndrome treated with Sini
decoction. Exp Ther Med. 16:3107–3115. 2018.PubMed/NCBI View Article : Google Scholar
|
|
23
|
Wang ZX, Shao YY, Ming L, Yi L and Ji R:
Influence of bokhi on kidney-yang-deficiency syndrome in rats. J
Camel Pract Res. 24:281–290. 2017.
|
|
24
|
Zhao S, Yuan L, Li Y, Liu L, Luo Z, Lv Q,
Rong R and Yang Y: Secretory IgA in mucosa of pharynx and larynx
plays an important role against influenza A virus infection in
kidney yang deficiency syndrome model. Evid Based Complement
Alternat Med. 2020(9316763)2020.PubMed/NCBI View Article : Google Scholar
|
|
25
|
Leong PK, Wong HS, Chen J and Ko KM:
Yang/Qi invigoration: An herbal therapy for chronic fatigue
syndrome with yang deficiency? Evid Based Complement Alternat Med.
2015(945901)2015.PubMed/NCBI View Article : Google Scholar
|
|
26
|
Wang CM, Xu SY, Lai S, Geng D, Huang JM
and Huo XY: Curculigo orchioides (Xian Mao) modifies the activity
and protein expression of CYP3A in normal and kidney-yang
deficiency model rats. J Ethnopharmacol. 144:33–38. 2012.PubMed/NCBI View Article : Google Scholar
|
|
27
|
Xin C, Xia Z, Jiang C, Lin M and Li G:
Xiaokeping mixture inhibits diabetic nephropathy in
streptozotocin-induced rats through blocking TGF-β1/Smad7
signaling. Drug Des Devel Ther. 9:6269–6274. 2015.PubMed/NCBI View Article : Google Scholar
|
|
28
|
Li B, Qing T, Zhu J, Wen Z, Yu Y, Fukumura
R, Zheng Y, Gondo Y and Shi L: A comprehensive mouse transcriptomic
BodyMap across 17 tissues by RNA-seq. Sci Rep.
7(4200)2017.PubMed/NCBI View Article : Google Scholar
|
|
29
|
Reemers SS, van Haarlem DA, Groot Koerkamp
MJ and Vervelde L: Differential gene-expression and host-response
profiles against avian influenza virus within the chicken lung due
to anatomy and airflow. J Gen Virol. 90:2134–2146. 2009.PubMed/NCBI View Article : Google Scholar
|
|
30
|
Yin CC, Yang Y, Li J, Li RR, Rong R and
Meng H: Establishment and evaluation of mice model with kidney yang
deficiency infected by influenza virus. Chin J Exp Tradit Med
Formulae. 19:253–256. 2013.
|
|
31
|
Chen SH, LU GY, Fan J, Yan MQ, Ye H, Fang
Z, Tang XH and Wu HF: Effects of different extracts from
Hippocampus Japonicus on kidney-yang deficiency mice induced by
extradiol. Chin Tradit Herbal Drugs. 258–262. 2009.
|
|
32
|
Wang ZJ, Sun L, Peng W, Ma S, Zhu C, Fu F
and Heinbockel T: Ginseng derivative ocotillol enhances neuronal
activity through increased glutamate release: A possible mechanism
underlying increased spontaneous locomotor activity of mice.
Neuroscience. 195:1–8. 2011.PubMed/NCBI View Article : Google Scholar
|
|
33
|
Can A, Dao DT, Arad M, Terrillion CE,
Piantadosi SC and Gould TD: The mouse forced swim test. J Vis Exp.
29(e3638)2011.PubMed/NCBI View
Article : Google Scholar
|
|
34
|
Chen SH, Lv GY, Fan J, Yan MQ, Shan LT,
Fang Z, Li HH, Su J and Li W: Therapeutic effect of petroleum ether
extract from Semen cuscutae against β-estradiol 3-benzoate induced
kidney-yang deficiency in mice. Afr J Pharm Pharmacol. 5:700–705.
2011.
|
|
35
|
Edouard MJ, Miao L, Fan GW, Ojong BB, Zhen
H, Zhang J, Gao XM and Zhu Y: Yang-tonifying traditional Chinese
medicinal plants and their potential phytoandrogenic activity. Chin
J Nat Med. 12:321–334. 2014.PubMed/NCBI View Article : Google Scholar
|
|
36
|
Hellemans J, Mortier G, De Paepe A,
Speleman F and Vandesompele J: qBase relative quantification
framework and software for management and automated analysis of
real-time quantitative PCR data. Genome Biol. 8(R19)2007.PubMed/NCBI View Article : Google Scholar
|
|
37
|
Kugelberg E: Pattern recognition
receptors: Curbing gut inflammation. Nat Rev Immunol.
14(583)2014.PubMed/NCBI View Article : Google Scholar
|
|
38
|
Akira S, Uematsu S and Takeuchi O:
Pathogen recognition and innate immunity. Cell. 124:783–801.
2006.PubMed/NCBI View Article : Google Scholar
|
|
39
|
Xiang Q, Li J, Qin P, He M, Yu X, Zhao K,
Zhang X, Ma M, Chen Q, Chen X, et al: Identification and evaluation
of reference genes for qRT-PCR studies in Lentinula edodes. PLoS
One. 13(e0190226)2018.PubMed/NCBI View Article : Google Scholar
|
|
40
|
Lacerda AL, Fonseca LN, Blawid R, Boiteux
LS, Ribeiro SG and Brasileiro AC: Reference gene selection for qPCR
analysis in tomato-bipartite begomovirus interaction and validation
in additional tomato-virus pathosystems. PLoS One.
10(e0136820)2015.PubMed/NCBI View Article : Google Scholar
|
|
41
|
Gong H, Sun L, Chen B, Han Y, Pang J, Wu
W, Qi R and Zhang TM: Evaluation of candidate reference genes for
RT-qPCR studies in three metabolism related tissues of mice after
caloric restriction. Sci Rep. 6(38513)2016.PubMed/NCBI View Article : Google Scholar
|
|
42
|
Zeng J, Liu S, Zhao Y, Tan X, Aljohi HA,
Liu W and Hu S: Identification and analysis of house-keeping and
tissue-specific genes based on RNA-seq data sets across 15 mouse
tissues. Gene. 576:560–570. 2016.PubMed/NCBI View Article : Google Scholar
|
|
43
|
Luduena RF: Multiple forms of tubul in:
Different gene products and covalent modifications. Int Rev Cytol.
178:207–275. 1998.PubMed/NCBI View Article : Google Scholar
|
|
44
|
Sullivan KF and Cleveland DW:
Identification of conserved isotype-defining variable region
sequences for four vertebrate beta tubulin polypeptide classes.
Proc Natl Acad Sci USA. 83:4327–4331. 1986.PubMed/NCBI View Article : Google Scholar
|
|
45
|
Gunning PW, Ghoshdastider U, Whitaker S,
Popp D and Robinson RC: The evolution of compositionally and
functionally distinct actin filaments. J Cell Sci. 128:2009–2019.
2015.PubMed/NCBI View Article : Google Scholar
|
|
46
|
Güssow D, Rein R, Ginjaar I, Hochstenbach
F, Seemann G, Kottman A and Ploegh HL: The human beta
2-microglobulin gene. Primary structure and definition of the
transcriptional unit. J Immunol. 139:3132–3138. 1987.PubMed/NCBI
|
|
47
|
Shipley JM, Grubb JH and Sly WS: The role
of glycosylation and phosphorylation in the expression of active
human beta-glucuronidase. J Biol Chem. 268:12193–12198.
1993.PubMed/NCBI
|
|
48
|
Sirover MA: Role of the glycolytic
protein, glyceraldehyde-3-phosphate dehydrogenase, in normal cell
function and in cell pathology. J Cell Biochem. 66:133–140.
1997.PubMed/NCBI
|
|
49
|
Suzuki T, Higgins PJ and Crawford DR:
Control selection for RNA quantitation. Biotechniques. 29:332–337.
2000.PubMed/NCBI View Article : Google Scholar
|
|
50
|
Kawada J, Kimura H, Kamachi Y, Nishikawa
K, Taniguchi M, Nagaoka K, Kurahashi H, Kojima S and Morishima T:
Analysis of gene-expression profiles by oligonucleotide microarray
in children with influenza. J Gen Virol. 87:1677–1683.
2006.PubMed/NCBI View Article : Google Scholar
|
|
51
|
Kuchipudi SV, Tellabati M, Nelli RK, White
GA, Perez BB, Sebastian S, Slomka MJ, Brookes SM, Brown IH, Dunham
SP and Chang KC: 18S rRNA is a reliable normalisation gene for real
time PCR based on influenza virus infected cells. Virol J.
9(230)2012.PubMed/NCBI View Article : Google Scholar
|