Introduction
Obstructive sleep apnea/hypopnea syndrome (OSAHS) is
the most common type of sleep respiratory disorder and is
characterized by repetitive, complete or partial collapse of the
pharyngeal airway during sleep, which leads to a reduction in
oxygen desaturation and poor sleep quality (1). With an estimated prevalence of 4% in
males and 2% in females, various risk factors have been implicated,
including obesity, age, male sex and a thick neck diameter
(1).
A number of sleeping disorders, including OSAHS, are
associated with ocular conditions, such as floppy eyelid syndrome,
keratoconus, retinal vascular congestion and bleeding,
non-arteritic anterior ischemic optic neuropathy and glaucomatous
optic neuropathy (GON), and have been implicated in the impaired
autoregulation of optic nerve head perfusion as a direct effect of
hypoxia (2-5).
GON is a group of disorders characterized by
progressive optic neuropathy and the degeneration of retinal
ganglion cells, resulting in characteristic alteration (cupping) of
the optic nerve head, as well as a pattern of visual field loss
(6). The prevalence of glaucoma in
the general population is 1-2% (7).
Damage to the optic nerve may occur directly by the effect of
elevated intraocular pressure (IOP) or due to impaired perfusion,
and factors implicated in these processes include diabetes,
obesity, cardiovascular disease, systemic hypertension or
hypotension, vasospasms, autoregulatory defects and
atherosclerosis, particularly in patients with normal IOP (8,9).
A possible association between OSAHS and GON has
been the subject of various studies, which have proposed OSAHS as a
risk factor for developing glaucoma and have reported an increased
prevalence of OSAHS (ranging from 5.9-27%) among patients with
glaucoma and vice versa (2,3,10-14).
Therefore, the present study aimed to investigate this possible
association and its underlying mechanisms.
Patients and methods
Patients
A total of 45 patients with newly diagnosed severe
OSAHS, as determined by the Apnea Hypopnea Index (AHI) (1), were selected and 38 controls were
matched with OSAHS cases for sex, age and body mass index. All
subjects were prospectively, consecutively recruited from the Sleep
Apnea Department of Konstantopouleio-Patission Hospital (Athens,
Greece) between September 2016 and December 2017. A total of 58
male and 25 female patients aged 48-80 years were recruited.
Inclusion and exclusion criteria
Patients with a history of ocular surgery (including
laser treatments), ocular trauma, anterior or posterior segment
disease, chronic steroid use, alcohol abuse, bronchial asthma,
interstitial lung diseases, cerebrovascular disease, diabetes
mellitus, heavy smoking (defined as >20 packs/year), systemic
hypertension and atherosclerotic factors with a potential effect on
blood flow were excluded from the study. With regard to the
controls, additional ophthalmic criteria for inclusion in the study
were as follows: IOP <21 mmHg (at three separate visits), no
clinical evidence of GON (such as cupping, neuroretinal rim
thinning or notching, disk hemorrhages, C/D asymmetry between eyes
>0.2), normal anterior chamber angle on slit lamp gonioscopy,
normal visual field tests and no previous history of glaucoma
medication use.
Patient assessment
Subjects underwent polysomnography using a
computerized system (SOMNOscreen Plus; Somnomedics GmbH). This
examination included the following: Electroencephalography,
electrocardiography, electromyography, assessment of arterial blood
oxygen saturation, snoring recording, nasobuccal airflow detection,
chest wall and thoracic effort monitoring and body position
recording. Factors analyzed included apnea, hypopnea, mean arterial
blood oxygen saturation and snoring time. The number of apneic and
hypopneic events per hour of sleep, indicated by the Respiratory
Disturbance Index (RDI), was also documented (5). The severity of sleep apnea was graded
according to the AHI. A score of <5 was considered normal, that
of 6-15 was graded as mild, that of 16-30 was graded as moderate
and that of >30 was considered as severe (15).
All patients underwent orbital color Doppler imaging
(CDI; Logic E9; GE Healthcare). An 11-MHz linear surface probe was
used and the measurements were performed with patients in the
supine position, gazing upwards with closed eyelids. Peak systolic
blood velocity (PSV) and end diastolic blood velocity (EDV) in the
ophthalmic artery were calculated. The resistivity index (RI) was
calculated using Pourcelot's formula (RI=PSV-EDV/PSV).
The detailed ophthalmological examination included
recording of the best corrected visual acuity, slit lamp
examination of the anterior segment, measurement of IOP with a
Goldmann applanation tonometer (Haag-Streit AG) and Pascal DCT
(Ziemer Ophthalmic Systems AG), recording of the ocular pulse
amplitude (OPA) measured by a Pascal DCT, gonioscopic examination
and fundus examination after mydriasis. Visual fields were
evaluated using a Humphrey 740i field analyzer (Sita standard 24-2
strategy; Zeiss AG). Retinal nerve fiber layer (RNFL) thickness and
ganglion cell complex (GCC) were examined via optical coherence
tomography (OCT; Optovue, Inc.).
Statistical analysis
All statistical analysis was performed using the
statistical software JMP Pro version 13 (SAS Institute, Inc.).
Statistical analysis was performed using linear regression between
various parameters based on controls and non-control sets.
All data were checked for normality of distribution
using a Shapiro-Wilk test. For data determined to follow a normal
distribution, comparison between the two groups was performed and
P-values were determined by Student's t-test. For ordinal
parameters not following a normal distribution, contingency
analysis was used and P-values were determined using Fisher's exact
test. In order to examine differences for nominal parameters that
did not follow a normal distribution, the non-parametric
Mann-Whitney U-test was used to determine P-values.
Linear regression was used for the estimation of
significant predictors of the outcome variable, indicated by the
magnitude and sign of the beta estimates. These regression
estimates were used to explain the relationship between one
dependent variable and one or more independent variables. Analysis
results were presented in a scatterplot. P<0.05 was considered
to indicate a statistically significant difference.
Results
Patient information
Patient characteristics and ocular parameters are
presented in Table I, while the
results of the polysomnographic study and CDI parameters are
presented in Table II. There was
no statistical difference between male and female patients between
the two groups with regards to sex (P=0.09) and age (P=0.21).
 | Table IDemographic data and ocular parameters
for the cohort. |
Table I
Demographic data and ocular parameters
for the cohort.
| Item | Controls (n=38) | Severe OSAHS
(n=45) | P-value |
|---|
| Sex
(male/female) | 23/15 | 35/10 | 0.09a |
| Age (years) | 59.8±8.3 (57.1 to
62.6) | 62.1±7.6 (59.8 to
64.3) | 0.21 |
| IOP Goldmann
(mmHg) | 14.0±2.6 (13.0 to
14.9) | 14.9±3.2 (13.9 to
15.8) | 0.17 |
| IOP Pascal
(mmHg) | 18.2±2.6 (17.3 to
19.0) | 18.1±3.4 (17.1 to
19.1) | 0.88 |
| OPA Pascal
(mmHg) | 2.6±0.9 (2.3 to
2.9) | 2.7±0.9 (2.5 to
3.0) | 0.59 |
| CCT (µm) | 550.7±41.2 (537 to
564) | 561.0±35.0 (550 to
571) | 0.23 |
| Visual field
(MD) | -1.0±2.0 (-1.6 to
-0.3) | -1.6±2.1 (-2.2 to
-0.9) | 0.19 |
| Average RNFL | 104.9±8.6 (102.0 to
108.0) | 101.5±11.2 (98.0 to
105.0) | 0.13 |
| Superior RNFL | 103.4±9.6 (100.3 to
106.6) | 99.16±11.79 (95.6 to
102.7) | 0.07 |
| Inferior RNFL | 106.16±9.10 (103.2 to
109.2) | 103.80±12.39 (100.1
to 107.5) | 0.32 |
| Average GCC | 93.6±7.8 (91.0 to
96.1) | 94.6±8.4 (92.1 to
97.2) | 0.55 |
| Table IIResults of polysomnographic study and
color Doppler imaging parameters. |
Table II
Results of polysomnographic study and
color Doppler imaging parameters.
| Parameter | Controls | Severe OSAHS | P-value |
|---|
| AHI | 4.0±3.0 (3.0 to
6.0) | 37.4±15.4 (32,8 to
42,0) |
<0.001a,b |
| Saturated
O2 % | 94.5±1.0 (92,2 to
94,8) | 93.8±1.5 (93,3 to
94,2) | 0.02a,b |
| RDI | 29.5±20.8 (22.6 to
36.3) | 150.2±58.1 (132.7
to 167.6) |
<0.001a,b |
| RI | 0.7±0.1 (0.7 to
0.7) | 0.7±0.1 (0.7 to
0.7) | 0.13c |
| PSV | 41.4±14.3 (36.7 to
46.1) | 42.2±15.3 (37.6 to
46.8) | 0.63a |
| EDV | 12.4±5.6 (10.1 to
12.9) | 11.5±4.6 (10.7 to
14.1) | 0.63a |
| PVA | 29.0±10.2 (25.7 to
32.4) | 30.7±12.0 (27.0 to
34.3) | 0.50a |
IOP
No statistically significant difference was
identified in the mean IOP when measured with DCT between controls
and OSAHS cases (P=0.88), as well as with a Goldmann applanation
tonometer (P=0.17; Table I). For
the control group, a significant difference was observed in the
measurement of IOP using either method (P=0.0003) and for cases of
severe OSAHS, the difference in IOP was also significant
(P<0.0001).
Other glaucoma parameters
When comparing the two groups, CCT (P=0.23), mean
defect in visual field testing (P=0.19) and average GCC (P=0.55)
exhibited no statistically significant difference. Similarly,
average, superior and inferior RNFL values were not significantly
different between controls and OSAHS cases (Table I).
AHI and RDI
The AHI and RDI were significantly increased in the
severe OSAHS cases vs. controls (P<0.001; Table II). Furthermore, no association was
obtained between the AHI and RI of the ophthalmic artery as
detected by CDI (P=0.24).
OPA
No statistically significant difference was noted in
the OPA measured using a Pascal tonometer between the two groups
(P=0.59). Furthermore, no significant association was identified
between OPA and the mean GCC or RI of the ophthalmic artery after
CDI between the subject groups (Table
I).
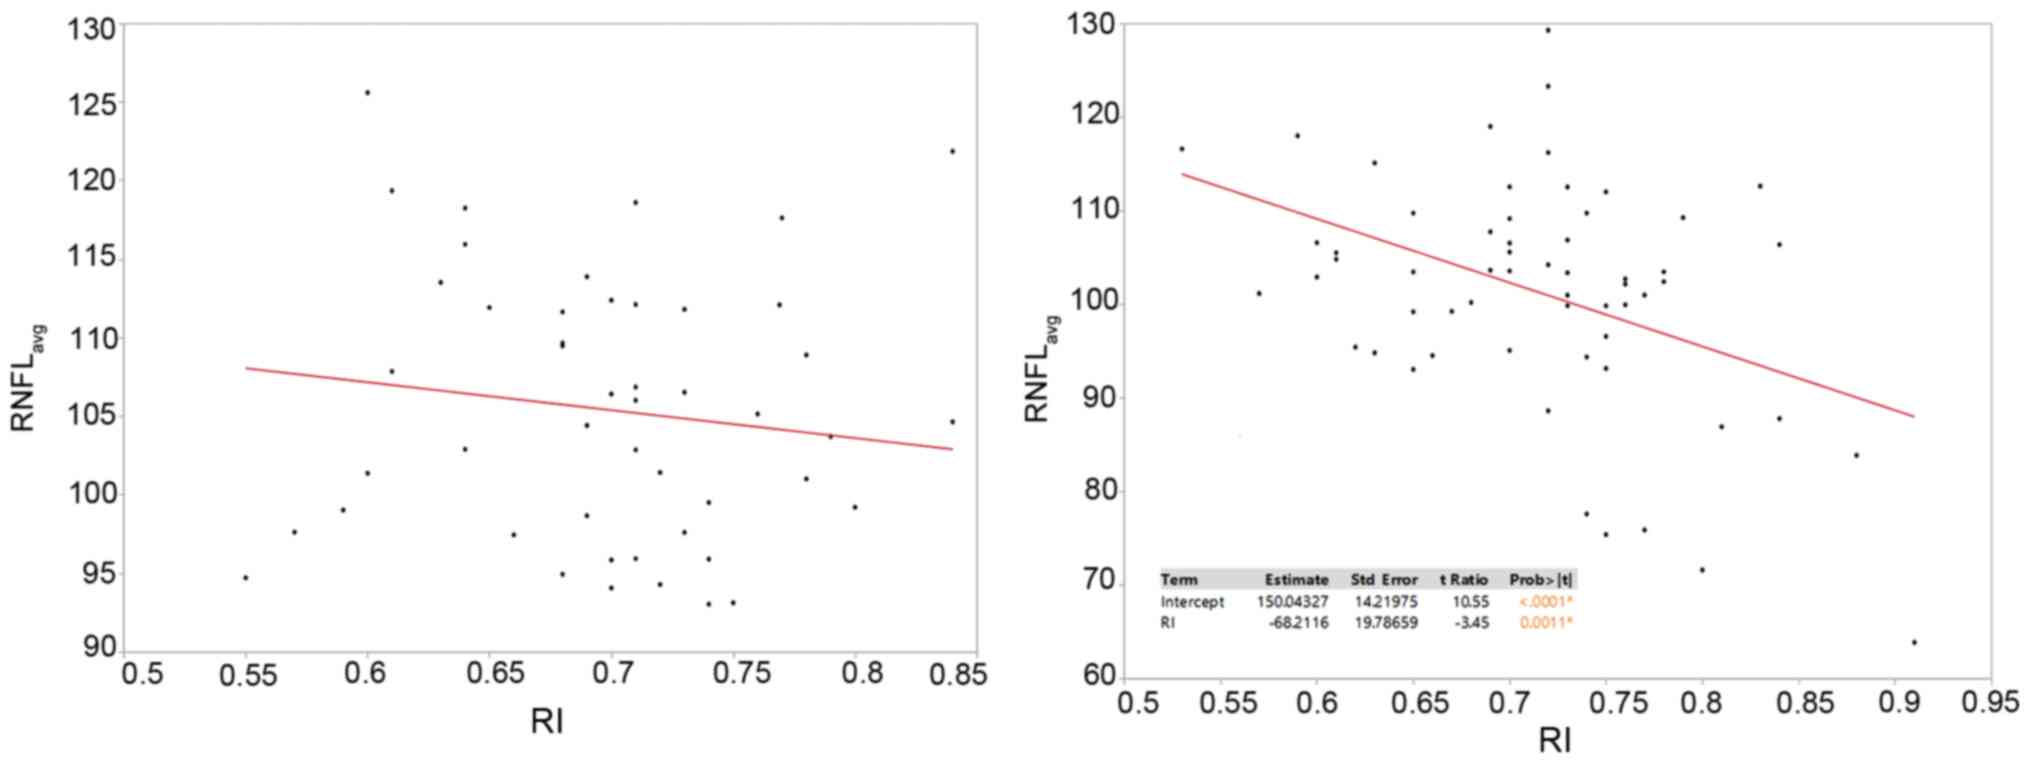
RI
No significant correlation between the mean average
RNFL and RI was obtained in the control group. By contrast, in
patients with severe OSAHS, the average RNFL was determined to
decrease significantly with increments in RI (P=0.0011), with a
strong correlation coefficient of -68.2 (Fig. 1).
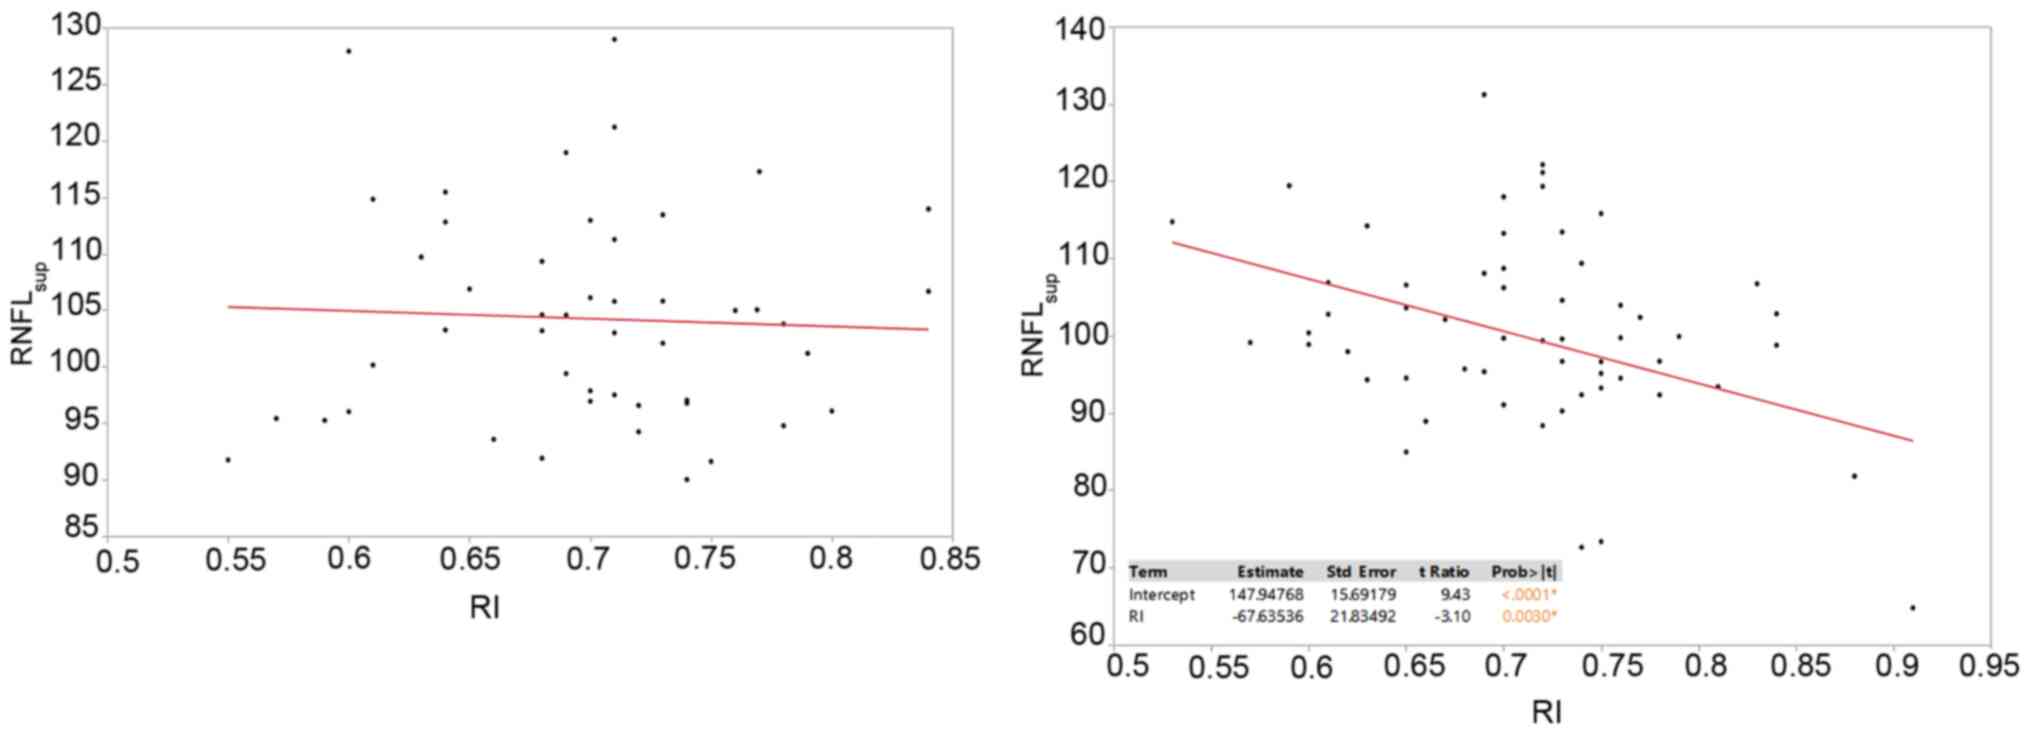
A similar effect was observed in the subgroups of
mean superior and inferior RNFL. The mean superior RNFL values
analyzed with regards to the RI demonstrated no statistically
significant effect for the control group, but a significant
decrease in the RNFL was noted with the increase of the RI in the
severe OSAHS group and a strong correlation was obtained for this
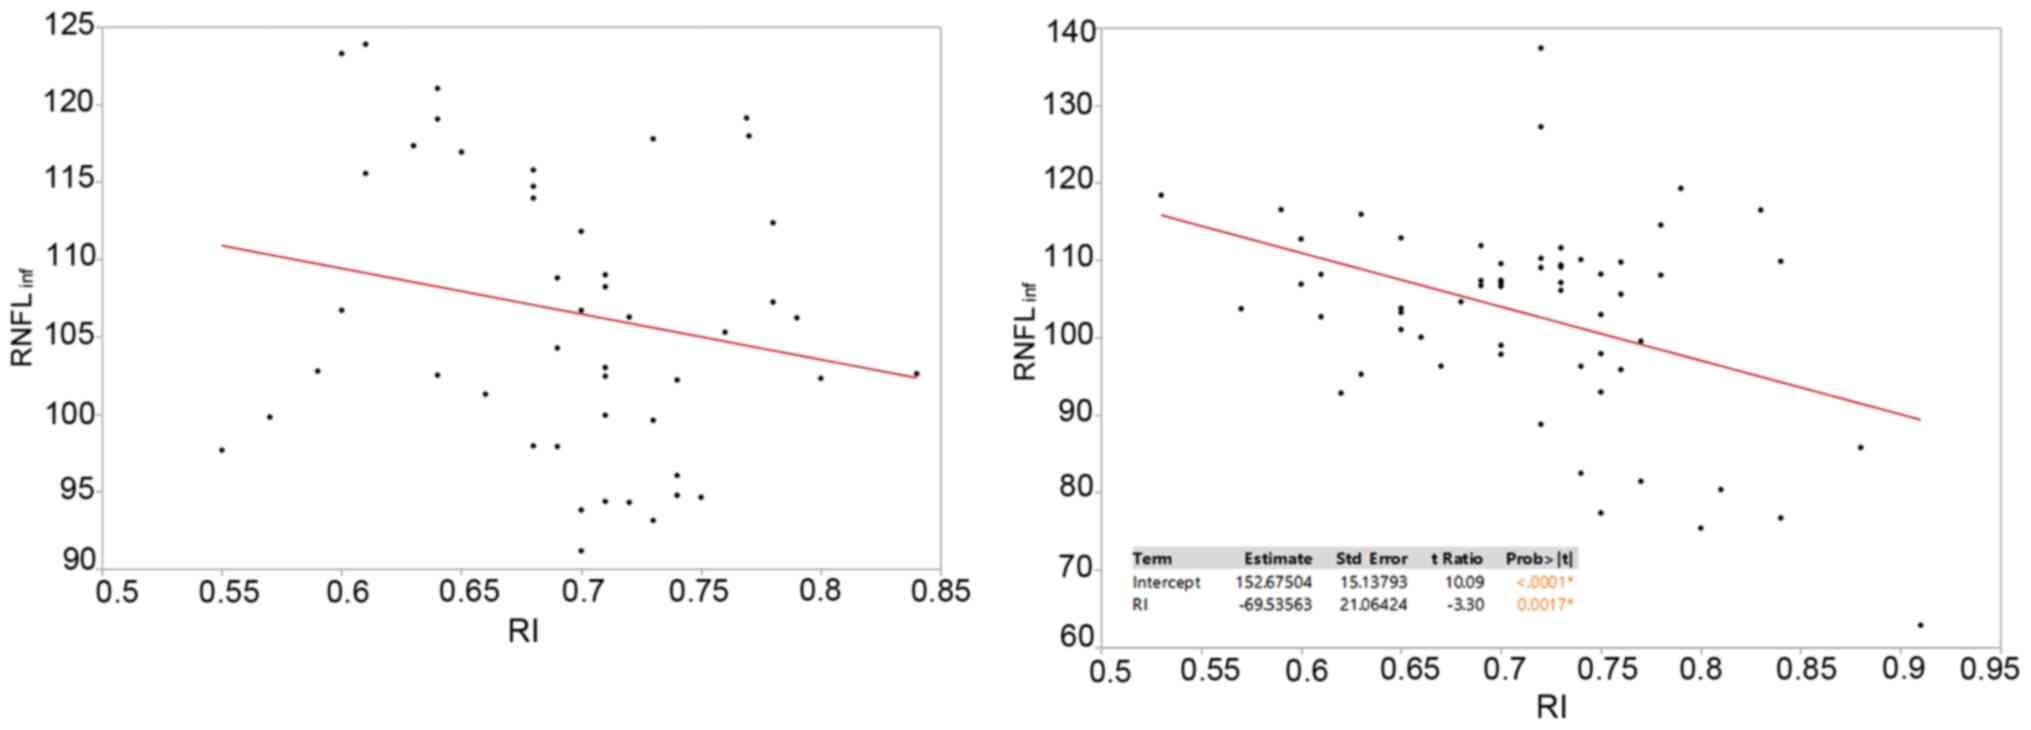
hypothesis (P=0.003; correlation coefficient, -67.6; Fig. 2). For inferior RNFL values in
relation to the RI, no statistical significance was noted for the
control group, but in the OSAHS group, the RNFL appeared to
decrease as the RI increased (P=0.0017; correlation coefficient,
-69.5; Fig. 3).
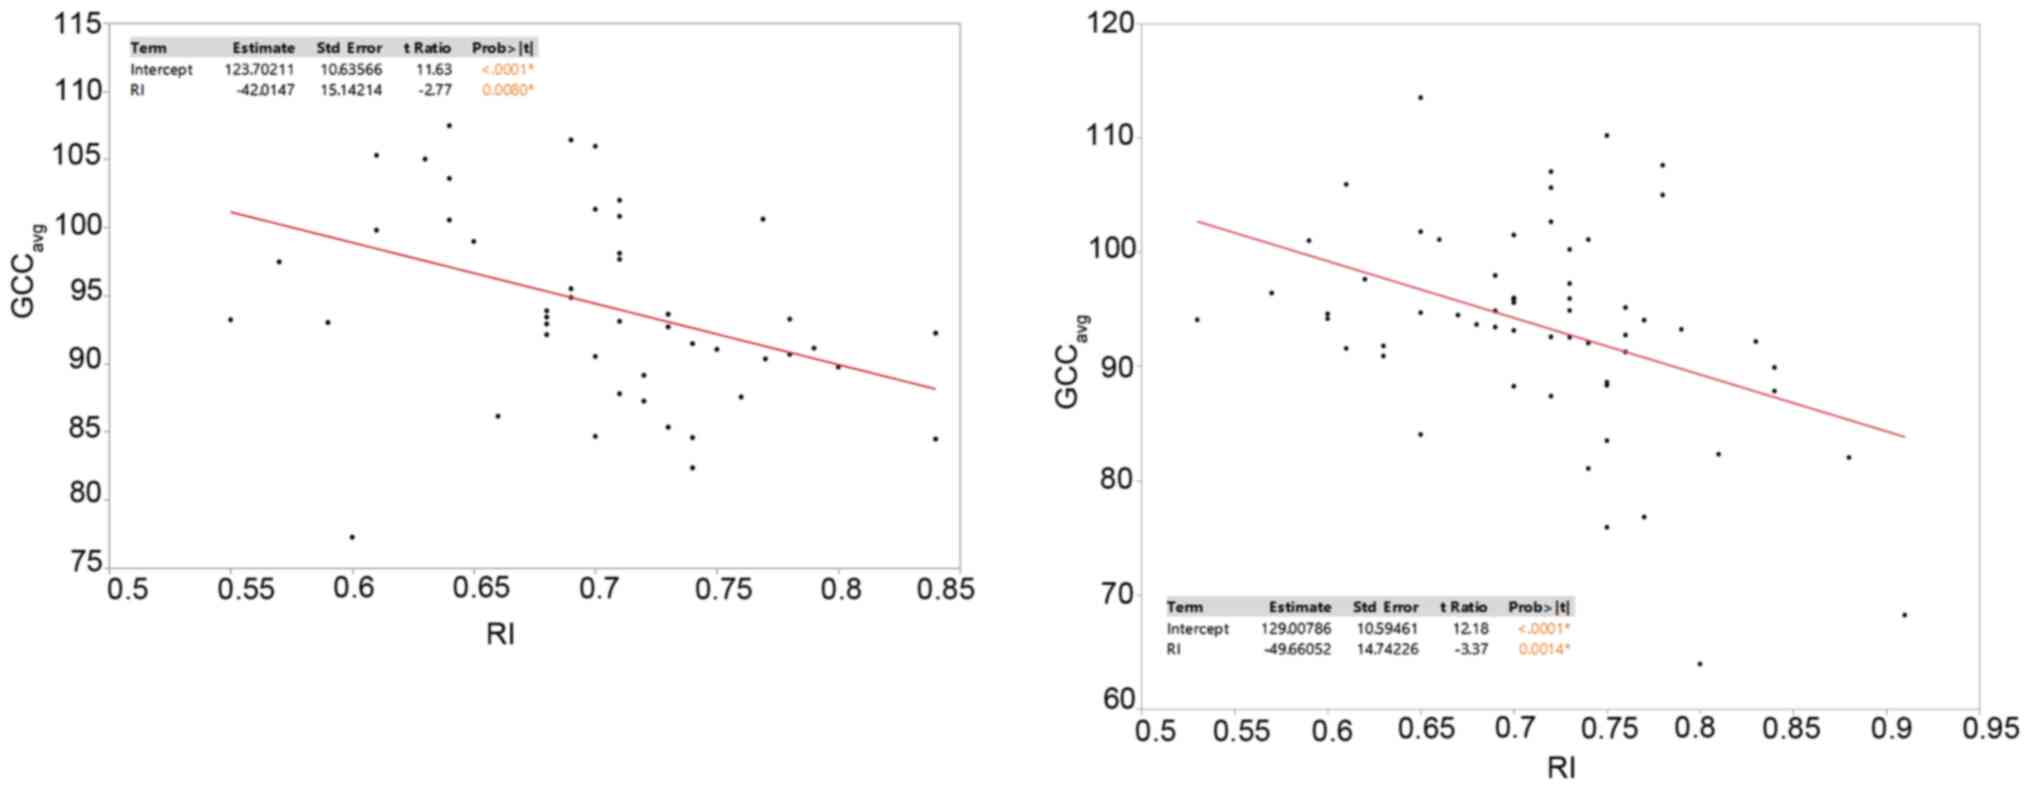
When the RI was examined in relation to the average
GCC, the latter appeared to be significantly decreased with RI
increments in both groups (Fig. 4).
For the control group the correlation coefficient was -42.0
(P=0.008 and for the OSAHS group, it was -49.6 (P=0.0014).
Sleep position
With regards to differences in the RI between the
eyes, no statistical significance was observed in the control group
between the subjects that prefer to sleep on their side and those
that sleep in the supine position (P=0.09). The same was observed
for the OSAHS group (P=0.09). No significant association was
identified between sleep position (left, right or supine) and RNFL
or GCC difference between the two eyes in both groups (P=0.59 and
0.91, respectively).
Saturated O2%
A statistically significant decrement of near 1% was
noticed in saturated blood oxygen percentage for the OSAHS group
when compared with the control group (P=0.02) (Table II).
Discussion
It has been reported that OSAHS is associated with
the pathogenesis of GON via both vascular and mechanical pathways
(10,16). An impaired blood flow to the optic
nerve appears to be the most probable mechanism, with optic nerve
fibres being directly damaged by an unstable oxygen concentration
and reperfusion, followed by oxidative stress possessing an
indirect effect (16). While
certain studies observed a prevalence of GON ranging from 3-27% in
patients with OSAHS, others reported a minimal or no correlation
(17-20).
When patients with glaucoma were evaluated for OSAHS, previous
studies indicated a prevalence ranging between 40 and 54%, and it
was particularly elevated in patients with normal tension glaucoma
(18). Thus, this lack of
consistency between findings means that the exact relationship
between OSAHS and GON remains undetermined. Therefore, the present
prospective, observational case-control study aimed to investigate
the basis of this association by analysing the parameters of ocular
blood flow.
Several studies have identified a positive
association between IOP and OSAHS, including a study by Lin et
al (19) revealing increased
IOP values according to the severity of OSAHS (18-20).
However, other studies indicated no significant differences in the
mean IOP of patients with OSAHS compared with that of controls when
measuring the IOP with various tonometry methods (18,21).
In the present study, no significant difference in the mean IOP was
observed between controls and severe OSAHS cases either by Goldmann
applanation tonometry or DCT. To the best of our knowledge, the
present study was the first to obtain IOP values with both methods.
Goldmann applanation tonometry is used in most studies, with the
exception of the study by Lin et al (19), who used Perkins applanation
tonometry, and that by Aşker et al (21), who used an ocular blood flow
analyzer. When IOP measurements performed by either method are
compared, a significant difference is observed for controls and
subjects with OSAHS between the two tonometry methods
(P<0.0001). Although studies have reported that the IOP measured
using applanation and DCT exhibited no statistically significant
difference, higher IOP values have been observed using DCT vs.
applanation, with certain reports suggesting that this is observed
in patients with low CCT values (22). Based on the aforementioned
information and taking into consideration that CCT values in
patients of the present study exhibited no statistical differences
between groups (P=0.22), it was possible to attribute these present
results to the small sample size. Recently, Arriola-Villalobos
et al (23), in a study on
25 patients with severe OSAHS examining corneal parameters,
determined significant differences in corneal elevation, corneal
volume and minimum radius in patients with OSAHS compared with
those in controls. This may provide a different explanation for the
deviation in IOP between the two tonometry methods observed in the
present study. Thus, it was concluded that further investigations
with a larger sample are required in order to further signify these
results.
With regard to the correlation between the AHI and
GON parameters, a small number of studies have reported a
statistical significance for IOP, whilst as per its relationship to
mean defects in visual fields, results are varied in the existing
studies (18). In the present
study, a statistically significant difference was determined for
both AHI and RDI in the cases of severe OSAHS compared with
controls, with P<0.001.
RI has been used as a marker of vascular resistance,
which is altered by various pathologies that affect the vessel
walls. Atherosclerosis, hypercholesterolemia or smoking, as well as
alterations in blood pressure, nocturnal dipping and
vasoconstriction, carotid artery disease and diabetes mellitus are
among the pathologies reported in the current literature (16,21,24-27).
Such conditions were considered exclusion criteria for the present
study in order to minimize the effect of vascular pathologies on
ocular blood flow. Various studies have investigated the possible
difference in RI between cases of OSAHS and controls, but these
have reported no statistically significant difference (24-27).
In the present study, a statistical significance was identified in
the RI between the two groups (P=0.04).
The role of RI has been investigated in several
studies examining OSAHS, mainly regarding its relationship with
visual fields, which revealed altered indices in patients with
OSAHS who exhibit no evidence of GON (18,20).
Furthermore, an increased RI of the ophthalmic artery has been
reported in patients with glaucoma compared with that in healthy
subjects and has been suggested as a predictive factor for visual
field progression in GON (25,26).
In the present study, RNFL thickness was indicated to decrease
significantly with increased RI in patients with severe OSAHS but
not for the control group. This was confirmed for average
(P=0.0011), superior (P=0.0030) and inferior (P=0.0017) RNFL. ANOVA
demonstrated that for every unit increase in the RI, a decrease of
the RNFL by almost 68 units was obtained when analyzing the average
and superior RNFL, and a decrease by decrease 69 units for the
inferior RNFL for patients with OSAHS. Of note, when comparing RNFL
values between the two groups, no significant difference was
obtained in the subgroups of average, superior or inferior RNFL.
This result suggests a complex effect of the RI on RNFL in OSAHS.
While the effect of OSAHS on RNFL and GCC, measured either by OCT
or scanning laser polarimetry, has been the focus of several
studies, which have identified a severity relationship between RNFL
thinning and OSAHS, other studies have indicated no correlation
(18-20),
and to the best of our knowledge, the present study was the first
to associate the RI directly with RNFL.
Of note, evidence from the present study indicated a
relationship between the RI and average GCC. Both the controls and
patients with OSAHS exhibited decreased GCC values as the RI
increased. In order to explain this result, no evidence regarding
the effect of RI on ganglion cells was found in the current
literature. Given that the RI may be indicative of decreased blood
flow and decreased perfusion (25,27),
this result may suggest a particular vulnerability of macular
Ganglion cells to altered blood flow, which may be possibly higher
in patients with OSAHS.
Given these results, an examination of other CDI
components, specifically PSV and EDV, may provide additional
information and/or reveal more complex relationships.
The main limitation of the present study was the
sample size. Another possible limitation was that all patients with
OSAHS had severe disease (AHI >30), and thus, these results
should be investigated in cases with milder disease.
In conclusion, a decrease in RNFL thickness that
depends on RI increases in cases of severe OSAHS suggested a
vulnerability of the RNFL in OSAHS. The decrease in GCC thickness
as the RI increased in all subjects indicated that impaired
perfusion, particularly in OSAHS, leads to structural changes.
Thus, the long-term follow-up of patients with OSAHS should include
OCT evaluation for changes in RNFL and GCC thickness, as well as
CDI evaluation. Furthermore, patients with increased ophthalmic
artery RIs on CDI, regardless of the etiology, should be monitored
for GCC changes.
Acknowledgements
Not applicable.
Funding
Funding: No funding was received.
Availability of data and materials
The datasets used and/or analyzed during the current
study are available from the corresponding author on reasonable
request.
Authors' contributions
GD, AT, AS, CT, ETD, VK and GL conceived and
designed the study. GD, AL, AS performed a literature search. GD,
AT and CT acquired the data and confirmed the authenticity of the
raw data. GD, AT and AL analyzed and interpreted the data. GD, AT,
AL and CT performed critical analysis and review of the literature.
GD, AT and AL drafted the manuscript. CT, ETD, VK and GL critically
revised the article for important intellectual content. All authors
read and approved the final manuscript.
Ethics approval and consent to
participate
Informed consent was obtained from all patients
prior to surgery and all data were collected according to the
principles of The Declaration of Helsinki. The study was approved
by Democritus University of Thrace, School of Medicine (approval
no. 20721/1503) and the Ethics Committee of
Konstantopouleio-Patission General Hospital (approval no.
233/25.6.15).
Patient consent for publication
Not applicable.
Competing interests
The authors declare that they have no competing
interests.
References
|
1
|
Ryan CM and Bradley TD: Pathogenesis of
obstructive sleep apnea. J Appl Physiol (1985). 99:2440–2450.
2005.PubMed/NCBI View Article : Google Scholar
|
|
2
|
Mojon DS, Hess CW, Goldblum D, Böhnke M,
Körner F and Mathis J: Primary open-angle glaucoma is associated
with sleep apnea syndrome. Ophthalmologica. 214:115–118.
2000.PubMed/NCBI View Article : Google Scholar
|
|
3
|
Mojon DS, Hess CW, Goldblum D,
Fleischhauer J, Koerner F, Bassetti C and Mathis J: High prevalence
of glaucoma in patients with sleep apnea syndrome. Ophthalmology.
106:1009–1012. 1999.PubMed/NCBI View Article : Google Scholar
|
|
4
|
McNab AA: The eye and sleep apnea. Sleep
Med Rev. 11:269–276. 2007.PubMed/NCBI View Article : Google Scholar
|
|
5
|
Marcus DM, Costarides AP, Gokhale P,
Papastergiou G, Miller JJ, Johnson MH and Chaudhary BA: Sleep
disorders: A risk factor for normal tension glaucoma? J Glaucoma.
10:177–183. 2001.PubMed/NCBI View Article : Google Scholar
|
|
6
|
Weinreb RN and Khaw PT: Primary open-angle
glaucoma. Lancet. 363:1711–1720. 2004.PubMed/NCBI View Article : Google Scholar
|
|
7
|
Onen SH, Mouriaux F, Berramdane L,
Dascotte JC, Kulik JF and Rouland JF: High prevalence of
sleep-disordered breathing in patients with primary open-angle
glaucoma. Acta Ophthalmol Scand. 78:638–641. 2000.PubMed/NCBI View Article : Google Scholar
|
|
8
|
Klemm M and Gesser C: The relevance of
diabetes for patients with glaucoma. Klin Monbl Augenheilkd.
231:116–120. 2014.PubMed/NCBI View Article : Google Scholar : (In German).
|
|
9
|
Holló G, Cvenkel B, Teus MA, Irkec MT,
Astakhov YS, Chiselita D, Petkova N, Liehneová I, Kaluzny BJ, Kóthy
P, et al: Is there any difference in target intraocular pressure
for exfoliative glaucoma patients with cardiovascular disease
history? Eur J Ophthalmol. 20:1000–1006. 2010.PubMed/NCBI View Article : Google Scholar
|
|
10
|
Mojon DS, Hess CW, Goldblum D, Boehnke M,
Koerner F, Gugger M, Bassetti C and Mathis J: Normal-tension
glaucoma is associated with sleep apnea syndrome. Ophthalmologica.
216:180–184. 2002.PubMed/NCBI View Article : Google Scholar
|
|
11
|
Kremmer S, Selbach JM, Ayertey HD and
Steuhl KP: Normal tension glaucoma, sleep apnea syndrome and nasal
continuous positive airway pressure therapy-case report with a
review of literature. Klin Monbl Augenheilkd. 218:263–268.
2001.PubMed/NCBI View Article : Google Scholar : (In German).
|
|
12
|
Khandgave TP, Puthran N, Ingole AB and
Nicholson AD: The assessment of sleep apnoea as a risk factor in
glaucoma. J Clin Diagn Res. 7:1391–1393. 2013.PubMed/NCBI View Article : Google Scholar
|
|
13
|
Bendel RE, Kaplan J, Heckman M,
Fredrickson PA and Lin SC: Prevalence of glaucoma in patients with
obstructive sleep apnoea-a cross-sectional case-series. Eye (Lond).
22:1105–1109. 2008.PubMed/NCBI View Article : Google Scholar
|
|
14
|
Lin CC, Hu CC, Ho JD, Chiu HW and Lin HC:
Obstructive sleep apnea and increased risk of glaucoma: A
population-based matched-cohort study. Ophthalmology.
120:1559–1564. 2013.PubMed/NCBI View Article : Google Scholar
|
|
15
|
McNicholas WT: Diagnosis of obstructive
sleep apnoea in adults. Proc Am Thorac Soc. 5:154–160.
2008.PubMed/NCBI View Article : Google Scholar
|
|
16
|
Trivli A, Koliarakis I, Terzidou C,
Goulielmos GN, Siganos CS, Spandidos DA, Dalianis G and Detorakis
ET: Normal-tension glaucoma: Pathogenesis and genetics. Exp Ther
Med. 17:563–574. 2019.PubMed/NCBI View Article : Google Scholar
|
|
17
|
Swaminathan SS, Bhakta AS, Shi W, Feuer
WJ, Abreu AR, Chediak AD and Greenfield DS: Is obstructive sleep
apnea associated with progressive glaucomatous optic neuropathy? J
Glaucoma. 27:1–6. 2018.PubMed/NCBI View Article : Google Scholar
|
|
18
|
Pérez-Rico C, Gutiérrez-Díaz E,
Mencía-Gutiérrez E, Díaz-de-Atauri MJ and Blanco R: Obstructive
sleep apnea-hypopnea syndrome (OSAHS) and glaucomatous optic
neuropathy. Graefes Arch Clin Exp Ophthalmol. 252:1345–1357.
2014.PubMed/NCBI View Article : Google Scholar
|
|
19
|
Lin PW, Friedman M, Lin HC, Chang HW,
Pulver TM and Chin CH: Decreased retinal nerve fiber layer
thickness in patients with obstructive sleep apnea/hypopnea
syndrome. Graefes Arch Clin Exp Ophthalmol. 249:585–593.
2011.PubMed/NCBI View Article : Google Scholar
|
|
20
|
Huseyinoglu N, Ekinci M, Ozben S,
Buyukuysal C, Kale MY and Sanivar HS: Optic disc and retinal nerve
fiber layer parameters as indicators of neurodegenerative brain
changes in patients with obstructive sleep apnea syndrome. Sleep
Breath. 18:95–102. 2014.PubMed/NCBI View Article : Google Scholar
|
|
21
|
Aşker S, Timucin OB, Ursavas A, Aslanci
ME, Baykara M, Erturk H, Asker M, Yilmaz S and Kaya DT: Obstructive
sleep apnea syndrome and blood flow to the eyes. East J Med.
18:165–171. 2013.
|
|
22
|
Willekens K, Rocha R, Van Keer K,
Vandewalle E, Abegão Pinto L, Stalmans I and Marques-Neves C:
Review on dynamic contour tonometry and ocular pulse amplitude.
Ophthalmic Res. 55:91–98. 2015.PubMed/NCBI View Article : Google Scholar
|
|
23
|
Arriola-Villalobos P, Benito-Pascual B,
Peraza-Nieves J, Perucho-González L, Sastre-Ibañez M, Dupré-Peláez
MG, Asorey-García A and Fernández-Sánchez-Alarcos JM: Corneal
topographic, anatomic, and biomechanical properties in severe
obstructive sleep apnea-hypopnea syndrome. Cornea. 39:88–91.
2020.PubMed/NCBI View Article : Google Scholar
|
|
24
|
Erdem CZ, Altin R, Erdem LO, Kargi S, Kart
L, Cinar F and Ayoglu F: Doppler measurement of blood flow
velocities in extraocular orbital vessels in patients with
obstructive sleep apnea syndrome. J Clin Ultrasound. 31:250–257.
2003.PubMed/NCBI View Article : Google Scholar
|
|
25
|
Martínez A and Sánchez M: Predictive value
of colour Doppler imaging in a prospective study of visual field
progression in primary open-angle glaucoma. Acta Ophthalmol Scand.
83:716–722. 2005.PubMed/NCBI View Article : Google Scholar
|
|
26
|
Magureanu M, Stanila A, Bunescu LV and
Armeanu C: Color Doppler imaging of the retrobulbar circulation in
progressive glaucoma optic neuropathy. Rom J Ophthalmol.
60:237–248. 2016.PubMed/NCBI
|
|
27
|
Galassi F, Sodi A, Ucci F, Renieri G,
Pieri B and Baccini M: Ocular hemodynamics and glaucoma prognosis:
A color Doppler imaging study. Arch Ophthalmol. 121:1711–1715.
2003.PubMed/NCBI View Article : Google Scholar
|