Introduction
Oleanolic acid (OA) is a bioactive triterpenoid that
can exist in nature as a free acid in a number of edible and
medicinal plants, including olives, sage Lantana camara and
the privet Lisgustrum lucidum (1). OA has been reported to exert
antioxidant, antibacterial and antitumor effects on human cells
(such as hepatocellular carcinoma and breast cancer cells) and has
been applied in China as a drug for treating liver diseases for
>20 years (2). Several signaling
pathways have been documented to be regulated by OA, including
5'adenosine monophosphate-activated protein kinase, NF-κB and mTOR
pathways (3-5).
In addition, OA can induce apoptosis and autophagy in numerous
types of tumor cells, such as hepatocellular carcinoma cells
(1,6-9)
and attenuate cisplatin-induced nephrotoxicity (10). Although previous studies have
reported that OA can arrest cell cycle progression at the
G1 phase, such as in gallbladder cancer cells (1,11), it
also blocks liver cancer HepG2 cells at the G2/M phase
(7).
Multidrug resistance in tumors is one of the main
causes of chemotherapy failure (12). Upregulation of transmembrane
transporters in tumor cells, such as ATP-binding cassette subfamily
B member 1 (ABCB1 or P-glycoprotein) and multidrug
resistance-associated protein (MRP1 or ABCC1), mainly contribute to
drug resistance, since these proteins pump antitumor agents out of
the tumor cells (12-14).
ABCB1 was primarily discovered as a mediator of multidrug
resistance in breast cancer MCF-7 cells (12). It has been previously reported that
OA can inhibit MRP1 function, but not ABCB1 function in
drug-resistant sarcoma cells (15).
However, a chemically modified OA derivative can target
ABCB1(16). To facilitate the
clinical application of OA as a chemotherapeutic agent, it is
necessary to characterize the actions of OA further in
ABCB1-overexpressing tumor cells.
Molecules that directly mediate the actions of OA on
tumor cells remain poorly understood. In a previous study, it was
revealed that transfection of human acute myelogenous leukemia
HL-60 cells with caveolin-1 (CAV-1) conferred increased
susceptibility to OA (17),
suggesting that CAV-1 may be a target for mediating the antitumor
action of OA. In another study, which aimed to characterize the
role of CAV-1 in the antitumor action of bleomycin (18), it was observed that CAV-1 was
upregulated in the doxorubicin-resistant human breast cancer cell
line MCF-7 (MCF-7/DOX). Therefore, the present study investigated
whether OA can affect multidrug resistance in cancer cells via
CAV-1. It also further determined the characteristics of drug
resistance in cell lines after exposure to OA.
Materials and methods
Drugs and reagents
Harringtonine (HAR) and OA were purchased from the
National Institute of Food and Drug Control (Beijing, China).
Imatinib was obtained from Selleck Chemicals. Doxorubicin (DOX),
vincristine (VCR), cis-diamminedichloroplatinum, dimethyl
sulfoxide, propidium iodide (PI) and rhodamine 123 (Rho 123) were
all acquired from Sigma-Aldrich, Merck KGaA. Cell Counting Kit-8
(CCK-8) was purchased from Bimake.com and
the apoptotic Annexin V/PI kit was obtained from Beijing 4A Biotech
Co., Ltd.
Cell lines and culture
The human leukemia HL-60 cell line was acquired from
The Cell Bank of Type Culture Collection of the Chinese Academy of
Sciences. The HAR-resistant HL-60 cell line (HL-60/HAR) was
established by Professor Q. He, Institute of Medicinal
Biotechnology, Peking Union Medical College and Chinese Academy of
Medical Sciences (Beijing, China) (19). The human breast cancer MCF-7 and
MCF-7/DOX cell lines were kindly provided by Dr Kenneth H Crown
(National Institutes of Health, Baltimore, USA). The resistant cell
lines were used in the experiments after the withdrawal of the
resistance-inducing drugs for 4 weeks. Sensitive MCF-7 and
MCF-7/DOX cells were cultured in RPMI-1640 medium (HyClone;
Cytiva). Sensitive HL-60 and HL-60/HAR cells were maintained with
Improved Minimum Essential Medium (HyClone; Cytiva). A total of 10%
(v/v) FBS (PAN-Biotech GmbH) was supplemented to all media. All
cell lines were cultured with 5% CO2 in a humidified
atmosphere at 37˚C.
Western blot analysis
Western blotting was performed as described
previously (20). Cells (MCF-7,
MCF-7/DOX, HL-60 and HL-60/HAR) were lysed with lysis buffer, which
contained 50 mM Tris-HCl (pH 7.5), 150 mM NaCl, 5 mM EDTA, 50 mM
sodium fluoride, 1 mM sodium orthovanadate, 1 mM dithiothreitol, 1%
Triton X-100 and protease inhibitors [Roche Diagnostics (Shanghai)
Co., Ltd.]. The protein concentrations of the samples were
determined using the Quick Start Bradford 1X Dye Reagent (cat. no.
500-0205; Bio-Rad Laboratories Inc.), according to the
manufacturer's protocol, and by measuring the absorbance at 590 nm
with a microplate reader (Bio-Rad Laboratories, Inc.). The samples
with 20 µg protein per lane were separated via SDS-PAGE on 7.5 or
12.5% gels and then transferred onto polyvinylidene fluoride
membranes. The membrane was blocked with 5% BSA for 1 h at room
temperature, incubated with primary antibodies for 12 h at 4˚C,
washed and then incubated with secondary antibodies at room
temperature. The immunoreactive bands were visualized with the ECL
Plus Western Blotting Detection System (Bio-Rad Laboratories, Inc.)
and detected with an Amersham Imager 600 (GE Healthcare). The bands
were quantified with ImageJ 1.46 software (National Institutes of
Health). Antibodies against ABCB1 (cat. no. 12273, 1:1,000), CAV-1
(cat. no. 3238, 1:1,000), poly(ADP-ribose) polymerase 1 (PARP-1;
cat. no. 9532, 1:2,000), caspase-3 (CASP-3, cat. no. 9662, 1:1,000)
and cleaved caspase-3 (CASP-3-C, cat. no. 9664, 1:500) were
acquired from Cell Signaling Technology, Inc. β-actin (cat. no.
sc-47778, 1:100,000) and p53 (cat. no. sc-126, 1:2,000) antibodies
were obtained from Santa Cruz Biotechnology, Inc. Horseradish
peroxidase-conjugated goat anti-rabbit (cat. no. hs101-01, 1:1,000)
and anti-mouse IgG (cat. no. hs201-01, 1:1,000) antibodies were
acquired from Transgen Biotech Co., Ltd.
Detection of Rho 123 accumulation
Since Rho 123 is the substrate of ABCB1, its
fluorescence intensity can be used as an indicator of the relative
levels of ABCB1 (15,21). A total of 2x10⁵ cells
from the 4 cell lines per well at the logarithmic growth phase were
seeded into a six-well plate. After 24 h incubation at 37˚C, the
cells were exposed to different concentrations of OA (10, 20, 40,
80 and 100 µM) for 1 h at 37˚C. Rho 123 (5 µg/ml) was then added to
the culture medium and the plate was incubated for 1.5 h at 37˚C.
The total incubation time with OA was 2.5 h. The cells were then
collected after centrifugation at 800 x g for 5 min at room
temperature. The fluorescence intensity was detected using a BD
FACSCalibur™ flow cytometer (BD Biosciences). The data were
analyzed using CellQuest Pro software version 5.1 (BD
Biosciences).
RNA interference
RNA interference was performed according to a
previously described protocol (18). Small interfering (si)RNA against
CAV-1 and scrambled siRNA were synthesized by Invitrogen (Thermo
Fisher Scientific, Inc.). The sequence of CAV-1 siRNA was
5'-UUUCCCAACAGCUUCAAAGAGUGGG-3', and the sequence of scrambled
siRNA was 5'-AAGUUGAAUGCGUCUGAAACGGUUC-3'. The MCF-7/DOX cells were
transfected with 100 pmol siRNA for 6 h using
Lipofectamine® 2000 (Thermo Fisher Scientific, Inc.)
according to the manufacturer's instructions. The transfected cells
were cultured in fresh culture medium for 18 h and then used for
subsequent experiments.
CCK-8 assay
CCK-8 assay was performed by following a previously
described protocol (20). A total
of 3,000 cells from 4 the cell lines at the logarithmic growth
phase was seeded into a 96-well plate and incubated for 24 h at
37˚C. Cells were exposed to the drugs for 72 h at 37˚C. The MCF-7
cells were treated with DOX (0.05, 0.1, 0.5 or 1, 5 µM), VCR
(0.005, 0.01, 0.05, 0.1 or 0.2 µM), DDP (1, 5, 10, 20 or 50 µM) and
OA (20, 40, 80, 100 or 120 µM) for 72 h at 37˚C. The MCF-7/DOX
cells were treated with DOX (1, 5, 10, 20 or 50 µM), VCR (0.5, 1,
2, 5 or 10 µM), DDP (0.5, 1, 5, 10 or 20 µM) and OA (20, 40, 80,
100 or 120 µM) for 72 h at 37˚C. The HL-60 cells were treated with
HAR (0.001, 0.005, 0.01, 0.05 or 0.1 µM), DOX (0.01, 0.05, 0.1, 0.2
or 0.5 µM), VCR (0.05, 0.1, 0.5, 1, 2 or 5 nM), imatinib (2, 5, 10,
20 or 50 µM) and OA (20, 40, 80, 100 or 120 µM) for 72 h at 37˚C.
The HL-60/HAR cells were treated with HAR (0.1, 0.5, 1, 5 or 10
µM), DOX (0.1, 0.5, 1, 5 or 10 µM), VCR (100, 200, 500, 1,000 or
2,000 nM), imatinib (2, 5, 10, 20 or 50 µM) and OA (5, 10, 20, 40
or 80 µM) for 72 h at 37˚C. After co-incubation with the
aforementioned drugs, 20 µl of CCK-8 per lane for 2 h at 37˚C, the
optical density (OD) values at 450 nm were measured using a
microplate reader (Bio-Rad Laboratories, Inc.). The viability of
the control group that did not receive OA treatment was set as
100%. The cell survival rates of the experimental groups were
calculated using the following equation: Viability (%)=(OD of the
drug-treated groups-OD of background)/(OD of the control group-OD
of background) x100%. The data were plotted with GraphPad Prism 5
(GraphPad Software, Inc.).
Cell cycle analysis via flow
cytometry
The cells at the logarithmic growth phase were
seeded into a six-well plate with a density of 2x10⁵
cells/well and incubated for 24 h at 37˚C. After exposure to OA for
24 h at 37˚C, the MCF-7 and MCF-7/DOX cells were digested and
collected after centrifugation at 800 x g for 5 min at room
temperature. HL-60 and HL-60/HAR cells were collected for
centrifugation at 800 x g for 5 min at room temperature. The cells
were then fixed with 70% (v/v) ethanol overnight at 4˚C. Before the
assay, the cells were washed twice with cold PBS and incubated with
100 µg/ml RNase A (Beijing Solarbio Science & Technology Co.,
Ltd.) for 30 min at 37˚C. The cells from the 4 cell lines were
stained with 50 µg/ml PI for 1 h in the dark at room temperature.
Finally, the fluorescence intensities of the groups were measured
using a BD FACSCalibur™ flow cytometer (BD Biosciences). The data
were analyzed using ModFit LT software version 5.1 (Verity Software
House, Inc.).
Measurement of apoptotic cells using
Annexin V/PI staining
Cells (3x10⁵) at the logarithmic growth
phase were seeded into a six-well plate and maintained for 24 h at
37˚C. After exposure to various concentrations of OA (20, 40, 80
and 100 µM) for 48 h at 37˚C, the cells were collected and washed
twice with cold PBS. The cells (MCF-7, MCF-7/DOX, HL-60 and
HL-60/HAR) were resuspended with binding buffer and stained with 5
µl Annexin V-FITC for 5 min at room temperature in the dark. After
the addition of 2 µg/ml PI to the cell suspension for 15 min at
room temperature, the fluorescence intensities were analyzed using
a BD FACSCalibur™ flow cytometer (BD Biosciences). The data were
processed with CellQuest Pro software version 5.1 (BD
Biosciences).
Statistical analysis
Data are presented as the mean ± SD from three
independent experiments. Statistical analysis was conducted using
one-way ANOVA followed by Tukey's test using SPSS 19.0 (IBM Corp.).
P<0.05 was considered to indicate a statistically significant
difference.
Results
Characterization of drug-resistant
MCF-7/DOX and HL-60/HAR cells
The viability of cells treated with the indicated
antitumor drugs was determined using CCK-8 assay. The
IC50 values are summarized in Tables I and II. Compared with their respective
parental cell lines, the increase of resistance against DOX in
MCF-7/DOX cells was ~469-fold, whilst resistance against HAR in
HL-60/HAR cells was 240-fold (Tables
I and II), suggesting
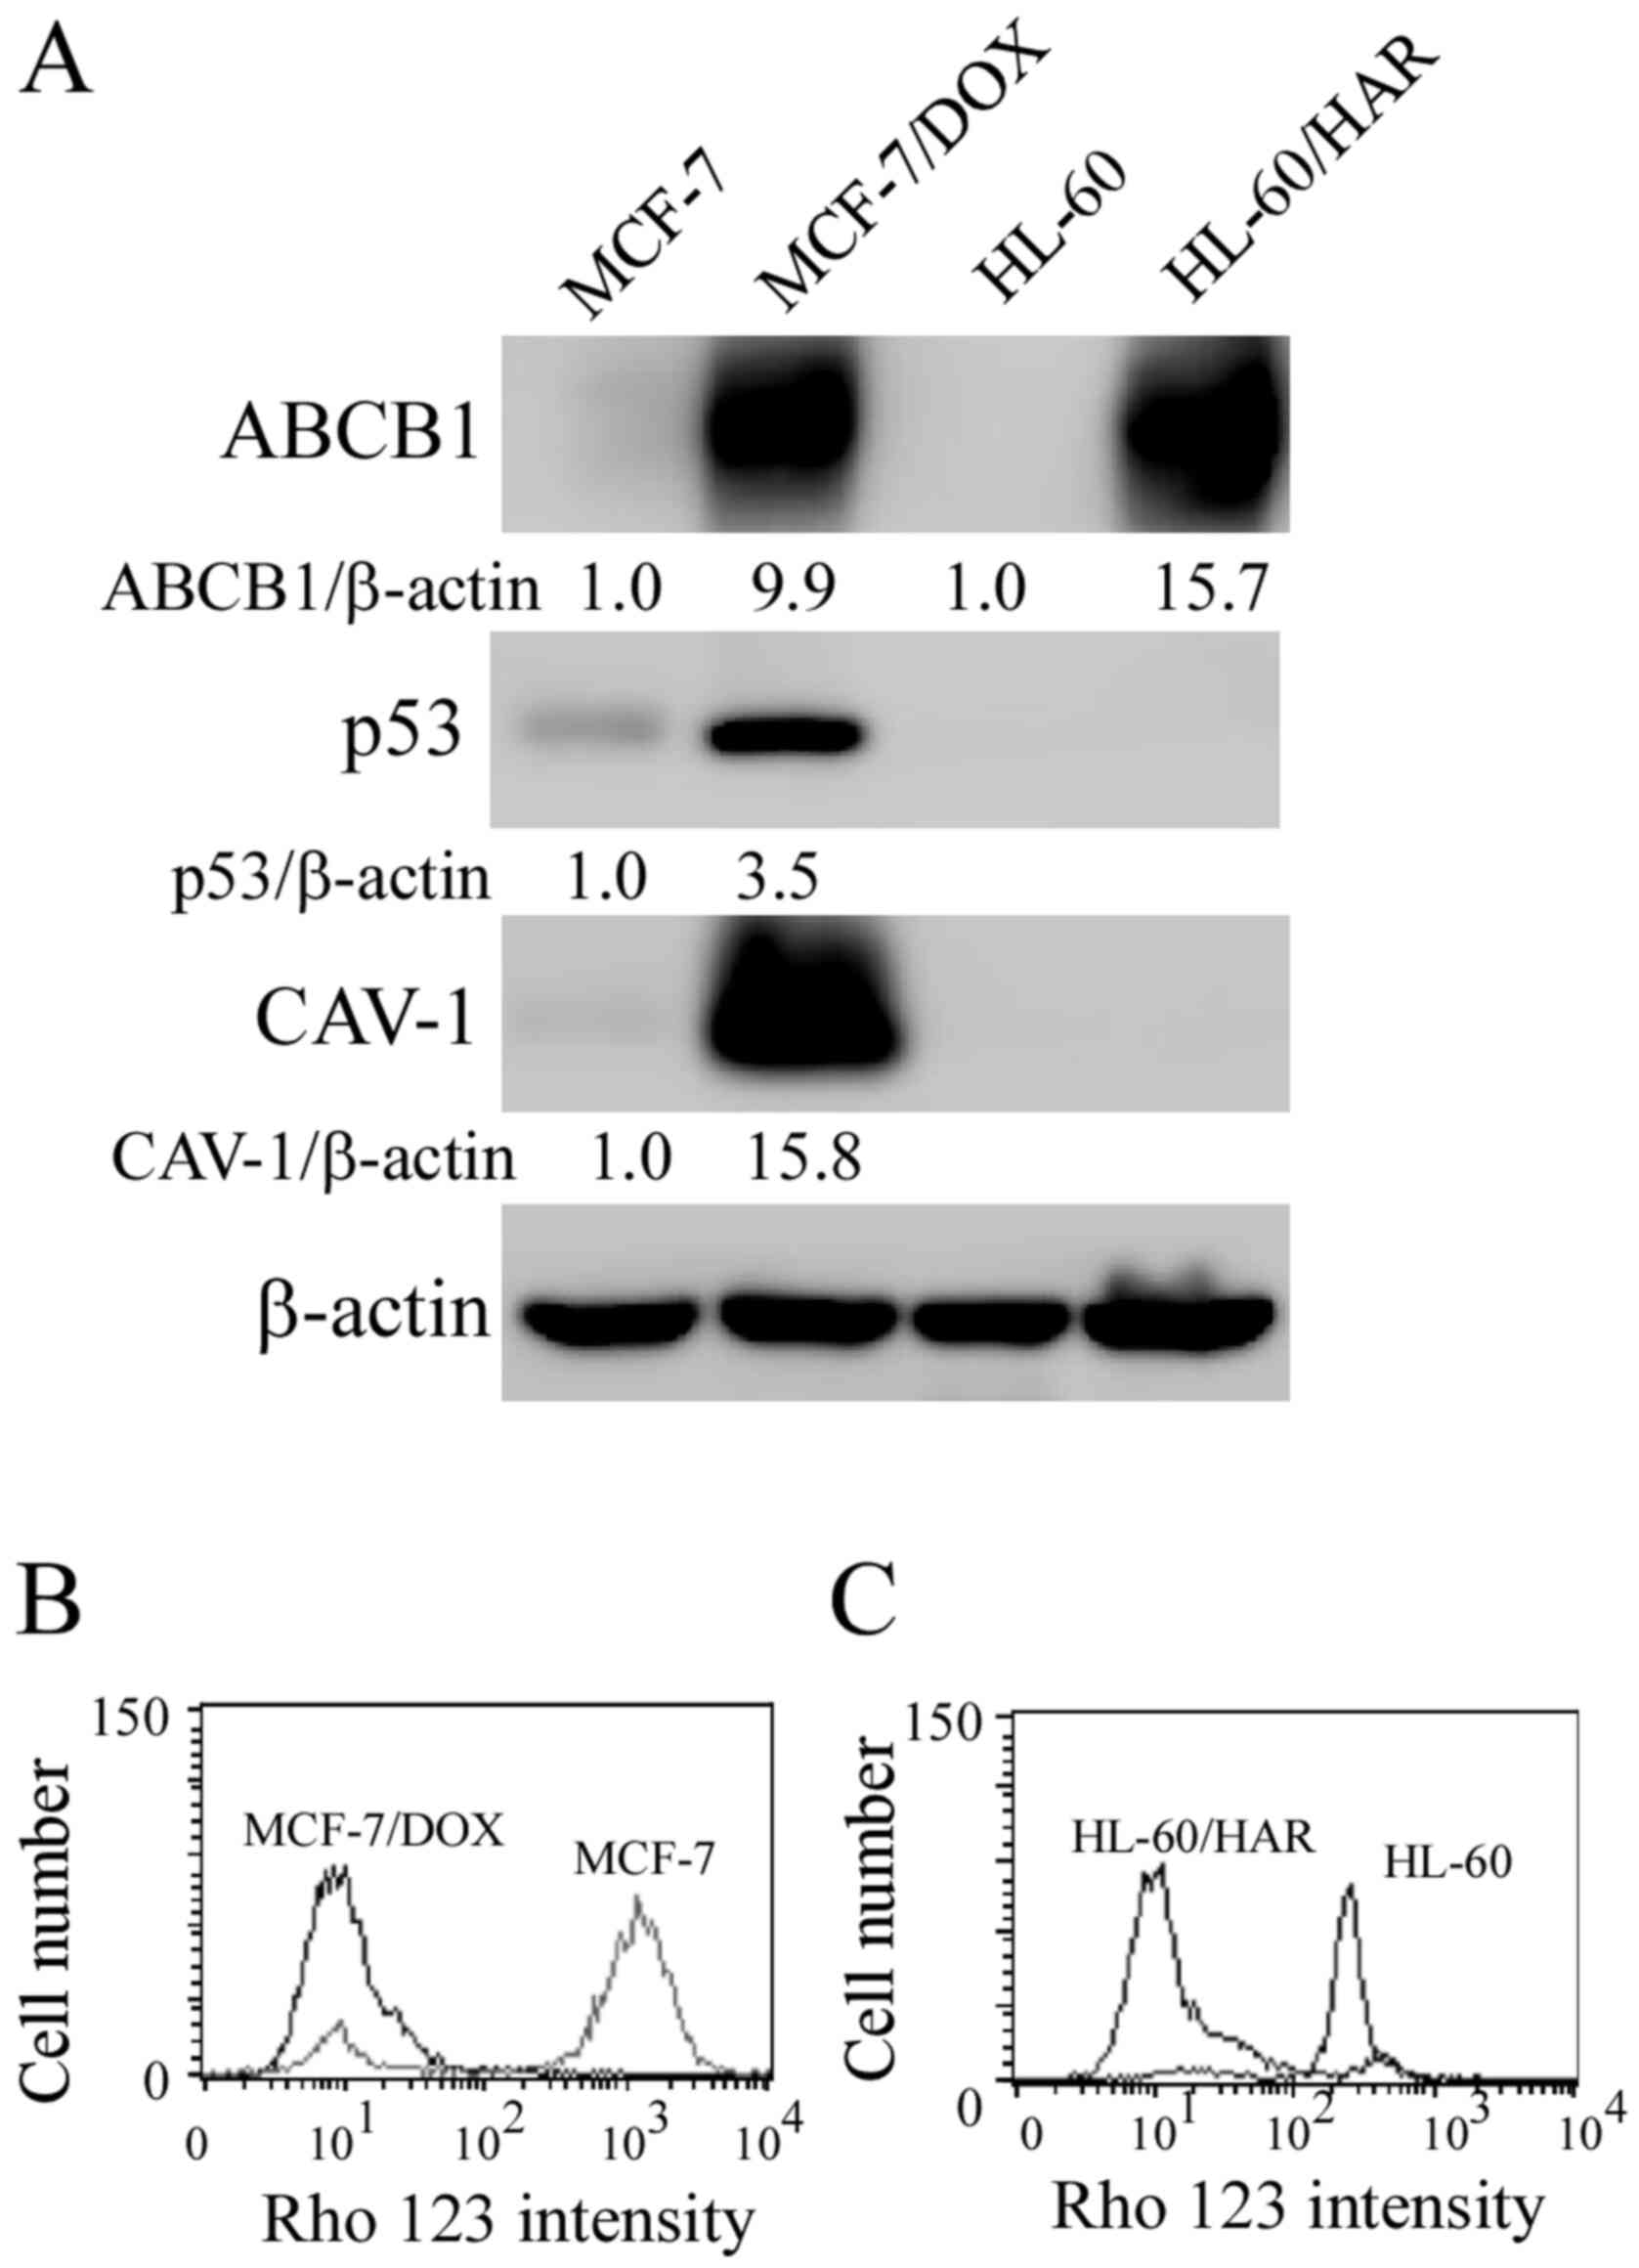
increased resistance to both antitumor agents. Upregulation in
ABCB1 expression was observed in both drug-resistant cells compared
with that in their respective parental cell lines (Fig. 1A), indicating that the drug
resistance was associated with ABCB1 protein expression. This is
consistent with findings from previous studies on these two
drug-resistant cell lines (19,22).
The protein expression levels of p53 and CAV-1 were also increased
in MCF-7/DOX cells compared those in their parental MCF-7 cells. As
presented in Fig. 1B and C, Rho 123 was markedly accumulated in
sensitive MCF-7 and HL-60 cells, more than that observed in
MCF-7/DOX and HL-60/HAR cells.
 | Table IIC50 values of various
drugs for MCF-7/DOX and sensitive MCF-7 cells. |
Table I
IC50 values of various
drugs for MCF-7/DOX and sensitive MCF-7 cells.
| Drug | IC50 for
MCF-7 (µM) | IC50 for
MCF-7/DOX (µM) | Resistant
folds |
|---|
| DOX | 0.23±0.02 | 108.00±2.94 | 469.6 |
| Vincristine | 0.03±0.01 | 5.92±1.63 | 196.6 |
|
cis-diamminedichloroplatinum | 13.10±0.30 | 4.94±1.62 | 0.4 |
| Oleanolic acid | 83.40±5.61 | 79.13±3.71 | 0.9 |
| Table IIIC50 values of various
drugs for the inhibitions of HL-60/HAR and sensitive HL-60
cells. |
Table II
IC50 values of various
drugs for the inhibitions of HL-60/HAR and sensitive HL-60
cells.
| Drug | IC50 for
HL-60 (µM) | IC50 for
HL-60/HAR (µM) | Resistant
folds |
|---|
| HAR | 0.01±0.01 | 2.40±0.40 | 240 |
| Doxorubicin | 0.06±0.01 | 0.92±0.23 | 15 |
| Vincristine | 0.008±0.001 | 0.62±0.05 | 750 |
| Imatinib | 21.84±2.62 | 18.31±0.73 | 0.8 |
| Oleanolic acid | 82.24±2.22 | 18.50±6.34 | 0.2 |
There was a notably different result in the cell
survival rates of OA treatment groups between MCF-7/DOX and
HL-60/HAR cells. MCF-7/DOX cells exhibited little difference in
sensitivity to OA compared with that in their parental MCF-7 cells
(Table I). However, HL-60/HAR cells
were four-fold more sensitive to OA compared with that in their
parental HL-60 cells (Table II).
Based on this finding, HL-60/HAR cells were treated with lower
concentrations of OA (2, 5, 10, 20 and 40 µM) for subsequent
experiments. It should be noted that additional cell proliferation
methods, such as BrdU, should also be used for precisely measuring
proliferation of drug resistant cells.
Effect of CAV-1 knockdown on OA
sensitivity in MCF-7/DOX cells
Overexpression of CAV-1 in HL-60 cells increases
their sensitivity to OA, as demonstrated in a previous study
(17). In the present study,
upregulation of CAV-1 was found in MCF-7/DOX cells compared with
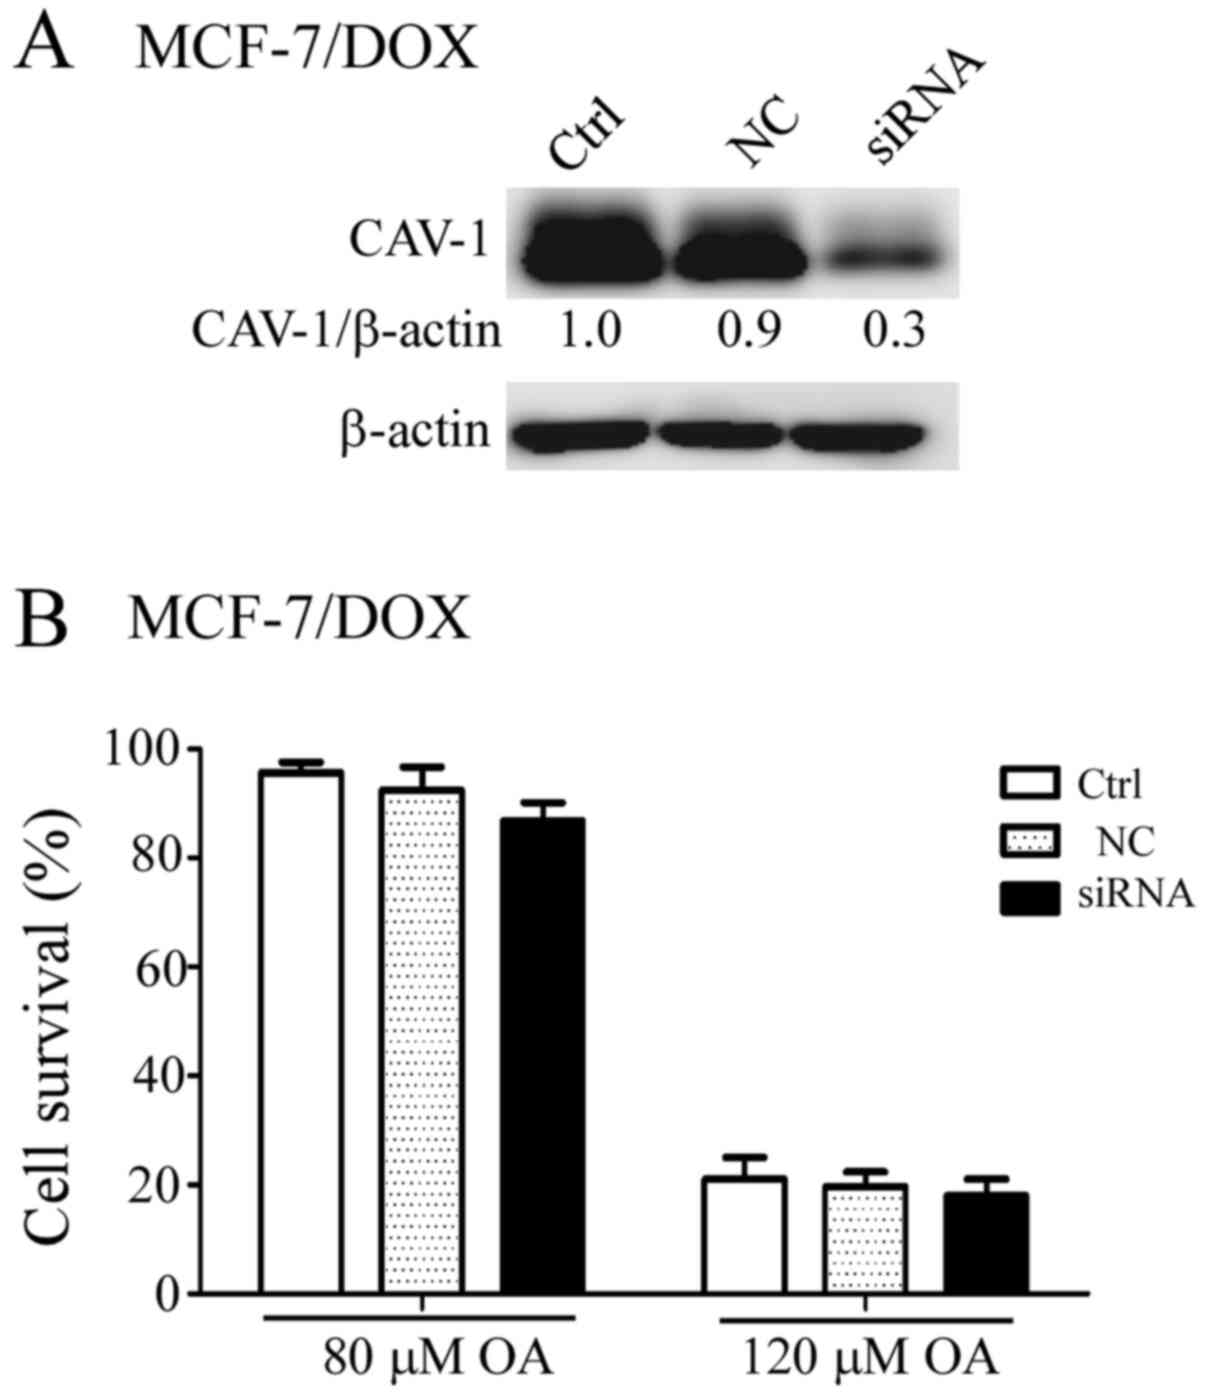
that in their parental MCF-7 cells (Fig. 1A). Therefore, reduction in CAV-1
expression in MCF-7/DOX cells may enhance their sensitivity to OA.
Therefore, CAV-1 expression was successfully downregulated in
MCF-7/DOX cells using RNA interference (Fig. 2A). However, there was no significant
difference in the sensitivity to OA between the scrambled
siRNA-transfected and the CAV-1 siRNA-transfected MCF-7/DOX cells
after the cells were treated with 80 and 120 µM OA for 48 h
(Fig. 2B).
G1 phase cell cycle arrest
after OA treatment in both drug resistant cell lines
Cell cycle distribution was analyzed using flow
cytometry after the cells were treated with different
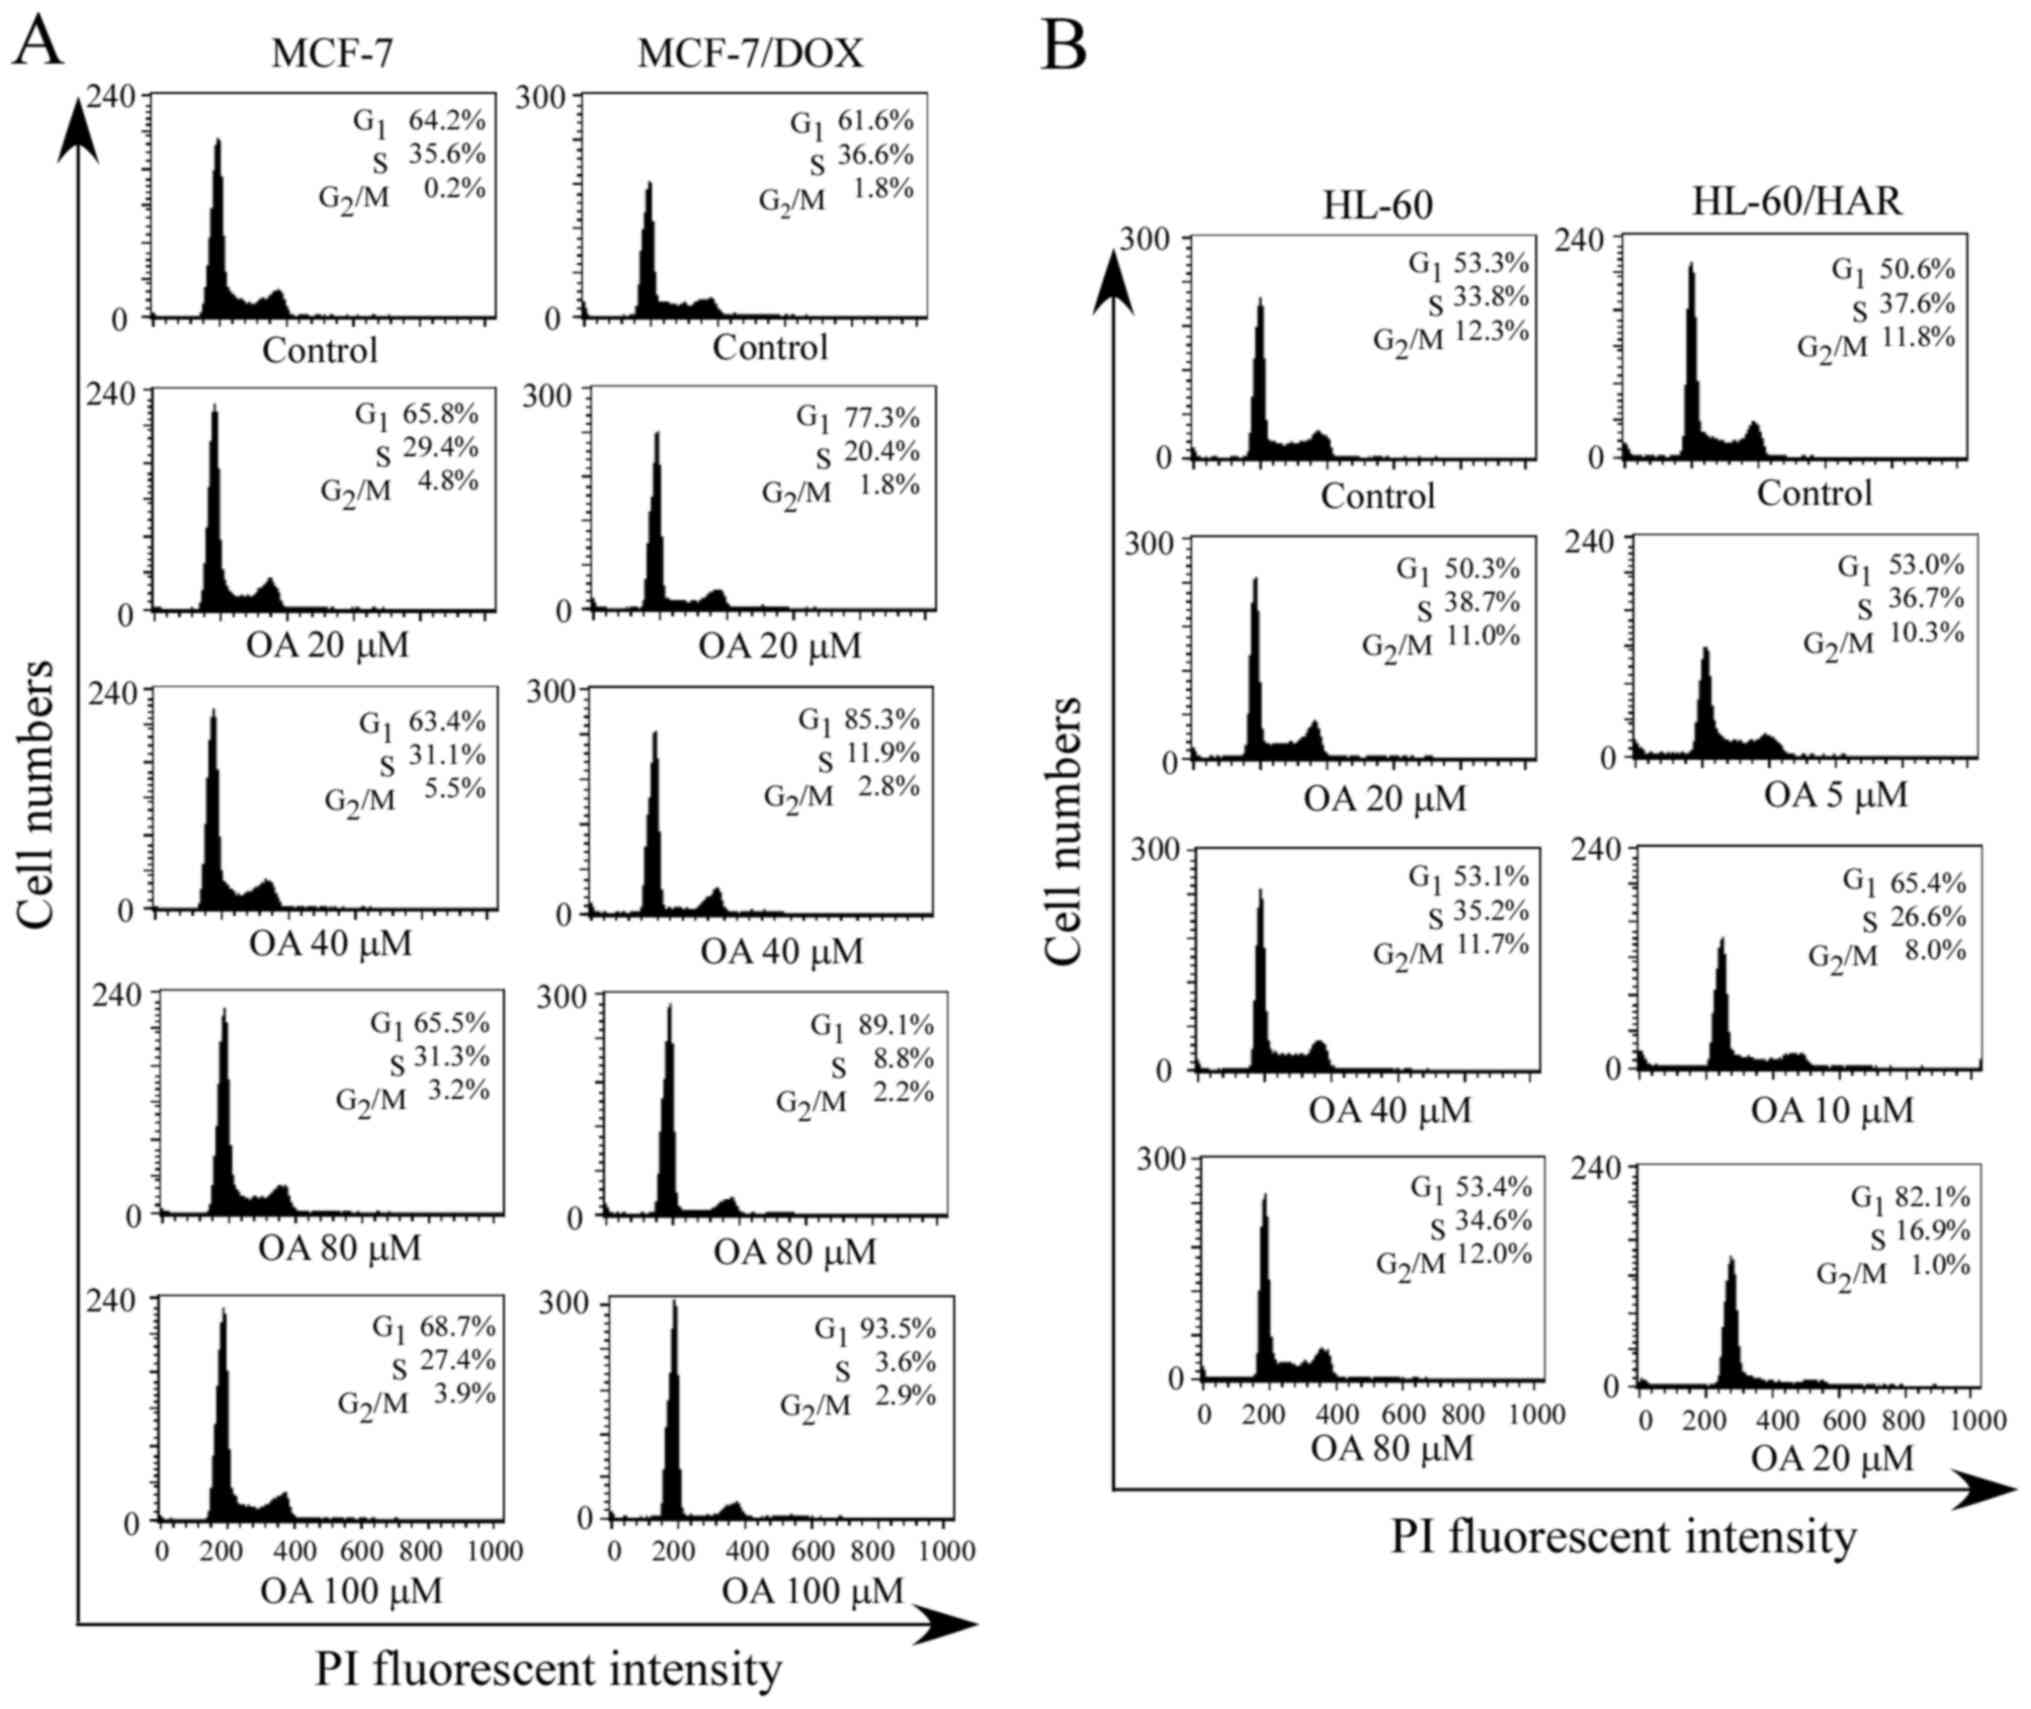
concentrations of OA for 24 h. The results demonstrated that the
percentage of cells at G1 phase increased a small amount
with increasing concentrations of OA in sensitive MCF-7 cells
(Fig. 2A). For example, the
G1 percentage was 64.2% in the control group and was
68.7% in the 100 µM OA-treatment group. However, the G1
percentage in MCF-7/DOX cells treated with the same concentration
of OA was 93.5%, indicating an increased percentage of
G1 phase cells compared with that in the sensitive cells
(Fig. 3A). In addition, the
percentage of G1 phase cells was 53.3% in the control
group and 53.4% after sensitive HL-60 cells were treated with 80 µM
OA (Fig. 3B). OA concentrations of
5, 10 and 20 µM were used for cell cycle analysis as HL-60/HAR
cells tended to be more sensitive to OA, compared with sensitive
HL-60 cells, as shown in a preliminary cell survival experiment
(Table II). The percentage of
G1 phase cells was 82.1% in the 20 µM OA-treatment
group, whilst no notable changes in the percentage of G1
phase cells were detected with high concentrations of OA treatment
(80 µM) in sensitive HL-60 cells compared with that in the control
cells (Fig. 3B). These results
suggested that HL-60/HAR cells were more sensitive to OA in
comparison with their corresponding sensitive parental HL-60
cells.
Induction of apoptosis by OA in MCF-7
cells
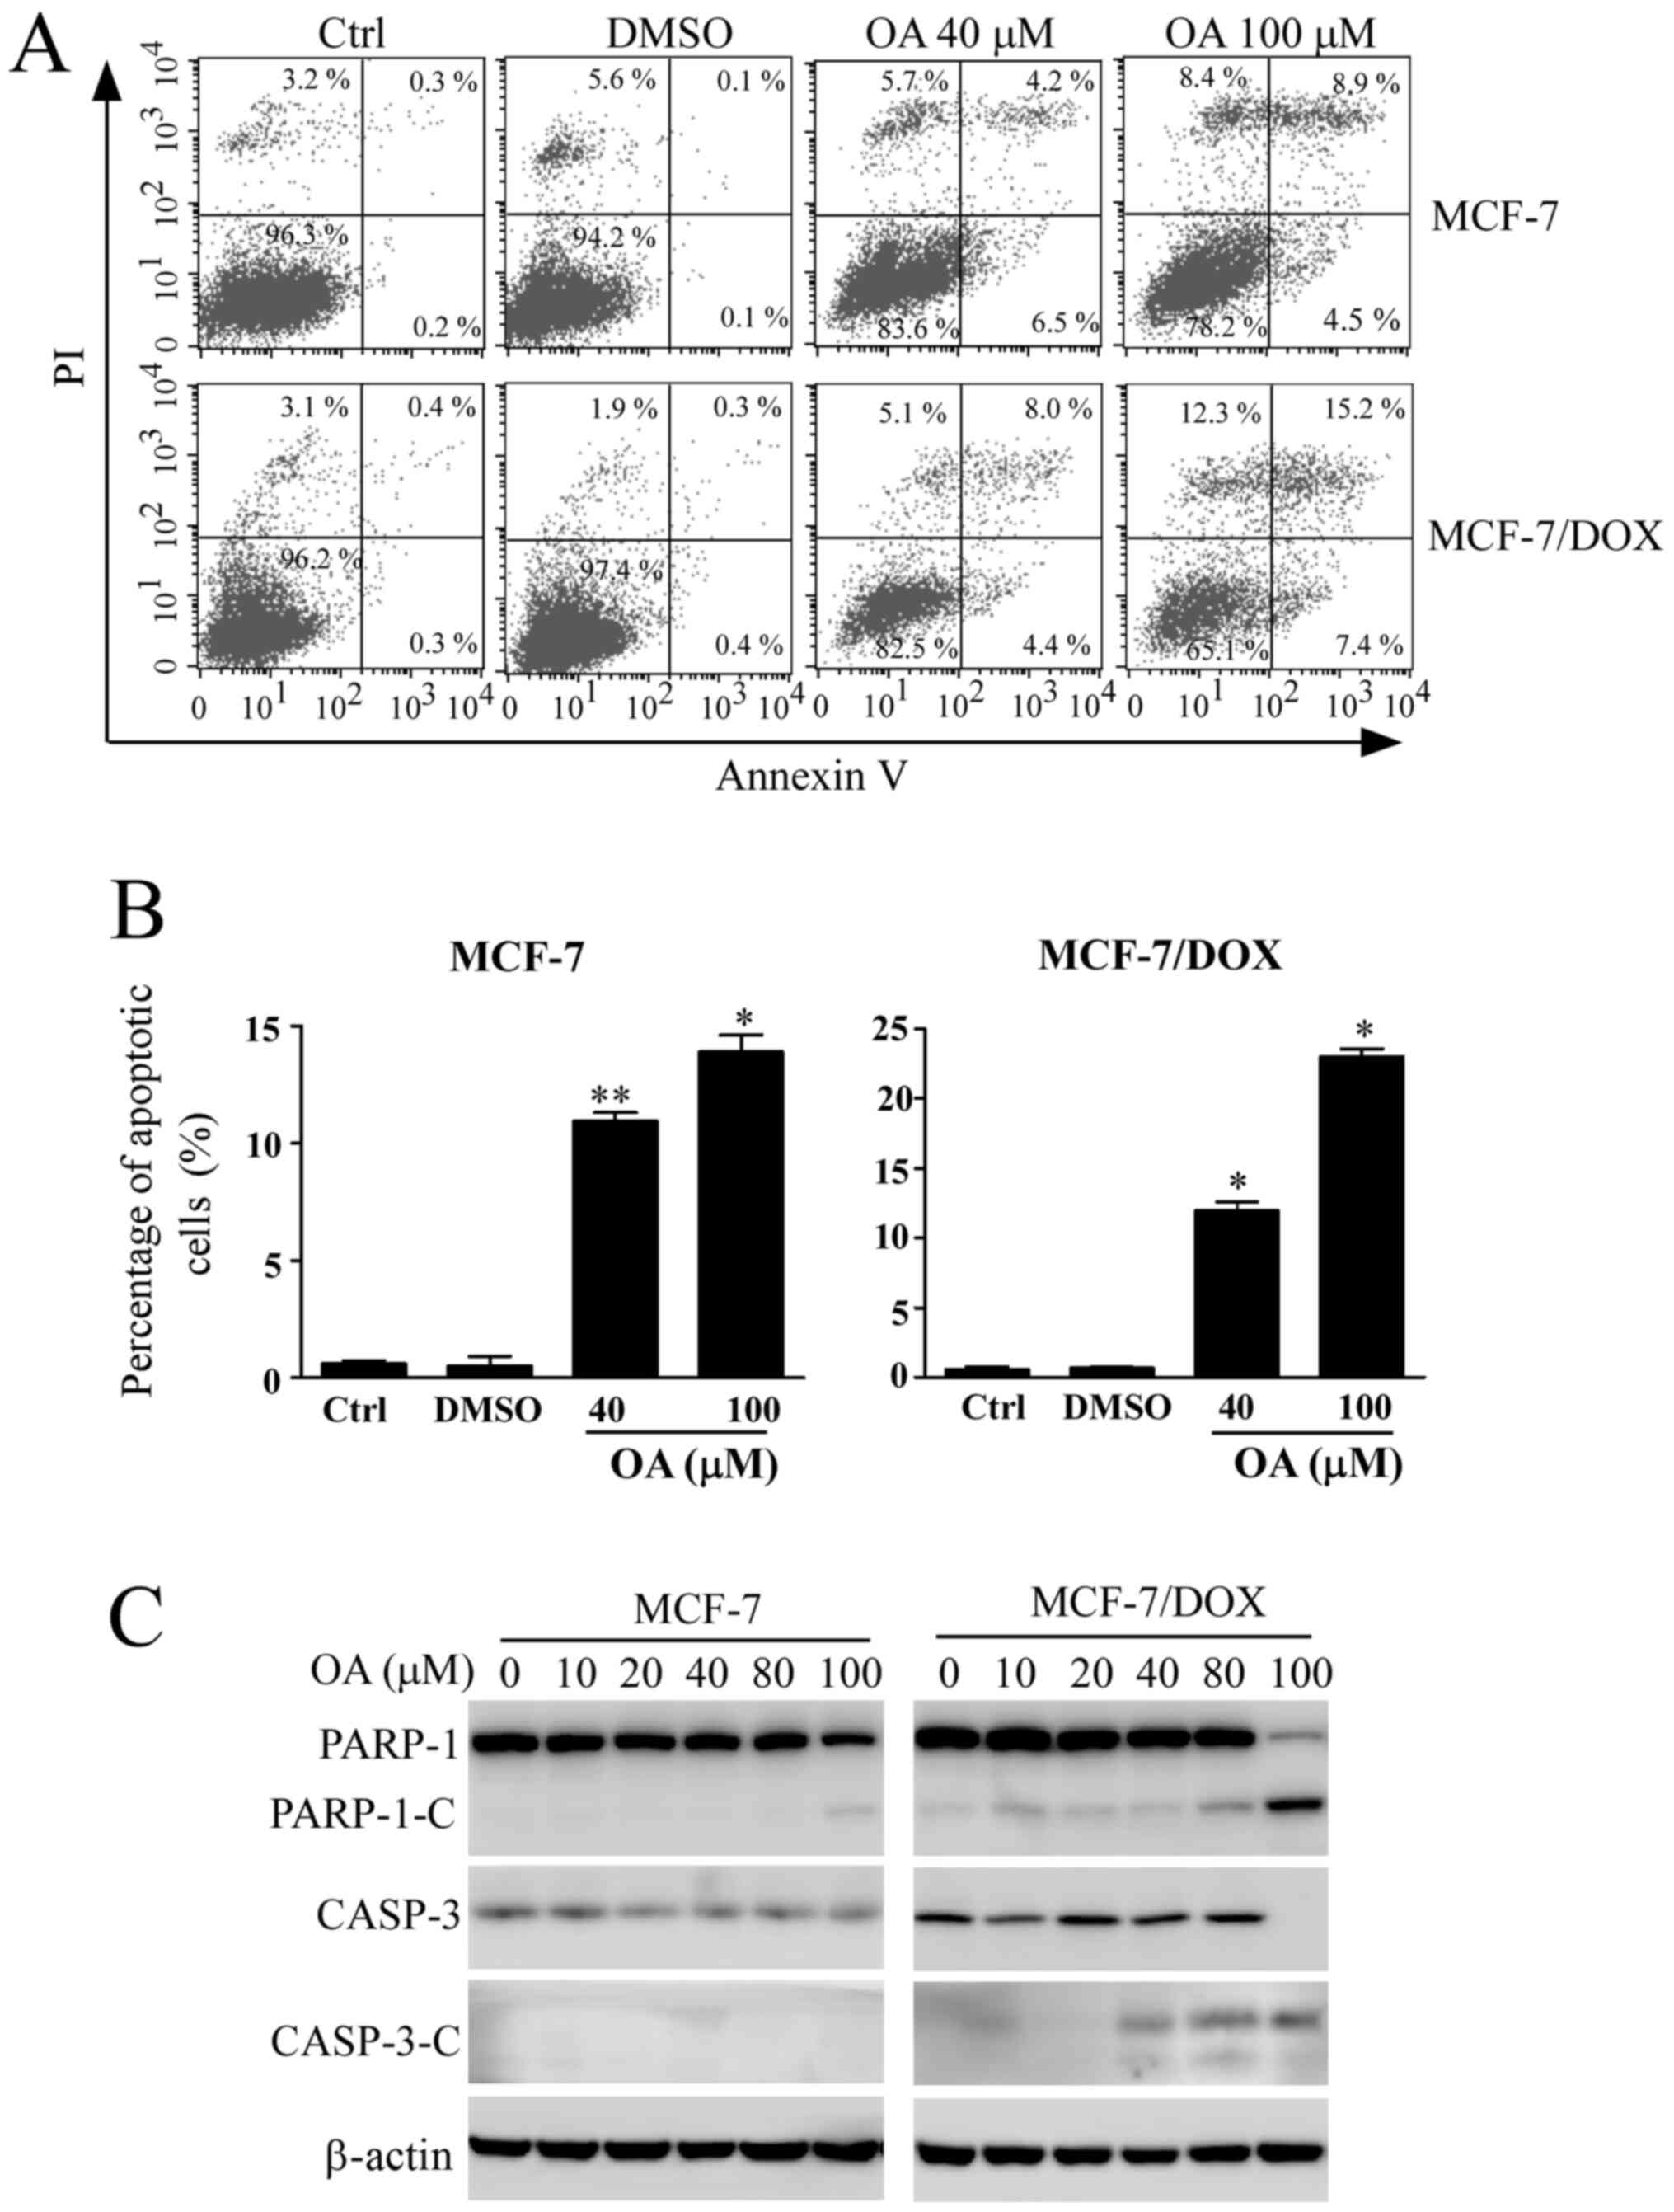
The apoptotic rate of cells was next detected using
Annexin V/PI-staining after MCF-7 cells were treated with different
concentrations of OA for 48 h. The apoptotic rates of MCF-7 cells
treated with OA were gradually increased in a
concentration-dependent manner (Fig.
4A and B). The apoptosis rate
was 13.4% in sensitive MCF-7 cells after exposure to 100 µM OA.
However, the apoptotic rate in MCF-7/DOX cells was 22.7% after OA
treatment at the same concentration, indicating enhanced apoptosis
compared with that observed in their corresponding parental
sensitive cells. Changes in apoptosis-related protein expression
were detected by western blotting. The cleavage of PARP-1 is a
biomarker of apoptosis that is used as an indicator of apoptotic
occurrence (23). The cleavage
fragments of PARP-1 and activated CASP-3 were detected after
sensitive MCF-7 cells and MCF-7/DOX cells were treated with
increasing concentrations of OA up to 100 µM for 48 h (Fig. 4C), where an increased number of
cleaved fragments of PARP-1 and CASP-3 were observed in MCF-7/DOX
cells treated with the same concentration (100 µM), compared with
sensitive MCF-7 cells. The cleaved fragments were also observed at
lower concentrations of OA treatment in MCF-7/DOX cells (Fig. 4C). The results from the apoptosis
assay further indicated that MCF-7/DOX cells were more sensitive to
OA.
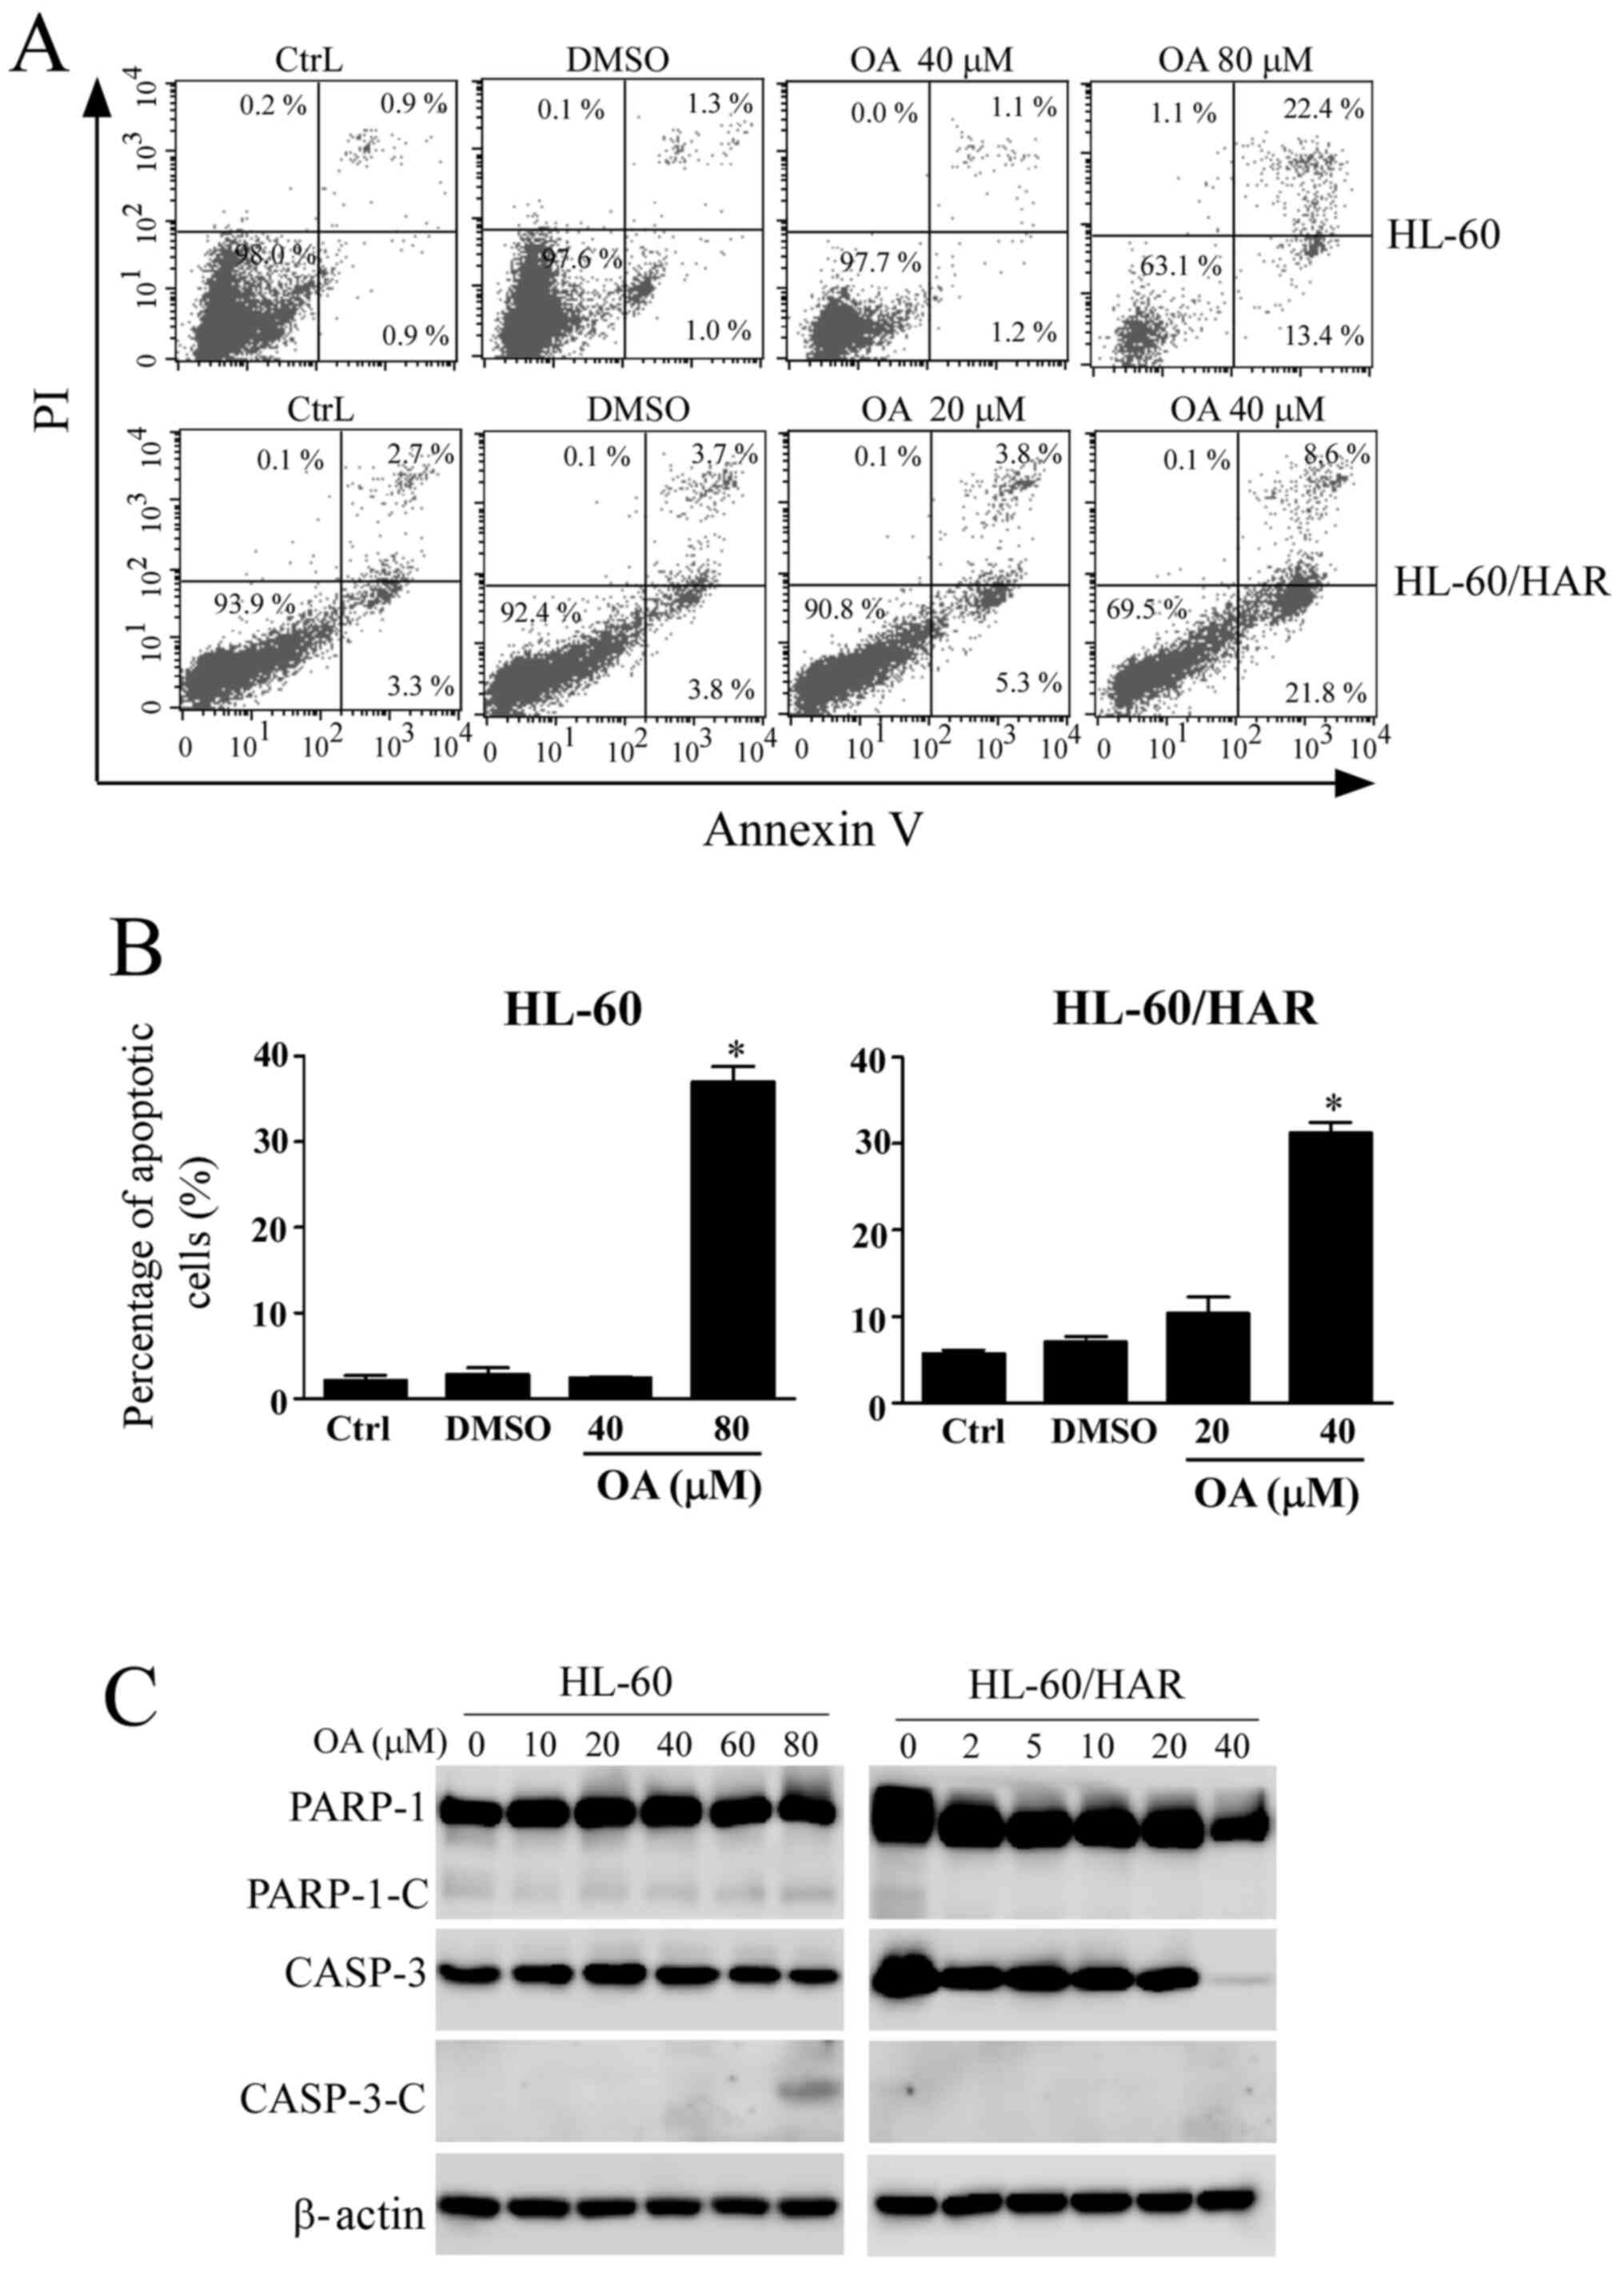
Effect of OA treatment on apoptosis in
HL-60/HAR cells
As detected using an Annexin V/PI staining assay,
the apoptotic rate of sensitive HL-60 cells was 35.8% after
exposure to 80 µM OA, whilst the apoptotic rate was 30.4% in 40 µM
OA-treated HL-60/HAR cells (Fig. 5A
and B), suggesting that HL-60/HAR
cells were more sensitive to OA compared with their parental HL-60
cells. The pattern of staining of the apoptotic markers differed
between the resistant and sensitive cell lines. Cleaved fragments
from CASP-3 and PARP-1 were observed in sensitive cells after
exposure to 80 µM OA. However, no cleavage fragments of PARP-1 were
detected in HL-60/HAR cells (Fig.
5C). In addition, lower expression levels of CASP-3 were
observed after treatment with the highest concentration of OA (40
µM), but no cleavage of CASP-3 was identified. These results
suggested that OA induces a non-classical apoptosis pathway or
other cell death pathways in resistant HL-60 cells.
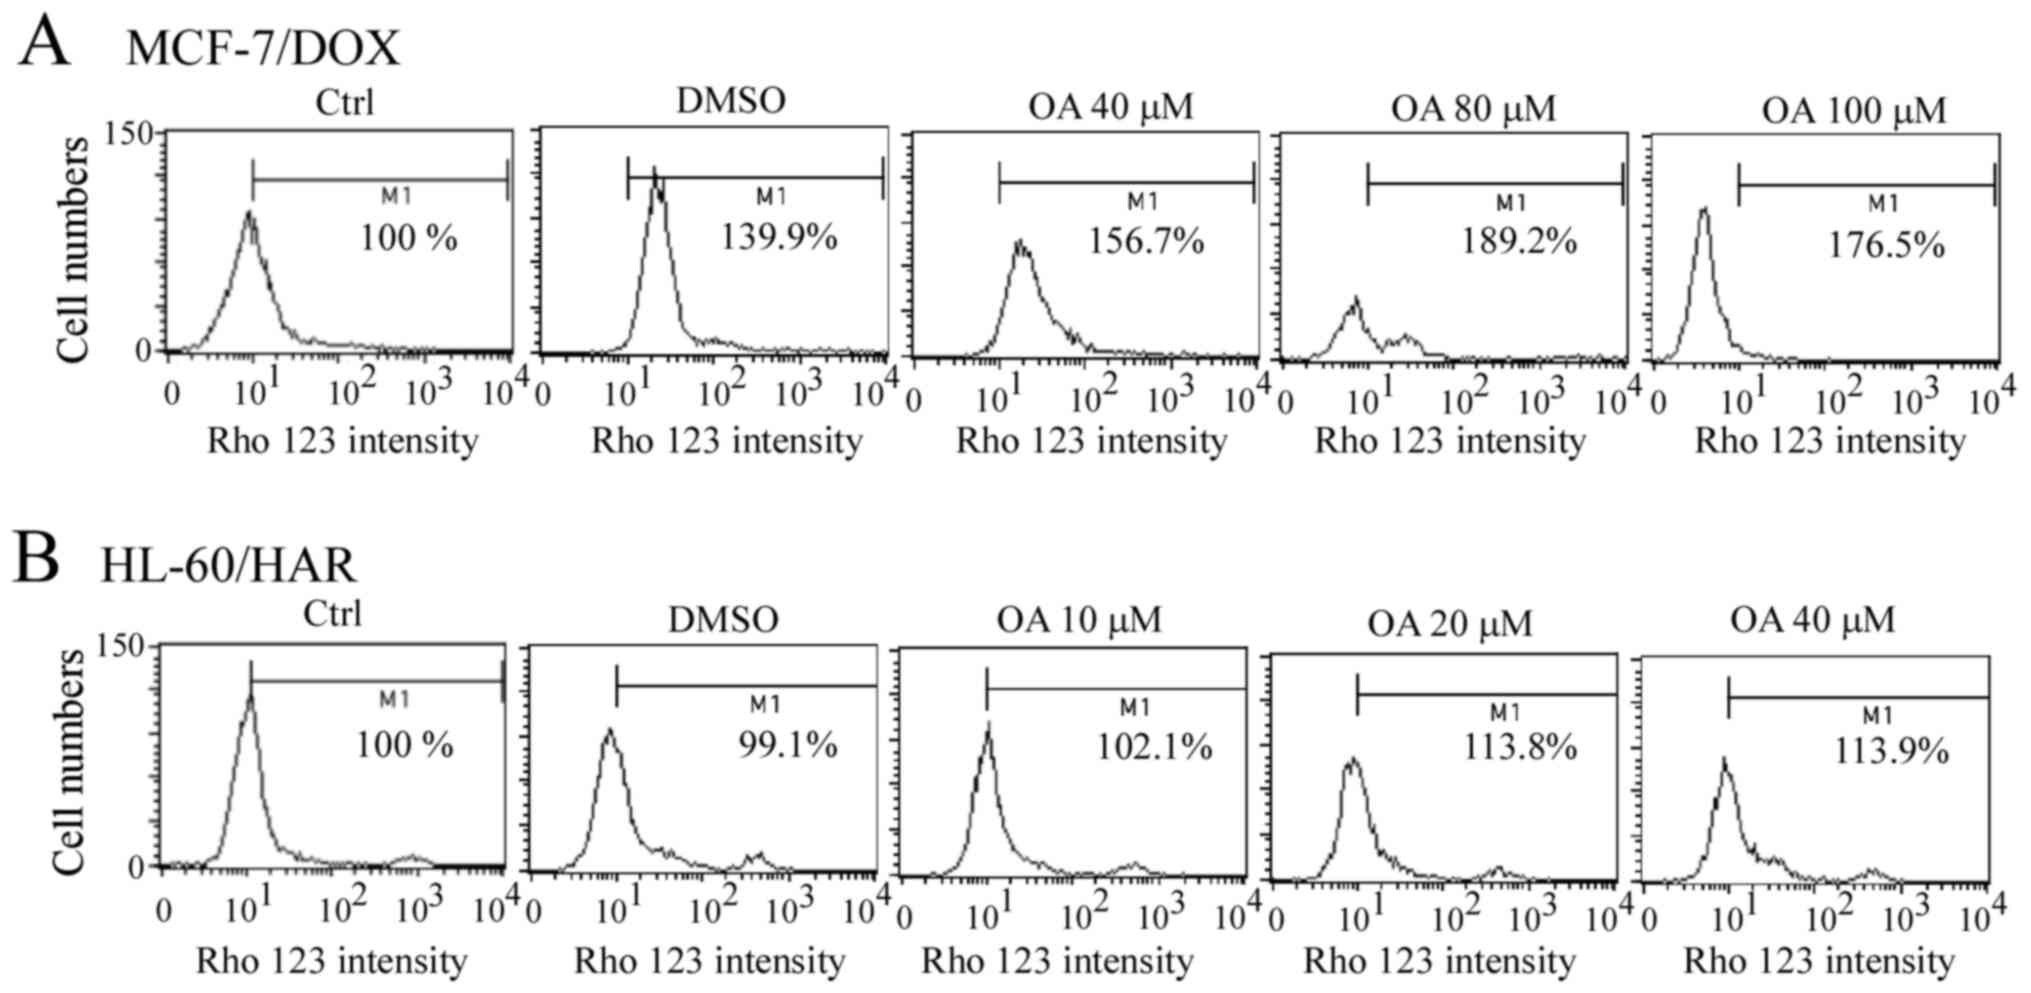
Rho 123 accumulation after exposure to
OA in both resistant cell lines
A slight accumulation of Rho 123 was observed after
the MCF-7/DOX cells were treated with OA for 1 h, but this was not
concentration-dependent (Fig. 6A).
Similarly, a slight Rho 123 accumulation was detected in HL-60/HAR
cells after OA treatment for 1 h (Fig.
6B). These results indicated that OA does not directly bind
with ABCB1.
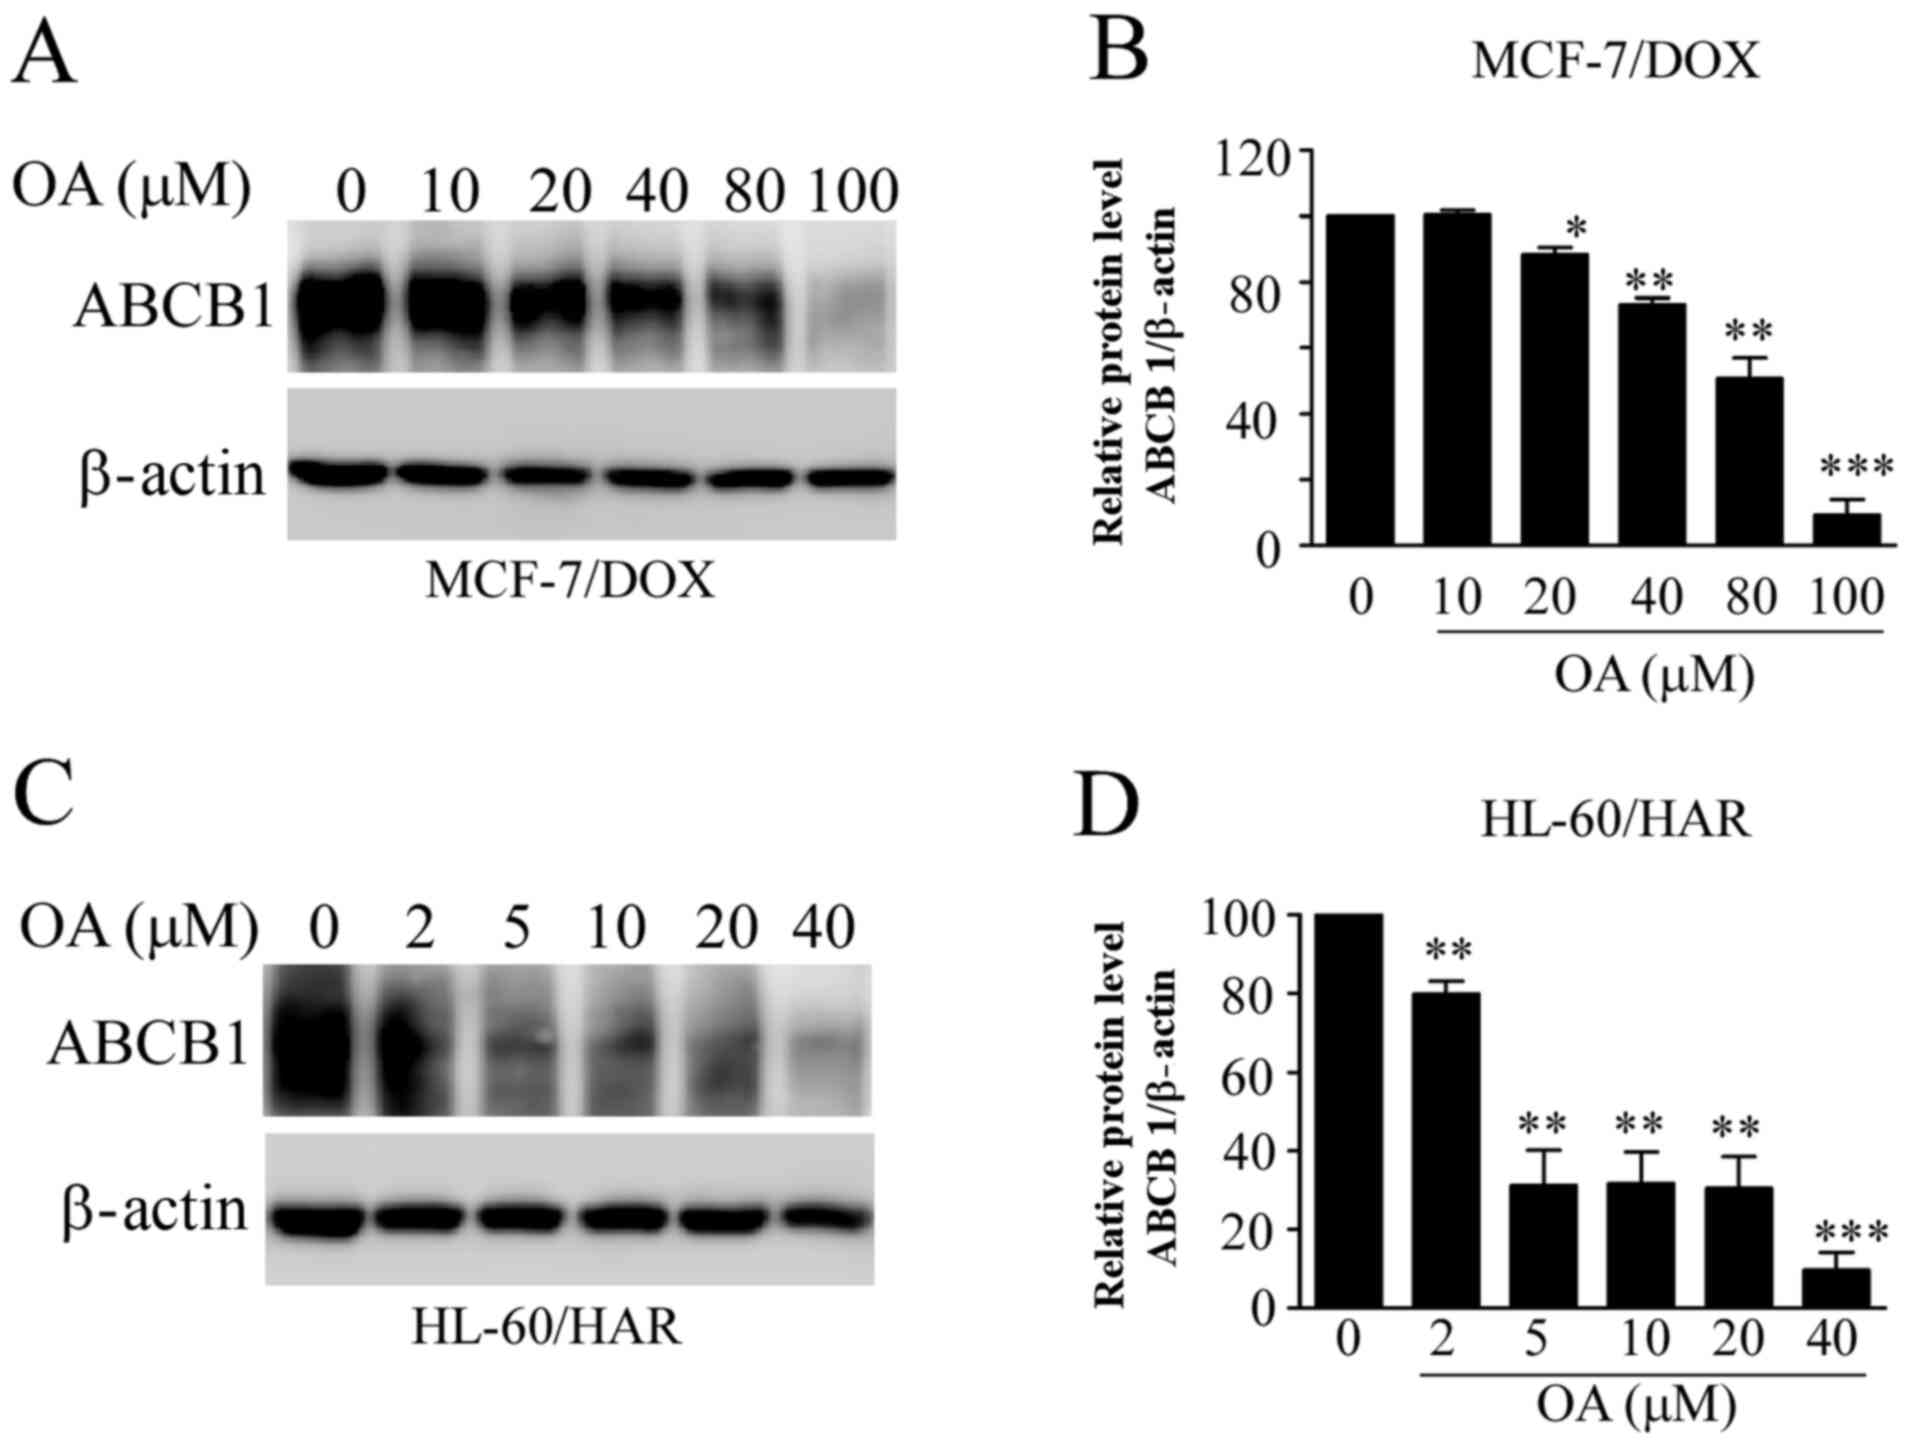
Reduction in ABCB1 protein expression
by OA in both resistant cells
ABCB1 mainly mediates multidrug resistance in tumor
cells (12). Therefore, it was
examined whether OA influences the protein expression levels of
ABCB1 in the resistant cell lines. ABCB1 protein expression levels
in both resistant cell lines were significantly decreased with
increasing OA concentrations (Fig.
7). These effects occurred at lower concentrations of OA
treatment in HL-60/HAR cells, when compared with those in MCF-7/DOX
cells (Fig. 7A and C). These findings were consistent with
aforementioned results, suggesting that HL-60/HAR cells were more
sensitive to OA compared with MCF-7/DOX cells.
Discussion
The present study characterized the effects of OA on
the cell viability and apoptosis of multidrug-resistant tumor cell
lines. The MCF-7/DOX and HL-60/HAR cell lines have multiple drug
resistance (Tables I and II). This is consistent with findings from
previous studies on these two drug-resistant cell lines (19,22).
To the best of our knowledge, the present study was the first to
demonstrate that OA can arrest the cell cycle at the G1
phase in drug-resistant cells. Although OA cannot enhance Rho 123
accumulation in drug-resistant cells, it can decrease ABCB1 protein
expression in a concentration-dependent manner. These findings
could be valuable for the clinic application of OA in tumor
therapy. Moreover, some types of drug-resistant tumor cells in
particular may be more suitable for OA treatment, such as leukemia
cells.
Accumulating evidence has revealed that OA can
arrest the cell cycle at the G1 phase in a variety of
tumor cell types, including prostate cancer PC-3 cells (3) and gallbladder cancer cells (11). In the present study, G1
arrest was induced by OA treatment in both drug-resistant cell
lines (Fig. 3). Furthermore, the
percentage of cells in G1 phase was increased after
exposure to low concentrations of OA in resistant HL-60/HAR cells,
suggesting that there is a novel mechanism of the regulation of the
G1 phase of the cell cycle in drug-resistant cells.
Induction of autophagy by OA in lung cancer A549 cells and breast
cancer MCF-7 cells has been reported in previous studies (5,24),
where G1 phase cell cycle arrest frequently occurs
during autophagy (25). Therefore,
it was hypothesized that the autophagic process may differ in the
drug-resistant cells compared with their parent cell lines.
However, further investigation is required to test this
hypothesis.
The present results suggested that OA was not a
substrate of ABCB1, which is consistent with previous studies
(15,26), which observed that OA affected MRP1
function but not ABCB1. The OA derivative, methyl
3,11-dioxoolean-12-en-28-olate, can target ABCB1(16), suggesting that the chemical
structure of OA prevents its interaction with ABCB1 protein. Since
the present study only determined ABCB1 function after OA treatment
for 2.5 h and detected Rho 123 accumulation by flow cytometry,
limitations exist of regarding this method, including the
specificity of Rho 123, as Rho 123 activity may not be
representative of ABCB1 levels. Attention should be paid to the
difference between Rho 123 accumulation and OA-induced reductions
in ABCB1 protein expression.
To the best of our knowledge, the present study was
the first to demonstrate that OA can decrease ABCB1 protein levels
(Fig. 7). However, the signaling
pathway mechanism for this reduction in ABCB1 was not investigated
in the present study. It may possibly involve the mTOR pathway
since OA has been previously reported to inhibit it's signaling
(8,17). Further investigations currently
underway to test this hypothesis.
The direct targets of OA in tumor cells remain
unknown. OA can reportedly promote the dimerization of inducible
nitric oxide synthase, thereby inhibiting hepatocellular carcinoma
growth (27). It also been reported
that transfection of CAV-1 into HL-60 cells can enhance their
sensitivity to OA (17). However,
the present results indicated that CAV-1 knockdown did not
influence the survival of MCF-7/DOX cells after OA treatment,
suggesting that CAV-1 serves an indirect role in the mechanism of
OA action. In the present study, it has not determined whether OA
treatment can increase CAV-1 expression. OA derivative,
2-Cyano-3,12-dioxoolean-1,9-dien-28-oic acid, can increase CAV-1
expression in colon cancer cells (28). Further studies are needed to
demonstrate if overexpression of CAV-1 serves a role in MCF-7/DOX
cell lines. The human leukemia HL-60 cell line lacks the
TP53 gene (29), where
introduction of the wild-type TP53 gene potentiates its
susceptibility to chemotherapy (30). It was speculated that CAV-1 may
function similarly during OA-induced apoptosis in sensitive HL-60
cells (17). OA has a selective
action on melanoma cells, but mediated no cytotoxicity towards
normal stem cells (31). In
addition, the present study demonstrated that HL-60/HAR cells are
more sensitive to OA compared with parental HL-60. These findings
suggest that the molecular target of OA should be further
investigated using drug-resistant HL-60 cells.
In conclusion, OA treatment can arrest the cell
cycle at the G1 phase in drug-resistant tumor cells and
efficiently reduce ABCB1 protein expression, indicating its
potential in reversing drug resistance. The present findings
suggested that it may be possible to effectively target certain
types of cancer using OA, such as leukemia, in the clinical
setting. In recent years, numerous dietary components have been
demonstrated to enhance the efficacy of cancer therapy, such as in
the treatment of lymphoma (32).
The present findings indicated the potential applicability of OA,
which has low toxicity and few adverse effects, for tumor
prevention and therapy.
Acknowledgements
Not applicable.
Funding
Funding: The present study was supported by Heilongjiang
Province North Medicine and Functional Food Project, Natural
Scientific Foundation of China (grant no. 31471150), The Team of
Jiamusi University Biology (grant no. jdxktd2019003), Jiamusi
University President Innovation and Entrepreneurship Fund Project
(grant no. XZYF2018-36), Jiamusi University Graduate Science and
Technology Innovation Project (grant no. LZZ2015_009) and Jiamusi
University Science and Technology School-level General Project
(grant no. 13Z1201529).
Availability of data and materials
The datasets used and/or analyzed during the present
study are available from the corresponding author on reasonable
request.
Authors' contributions
QH, PZ and JiaW conceived and designed the study.
DW, JinW, JZ, XY, JP and LL performed the experiments and analyzed
the data. DW and QH authenticated the raw data. All authors read
and approved the final manuscript.
Ethics approval and consent to
participate
Not applicable.
Patient consent for publication
Not applicable.
Competing interests
The authors declare that they have no competing
interests.
References
|
1
|
Žiberna L, Šamec D, Mocan A, Nabavi SF,
Bishayee A, Farooqi AA, Sureda A and Nabavi SM: Oleanolic acid
alters multiple cell signaling pathways: Implication in cancer
prevention and therapy. Int J Mol Sci. 18(643)2017.PubMed/NCBI View Article : Google Scholar
|
|
2
|
Ayeleso TB, Matumba MG and Mukwevho E:
Oleanolic acid and its derivatives: Biological activities and
therapeutic potential in chronic diseases. Molecules.
22(1915)2017.PubMed/NCBI View Article : Google Scholar
|
|
3
|
Liu J, Zheng L, Wu N, Ma L, Zhong J, Liu G
and Lin X: Oleanolic acid induces metabolic adaptation in cancer
cells by activating the AMP-activated protein kinase pathway. J
Agric Food Chem. 62:5528–5537. 2014.PubMed/NCBI View Article : Google Scholar
|
|
4
|
Fontana G, Bruno M, Notarbartolo M,
Labbozzetta M, Poma P, Spinella A and Rosselli S: Cytotoxicity of
oleanolic and ursolic acid derivatives toward hepatocellular
carcinoma and evaluation of NF-κB involvement. Bioorg Chem.
90(103054)2019.PubMed/NCBI View Article : Google Scholar
|
|
5
|
Liu J, Zheng L, Zhong J, Wu N, Liu G and
Lin X: Oleanolic acid induces protective autophagy in cancer cells
through the JNK and mTOR pathways. Oncol Rep. 32:567–572.
2014.PubMed/NCBI View Article : Google Scholar
|
|
6
|
Shi Y, Song Q, Hu D, Zhuang X, Yu S and
Teng D: Oleanolic acid induced autophagic cell death in
hepatocellular carcinoma cells via PI3K/Akt/mTOR and ROS-dependent
pathway. Korean J Physiol Pharmacol. 20:237–243. 2016.PubMed/NCBI View Article : Google Scholar
|
|
7
|
Wang X, Bai H, Zhang X, Liu J, Cao P, Liao
N, Zhang W, Wang Z and Hai C: Inhibitory effect of oleanolic acid
on hepatocellular carcinoma via ERK-p53-mediated cell cycle arrest
and mitochondrial dependent apoptosis. Carcinogenesis.
34:1323–1330. 2013.PubMed/NCBI View Article : Google Scholar
|
|
8
|
Mu DW, Guo HQ, Zhou GB, Li JY and Su B:
Oleanolic acid suppresses the proliferation of human bladder cancer
by Akt/mTOR/S6K and ERK1/2 signaling. Int J Clin Exp Pathol.
8:13864–13870. 2015.PubMed/NCBI
|
|
9
|
Xu Y, Shu B, Tian Y, Wang G, Wang Y, Wang
J and Dong Y: Oleanolic acid induces osteosarcoma cell apoptosis by
inhibition of Notch signaling. Mol Carcinog. 57:896–902.
2018.PubMed/NCBI View
Article : Google Scholar
|
|
10
|
Potočnjak I, Šimić L, Vukelić I and
Domitrović R: Oleanolic acid attenuates cisplatin-induced
nephrotoxicity in mice and chemosensitizes human cervical cancer
cells to cisplatin cytotoxicity. Food Chem Toxicol.
132(110676)2019.PubMed/NCBI View Article : Google Scholar
|
|
11
|
Li HF, Wang XA, Xiang SS, Hu YP, Jiang L,
Shu YJ, Li ML, Wu XS, Zhang F, Ye YY, et al: Oleanolic acid induces
mitochondrial-dependent apoptosis and G0/G1 phase arrest in
gallbladder cancer cells. Drug Des Devel Ther. 9:3017–3030.
2015.PubMed/NCBI View Article : Google Scholar
|
|
12
|
Robey RW, Pluchino KM, Hall MD, Fojo AT,
Bates SE and Gottesman MM: Revisiting the role of ABC transporters
in multidrug-resistant cancer. Nat Rev Cancer. 18:452–464.
2018.PubMed/NCBI View Article : Google Scholar
|
|
13
|
Dastvan R, Mishra S, Peskova YB, Nakamoto
RK and Mchaourab HS: Mechanism of allosteric modulation of
P-glycoprotein by transport substrates and inhibitors. Science.
364:689–692. 2019.PubMed/NCBI View Article : Google Scholar
|
|
14
|
Alam A, Kowal J, Broude E, Roninson I and
Locher KP: Structural insight into substrate and inhibitor
discrimination by human P-glycoprotein. Science. 363:753–756.
2019.PubMed/NCBI View Article : Google Scholar
|
|
15
|
Villar VH, Vögler O, Barceló F,
Gómez-Florit M, Martínez-Serra J, Obrador-Hevia A, Martín-Broto J,
Ruiz-Gutiérrez V and Alemany R: Oleanolic and maslinic acid
sensitize soft tissue sarcoma cells to doxorubicin by inhibiting
the multidrug resistance protein MRP-1, but not P-glycoprotein. J
Nutr Biochem. 25:429–438. 2014.PubMed/NCBI View Article : Google Scholar
|
|
16
|
Paszel A, Rubiś B, Bednarczyk-Cwynar B,
Zaprutko L, Kaczmarek M, Hofmann J and Rybczyńska M: Oleanolic acid
derivative methyl 3,11-dioxoolean-12-en-28-olate targets multidrug
resistance related to ABCB1. Pharmacol Rep. 63:1500–1517.
2011.PubMed/NCBI View Article : Google Scholar
|
|
17
|
Ma W, Wang DD, Li L, Feng YK, Gu HM, Zhu
GM, Piao JH, Yang Y, Gao X and Zhang PX: Caveolin-1 plays a key
role in the oleanolic acid-induced apoptosis of HL-60 cells. Oncol
Rep. 32:293–301. 2014.PubMed/NCBI View Article : Google Scholar
|
|
18
|
Chen J, Chen Y and He Q: Action of
bleomycin is affected by bleomycin hydrolase but not by caveolin-1.
Int J Oncol. 41:2245–2252. 2012.PubMed/NCBI View Article : Google Scholar
|
|
19
|
He Q, Zhou W, Ji L, Zhang H, He N and Xue
S: Characteristics of harringtonine-resistant human leukemia HL60
cell. Zhongguo Yao Li Xue Bao. 17:463–467. 1996.PubMed/NCBI
|
|
20
|
Zhang J, Chen Y and He Q: Distinct
characteristics of Dasatinib-induced pyroptosis in gasdermin
E-expressing human lung cancer A549 cells and neuroblastoma SH-SY5Y
cells. Oncol Lett. 20:145–154. 2020.PubMed/NCBI View Article : Google Scholar
|
|
21
|
Nasim F, Schmid D, Szakács G, Sohail A,
Sitte HH, Chiba P and Stockner T: Active transport of rhodamine 123
by the human multidrug transporter P-glycoprotein involves two
independent outer gates. Pharmacol Res Perspect.
8(e00572)2020.PubMed/NCBI View
Article : Google Scholar
|
|
22
|
Fairchild CR, Ivy SP, Kao-Shan CS,
Whang-Peng J, Rosen N, Israel MA, Melera PW, Cowan KH and Goldsmith
ME: Isolation of amplified and overexpressed DNA sequences from
Adriamycin-resistant human breast cancer cells. Cancer Res.
47:5141–5148. 1987.PubMed/NCBI
|
|
23
|
Kaufmann SH, Desnoyers S, Ottaviano Y,
Davidson NE and Poirier GG: Specific proteolytic cleavage of
poly(ADP-ribose) polymerase: An early marker of
chemotherapy-induced apoptosis. Cancer Res. 53:3976–3985.
1993.PubMed/NCBI
|
|
24
|
Gao L, Wang Y, Xu Z, Li X, Wu J, Liu S,
Chu P, Sun Z, Sun B, Lin Y, et al: SZC017, a novel oleanolic acid
derivative, induces apoptosis and autophagy in human breast cancer
cells. Apoptosis. 20:1636–1650. 2015.PubMed/NCBI View Article : Google Scholar
|
|
25
|
Tasdemir E, Maiuri MC, Tajeddine N, Vitale
I, Criollo A, Vicencio JM, Hickman JA, Geneste O and Kroemer G:
Cell cycle-dependent induction of autophagy, mitophagy and
reticulophagy. Cell Cycle. 6:2263–2267. 2007.PubMed/NCBI View Article : Google Scholar
|
|
26
|
Braga F, Ayres-Saraiva D, Gattass CR and
Capella MA: Oleanolic acid inhibits the activity of the multidrug
resistance protein ABCC1 (MRP1) but not of the ABCB1
(P-glycoprotein): Possible use in cancer chemotherapy. Cancer Lett.
248:147–152. 2007.PubMed/NCBI View Article : Google Scholar
|
|
27
|
Wang H, Zhong W, Zhao J, Zhang H, Zhang Q,
Liang Y, Chen S, Liu H, Zong S, Tian Y, et al: Oleanolic acid
inhibits epithelial-mesenchymal transition of hepatocellular
carcinoma by promoting iNOS dimerization. Mol Cancer Ther.
18:62–74. 2019.PubMed/NCBI View Article : Google Scholar
|
|
28
|
Chintharlapalli S, Papineni S, Konopleva
M, Andreef M, Samudio I and Safe S:
2-Cyano-3,12-dioxoolean-1,9-dien-28-oic acid and related compounds
inhibit growth of colon cancer cells through peroxisome
proliferator-activated receptor gamma-dependent and -independent
pathways. Mol Pharmacol. 68:119–128. 2005.PubMed/NCBI View Article : Google Scholar
|
|
29
|
Wolf D and Rotter V: Major deletions in
the gene encoding the p53 tumor antigen cause lack of p53
expression in HL-60 cells. Proc Natl Acad Sci USA. 82:790–794.
1985.PubMed/NCBI View Article : Google Scholar
|
|
30
|
Ju JF, Banerjee D, Lenz HJ, Danenberg KD,
Schmittgen TC, Spears CP, Schönthal AH, Manno DJ, Hochhauser D,
Bertino JR, et al: Restoration of wild-type p53 activity in
p53-null HL-60 cells confers multidrug sensitivity. Clin Cancer
Res. 4:1315–1322. 1998.PubMed/NCBI
|
|
31
|
Oprean C, Ivan A, Bojin F, Cristea M,
Soica C, Drăghia L, Caunii A, Paunescu V and Tatu C: Selective in
vitro anti-melanoma activity of ursolic and oleanolic acids.
Toxicol Mech Methods. 28:148–156. 2018.PubMed/NCBI View Article : Google Scholar
|
|
32
|
Kanarek N, Petrova B and Sabatini DM:
Dietary modifications for enhanced cancer therapy. Nature.
579:507–517. 2020.PubMed/NCBI View Article : Google Scholar
|