Introduction
Diabetic nephropathy (DN) is one of the most serious
complications of diabetes mellitus (DM) (1). According to the International Diabetes
Federation, there were 370 million patients with DM worldwide in
2011; this number is estimated to reach 550 million in
2030(2). With the increasing
incidence of DM, DN has become one of the major causes of chronic
renal failure; ~24.8% of renal failure cases are caused by DN
(3). DN can induce lesions in the
glomerulus and renal tubules, which eventually cause
glomerulosclerosis and tubular fibrosis (4).
The cytokine transforming growth factor-β1 (TGF-β1)
exerts a strong effect on fibrosis; the Smad signaling pathway is
considered to be the main signal transduction pathway of TGF-β1,
and the activation of this pathway serves an important role in the
pathogenesis of DN (5). Under
high-glucose conditions, a variety of kidney cells secrete TGF-β1,
which binds to the TGF-βII receptor (Tβ RII), activating TGF-βI
receptor (Tβ RI) kinase, leading to the phosphorylation of Smad2
and Smad3 proteins and the formation of a protein complex with
Smad4 (6,7). This activation results in changes of
the inherent phenotype of renal cells that promote the accumulation
of extracellular matrix (ECM), which serves a key role in the
development of tubulointerstitial fibrosis (6). Previous studies have demonstrated that
the transcriptional co-inhibition factor Ski-related novel protein
N (SnoN) antagonizes the fibrosis induced by the TGF-β1/Smads
signaling pathway (7,8). The inhibition of SnoN promotes renal
fibrosis, and the restoration of SnoN expression reduces or delays
the development of renal fibrosis (9,10),
which suggests that the decrease in the SnoN protein levels is
involved in the incidence and development of renal fibrosis.
Since cytoplasmic SnoN exerts a biological effect of
a ‘switch’ in the TGF-β1/Smads signaling pathway, the expression of
this protein is tightly regulated by TGF-β1 in terms of both
transcriptional activation and protein stability (11). TGF-β1 upregulates SnoN transcription
in cancer cells and kidney tissue of rats with unilateral ureteral
obstruction (12,13). Other studies have demonstrated that
TGF-β1 rapidly and significantly reduces the expression of SnoN
protein through specific recognition of the E3 ubiquitin enzymes
Arkadia and Smad ubiquitin regulatory factor 2 (Smurf2), which
enhances the ubiquitin-mediated degradation of SnoN via activated
Smads (13,14). Furthermore, SnoN protein levels
during the development of DN are caused by a defect in protein
stability mediated by TGF-β-activated kinase 1 (TAK1) (15). TAK1 mediates the phosphorylation of
SnoN, resulting in SnoN ubiquitination and eventual degradation,
which enhances the epithelial-mesenchymal transition (EMT) and ECM
deposition to promote renal fibrosis during DN (15,16).
Controlling blood glucose may inhibit the development of DN
(17,18). However, further studies are needed
to characterize the association between blood glucose control and
renal injury in DM rats and to determine whether SnoN is a target
for delaying and reversing DN lesions. The present study aimed to
examine the effects of insulin-controlled blood glucose on DN
fibrosis development and the expression levels of Smurf2, Arkadia
and SnoN in renal tissues. The present study investigated changes
of SnoN in DN fibrosis, which may provide a theoretical basis for
clinical treatment of DN with novel effective targets.
Materials and methods
Experimental animals
Male Sprague-Dawley rats (weight, 160-200 g; age,
6-8 weeks) were purchased from Beijing Fukang Biotechnology Co.
Ltd. [license no. SCXK (Jing) 2009-0004] and maintained in the
animal center of Guizhou Medical University (Guizhou, China). The
rats were housed in a room with a stable ambient temperature of
18-22˚C in wire cages with free access to a standard diet and tap
water. The study was conducted in accordance with the guidelines of
the National Health and Medical Research Council of China's code
for the care and use of animals for scientific purposes and was
approved by the Animal Experimental Ethical Inspection Form of
Guizhou Medical University (approval no. 1503092). The blood
glucose levels were measured in all rats prior to the start of the
experiment using a glucometer (Johnson & Johnson). The rats
were randomly allocated into three groups (n=6 rats/group): i)
Normal control (NC); ii) diabetes mellitus (DM); and iii) insulin
treatment (INS). The DM model was established by tail-vein
administration of 55 mg/kg streptozotocin (STZ; MilliporeSigma).
STZ was dissolved in 0.1 M citrate buffer (pH 4.5). The NC group
received the same volume of the vehicle. On day 3 post-STZ
injection, fasting glycemic measurements were performed on blood
samples (20-50 µl) from the tail vein, and animals with blood
glucose levels ≥16.7 mmol/l for ≥3 days were considered
diabetic.
Anesthesia and euthanasia
The use of ether was approved by the ethics
committee. For anesthesia, the rats were placed into a glass jar
with a small beaker containing a cotton ball soaked with 10 ml
ether and observed. When the tension of the limbs of the animal was
reduced and the corneal reflex was dull, the onset of anesthesia
was confirmed. During the course of the experiment, the changes in
the depth of anesthesia were observed and, if necessary, the ether
beaker was placed on the nose of the animals to maintain the
anesthesia. Under anesthesia, blood was drawn from the femoral
artery, and the rats were sacrificed by cervical dislocation.
Experimental protocol
Diabetic rats were randomly divided into two groups.
For the DM group, diabetes was induced and lasted for 16 weeks. For
the INS group, at 12 weeks post-diagnosis, insulin glargine (8-16
U/kg; Sanofi) was injected daily for 4 weeks to maintain blood
glucose <10 mmol/l. The NC and DM groups received daily
injections of equivalent volumes of citrate buffer. Blood samples
were obtained from the tail vein. During insulin treatment, blood
glucose levels were measured twice daily, and body weights were
obtained weekly.
After completing the treatment, 24-h urine of each
rat was collected, the total urine volume was recorded, and the
rats were sacrificed. The urine volume was measured, and 24-h urine
protein was tested with a Beckman 1650 automated biochemical
analyzer (Beckman Coulter, Inc.). Urine protein excretion (mg/24 h)
was assessed as urine protein (mg/ml) x urine volume (ml)/24 h.
Additionally, tail vein blood was collected to assess the
glycosylated hemoglobin A1 (HbA1c) levels.
At the end of the study, the rats were sacrificed
under anesthesia following a 6 h fasting period. The serum was
prepared by centrifugation (2,750 x g; 15 min, 4˚C) from the
femoral artery for the detection of blood glucose. The kidneys of
rats were collected; one kidney from each rat was preserved at
-80˚C for western blot analysis and reverse
transcription-quantitative (RT-q)PCR, whereas the other was fixed
with 4% paraformaldehyde (24 h; room temperature) for histological
and immunohistochemical evaluation.
H&E staining
The paraffin-embedded kidney sections (3 µm) were
baked in the oven at 60˚C for 1 h, placed in two cylinders of
xylene successively, each for 10 min, then placed in 100, 100, 95,
95, 95 and 80% ethanol for 5 min each, washed with distilled water
for 5 min and then stained with 0.5% hematoxylin for 1-2 min (room
temperature). After soaking in water for 15 min, sections were dyed
with 1% eosin for 2-5 min (room temperature) and washed with water.
The samples were dehydrated with 80, 95, 95, 100 and 100% ethanol
for 2 sec each, then passed through xylene Ⅰ and xylene Ⅱ for 2 min
each. The samples were sealed with neutral gum and observed under
the light microscope (magnification, x200 and x400; 8
samples/group; 10 randomly selected fields of view/sample).
Masson staining
Paraffin-embedded renal sections were prepared as
aforementioned. Sections were stained with 0.5% hematoxylin for 4-5
min (room temperature) and washed with water for 2 min. Sections
underwent 0.5% hydrochloric acid alcohol differentiation for 10-30
sec at room temperature before being washed with water for 5 min
and stained with Masson complex staining solution for 4-5 min (room
temperature). After washing with 0.2% acetic acid solution, 5%
phosphomolybdic acid solution was added (room temperature) for 5-10
min, followed by further washing with 0.2% acetic acid solution.
Sections were exposed to 2% aniline blue solution for 10-30 sec
(room temperature), washed with absolute ethanol and allowed to
dry. The samples were sealed with neutral gum and observed under
the light microscope (magnification, x200 and x400; 8
samples/group; 10 randomly selected fields of view/sample).
Immunohistochemical staining
Paraffin-embedded renal sections (thickness, 4 µm)
were baked in the oven at 60˚C for 1 h and placed into three
cylinders of xylene successively (10 min each), followed by 100,
100, 95, 90, 80 and 70% ethanol for 5 min each. After washing with
ddH2O for 5 min, 3% H2O2, was
added at room temperature in dark for 10 min before washing with
ddH2O for 5 min. Antigen repair was performed using a
microwave (100˚C, 3 times, 7 min each). After cooling, each piece
was sealed with 5% bovine serum albumin (Beijing Solarbio Science
& Technology Co., Ltd.) at room temperature for 1 h. The
sections were incubated with rabbit collagen (Col)-III primary
antibody (1:100; ProteinTech Group, Inc.; cat. no. 22734-1-AP)
overnight at 4˚C. The sections were rewarmed for 30 min (room
temperature) and washed 3 times with TBST (0.08% Tween-20) for 5
min each. Corresponding biotinylated secondary antibody (1:100;
Beijing Zhongshan Jinqiao Biotechnology; cat. no. PV-6001) was
added at room temperature for 1 h. Following washing for 10 min
with TBST (three times), Avidin/Biotinylated HRP complex was added
at room temperature for 30 min and sections were washed with
ddH2O for 5 min. DAB was used to develop color (5 min;
room temperature). After washing with ddH2O for 5 min,
0.5% hematoxylin was added for 1-5 min (room temperature). After
washing with water, sections were dehydrated using a gradient of
70, 80, 90, 95 and 100% ethanol for 5 min each. After soaking in
xylene three times (1 min each), samples were sealed with neutral
gum and observed under the light microscope (magnification, x200
and x400; 8 samples/group; 10 randomly selected fields of
view/sample).
Immunofluorescence
The renal tissue was frozen and fixed with 3.7%
paraformaldehyde at room temperature for 10 min. Following blocking
with 10% donkey serum (Jackson ImmunoResearch Labor atories, Inc.)
for 1 h at room temperature), the samples were incubated overnight
with antibodies against E-cadherin (1:50; cat. no. 20874-1-AP;
ProteinTech Group, Inc.) at 4˚C. E-cadherin expression was detected
with Cy3-conjugated goat anti-mouse secondary antibodies (room
temperature, 1 h; 1:50; cat. no. PMK-014-096S; Wuhan Pomeike
Biotechnology Co., Ltd.). DAPI was used as a counterstain, and
fluorescence was detected under a Leica DM4000B microscope Leica
Microsystems GmbH; magnification, x200 and x400.
Cell culture and transfection
NRK-52E cells (Kunming Cell Bank, Chinese Academy of
Sciences) were cultured in Dulbecco's modified Eagle's medium
(HyClone; Cytiva) supplemented with 5% fetal bovine serum (Gibco;
Thermo Fisher Scientific, Inc.) and 5.5 mmol/l glucose in
25-cm2 culture flasks in an incubator with 5%
CO2 at 37˚C. Prior to changing to a serum-free medium
for 20 h to maintain the pace of growth or following transfection,
the cells were treated with the following media: i) Normal glucose
(NG group, 5.5 mmol/l glucose, cultured for 48 h; ii) high-glucose
control (HG) group, 5.5 mmol/l glucose +19.5 mmol/l D-glucose,
cultured for 48 h; iii) high glucose to normal glucose (HG to NG)
group, cultured under high-glucose medium for 24 h and then
transferred to normal glucose medium for another 24 h. Transient
transfection of NRK-52E cells was performed using
Lipofectamine® 3000 (Invitrogen; Thermo Fisher
Scientific, Inc.) according to the manufacturer's instructions.
Transfection was started when 50-60% of cells were fused. DMEM
culture medium, 6 µl Lipofectamine® 3000 and 3 µg Skil
shRNA plasmid were mixed and placed in a sterile environment for 20
min. After the transfection reagent was added to the cells and
cultured for 6 h (37˚C), the culture medium was replaced. Following
48 h culturing (37˚C) in high-glucose medium, the cells were
collected for western blotting to detect the corresponding protein
expression levels (SnoN, E-cadherin, α-SMA). The Skil shRNA (Sh
Skil) plasmid was manufactured by Guangzhou RiboBio Co., Ltd., and
the sequences were as follows: Sh Skil sense, 5'-CCGGGA
TTCATCGGTCTCAAATAATCTCGAGATTATTTGAGAC CGATGAATCTTTTTG-3' and
antisense, 5'-AATTCAAAAA GATTCATCGGTCTCAAATAATCTCGAGATTATTTGAG
ACCGATGAATC-3'; and scrambled control shRNA sense,
5'-CCGGCAACAAGATGAAGAGCACCAACTCGAGTTG GTGCTCTTCATCTTGTTGTTTTTG-3'
and antisense, 5'-AATTCAAAAACAACAAGATGAAGAGCACCAACTC
GAGTTGGTGCTCTTCATCTTGTTG-3'.
Western blotting
Renal tissue samples were homogenized in lysis
buffer (Beyotime Institute of Biotechnology). After grinding for 2
min in a high-speed automatic grinding machine, the supernatant was
centrifuged at 4˚C (16,502 x g, 15 min) and the protein
concentration of each sample was detected by BCA kit. Proteins were
separated by 10% SDS-PAGE, then PVDF membrane was transferred and
sealed, using 50 g/l skimmed milk at room temperature for 1 h.
Rabbit TGF-β1 (1:500; Santa Cruz Biotechnology, Inc.; cat
sc-130348), SnoN (1:1,000; Abcam; cat ab58846), Smurf2 (1:1,000;
Cell Signaling Technology, Inc.; cat 12024s), mouse Arkadia (1:500;
Santa Cruz Biotechnology, Inc.; cat sc-134270), rabbit E-cadherin
(1:1,000; ProteinTech Group, Inc.; cat 20874-1-AP), α-SMA (1:1,000;
ProteinTech Group, Inc.; cat 14395-1-AP), phospho(p)-Smad2
(1:1,000; Cell Signaling Technology, Inc.; cat 18338S), Smad2
(1:500; Santa Cruz Biotechnology, Inc.; cat sc-101153), p-Smad3
(1:1,000; Cell Signaling Technology, Inc.; cat 9520S), Smad3
(1:1,000; Abcam; cat ab40854) and β-actin (1:4,000; cat. no.
PMK083S; Wuhan Pomeike Biotechnology Co., Ltd.) antibodies were
added and incubated overnight at 4˚C. After washing three times
with TBST, corresponding horseradish peroxidase-labeled secondary
IgG (1:8,000; BioPM; cat. no. PMK083S) was added and incubated at
room temperature for 1 h. After washing three times with TBST,
proteins were detected using an enhanced chemiluminescence system
(Tanon-5200; Tanon Science and Technology Co., Ltd.) and ECL
Hyperfilm (Smart Life Sciences, Ltd.; cat. no. H31500).
RNA extraction and RT-qPCR
Total RNA was extracted from renal tissues using an
RNA extraction kit (Tiangen Biotech Co., Ltd.) and
reverse-transcribed (30 cycles of 94˚C for 45 sec, 60˚C for 45 sec
and 72˚C for 2 min, followed by final extension for 7 min at 72˚C)
using a Takara RNA PCR kit (Takara Biotechnology Co., Ltd.; cat
RR037A). The cDNA was amplified in a gradient thermal cycler
(initial denaturation at 95˚C for 30 sec, followed by 40 cycles of
95˚C for 5 sec and 60˚C for 30-34 sec) (Bio-Rad Laboratories, Inc.)
using a SYBR® Green Supermix (Bio-Rad Laboratories,
Inc.). The Cq values and relative expression levels between SnoN
and β-actin were calculated using the 2-ΔΔCq method
(19). The primer sequences were as
follows: SnoN forward, 5'-GTCTGGAGTGTTGTGG AATGTTT-3' and reverse,
5'-TTCAGTTTCTTTTCTTCAGG TGT-3' (163 bp); and β-actin forward,
5'-GCCAACACAGTG CTGTCT-3' and reverse, 5'-AGGAGCAATGATCTTGAT CTT-3'
(114 bp).
Immunoprecipitation
Immunoprecipitation was performed using an
Immunoprecipitation kit Dynabeads® Protein G (Thermo
Fisher Scientific, Inc.; cat. no. 88804) according to the
manufacturer's instructions. Renal tissue samples were homogenized
in lysis buffer (500 µl; Beyotime Institute of Biotechnology) and
the proteins were incubated with agarose beads (20-100 µl) coupled
with SnoN antibody (1:1,000; Abcam; cat ab58846). To remove
non-specific binding, samples were mixed and washed with Wash
Buffer and gently vortexed to mix. The tube was placed into a
magnetic stand to collect the beads and the supernatant was
discarded. Then, 1 ml IP Lysis/Wash Buffer was added to the tube
and gently vortexed for 1 min. Beads were collected with the
magnetic stand and supernatant was discarded. This process was
repeated three times. Immunoprecipitated proteins were eluted by
adding 50 µl Elution Buffer to the tube at room temperature for 10
min. Beads were magnetically separated and supernatant containing
the target antigen was collected. To neutralize the low pH, 5 µl
Neutralization Buffer/50 µl eluate was added. The SnoN
ubiquitylation was determined by incubation with rabbit ubiquitin
(UB) antibody (4˚C overnight; 1:100; Abcam; cat. no. ab140601).
Malonaldehyde (MDA) and catalase (CAT)
assays
A total of 0.02 g renal tissue was weighed and
normal saline was added in a body weight:volume of 1:9. The 10%
homogenate was made by homogenizer (cat. no. SCIENTZ-48; Ningbo
Scientz Biotechnology Co., Ltd.), and the supernatant was
centrifuged at 4˚C (16,502 x g; 15 min). MDA content and CAT
activity were assessed using commercial kits (cat. nos. A003-1-2
and A007-1-1, respectively; both Nanjing Jiancheng Bioengineering
Research Institute) according to the manufacturer's
instructions.
Statistical analysis
Each experiment was repeated at least twice. Data
are presented as the mean ± SD. Statistical analysis was performed
using the SPSS 23.0 (IBM Corp.) and GraphPad Prism 8.0.2 (GraphPad
Software, Inc.) software. Differences were analyzed using one-way
analysis of variance (ANOVA) followed by the least significant
difference post hoc test for multiple comparisons. P<0.05 was
considered to indicate a statistically significant difference.
Results
Insulin treatment reverses STZ-induced
changes in diabetes-associated parameters
Fasting blood glucose (Fig. 1A), HbA1c (Fig. 1B), 24-h urine protein (Fig. 1C) and malondialdehyde (MDA; Fig. 1F) levels were increased in the DM
group compared with those in the NC group (all P<0.05), whereas
the body weight (Fig. 1D) and
catalase (CAT) activity (Fig. 1E)
were significantly decreased (both P<0.05). Compared with DM
group, insulin group exhibited a decrease in fasting blood glucose,
HbA1c, 24-h urine protein and MDA levels, whereas the body weight
and CAT levels were increased compared with those in the DM group
(P<0.05). These results suggested that the diabetic rat model
was successfully established using STZ and that insulin affected
the STZ-induced changes in blood glucose and body weight. The
increases in the 24-h urine protein levels in the DM group compared
with those in the NC group indicated the development of DN.
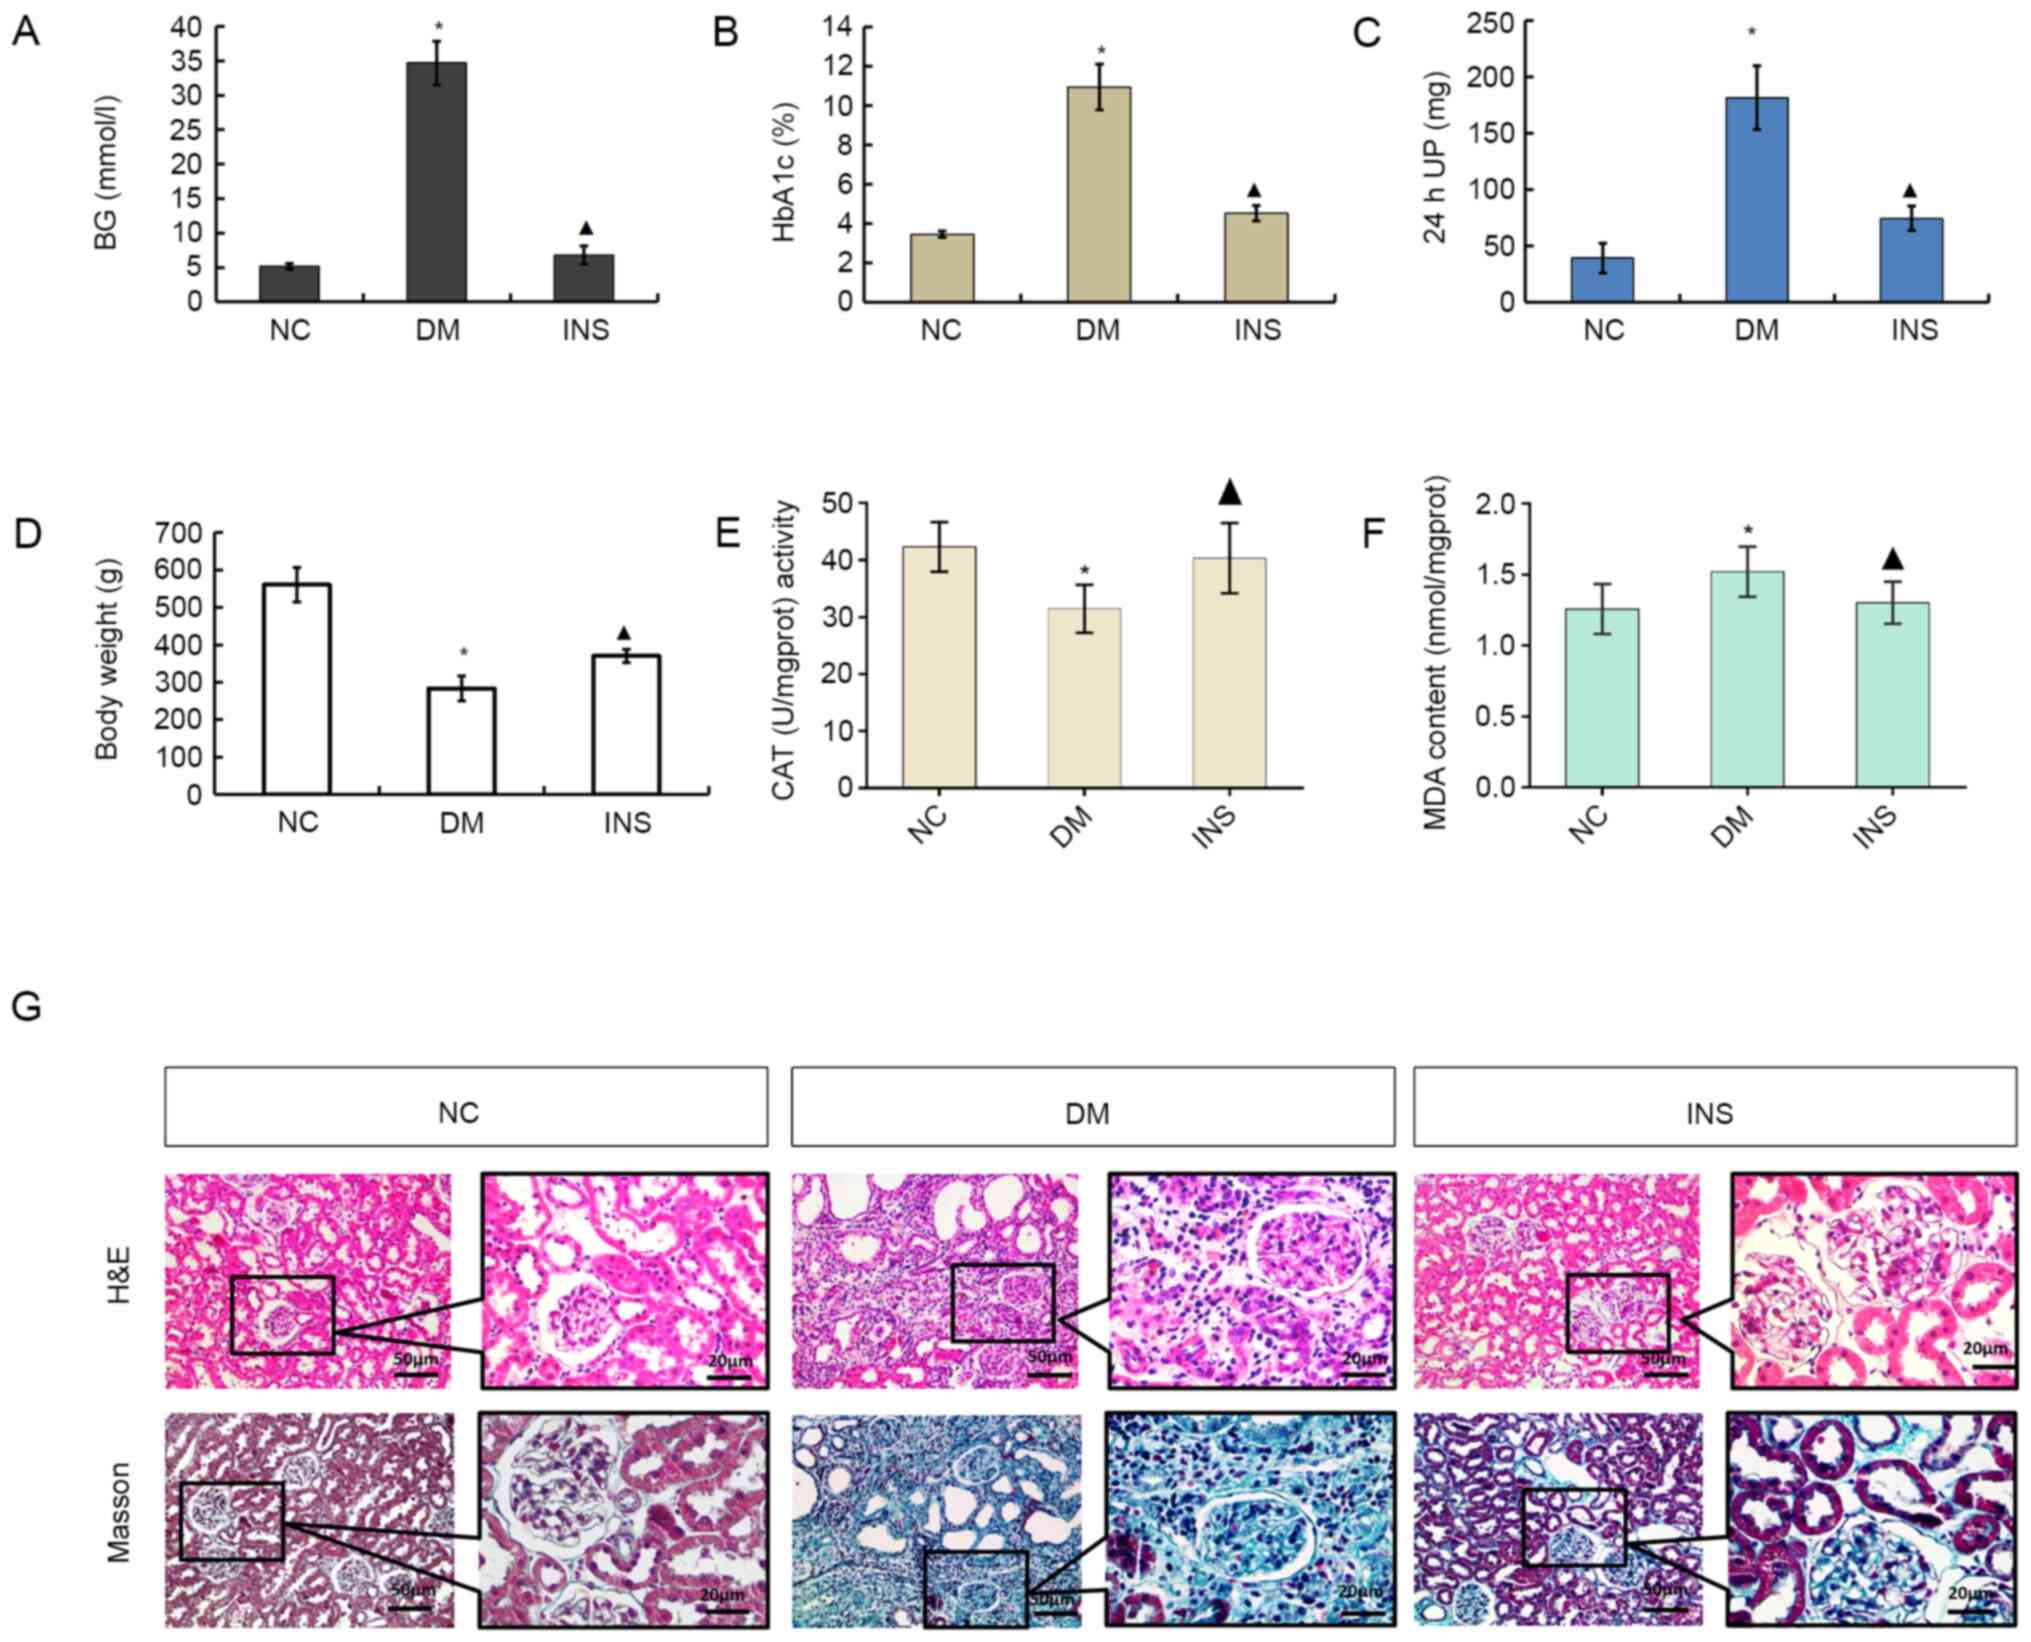 | Figure 1STZ-induced changes in (A) BG, (B)
HbA1c, (C) 24 h UP, (D) body weight, (E) CAT and (F) MDA levels.
n=8. *P<0.05 vs. NC; ▲P<0.05 vs. DM.
(G) Histological changes in kidneys in each group. Magnification,
x200 and x400. Black box indicates the enlarged area of fibrosis.
STZ, streptozotocin; HbA1c, glycosylated hemoglobin A1; 24 h UP,
24-h urine protein; CAT, catalase; MDA, malondialdehyde; NC, normal
control; DM, diabetes mellitus; INS, insulin. |
To analyze the therapeutic effects of insulin on the
kidney, renal pathology was examined with H&E and Masson
staining (Fig. 1G). Pathological
changes in the kidneys of rats in the DM were observed; the
glomerular volume and tubulointerstitial area increased, and the
tubulointerstitial area of the DM group appeared larger compared
with that of the NC group. Collagen serves a critical structural
role in the renal fibrosis of DN (20). The results of light microscopy
following Masson staining revealed that the extent of Col-III
accumulation in the kidneys of the DM group appeared to be higher
compared with that in the NC group; this effect was decreased by
insulin treatment.
Insulin reverses HG-induced EMT and
ECM accumulation
Consistent with the results of Masson staining,
western blotting data suggested that the levels of p-Smad2
(Ser465/467) and p-Smad3 (Ser423/425) in the DM group were higher
compared with those in the NC group (P<0.05; Fig. 2A and B). Compared with those in the DM group,
the levels of p-Smad2 and p-Smad3 were significantly decreased in
the INS group (P<0.05). Excessive ECM deposits in the kidneys
are a hallmark of tubulointerstitial fibrosis. High expression
levels of TGF-β1 directly induce the deposition of ECM under HG
conditions and stimulate renal tubular epithelial cells to
differentiate into myofibroblasts, which leads to excessive
deposition of ECM and the development of tubulointerstitial
fibrosis (21). Therefore, the
present study further assessed the effects of insulin treatment on
Col-III, E-cadherin and α-SMA expression levels in the renal
tissues of DM rats. The levels of TGF-β1, collagen III and α-SMA
significantly increased, whereas the protein levels of E-cadherin
decreased in the DM group compared with those in the NC group
(P<0.05; Fig. 2C and D). Following insulin treatment, the
expression levels of TGF-β1, Col-III and α-SMA decreased, and the
levels of E-cadherin protein increased compared with those in the
DM group (Fig. 2C and D). In addition, immunofluorescence
analysis revealed that E-cadherin was mainly expressed in the renal
tubular epithelial membrane in the NC group, which was decreased in
the DM group; compared with that in the DM group, E-cadherin
expression in the INS group was restored (Fig. 2E). Immunohistochemical staining
demonstrated that the expression of Col-III in the DM group was
increased compared with that in the NC group, and this effect was
reversed by insulin treatment (Fig.
2F).
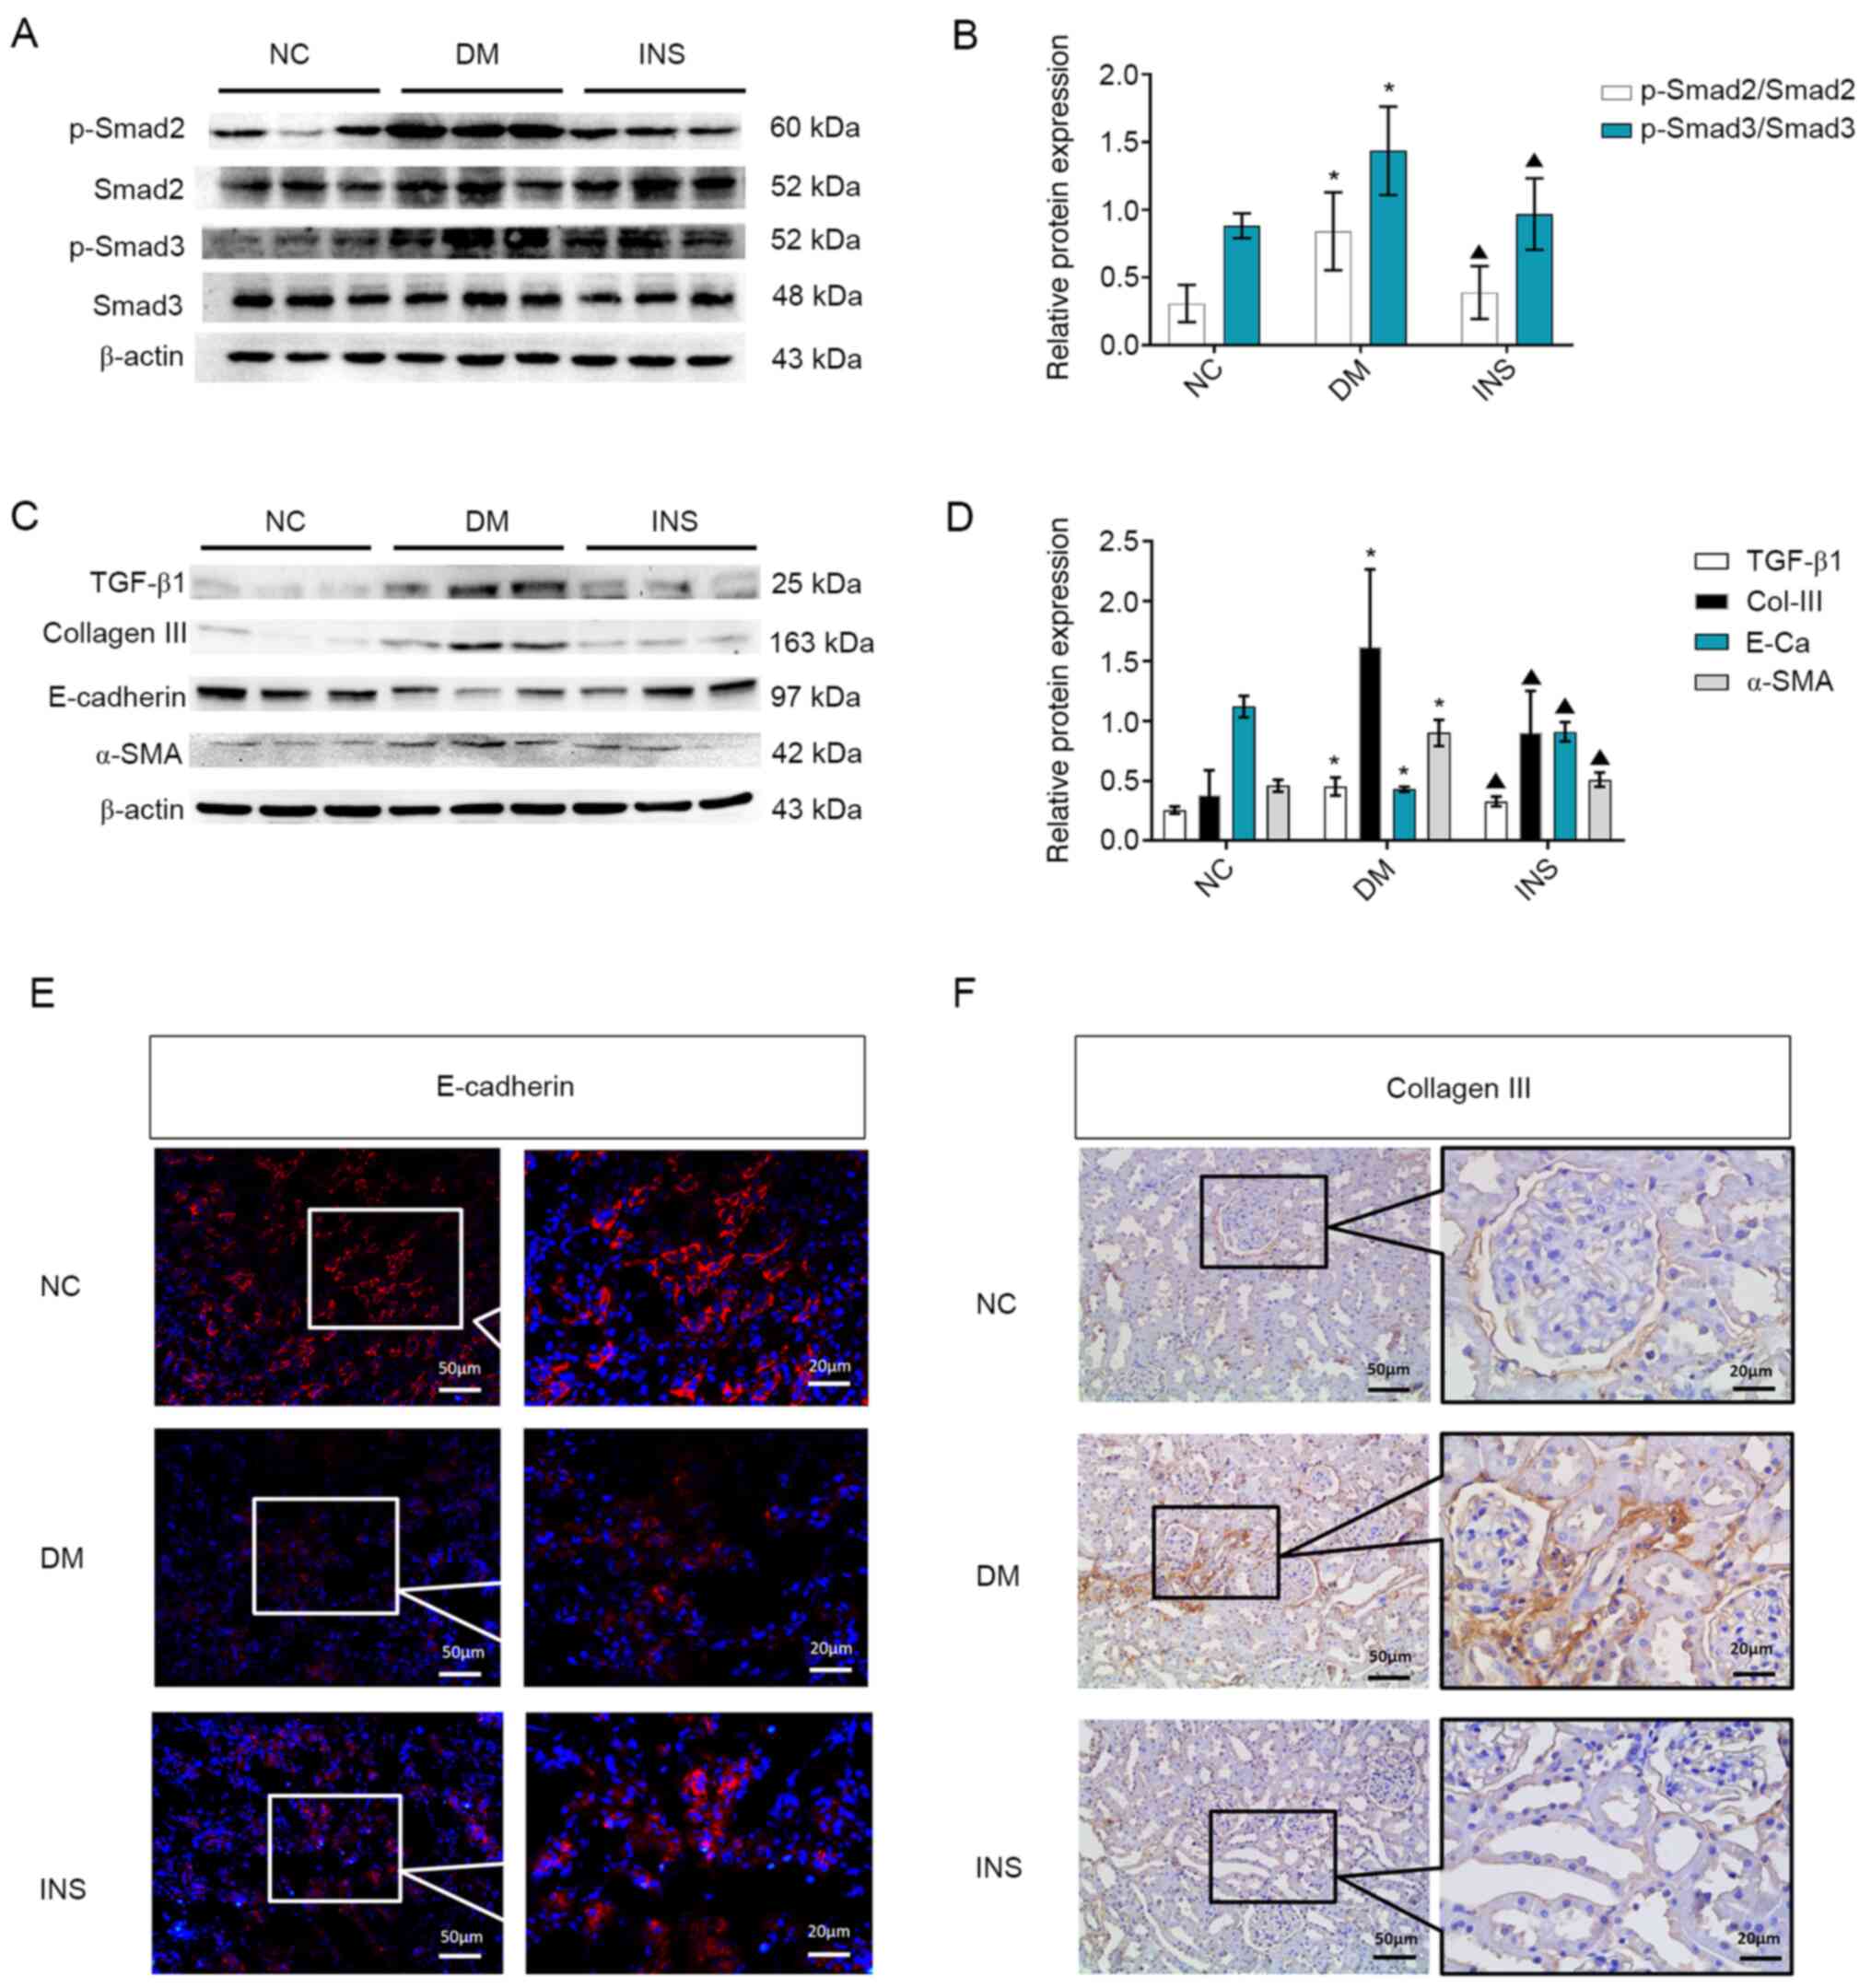 | Figure 2Activation of TGF-β1, EMT and ECM
accumulation. (A) Representative western blots and (B) quantitative
analysis of the levels of p-Smad2, Smad2, p-Smad3 and Smad3 in the
kidney tissues of rats from different groups. (C) Representative
western blots and (D) quantitative analysis of the expression
levels of TGF-β1, Col-III, E-cadherin and α-SMA in the kidney
tissues in the three groups. n=8. *P<0.05 vs. NC;
▲P<0.05 vs. DM. (E) Immunofluorescence staining of
E-cadherin. (F) Immunohistochemical staining of Col-Ⅲ in the kidney
tissues of rats in the three groups. Black box indicates the
enlarged. TGF-β1, transforming growth factor β1; EMT,
epithelial-mesenchymal transition; ECM, extracellular matrix; p,
phosphorylated; Col, collagen; α-SMA, α-smooth muscle actin; NC,
normal control; DM, diabetes mellitus; INS, insulin. |
Insulin partially attenuates
HG-induced downregulation of SnoN
Renal tissue western blotting demonstrated that the
protein expression levels of SnoN were reduced in the DM group
compared with those in the NC group (P<0.05; Fig. 3A and B). The protein levels of SnoN in renal
tissues of rats in the NC and DM groups were detected by
immunoprecipitation, and western blotting was performed with a UB
antibody. The results demonstrated that STZ-induced DM increased
the levels of ubiquitylation and degradation of SnoN (Fig. 3D); however, compared with those in
the DM group, the ubiquitin levels and degradation of SnoN in the
INS group were partially reversed by insulin (P<0.05). In
addition, RT-qPCR results demonstrated that the mRNA levels of SnoN
were increased in the DM group compared with those in the NS group
(P<0.05), whereas the INS group presented with levels similar to
those in the NC group (Fig.
3C).
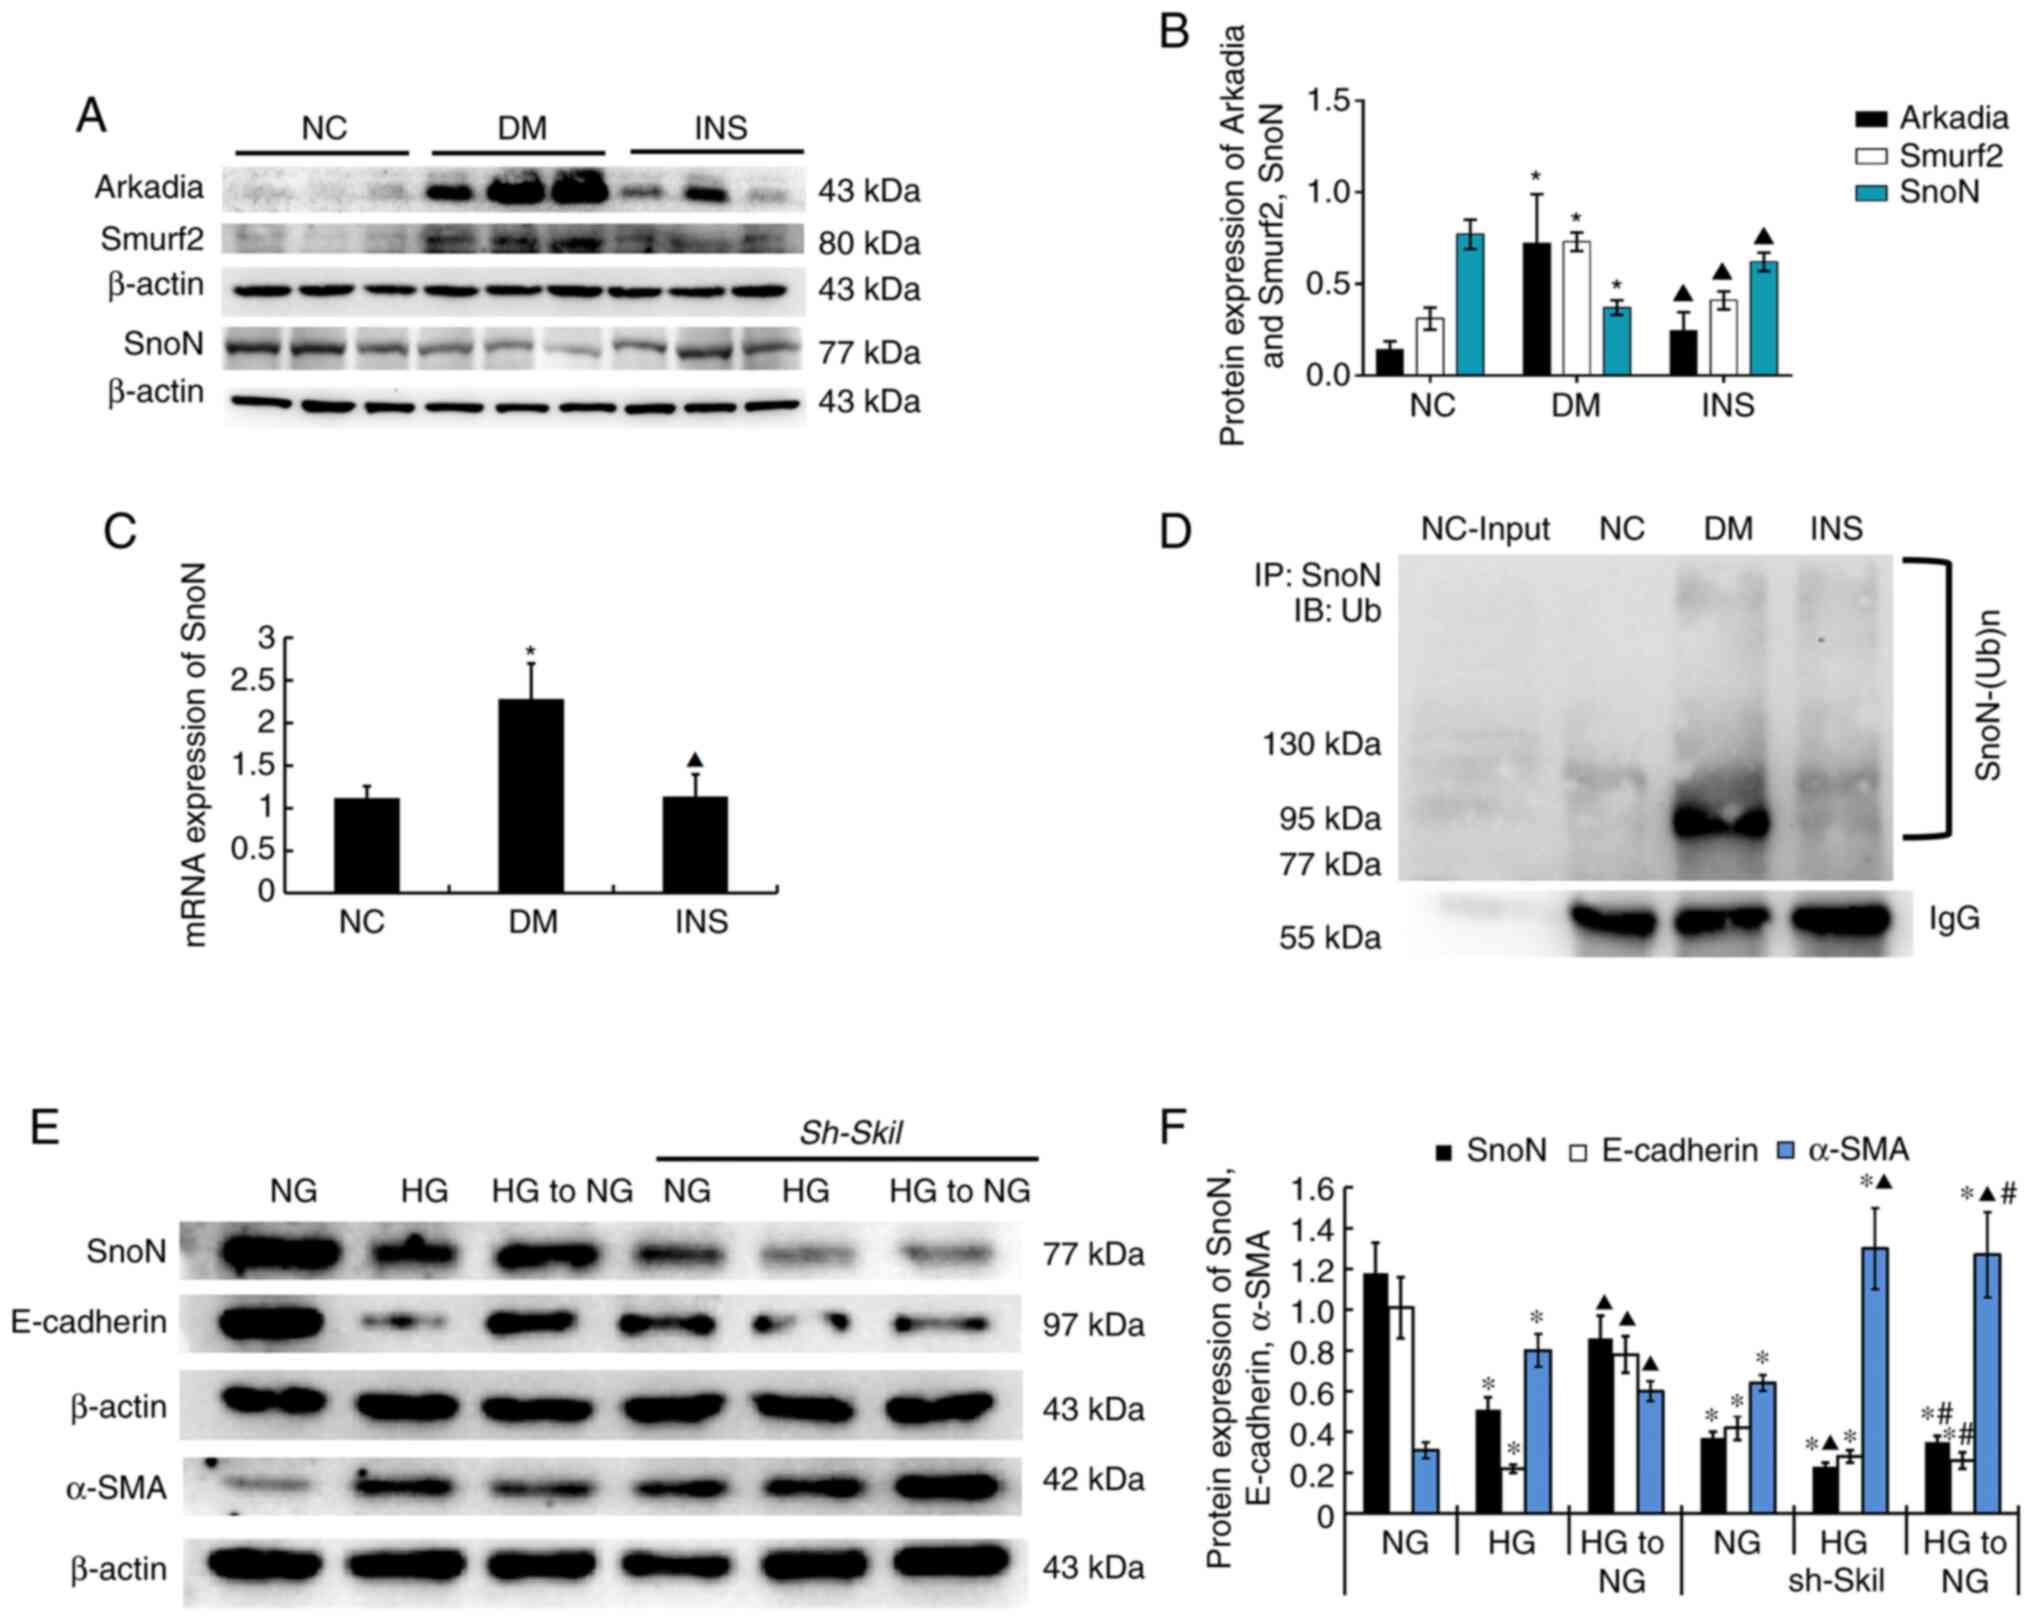 | Figure 3SnoN distribution and expression in
kidney tissue specimens. (A) Representative western blot and (B)
quantitative data of the expression levels of Arkadia, Smurf2 and
SnoN in the kidney tissues in different groups. (C) SnoN mRNA
expression levels in the kidney tissues of rats in different
groups. n=8. *P<0.05 vs. NC; ▲P<0.05
vs. DM. (D) Ubiquitylation of SnoN in the kidney tissues in
different groups. Representative (E) western blot and (F)
quantitative data are revealed the expression of SnoN, E-cadherin,
α-SMA in NRK-52E cells under different conditions. n=3.
*P<0.05 vs. NG; ▲P<0.05 vs. HG;
#P<0.05 vs. HG to NG. SnoN, Ski-related novel protein
N; Smurf2, Smad ubiquitin regulatory factor 2; NC, normal control;
DM, diabetes mellitus; INS, insulin; NG, normal glucose; HG, high
glucose; Sh Skil, short hairpin RNA targeting SnoN; IP,
immunoprecipitation; IB, immunoblot; Ub, ubiquitin. |
E3 ubiquitin enzymes Smurf2 and Arkadia were weakly
expressed in the NC group, but highly expressed in the DM group
(P<0.05; Fig. 3A and B), which suggested that DM induced the
activation of the ubiquitin-proteasome pathway. However, the
DM-elevated Smurf2 and Arkadia expression levels in rat renal
tissues were significantly decreased by insulin and were similar to
those observed in the NC group.
To determine whether insulin-dependent control of
blood glucose levels slowed down the fibrotic changes of tubular
cells via SnoN, an in vitro model was established by
culturing NRK-52E cells in HG medium for 24 h, followed by NG for
24 h. The results demonstrated that the return to NG recovered the
protein expression levels of SnoN and intervened EMT (E-Ca protein
increased and α-SMA protein decreased) compared with those observed
in the HG group. This trend was diminished by transfection of the
Sh Skil plasmid into NRK-52E cells, which the level of SnoN protein
decreased and promoted EMT (P<0.05; Fig. 3E and F).
Discussion
Previous studies have demonstrated that the
expression of TGF-β1 is enhanced during the pathogenesis of renal
fibrosis (22,23). TGF-β1 serves an important role in
promoting fibrosis and functions as a cytokine involved in the
incidence and development of renal fibrosis-related disease
(6,9). For example, TGF-β1 exerts its
profibrotic activity via stimulation of fibroblast proliferation,
extracellular matrix protein synthesis (such as collagen I, III and
IV, proteoglycans, laminin and fibronectin), and EMT (22). Therefore, preventing TGF-β1-induced
fibrosis may aid renal fibrosis prevention and treatment. SnoN is a
negative regulator of the TGF-β1/Smads signaling pathway that
directly interacts with the Smads protein (24). In the cytoplasm, SnoN inhibits
Smad2/3-Smad4 complex formation and nuclear translocation, whereas
in the nucleus, it interferes with activated Smads and initiates
the transcription of various TGF-β1 target genes (such as collagen
I, III and IV) (7,25).
Previous studies have assessed the expression and
effects of SnoN during DN pathogenesis and reported that SnoN
expression levels decrease during DN progression, which is
accompanied by ECM deposits in the renal interstitium and the
occurrence of the EMT (9,11). Notably, SnoN inhibition in tubular
epithelial cells by small interfering RNA further upregulates
HG-induced fibronectin and α-SMA expression, which aggravates
fibrotic lesions (8). In the
present study, SnoN mRNA and TGF-β1 protein levels in renal tissues
of diabetic rats were inhibited and upregulated, respectively,
compared with those in the NC rats. In addition, inconsistent
results were obtained in the DM group for SnoN mRNA and protein
levels: The SnoN mRNA expression levels were higher in the DM group
compared with those in the control group. TGF-β1 stimulation for 2
h has been reported to promote the transcriptional activation of
SnoN in cancer cells in a negative feedback mechanism that limits
the TGF-β1/Smads signal transduction (5,11,26).
However, our and other studies have demonstrated that TGF-β1 can
rapidly and significantly decrease the levels of the SnoN protein
by activating TAK1 (15,16), which phosphorylates SnoN and affects
its stability (15). Subsequently,
p-SnoN is downregulated by E3 ubiquitin enzyme-mediated degradation
involving Smurf2 and Arkadia (13,14).
E3 ubiquitin ligase, ubiquitin-activating enzyme (E1) and
ubiquitin-conjugating enzyme (E2) are the components of the
ubiquitin proteasome system (UPS), which mediates protein
degradation via a cascade of responses (27). E3 ubiquitin ligase serves a decisive
role in the UPS by determining the selectivity and specificity of
substrate proteins (28), whereas
Smurf2 and Arkadia are specific regulators that mediate the UPS to
regulate the degradation of SnoN protein (14,28).
As aforementioned, Smurf2 and Arkadia were highly expressed in the
renal tissues of DN rats in the present study. TGF-β enhances its
biological effects by modulating the Arkadia-mediated SnoN
degradation (29,30). Arkadia binds the SnoN protein with
the carboxy-terminal RING domain (28) and induces ubiquitin-mediated
degradation of the SnoN protein in the presence of p-Smad2/3
involvement (31). Following
activation by TGF-β1, Smad2/3 mediates the interaction between
Smurf2, Arkadia and SnoN, which allows the homologous
E6-APC-terminus of Smurf2 and Arkadia to target SnoN, inducing the
ubiquitin degradation of the SnoN protein (14,30,32).
Therefore, although the TGF-β1/Smads signaling pathway upregulates
SnoN expression at the transcriptional level, it is not sufficient
to offset or reverse the ubiquitin-mediated degradation of SnoN
induced by Smurf2 and Arkadia through this pathway, which causes
decreased SnoN protein levels in DN rats and alters the negative
feedback inhibition effect of the TGF-β1/Smads signaling pathway,
inducing fibrotic lesions in DN.
HG is the initial factor promoting the decrease of
SnoN protein level in renal tubular epithelial cells, and blood
glucose control by insulin can prevent and delay the development of
DN (17,18). In addition, HG also induces
oxidative stress and aggravates the development of DN. In the
present study, the metabolic function of rats significantly
improved and renal fibrotic lesions were alleviated by insulin
treatment compared with those in the DM group. The decreased blood
glucose and glycated hemoglobin levels indicated that hyperglycemia
was improved. Additionally, the expression levels of Smurf2 and
Arkadia significantly decreased following insulin treatment. The
expression of SnoN was lower at the transcriptional level, but was
enhanced at the protein level in the INS group compared with the DM
group. In addition, the phenotypes of renal tubular epithelial
cells and ECM deposits appeared to be reduced following insulin
treatment compared with those in the DM group. Therefore, the
control of blood glucose may delay the development of DN and
improve the stability of SnoN protein.
The results of the present study demonstrated that a
dual mechanism contributed to the regulation of SnoN by TGF-β1
in vivo by comparing and analyzing data obtained before and
after blood glucose control in DM rats. On the one hand, TGF-β1
induced SnoN expression; on the other hand, TGF-β1 mediated E3
ubiquitin ligase-induced SnoN protein degradation. Therefore, the
SnoN protein amounts in renal tubular epithelial cells may depend
on the balance between these two effects (Fig. 4).
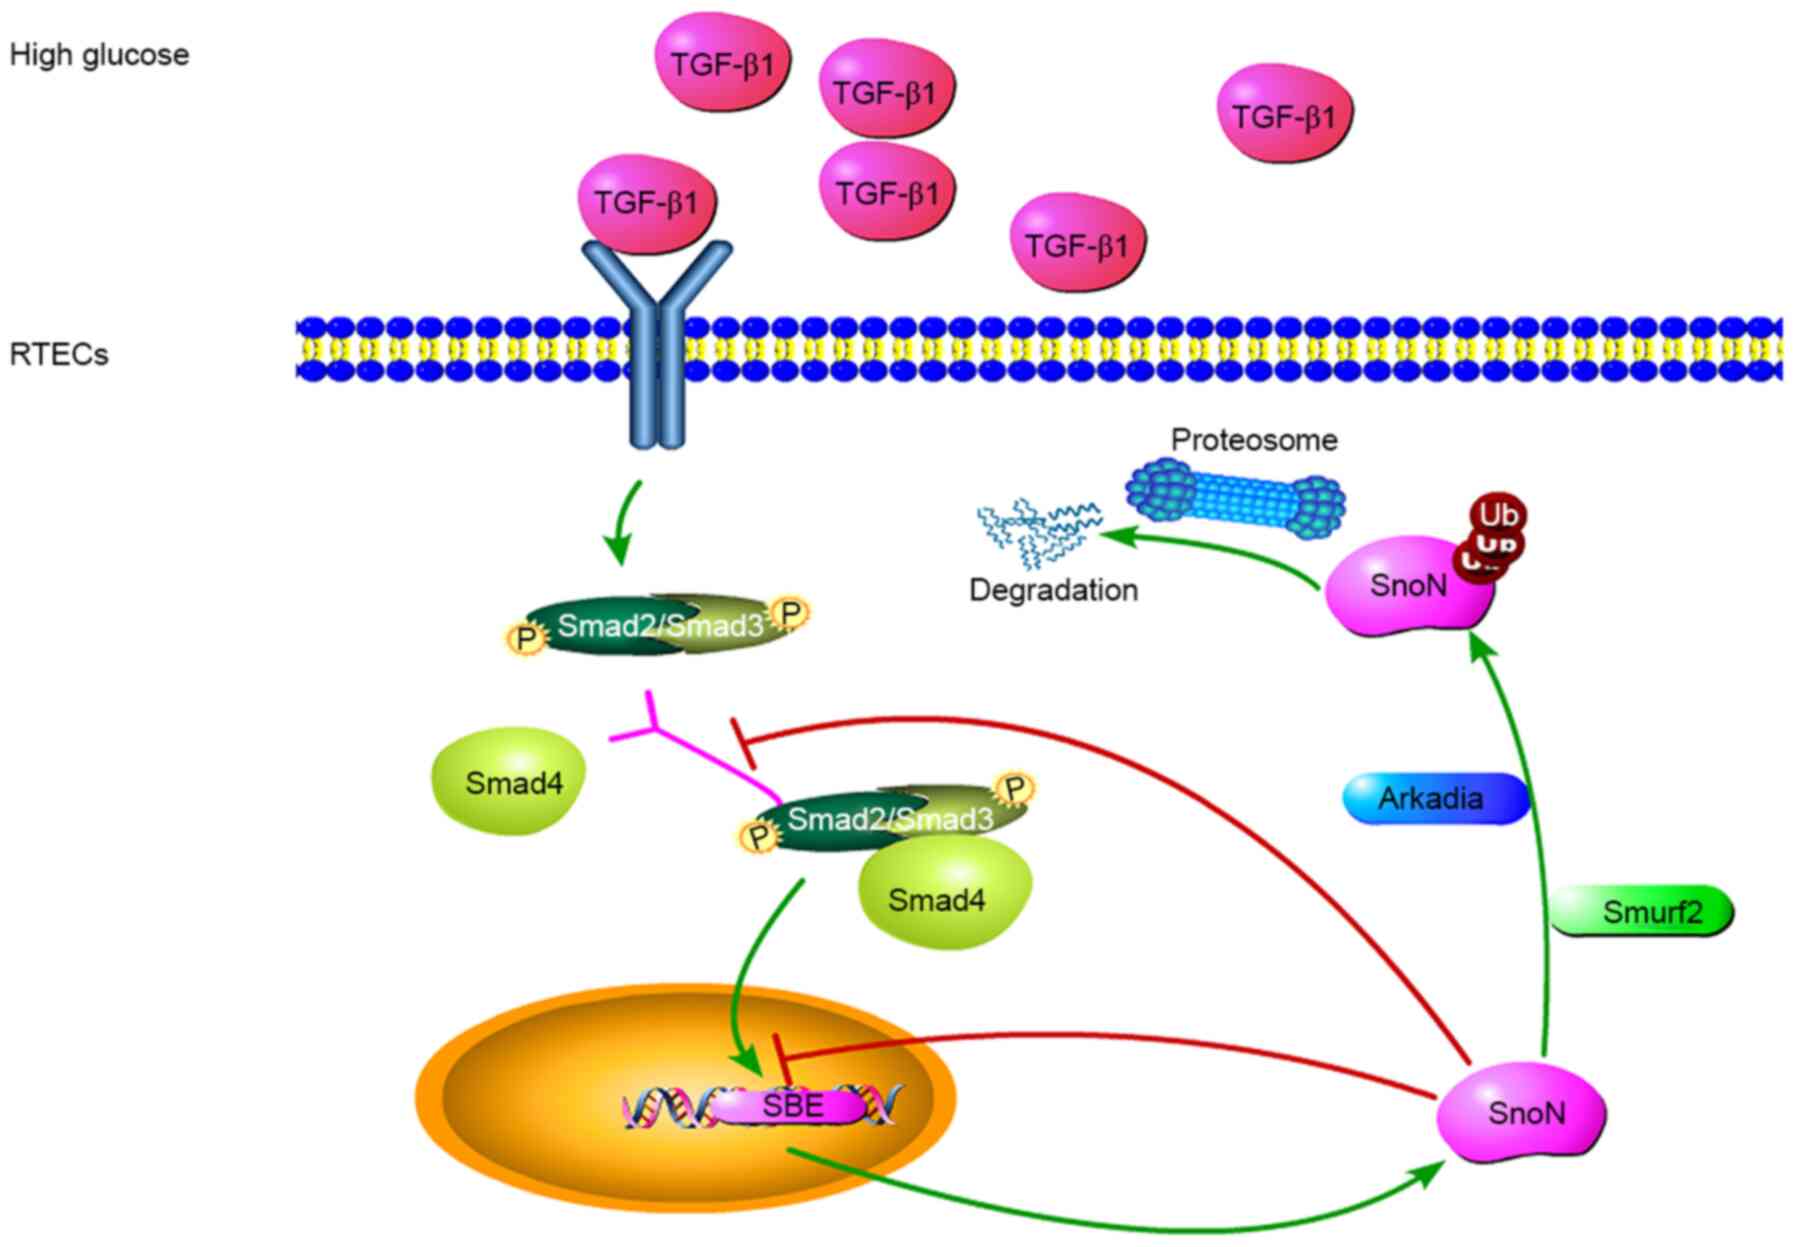 | Figure 4Potential mechanisms of
TGF-β1/Smads-dependent regulation of SnoN during DN. TGF-β1 is
involved in the regulation of fibrosis, and TGF-β1/Smads is the
canonical pathway for its biological functions. In a high-glucose
environment, cells secrete TGF-β1, leading to the phosphorylation
of Smads, which form a complex to regulate the expression of SnoN.
During the occurrence and development of DN, the level of SnoN
protein may be reduced through UPS-mediated degradation of SnoN
protein, reversing the transcriptional activation of SnoN. TGF-β1
mediates E3 ubiquitin ligase and induces SnoN protein degradation.
Thus, the amount of SnoN protein in renal tubular epithelial cells
depends on the balance between these two effects. Both processes
are mediated by the TGF-β1/Smads/SnoN signaling pathway, which
leads to the fibrosis amplification, promoting the occurrence and
development of DN. TGF-β1, transforming growth factor β1; SnoN,
Ski-related novel protein N; Smurf2, Smad ubiquitin regulatory
factor 2; Ub, ubiquitin; p, –phosphorylation; UPS, ubiquitin
proteasome system; SBE, Smads binding element. |
In conclusion, decreased expression of SnoN protein
was observed due to the combined effect of promoting
transcriptional activation of SnoN and mediating ubiquitination
degradation of SnoN protein by Arkadia and Smurf2 following
activation of the TGF-β/Smads signaling pathway in the pathogenesis
of DN. Blood glucose control delayed the progression of DN by
restoring SnoN protein levels.
Acknowledgements
Not applicable.
Funding
Funding: This work was supported by the Regional Common Diseases
and Adult Stem Cell Transformation Research and Innovation Platform
of Guizhou Provincial Department of Science and Technology [grant
no. (2019) 4008], the Guizhou province Science and Technology
Funding [grant no. QianKeHeBase (2017) 5718] and the Guiyang
Science and Technology Funding [grant no. ZhuKe (2017) 30-20].
Availability of data and materials
The datasets used and/or analyzed during the current
study are available from the corresponding author on reasonable
request.
Authors' contributions
LQL designed and performed additional experiments,
analyzed the data, wrote, revised and finalized the manuscript. SL
and YWM performed the animal experiments. SL analyzed the data and
revised the manuscript. LLL, HML, XHZ, WP and YX performed the
experiments. FZ analyzed the data and revised the manuscript. MJS
participated in the drafting of the manuscript and data
interpretation. YYW participated in data interpretation and
critically revised the contents. BG conceived and designed the
study. All authors read and approved the final manuscript. LQL, YYW
and BG confirm the authenticity of all the raw data.
Ethics approval and consent to
participate
The study was conducted in accordance with the
guidelines of the National Health and Medical Research Council of
China's code for the care and use of animals for scientific
purposes and was approved by the Animal Experimental Ethical
Inspection Form of Guizhou Medical University (approval no.
1503092).
Patient consent for publication
Not applicable.
Competing interests
The authors declare that they have no competing
interests.
References
|
1
|
Flyvbjerg A: The role of the complement
system in diabetic nephropathy. Nat Rev Nephrol. 13:311–318.
2017.PubMed/NCBI View Article : Google Scholar
|
|
2
|
Gu W, Liu Y, Chen Y, Deng W, Ran X, Chen
L, Zhu D, Yang J, Shin J, Lee SW, et al: Multicentre randomized
controlled trial with sensor-augmented pump vs multiple daily
injections in hospitalized patients with type 2 diabetes in China:
Time to reach target glucose. Diabetes Metab. 43:359–363.
2017.PubMed/NCBI View Article : Google Scholar
|
|
3
|
Valencia WM and Florez H: How to prevent
the microvascular complications of type 2 diabetes beyond glucose
control. BMJ. 356(i6505)2017.PubMed/NCBI View Article : Google Scholar
|
|
4
|
Xiong Y and Zhou L: The Signaling of
Cellular Senescence in Diabetic Nephropathy. Oxid Med Cell Longev.
2019(7495629)2019.PubMed/NCBI View Article : Google Scholar
|
|
5
|
Li J, Wu B, Hu H, Fang X, Liu Z and Wu S:
GdCl3 attenuates the glomerular sclerosis of streptozotocin (STZ)
induced diabetic rats via inhibiting TGF-β/Smads signal pathway. J
Pharmacol Sci. 142:41–49. 2020.PubMed/NCBI View Article : Google Scholar
|
|
6
|
Sutariya B, Jhonsa D and Saraf MN: TGF-β:
The connecting link between nephropathy and fibrosis.
Immunopharmacol Immunotoxicol. 38:39–49. 2016.PubMed/NCBI View Article : Google Scholar
|
|
7
|
Zeglinski MR, Hnatowich M, Jassal DS and
Dixon IM: SnoN as a novel negative regulator of TGF-β/Smad
signaling: A target for tailoring organ fibrosis. Am J Physiol
Heart Circ Physiol. 308:H75–H82. 2015.PubMed/NCBI View Article : Google Scholar
|
|
8
|
Liu R, Wang Y, Xiao Y, Shi M, Zhang G and
Guo B: SnoN as a key regulator of the high glucose-induced
epithelial-mesenchymal transition in cells of the proximal tubule.
Kidney Blood Press Res. 35:517–528. 2012.PubMed/NCBI View Article : Google Scholar
|
|
9
|
Liu L, Wang Y, Yan R, Li S, Shi M, Xiao Y
and Guo B: Oxymatrine Inhibits Renal Tubular EMT Induced by High
Glucose via Upregulation of SnoN and Inhibition of TGF-β1/Smad
Signaling Pathway. PLoS One. 11(e0151986)2016.PubMed/NCBI View Article : Google Scholar
|
|
10
|
Luo DD, Phillips A and Fraser D: Bone
morphogenetic protein-7 inhibits proximal tubular epithelial cell
Smad3 signaling via increased SnoN expression. Am J Pathol.
176:1139–1147. 2010.PubMed/NCBI View Article : Google Scholar
|
|
11
|
Jahchan NS and Luo K: SnoN in mammalian
development, function and diseases. Curr Opin Pharmacol.
10:670–675. 2010.PubMed/NCBI View Article : Google Scholar
|
|
12
|
Liu S, Yu N, Zhang XL, Chen XQ and Tang
LQ: Regulatory effect of berberine on unbalanced expressions of
renal tissue TGF-beta1/SnoN and smad signaling pathway in rats with
early diabetic nephropathy. Zhongguo Zhongyao Zazhi. 37:3604–3610.
2012.PubMed/NCBI(In Chinese).
|
|
13
|
Sakairi T, Hiromura K, Takahashi S,
Hamatani H, Takeuchi S, Tomioka M, Maeshima A, Kuroiwa T and Nojima
Y: Effects of proteasome inhibitors on rat renal fibrosis in vitro
and in vivo. Nephrology (Carlton). 16:76–86. 2011.PubMed/NCBI View Article : Google Scholar
|
|
14
|
Wang Y, Zhang X, Mao Y, Liang L, Liu L,
Peng W, Liu H, Xiao Y, Zhang Y, Zhang F, et al: Smad2 and Smad3
play antagonistic roles in high glucose-induced renal tubular
fibrosis via the regulation of SnoN. Exp Mol Pathol.
113(104375)2020.PubMed/NCBI View Article : Google Scholar
|
|
15
|
Wang Y, Mao Y, Zhang X, Liu H, Peng W,
Liang L, Shi M, Xiao Y, Zhang Y, Zhang F, et al: TAK1 may promote
the development of diabetic nephropathy by reducing the stability
of SnoN protein. Life Sci. 228:1–10. 2019.PubMed/NCBI View Article : Google Scholar
|
|
16
|
Kajino T, Omori E, Ishii S, Matsumoto K
and Ninomiya-Tsuji J: TAK1 MAPK kinase kinase mediates transforming
growth factor-beta signaling by targeting SnoN oncoprotein for
degradation. J Biol Chem. 282:9475–9481. 2007.PubMed/NCBI View Article : Google Scholar
|
|
17
|
Satirapoj B and Adler SG: Prevalence and
Management of Diabetic Nephropathy in Western Countries. Kidney
Dis. 1:61–70. 2015.PubMed/NCBI View Article : Google Scholar
|
|
18
|
Zhang Q, Li Y and Chen L: Effect of
berberine in treating type 2 diabetes mellitus and complications
and its relevant mechanisms. Zhongguo Zhongyao Zazhi. 40:1660–1665.
2015.PubMed/NCBI(In Chinese).
|
|
19
|
Livak KJ and Schmittgen TD: Analysis of
relative gene expression data using real-time quantitative PCR and
the 2(-Delta Delta C(T)) Method. Methods. 25:402–408.
2001.PubMed/NCBI View Article : Google Scholar
|
|
20
|
Mise K, Ueno T, Hoshino J, Hazue R, Sumida
K, Yamanouchi M, Hayami N, Suwabe T, Hiramatsu R, Hasegawa E, et
al: Nodular lesions in diabetic nephropathy: Collagen staining and
renal prognosis. Diabetes Res Clin Pract. 127:187–197.
2017.PubMed/NCBI View Article : Google Scholar
|
|
21
|
Kato M, Park JT and Natarajan R: MicroRNAs
and the glomerulus. Exp Cell Res. 318:993–1000. 2012.PubMed/NCBI View Article : Google Scholar
|
|
22
|
Loboda A, Sobczak M, Jozkowicz A and Dulak
J: TGF-β1/Smads and miR-21 in Renal Fibrosis and Inflammation.
Mediators Inflamm. 2016(8319283)2016.PubMed/NCBI View Article : Google Scholar
|
|
23
|
Sun Z, Ma Y, Chen F, Wang S, Chen B and
Shi J: miR-133b and miR-199b knockdown attenuate TGF-β1-induced
epithelial to mesenchymal transition and renal fibrosis by
targeting SIRT1 in diabetic nephropathy. Eur J Pharmacol.
837:96–104. 2018.PubMed/NCBI View Article : Google Scholar
|
|
24
|
Deheuninck J and Luo K: Ski and SnoN,
potent negative regulators of TGF-β signaling. Cell Res. 19:47–57.
2009.PubMed/NCBI View Article : Google Scholar
|
|
25
|
Ma T-T and Meng XM: TGF-β/Smad and Renal
Fibrosis. Adv Exp Med Biol. 1165:347–364. 2019.PubMed/NCBI View Article : Google Scholar
|
|
26
|
Stroschein SL, Wang W, Zhou S, Zhou Q and
Luo K: Negative feedback regulation of TGF-beta signaling by the
SnoN oncoprotein. Science. 286:771–774. 1999.PubMed/NCBI View Article : Google Scholar
|
|
27
|
Ciechanover A, Orian A and Schwartz AL:
The ubiquitin-mediated proteolytic pathway: Mode of action and
clinical implications. J Cell Biochem Suppl. 34:40–51.
2000.PubMed/NCBI View Article : Google Scholar
|
|
28
|
Inoue Y and Imamura T: Regulation of
TGF-beta family signaling by E3 ubiquitin ligases. Cancer Sci.
99:2107–2112. 2008.PubMed/NCBI View Article : Google Scholar
|
|
29
|
Li XZ, Feng JT, Hu CP, Chen ZQ, Gu QH and
Nie HP: Effects of Arkadia on airway remodeling through enhancing
TGF-beta signaling in allergic rats. Lab Invest. 90:997–1003.
2010.PubMed/NCBI View Article : Google Scholar
|
|
30
|
Briones-Orta MA, Levy L, Madsen CD, Das D,
Erker Y, Sahai E and Hill CS: Arkadia regulates tumor metastasis by
modulation of the TGF-β pathway. Cancer Res. 73:1800–1810.
2013.PubMed/NCBI View Article : Google Scholar
|
|
31
|
Levy L, Howell M, Das D, Harkin S,
Episkopou V and Hill CS: Arkadia activates Smad3/Smad4-dependent
transcription by triggering signal-induced SnoN degradation. Mol
Cell Biol. 27:6068–6083. 2007.PubMed/NCBI View Article : Google Scholar
|
|
32
|
Tan R, He W, Lin X, Kiss LP and Liu Y:
Smad ubiquitination regulatory factor-2 in the fibrotic kidney:
Regulation, target specificity, and functional implication. Am J
Physiol Renal Physiol. 294:F1076–F1083. 2008.PubMed/NCBI View Article : Google Scholar
|


