Introduction
Pulmonary thromboembolism (PTE), a fatal condition
mainly affecting older individuals, ranks third among the most
common types of cardiovascular diseases after coronary heart
disease and high blood pressure (1). At present, the prevention and control
of PTE is frequently inadequate, particularly in patients with
multiple traumas; therefore, the diagnosis of PTE is frequently
missed, which in turn leads to a high mortality rate for patients
with PTE (2). It is well known that
PTE is caused by an endogenous or exogenous embolus blocking the
pulmonary artery or its main branches (3). The pneumovascular bed has a great
reserve capacity. One of the major functions of the lung is blood
filtration, thereby preventing small thrombi from flowing into the
systemic circulation (4).
Furthermore, lung tissue exerts strong autolysis and dissolving
effects on small thrombi. Therefore, in clinical practice, when a
small thrombus blocks the pulmonary vascular bed, clinical symptoms
frequently do not appear due to the self-dissolving effect of the
lung tissue, also known as clinical non-dominant pulmonary
embolism. These reports indicate that the early clinical diagnosis
of PTE is challenging (5).
Biomarkers may not only reveal the pathological process at the
molecular level but also have the advantage of accurately assessing
low-level and early injury, thereby providing an early warning and,
to a large extent, the basis for diagnosis by clinicians (6). The present study aimed to identify
functional key genes for the early diagnosis of PTE using
bioinformatics analysis.
Bioinformatics is an interdisciplinary field
incorporating biology and computer science in order to analyze and
synthesize related data (7).
Several bioinformatics tools are currently used to screen for
potential genes associated with a variety of pathological processes
in vivo (8,9). Similarly, microarrays have been used
to elucidate underlying pathological mechanisms and identify novel
biological markers (10). Recently,
microarrays have been utilized by several researchers to reveal key
genes associated with thrombotic diseases and several relevant
genes have been identified, including Janus kinase 2, stabilin 2
and vitamin K-dependent protein S (11,12).
These differentially expressed genes (DEGs) are assumed to have a
potential role in thrombosis by regulating blood coagulation.
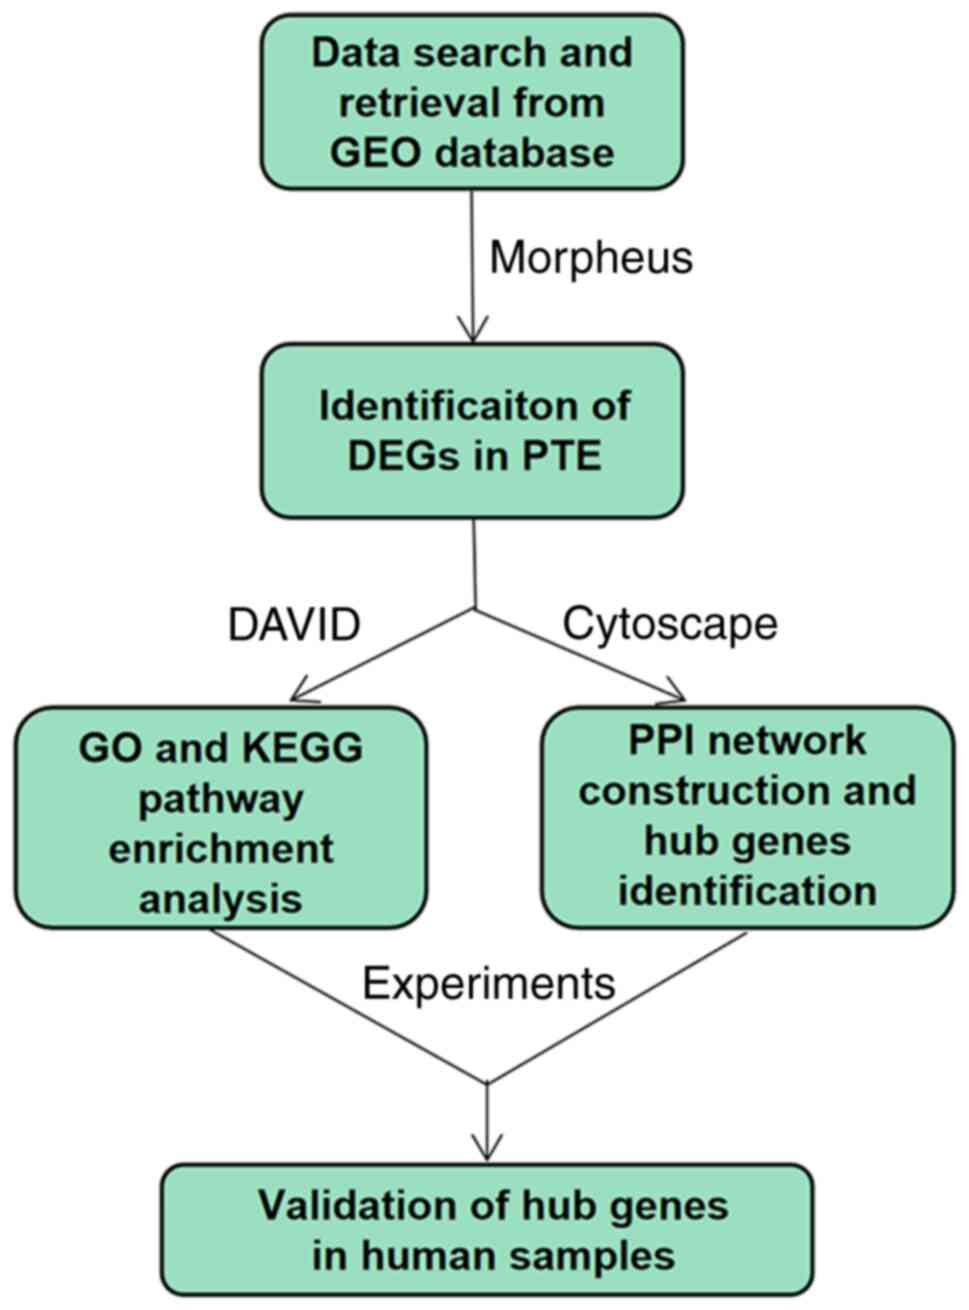
In the present study, the microarray data of the
GSE84738 dataset were analyzed in order to identify DEGs associated
with PTE. In addition, functional enrichment analysis of the DEGs
was performed. The protein-protein interaction (PPI) network of the
DEGs was constructed to screen out the hub genes and the
differential expression of certain hub genes was validated in serum
samples from patients with PTE and healthy controls.
Materials and methods
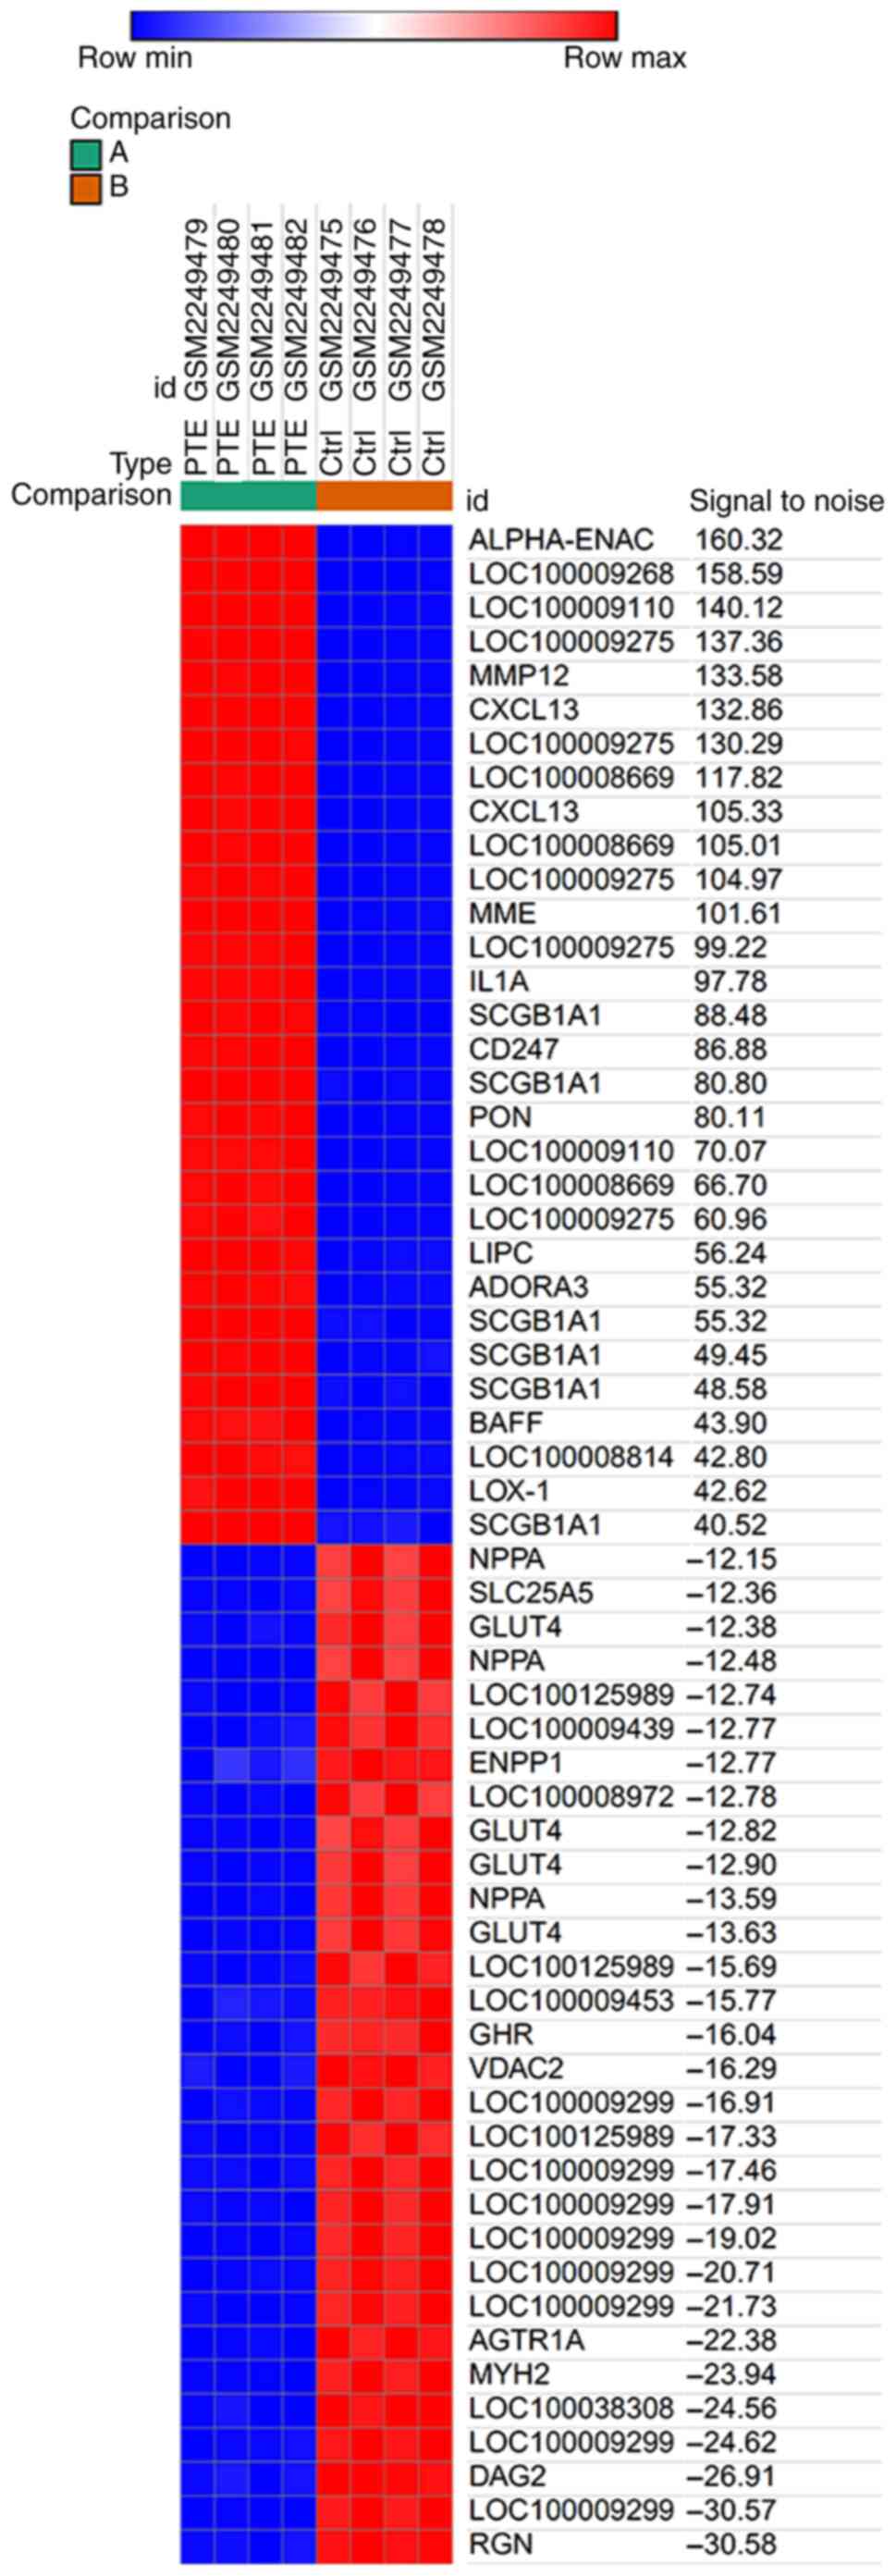
Datasets and DEGs
The microarray dataset GSE84738 containing data from
a rabbit model of PTE was downloaded from the Gene Expression
Omnibus (GEO) database (https://www.ncbi.nlm.nih.gov/geo/). Subsequently, the
data were analyzed with the Morpheus online tool (https://software.broadinstitute.org/morpheus). The
expression heatmap was ultimately displayed. The criteria for DEGs
were a signal-to-noise ratio of >1 or <-1. Signal-to-noise
ratio is the amount of biological signal relative to the amount of
noise (13). Using this method, Mi
et al (13) obtained a
satisfactory DEGs identification efficiency in the study.
Gene ontology (GO) and kyoto
encyclopedia of genes and genomes (KEGG) analyses
The Database for Annotation, Visualization and
Integrated Discovery (DAVID; version 6.8; david.ncifcrf.gov/) online tool was utilized to
perform GO enrichment and KEGG pathway analyses (14). The results were visualized using the
R package ‘GOplot’ and ‘ggplot’.
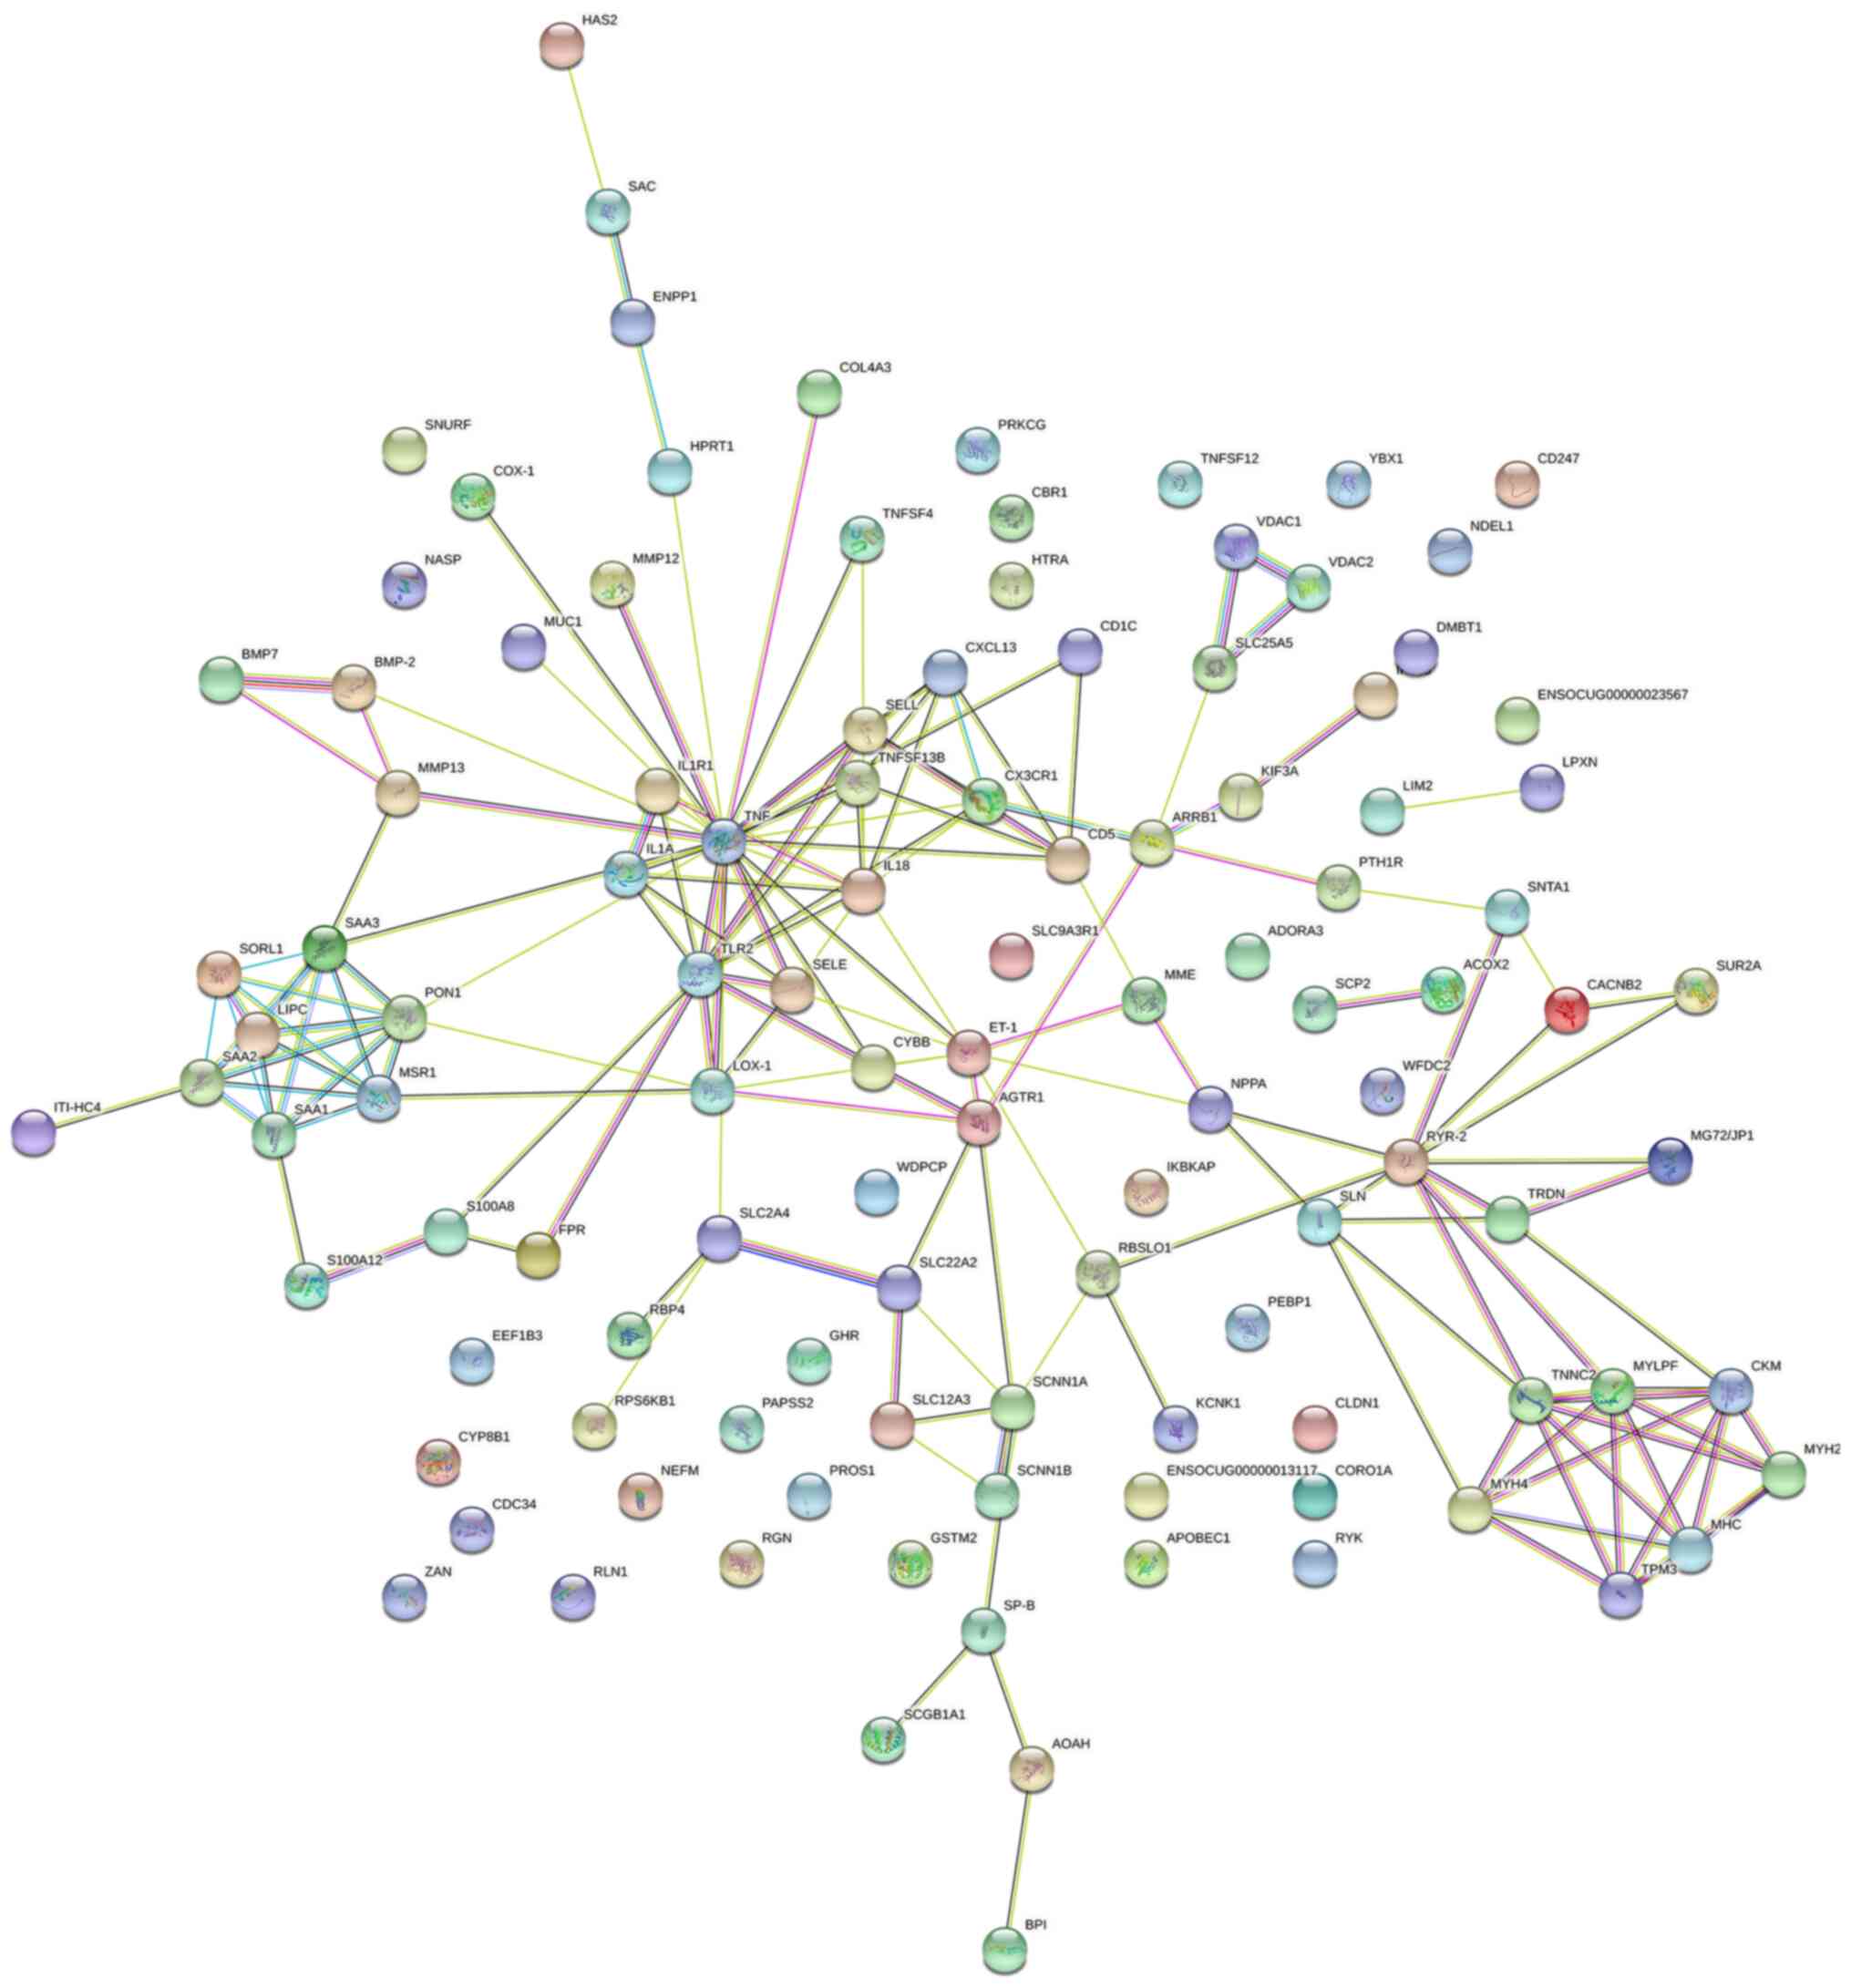
PPI network construction
The functional interactions among DEGs were analyzed
by constructing a PPI network. In brief, DEGs were imported into
the Search Tool for the Retrieval of Interacting Genes database
(STRING; www.string-db.org) and a combined score
of >0.5 was set as the cut-off value to indicate significant
interactions. The combined score is computed by combining the
probabilities from the different evidence channels and corrected
for the probability of randomly observing an interaction (15). Furthermore, the PPI network among
DEGs was established using the Cytoscape analysis software (version
3.7.2) (16). Significant modules
in the PPI network were selected based on the Molecular Complex
Detection (MCODE 2.0.0) plugin (https://apps.cytoscape.org/apps/mcode) (17), with scores ≥5 and number of nodes
>5 in Cytoscape. Ultimately, the DAVID online tool was used to
perform functional enrichment analysis of DEGs in the top module
and DEGs were ranked based on the degree centrality, calculated
using the CentiScaPe 2.2 plugin of Cytoscape. The node degree
represents the association degree of one node with all the other
nodes in the network. Closeness centrality is a measure of how
close a node is to other nodes in the network. Betweenness
centrality refers to the number of times a node acts as the
shortest bridge between two other nodes.
Patients and blood collection
Peripheral blood samples were collected from 10
patients with PTE and 10 healthy controls admitted to the Shanghai
University of Medicine and Health Sciences Affiliated Zhoupu
Hospital (Shanghai, China) between June 2019 and April 2020, and
the mRNA expression levels of DEGs were determined by reverse
transcription-quantitative PCR (RT-qPCR). Patients with PTE
included in the present study did not exhibit any other
complications following fracture surgery. Blood samples were
collected immediately after PTE diagnosis.
RT-qPCR analysis
Total RNA was isolated from serum samples using
TRIzol® reagent (Invitrogen; Thermo Fisher Scientific,
Inc.). Subsequently, the purified RNA was reverse-transcribed into
complementary DNA using the ReverTra Ace® qPCR RT Master
mix according to the manufacture's protocol (Toyobo Life Science).
The RT reaction was performed at 42˚C for 15 min, followed by 5 min
at 98˚C. qPCR was performed using a QuantiTect SYBR-Green PCR kit
(Qiagen GmbH) on an ABI 7300 Real-Time PCR System (Applied
Biosystems; Thermo Fisher Scientific, Inc.). Thermocycling
conditions: Initial denaturation for 1 min at 94˚C, followed by 35
cycles of 1 min at 60˚C, 2 min at 72˚C, 6 min at 72˚C, holding at
4˚C. The relative mRNA expression levels were normalized to those
of the internal control (β-actin) and were quantified based on the
2-∆∆Cq method (18). The
primer sequences used were as follows: Toll-like receptor 4 (TLR4)
forward, 5'-AGGATGAGGACTGGGTAAGGA-3' and reverse,
5'-CTGGATGAAGTGCTGGGACA-3'; TLR2 forward,
5'-TTATCCAGCACACGAATACACAG-3' and reverse,
5'-AGGCATCTGGTAGAGTCATCAA-3'; IL-1β forward,
5'-ACAGATGAAGTGCTCCTTCCA-3' and reverse,
5'-GTCGGAGATTCGTAGCTGGAT-3'; osteopontin (SPP1) forward,
5'-GCAUCUUCUGAGGUCAAUUTT-3' and reverse,
5'-AAUUGACCUCAGAAGAUGCTT-3'; JUN forward,
5'-TCCAAGTGCCGAAAAAGGAAG-3' and reverse,
5'-CGAGTTCTGAGCTTTCAAGGT-3'; prostaglandin-endoperoxide synthase 2
(PTGS2) forward, 5'-CTGGCGCTCAGCCATACAG-3' and reverse
5'-CGCACTTATACTGGTCAAAT CCC-3'; endothelin-1 (ET-1) forward,
5'-AGAGTGTGTCTACTTCTGCCA3' and reverse,
5'-CTTCCAAGTCCATACGGAACAA-3'; β-actin forward, 5'-GTGGGGCGCCCCAGGCA
CCA-3' and reverse, 5'-GCTCGGCCGTGGTGGTGAAG-3'.
Statistical analysis
All data were analyzed using GraphPad Prism 8.0
software (GraphPad Software, Inc.). Values are expressed as the
mean ± standard deviation. Student's t-test or one-way ANOVA
followed by Tukey's post hoc test were used to compare the
differences between two groups and > two groups, respectively.
Fisher's exact test was used to assess significance in the
male/female ratio between groups. P<0.05 was considered to
indicate a statistically significant difference.
Results
Identification of DEGs
The expression profile of GSE84738 was downregulated
from the GEO database and comprised 4 normal and 4 PTE samples. The
blood samples had been collected at seven days following the
establishment of the PTE model. The data were analyzed using the
Morpheus online tool. A total of 160 upregulated and 159
downregulated DEGs were identified between healthy and PTE cases.
The top 30 upregulated and downregulated genes are presented in
Fig. 1.
GO and KEGG enrichment analysis
GO and KEGG enrichment analyses were performed using
the DAVID online software. In the GO category biological process,
upregulated DEGs in PTE were significantly enriched in the terms
‘immune response’, ‘defense response’, ‘inflammatory response’,
‘positive regulation of immune system process’ and ‘response to
external stimulus’, while the downregulated DEGs were enriched in
‘ion transport’, ‘muscle system process’, ‘metal ion transport’,
‘muscle contraction’ and ‘cation transport’ (Table I). In the GO category cellular
component, upregulated DEGs in PTE were mainly enriched in the
terms ‘plasma lipoprotein particle’, ‘lipoprotein particle’,
‘protein-lipid complex’, ‘extracellular space’ and ‘extracellular
region’ and the downregulated DEGs in ‘sarcolemma’, ‘cation channel
complex’, ‘ion channel complex’, ‘glycoprotein complex’ and
‘dystrophin-associated glycoprotein complex’ (Table II). Furthermore, in the GO category
molecular function, upregulated DEGs in PTE were significantly
enriched in the terms ‘pattern recognition receptor activity’,
‘signaling pattern recognition receptor activity’, ‘low-density
lipoprotein particle binding’, ‘lipopolysaccharide binding’ and
‘lipoprotein particle binding’, while the downregulated ones were
mainly enriched in ‘voltage-gated ion channel activity’,
‘voltage-gated channel activity’, ‘substrate-specific channel
activity’, ‘structural constituent of eye lens’ and ‘channel
activity’ (Table III). The top 5
KEGG pathways enriched by the upregulated DEGs in PTE were the
‘phagosome pathway’, ‘rheumatoid arthritis pathway’, ‘leishmaniasis
pathway’, ‘hematopoietic cell lineage pathway’ and ‘Chagas disease
pathway’. The top 5 KEGG pathways for the downregulated DEGs were
‘calcium signaling pathway’, ‘neuroactive ligand-receptor
interaction pathway’, ‘arrhythmogenic right ventricular
cardiomyopathy pathway’, ‘hypertrophic cardiomyopathy pathway’ and
‘hypoxia-inducible factor-1 signaling pathway’ (Table IV and Fig. 2).
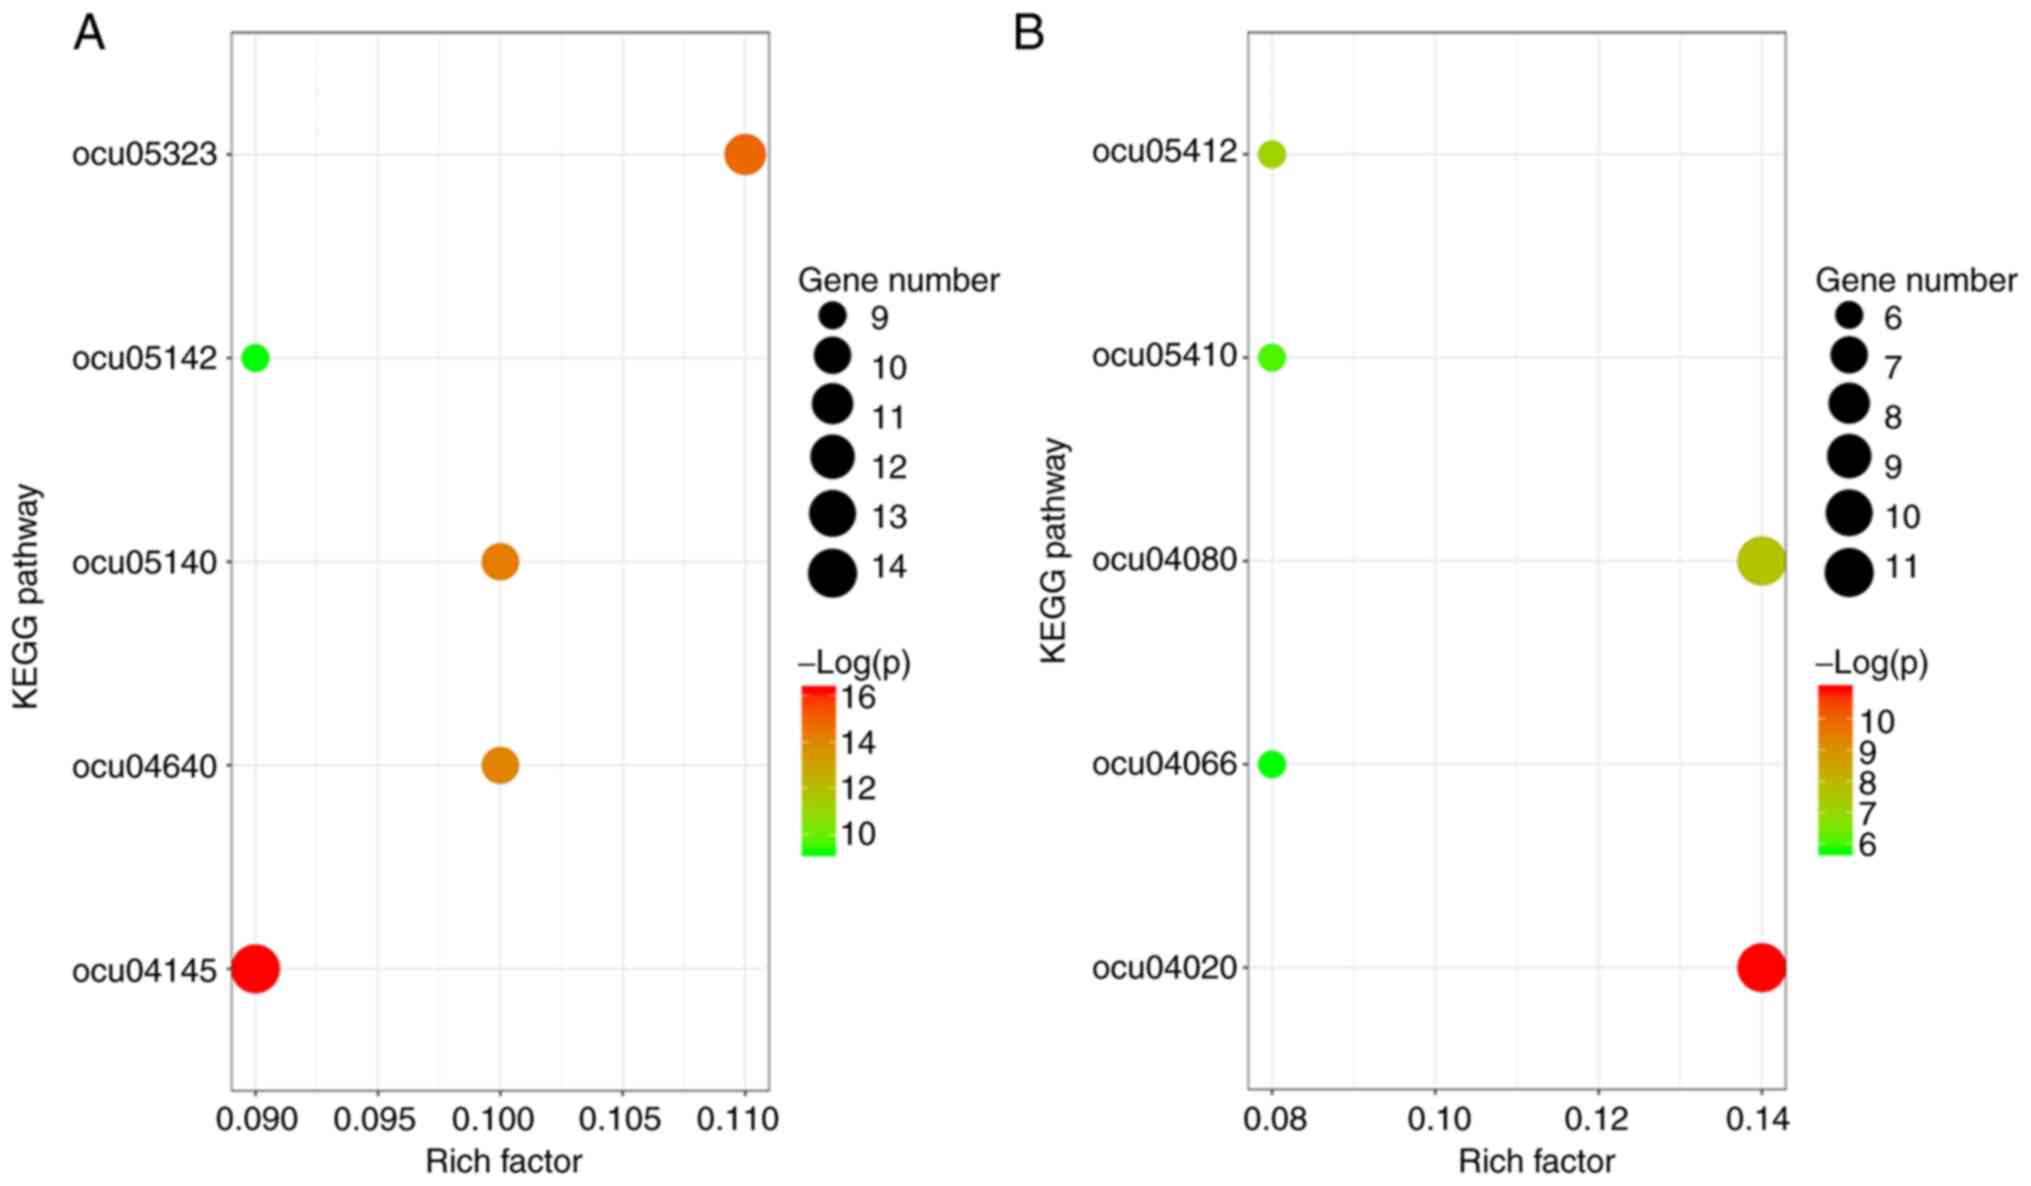 | Figure 2KEGG pathway enrichment analysis
results. (A) KEGG pathway enrichment analysis results of the
upregulated genes. Pathways: Ocu04145, phagosome pathway; ocu05323,
rheumatoid arthritis pathway; ocu05140, leishmaniasis pathway;
ocu04640, hematopoietic cell lineage pathway; ocu05142, Chagas
disease pathway. (B) KEGG pathway enrichment analysis results of
the downregulated genes. Pathways: ocu04020, calcium signaling
pathway; ocu04080, neuroactive ligand-receptor interaction pathway;
ocu05412, arrhythmogenic right ventricular cardiomyopathy pathway;
ocu05410, hypertrophic cardiomyopathy pathway; ocu04066,
hypoxia-inducible factor-1 signaling pathway. KEGG, Kyoto
Encyclopedia of Genes and Genomes. |
 | Table IGO analysis of the upregulated and
downregulated differentially expressed genes in the category
biological process. |
Table I
GO analysis of the upregulated and
downregulated differentially expressed genes in the category
biological process.
| A, Upregulated |
|---|
| Term | Function | Count | P-value |
|---|
| GO:0006955 | Immune response | 32 |
1.9x10⁻¹¹ |
| GO:0006952 | Defense response | 33 |
3.5x10⁻¹¹ |
| GO:0006954 | Inflammatory
response | 20 |
1.0x10⁻⁹ |
| GO:0002684 | Positive regulation
of immune system process | 24 |
5.1x10⁻⁹ |
| GO:0009605 | Response to external
stimulus | 37 |
3.5x10⁻⁸ |
| B, Downregulated |
| Term | Function | Count | P-value |
| GO:0006811 | Ion transport | 23 |
2.1x10⁻⁷ |
| GO:0003012 | Muscle system
process | 13 |
1.1x10⁻⁶ |
| GO:0030001 | Metal ion
transport | 17 |
1.2x10⁻⁶ |
| GO:0006936 | Muscle
contraction | 11 |
8.4x10⁻⁶ |
| GO:0006812 | Cation transport | 17 |
8.6x10⁻⁶ |
| Table IIGO analysis of the upregulated and
downregulated differentially expressed genes in the category
cellular component. |
Table II
GO analysis of the upregulated and
downregulated differentially expressed genes in the category
cellular component.
| A, Upregulated |
|---|
| Term | Function | Count | P-value |
|---|
| GO:0034358 | Plasma lipoprotein
particle | 8 |
4.1x10⁻⁸ |
| GO:1990777 | Lipoprotein
particle | 8 |
4.1x10⁻⁸ |
| GO:0032994 | Protein-lipid
complex | 8 |
7.1x10⁻⁸ |
| GO:0005615 | Extracellular
space | 28 |
5.1x10⁻⁷ |
| GO:0005576 | Extracellular
region | 58 |
3.2x10⁻⁵ |
| B,
Downregulated |
| Term | Function | Count | P-value |
| GO:0042383 | Sarcolemma | 8 |
1.4x10⁻⁵ |
| GO:0034703 | Cation channel
complex | 9 |
8.0x10⁻⁵ |
| GO:0034702 | Ion channel
complex | 10 |
2.0x10⁻⁴ |
| GO:0090665 | Glycoprotein
complex | 4 |
3.1x10⁻⁴ |
| GO:0016010 |
Dystrophin-associated glycoprotein
complex | 4 |
3.1x10⁻⁴ |
| Table IIIGO analysis of the upregulated and
downregulated differentially expressed genes in the category
molecular function. |
Table III
GO analysis of the upregulated and
downregulated differentially expressed genes in the category
molecular function.
| A, Upregulated |
|---|
| Term | Function | Count | P-value |
|---|
| GO:0038187 | Pattern recognition
receptor activity | 5 |
3.6x10⁻⁶ |
| GO:0008329 | Signaling pattern
recognition receptor activity | 5 |
3.6x10⁻⁶ |
| GO:0030169 | Low-density
lipoprotein particle binding | 5 |
8.4x10⁻⁶ |
| GO:0001530 | Lipopolysaccharide
binding | 5 |
1.7x10⁻⁵ |
| GO:0071813 | Lipoprotein
particle binding | 5 |
3.0x10⁻⁵ |
| B,
Downregulated |
| Term | Function | Count | P-value |
| GO:0005244 | Voltage-gated ion
channel activity | 15 |
2.7x10⁻¹⁰ |
| GO:0022832 | Voltage-gated
channel activity | 15 |
2.7x10⁻¹⁰ |
| GO:0022838 | Substrate-specific
channel activity | 19 |
1.5x10⁻⁸ |
| GO:0005212 | Structural
constituent of eye lens | 7 |
2.4x10⁻⁸ |
| GO:0015267 | Channel
activity | 19 |
2.4x10⁻⁸ |
| Table IVKyoto Encyclopedia of Genes and
Genomes pathway analysis of the upregulated and downregulated
differentially expressed genes. The top five terms were selected
based on the P-value when more than five enriched terms were
identified in each category. |
Table IV
Kyoto Encyclopedia of Genes and
Genomes pathway analysis of the upregulated and downregulated
differentially expressed genes. The top five terms were selected
based on the P-value when more than five enriched terms were
identified in each category.
| A, Upregulated |
|---|
| Term | Description | Count | P-value |
|---|
| ocu04145 | Phagosome
pathway | 14 |
9.1x10⁻⁸ |
| ocu05323 | Rheumatoid
arthritis pathway | 11 |
3.6x10⁻⁷ |
| ocu05140 | Leishmaniasis
pathway | 10 |
6.3x10⁻⁷ |
| ocu04640 | Hematopoietic cell
lineage pathway | 10 |
7.9x10⁻⁷ |
| ocu05142 | Chagas disease
pathway | 9 |
9.5x10⁻⁵ |
| Downregulated |
| Term | Description | Count | |
| ocu04020 | Calcium signaling
pathway | 11 |
1.8x10⁻⁵ |
| ocu04080 | Neuroactive
ligand-receptor interaction pathway | 11 |
4.7x10⁻⁴ |
| ocu05412 | Arrhythmogenic
right ventricular cardiomyopathy pathway | 6 |
7.9x10⁻⁴ |
| ocu05410 | Hypertrophic
cardiomyopathy pathway | 6 |
2.3x10⁻³ |
| ocu04066 | HIF-1 signaling
pathway | 6 |
3.1x10⁻³ |
PPI network analysis
A PPI network was constructed using STRING (Fig. 3). The top 10 genes with the highest
node degrees were determined using the Cytoscape software and these
genes were TNF, IL-1β, JUN, TLR4, PTGS2, vascular cell adhesion
molecule 1, SPP1, ryanodine receptor 2, TLR2 and ET-1 (Table V). The scores of closeness
centrality, degree centrality and betweenness centrality are
presented in Fig. 4. In the PPI
network, a total of 5 modules with an MCODE score ≥5 and number of
nodes >5 were obtained (Table
VI).
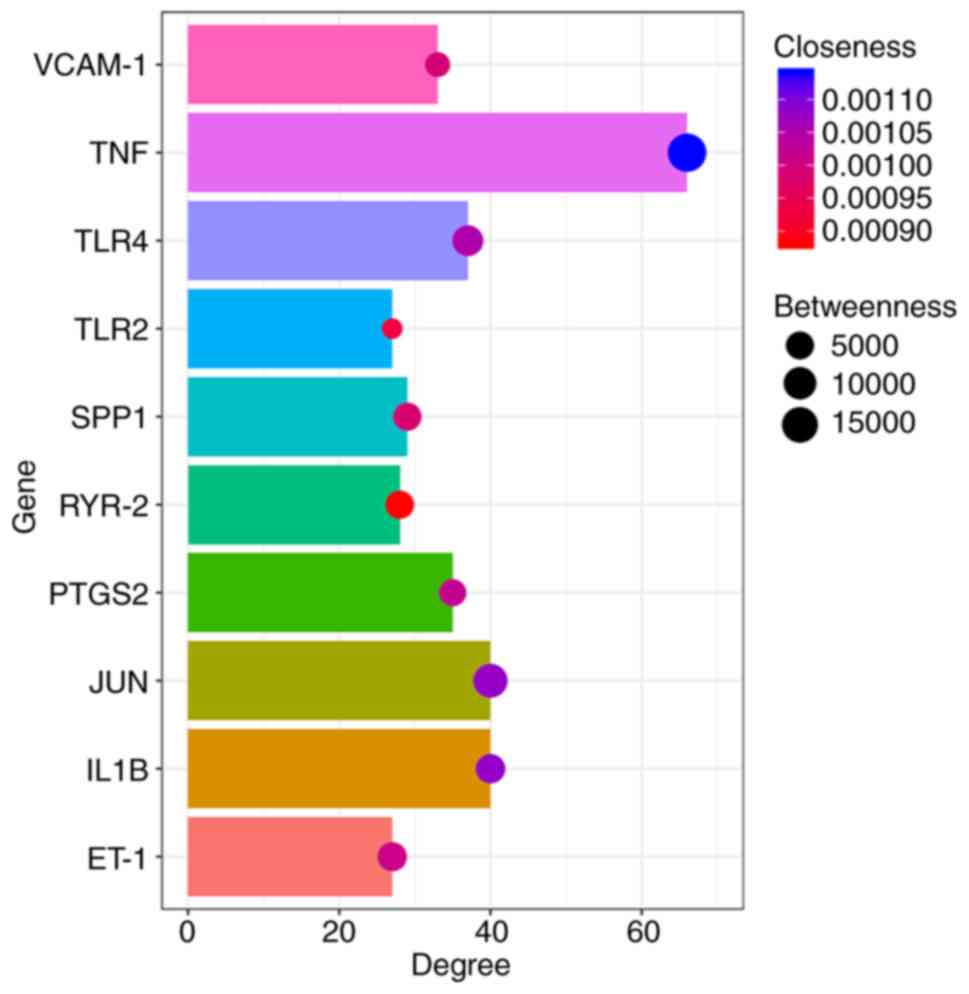 | Figure 4Betweenness, degree and closeness of
hub genes. The top three hub genes with the highest degree,
betweenness and closeness were TNF, JUN and IL-1β. The X-axis
represents the degree, the depth of the bubble color the closeness
and the size of the bubbles the betweenness centrality. VCAM-1,
vascular cell adhesion molecule 1; TLR4, Toll-like receptor 4;
TLR2, Toll-like receptor 2; SPP1, secreted phosphoprotein 1; RYR-2,
ryanodine receptor 2; PTGS2, prostaglandin-endoperoxide synthase 2;
ET-1, ETS proto-oncogene 1 transcription factor. |
| Table VTop 10 genes based on degree
centrality. |
Table V
Top 10 genes based on degree
centrality.
| Gene ID | Degree | Betweenness | Closeness |
|---|
| TNF | 66 | 19868 | 0.00114 |
| IL1B | 40 | 6314 | 0.00108 |
| JUN | 40 | 12052 | 0.00108 |
| TLR4 | 37 | 7908 | 0.00105 |
| PTGS2 | 35 | 4373 | 0.00102 |
| VCAM-1 | 33 | 3006 | 0.00099 |
| SPP1 | 29 | 5227 | 0.00098 |
| RYR-2 | 28 | 5346 | 0.00088 |
| TLR2 | 27 | 1916 | 0.00093 |
| ET-1 | 27 | 6190 | 0.00101 |
| Table VIScores obtained from five modules
from the protein-protein interaction network, which satisfied the
criteria of Molecular Complex Detection score ≥5 and number of
nodes >5. |
Table VI
Scores obtained from five modules
from the protein-protein interaction network, which satisfied the
criteria of Molecular Complex Detection score ≥5 and number of
nodes >5.
| Cluster | Score | Nodes | Edges |
|---|
| 1 | 7.333 | 19 | 66 |
| 2 | 6.897 | 30 | 100 |
| 3 | 5.667 | 7 | 17 |
| 4 | 5.600 | 6 | 14 |
| 5 | 5.429 | 8 | 19 |
GO and KEGG functional enrichment
analyses
The genes involved in the top two modules were
further subjected to GO and KEGG enrichment analysis. GO and KEGG
pathway analyses are two important bioinformatics tools that
systematically provide insight into how DEGs, including hub genes,
exert their biological functions. Therefore, the functions of DEGs
in PTE may be predicted using those GO and KEGG pathway analyses.
The genes in top module 1 were significantly enriched in the GO
terms ‘macromolecule localization’, ‘response to organic
substance’, ‘positive regulation of immune system process’, ‘plasma
lipoprotein particle’, ‘lipoprotein particle’, ‘protein-lipid
complex’, ‘low-density lipoprotein particle binding’, ‘lipoprotein
particle binding’ and ‘protein-lipid complex binding’. In the KEGG
pathway analysis, the terms ‘rheumatoid arthritis’, ‘malaria’ and
‘inflammatory bowel disease’ were significantly enriched (Table VII). The genes in top module 2
were mainly enriched in the GO terms ‘leukocyte activation’,
‘immune response’, ‘cell activation’, ‘myosin complex’, ‘external
side of plasma membrane’, ‘myofibril, motor activity’, ‘calcium ion
binding’ and ‘structural constituent of muscle’ and in the KEGG
pathway terms ‘TLR signaling pathway’ and ‘rheumatoid arthritis’
(Table VIII). The enrichment
analysis results for modules 1 and 2 are presented in Fig. 5. The common hub genes in the PPI
network and those in modules 1 and 2 were TLR4, TLR2, IL-1β, JUN,
PTGS2, SPP1 and ET-1. Boxplots indicating the expression levels are
presented in Fig. 6.
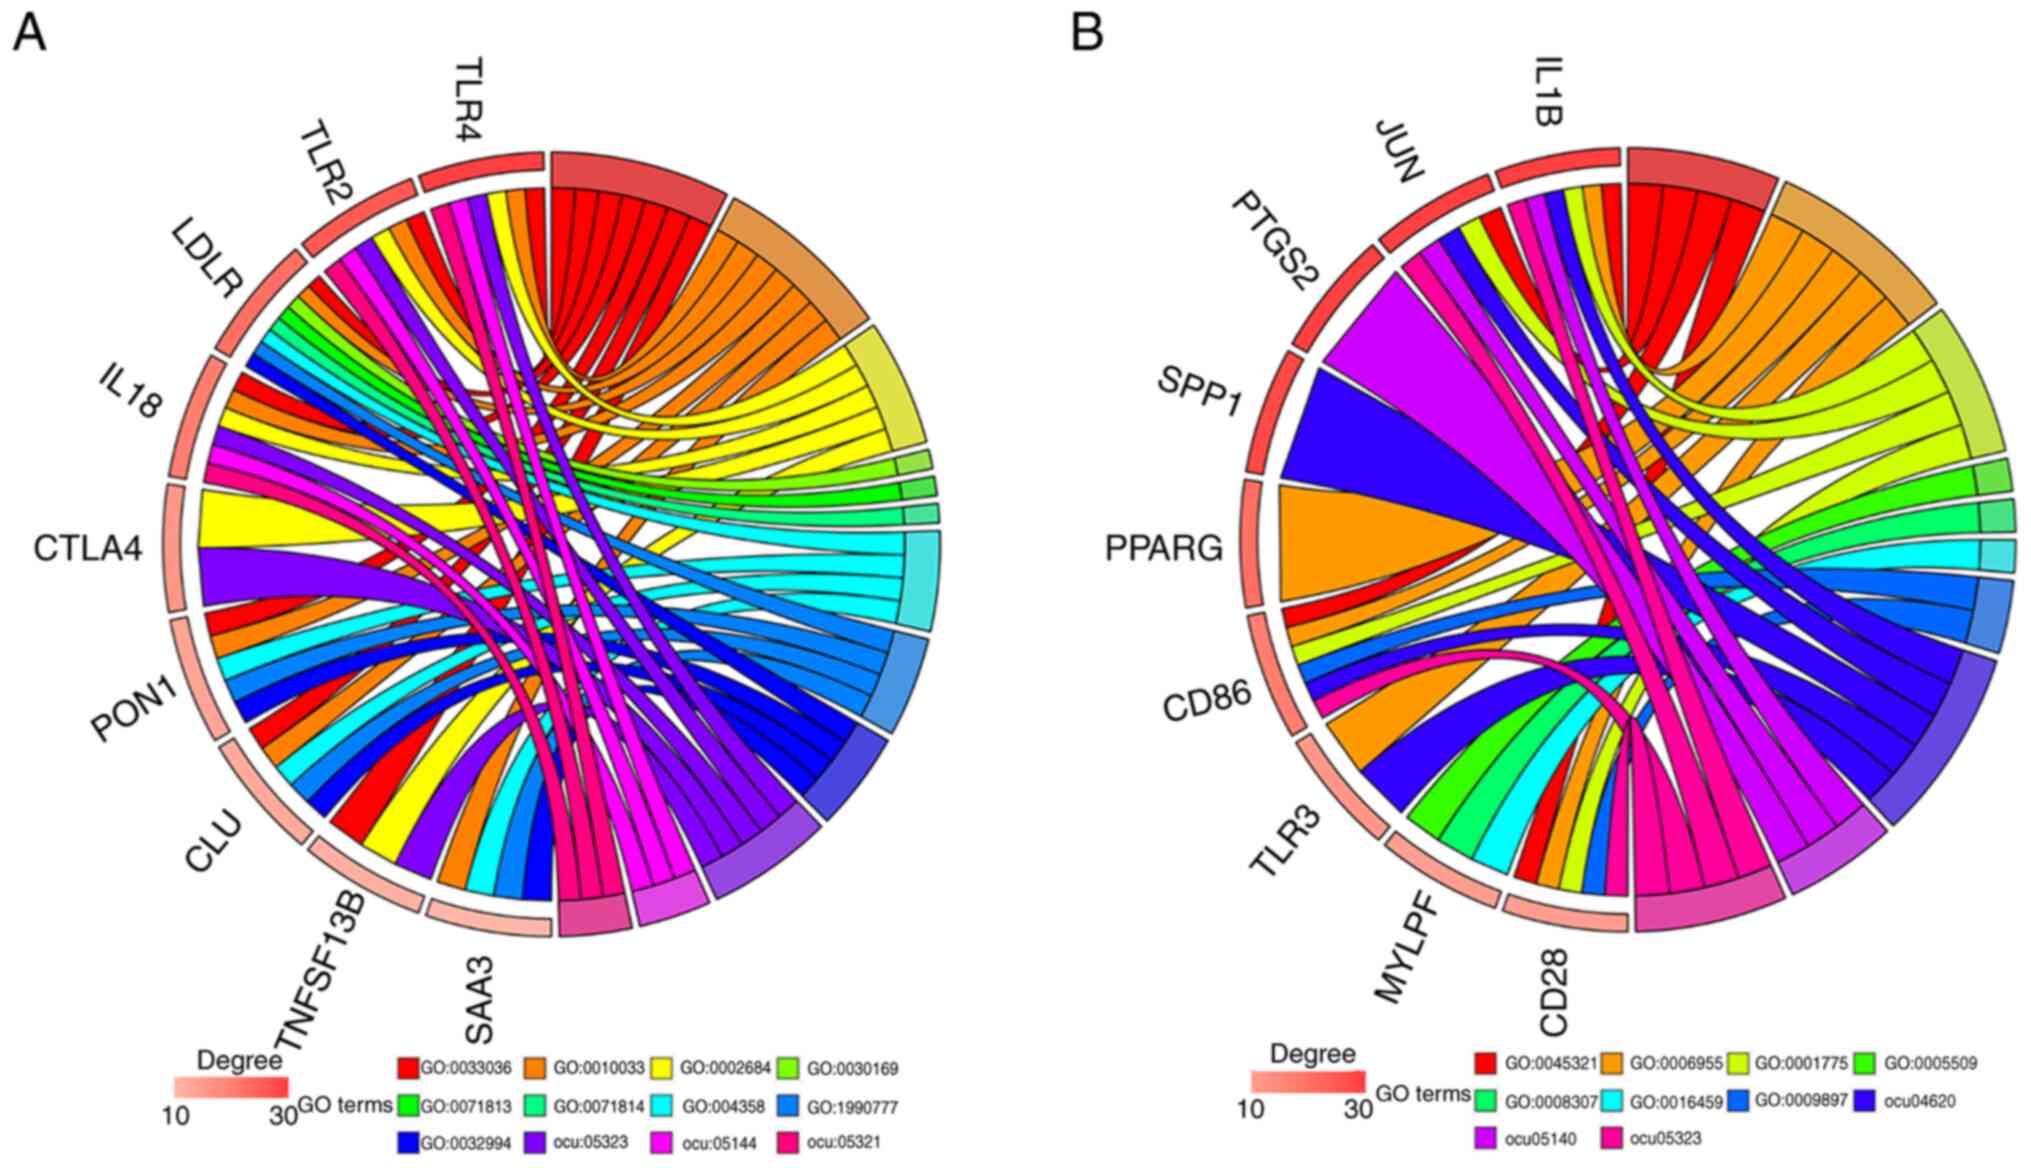 | Figure 5Top 10 enriched terms of modules 1 and
2. (A) The top 10 enriched terms of module 1. Biological process:
GO:0033036, macromolecule localization; GO:0010033, response to
organic substance; GO:0002684, positive regulation of immune system
process. Molecular function: GO:0030169, low-density lipoprotein
particle binding; GO:0071813, lipoprotein particle binding 3;
GO:0071814, protein-lipid complex binding. Cellular component:
GO:0034358, plasma lipoprotein particle; GO:1990777, lipoprotein
particle; GO:0032994, protein-lipid complex. KEGG pathways:
ocu05323, rheumatoid arthritis pathway; ocu05144, malaria pathway;
ocu05321, inflammatory bowel disease pathway. (B) The top 10
enriched terms of module 2. Biological process: GO:0045321,
leukocyte activation; GO:0006955, immune response; GO:0001775, cell
activation. Molecular function: GO:0005509, calcium ion binding;
GO:0008307, structural constituent of muscle. Cellular component:
GO:0016459, myosin complex; GO:0009897, external side of plasma
membrane. KEGG pathways: ocu04620, Toll-like receptor signaling
pathway; ocu05140, leishmaniasis; ocu05323, rheumatoid arthritis.
GO, Gene Ontology; KEGG, Kyoto Encyclopedia of Genes and Genomes.
TLR4, Toll-like receptor 4; TLR2, Toll-like receptor 2; LDLR, low
density lipoprotein receptor; CTLA4, cytotoxic T-lymphocyte
associated protein 4; PON1, paraoxonase 1; CLU, clusterin;
TNFSF13B, TNF superfamily member 13b; SAA3, serum amyloid A3,
pseudogene; PTGS2, prostaglandin-endoperoxide synthase 2; SPP1,
secreted phosphoprotein 1; PPARG, peroxisome proliferator activated
receptor gamma; CD86, CD86 molecule; TLR3, Toll-like receptor 3;
MYLPF, myosin light chain. |
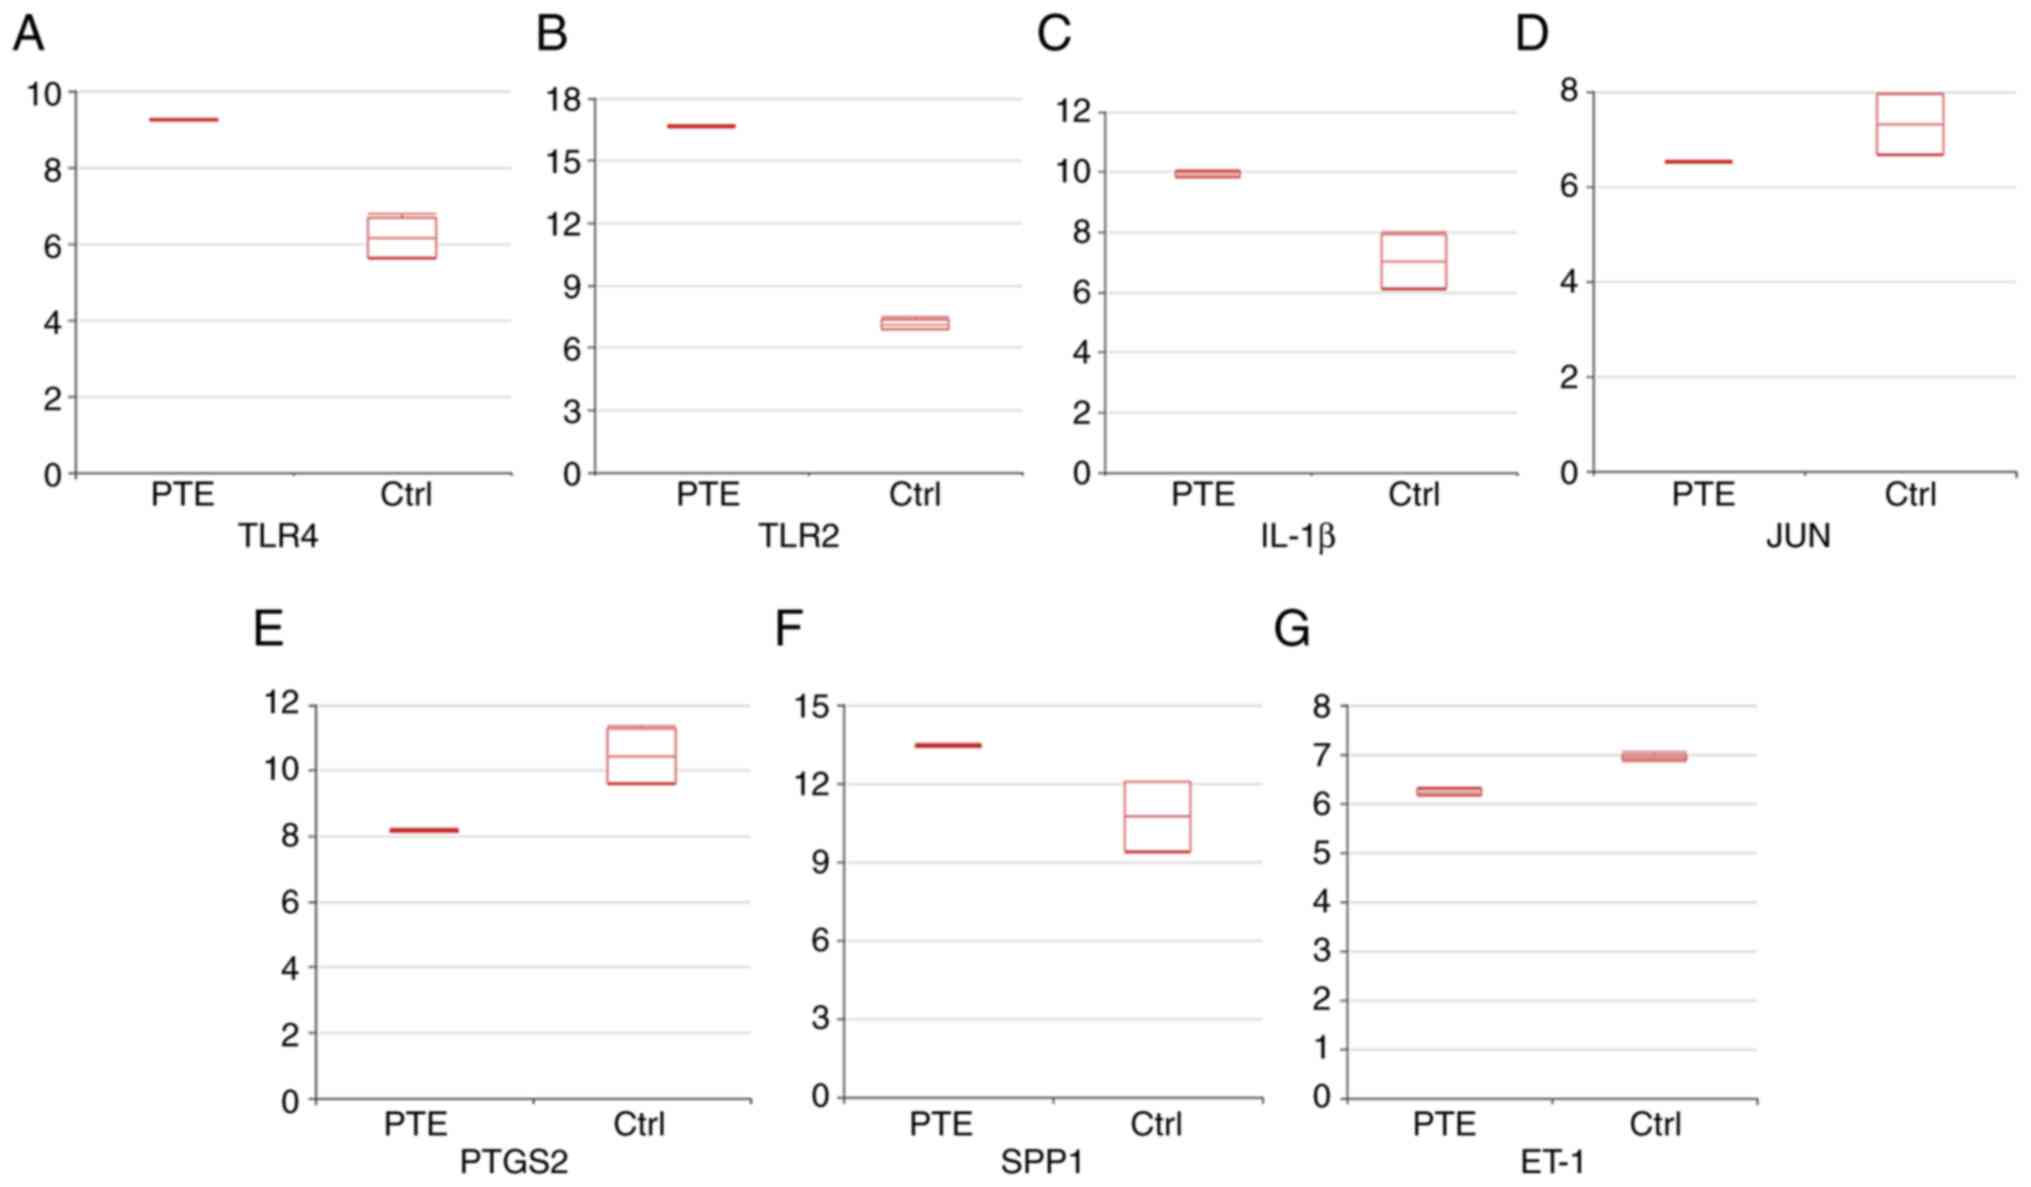 | Figure 6Expression levels of the indicated
markers. Boxplots indicating the expression levels of (A) TLR4 (B)
TLR2, (C) IL-1β, (D) JUN, (E) PTGS2, (F) SPP1 and (G) ET-1 (mean ±
SD) were visualized using the Morpheus online tool. The Y-axis
indicates the normalized expression value of the genes obtained
from the series matrix files of the GSE84738 dataset. TLR,
Toll-like receptor; PTGS2, prostaglandin-endoperoxide synthase 2;
SPP1, osteopontin; ET-1, endothelin-1; Ctrl, control; PTE,
pulmonary thromboembolism. |
| Table VIIFunctional and pathway enrichment
analysis of the top genes in module 1. The top three terms were
selected based on the P-value when more than three enriched terms
were identified in each category. |
Table VII
Functional and pathway enrichment
analysis of the top genes in module 1. The top three terms were
selected based on the P-value when more than three enriched terms
were identified in each category.
| A, Biological
process |
|---|
| Term | Name | Count | P-value |
|---|
| GO:0033036 | Macromolecule
localization | 11 |
8.4x10⁻⁶ |
| GO:0010033 | Response to organic
substance | 10 |
2.1x10⁻⁵ |
| GO:0002684 | Positive regulation
of immune system process | 7 |
3.6x10⁻⁵ |
| B, Cellular
component |
| Term | Name | Count | P-value |
| GO:0034358 | Plasma lipoprotein
particle | 7 |
2.3x10⁻¹² |
| GO:1990777 | Lipoprotein
particle | 7 |
2.3x10⁻¹² |
| GO:0032994 | Protein-lipid
complex | 7 |
3.6x10⁻¹² |
| C, Molecular
function |
| Term | Name | Count | P-value |
| GO:0030169 | Low-density
lipoprotein particle binding | 3 |
8.8x10⁻⁵ |
| GO:0071813 | Lipoprotein
particle binding | 3 |
1.6x10⁻⁴ |
| GO:0071814 | Protein-lipid
complex binding | 3 |
1.6x10⁻⁴ |
| D, KEGG
pathway |
| Term | Name | Count | P-value |
| ocu05323 | Rheumatoid
arthritis | 6 |
1.3x10⁻⁷ |
| ocu05144 | Malaria | 4 |
5.0x10⁻⁵ |
| ocu05321 | Inflammatory bowel
disease | 4 |
1.2x10⁻⁴ |
| Table VIIIFunctional and pathway enrichment
analysis of the top genes in module 2. The top three terms were
selected based on the P-value when more than three enriched terms
were identified in each category. |
Table VIII
Functional and pathway enrichment
analysis of the top genes in module 2. The top three terms were
selected based on the P-value when more than three enriched terms
were identified in each category.
| A, Biological
process |
|---|
| Term | Name | Count | P-value |
|---|
| GO:0045321 | Leukocyte
activation | 9 |
6.7x10⁻⁶ |
| GO:0006955 | Immune
response | 10 |
1.2x10⁻⁵ |
| GO:0001775 | Cell
activation | 9 |
2.0x10⁻⁵ |
| B, Cellular
component |
| Term | Name | Count | P-value |
| GO:0016459 | Myosin complex | 5 |
7.0x10⁻⁶ |
| GO:0009897 | External side of
plasma membrane | 6 |
4.7x10⁻⁵ |
| GO:0030016 | Myofibril | 5 |
1.6x10⁻⁴ |
| C, Molecular
functions |
| Term | Name | Count | P-value |
| GO:0003774 | Motor activity | 4 |
9.6x10⁻⁴ |
| GO:0005509 | Calcium ion
binding | 5 |
1.3x10⁻² |
| GO:0008307 | Structural
constituent of muscle | 2 |
2.7x10⁻² |
| D, KEGG
pathway |
| Term | Name | Count | P-value |
| ocu04620 | Toll-like receptor
signaling pathway | 6 |
7.0x10⁻⁶ |
| ocu05140 | Toll-like receptor
signaling pathway | 4 |
1.6x10⁻³ |
| ocu05323 | Rheumatoid
arthritis | 4 |
2.9x10⁻³ |
Validation of differential expression
of TLR4, TLR2, IL-1β and SPP1 in patients with PTE
Since the microarray dataset GSE84738 included data
from a rabbit model of PTE, it was uncertain whether similar
results were able to be obtained from human subjects with PTE.
Therefore, the mRNA expression levels of the top seven DEGs were
determined in patients with PTE and healthy controls using RT-qPCR
analysis. There are no significant differences between the two
groups in terms of age, sex distribution and BMI (Table SI). As presented in Fig. 7, the mRNA levels of TLR4, TLR2,
IL-1β and SPP1 were significantly upregulated in patients with PTE
compared with those in healthy controls. These results were
consistent with those obtained by the bioinformatics analysis. The
schema of the study is shown in Fig.
8.
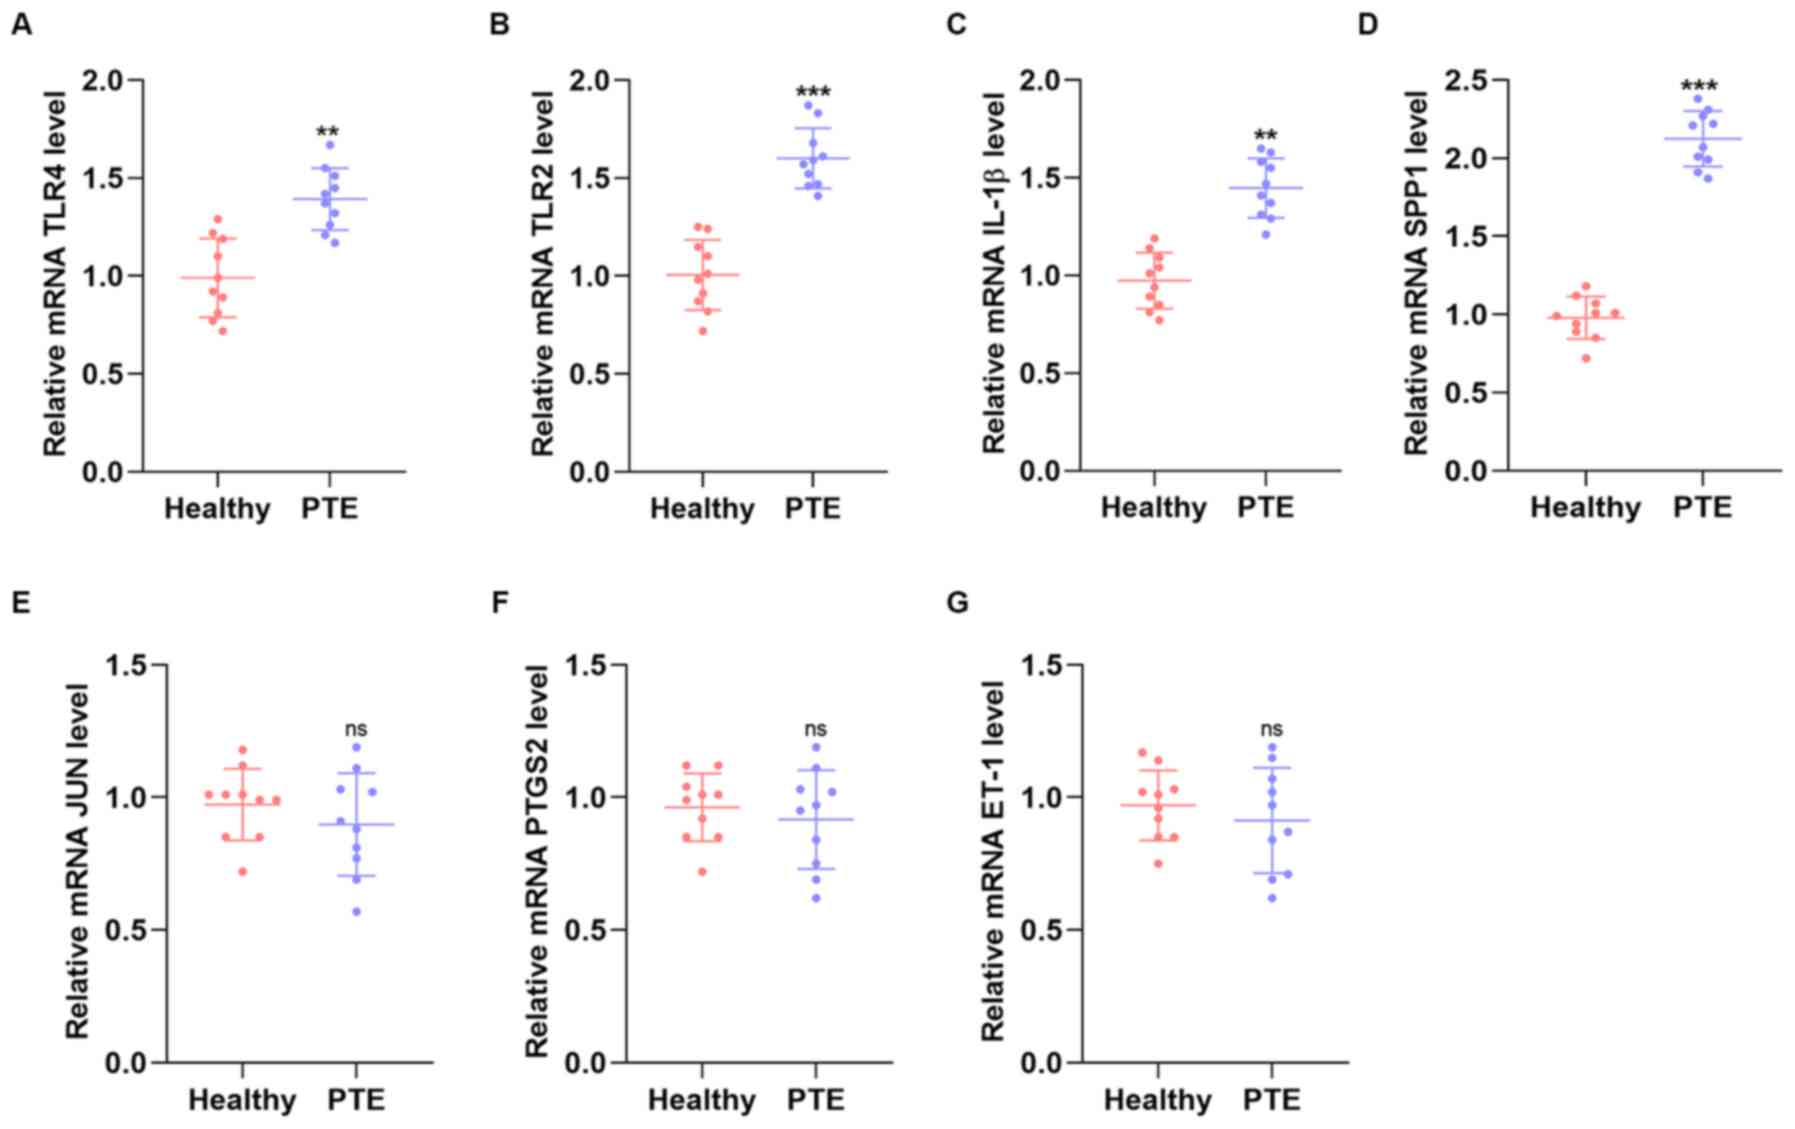 | Figure 7mRNA expression levels of TLR4, TLR2,
IL-1β and SPP1. The mRNA expression levels of (A) TLR4, (B) TLR2,
(C) IL-1β, (D) SPP1, (E) JUN, (F) PTGS2 and (G) ET-1 in patients
with PTE and healthy controls (n=10, per group) were determined by
reverse transcription-quantitative PCR. Values are expressed as the
mean ± standard deviation from three independent experiments.
**P<0.01 and ***P<0.001 vs. healthy
group. The Y-axis represents the relative mRNA expression (target
gene/β-actin). TLR, Toll-like receptor; SPP1, osteopontin; PTE,
pulmonary thromboembolism; PTGS-2, prostaglandin-endoperoxide
synthase 2; ET-1, endothelin-1. |
Discussion
In the present study, microarray data from four
model rabbits with PTE and four control rabbits were compared and
319 DEGs, including 160 upregulated and 159 downregulated genes,
were identified. Furthermore, a PPI network was constructed to
reveal the functional interactions between DEGs and the seven most
common hub genes between the top 10 genes in the PPI network and
the top 10 genes in modules 1 and 2 were screened out using the
plugin software MCODE of the Cytoscape. These genes were IL-1β,
JUN, TLR4, PTGS2, SPP1, TLR2 and ET-1.
PTE is a fatal clinical syndrome, which is
characterized by breathing difficulty, chest pain or discomfort,
faster than normal or irregular heartbeat, hemoptysis, low blood
pressure, light-headedness or fainting (19). Studies have recently focused on the
underlying mechanisms of PTE and several functional genes have been
identified as key factors in the development of PTE. For instance,
Liu et al (20) reported
that the upregulation of stress-associated endoplasmic reticulum
protein 1 was closely associated with the pathogenesis of PTE and a
decreased endoplasmic reticulum stress response exhibited a crucial
role in this process. Similarly, another study revealed that
resveratrol was able to attenuate PTE via regulating the expression
of metastasis-associated lung adenocarcinoma transcript 1 in lung
tissues (21). In the present
study, IL-1β, JUN, TLR4, PTGS2, SPP1, TLR2 and ET-1 were identified
to be the genes most closely associated with PTE in a microarray
dataset from a rabbit model. To validate the significance of the
aforementioned genes in the pathogenesis of PTE in humans, their
mRNA expression levels were determined in patients with PTE and
healthy controls. RT-qPCR analysis revealed that the expression of
TLR4, TLR2, IL-1β and SPP1 was significantly upregulated in
patients with PTE.
It has been reported that the TLR2/4-mediated NF-κB
signaling pathway is an important regulatory mechanism in coronary
microembolization-induced myocardial injury (22). In addition, a previous study has
highlighted the crucial role of TLR4 in the regulation of fat
embolism syndrome via the TLR-JNK signaling pathway (23). In the present study, the expression
of TLR4 and TLR2 was indicated to be markedly increased in patients
with PTE compared with that in healthy controls. This finding
combined with the bioinformatics analysis results suggested that
TLR4 and TLR2 may serve as potential biomarkers for the diagnosis
of PTE.
IL-1β, also known as leukocytic pyrogen, leukocytic
endogenous mediator, mononuclear cell factor or
lymphocyte-activating factor, is a cytokine protein that is encoded
by the IL-1β gene in humans (24).
It has been previously reported that acute pulmonary embolism is
associated with a significant release of IL-1β (25). SPP1 has been an important role in
the regulation of cell-matrix interactions and endogenous ligands
(26). In a previous study, the
levels of SPP1 were measured in 119 patients with PTE and the
results supported the potential roles of SPP1 in inflammatory and
fibrotic processes in PTE. In the present study, the expression of
IL-1β and SPP1 was significantly elevated in the serum of patients
with PTE compared with that in the controls and both genes were
identified to be closely associated with PTE. Therefore, it was
hypothesized that IL-1β and SPP1 may be potential biomarkers for
PTE. However, there is still a long way to go prior to the
application of the current results in clinical practice. Since the
incidence of PTE is significant, early diagnosis of the disease is
of great importance. The results of the present study may provide
researchers with additional knowledge in order to further
investigate the mechanisms underlying PTE, with the aim that
high-risk patients may be screened based on the expression of the
PTE-related hub genes. In addition, these hub genes may be
considered as potential therapeutic targets.
Similar to other bioinformatics-based studies, the
present study has certain limitations. First, no in vivo
experiments were performed to further confirm the role of hub genes
in the pathogenesis of PTE. In addition, subtypes of PTE were not
investigated in the present study. Therefore, further studies on
the molecular mechanisms underlying the pathogenesis of various
subtypes of PTE are urgently required (27).
Taken together, the present study demonstrated that
the expression of TLR4, TLR2, IL-1β and SPP1 was increased in
patients with PTE using both bioinformatics analyses and validation
experiments, thus providing novel insight into potential biomarkers
for the increasing risk of PTE.
Supplementary Material
Baseline characteristics of the two
groups.
Acknowledgements
Not applicable.
Funding
The present study was supported by the Construction of Key
Medical Specialties in Shanghai (grant no. ZK2019-B05) and the
Clinical Characteristics of Health System in Pudong New Area,
Shanghai (grant no. PWYts2018-02).
Availability of data and materials
The datasets used and/or analyzed during the current
study are available from the corresponding author on reasonable
request.
Authors' contributions
PC and JZ designed the study. YL and JD performed
the experiments. QL collected the data and performed the
statistical analysis. YL and JD prepared the manuscript. YL and PC
check and confirm the authenticity of the data. All authors read
and approved the final manuscript.
Ethics approval and consent to
participate
The present study was approved by the Committees of
Clinical Ethics of Shanghai University of Medicine and Health
Sciences Affiliated Zhoupu Hospital (Shanghai, China; approval no.
2019-042-84). Written informed consent was obtained from all
patients.
Patient consent for publication
Not applicable.
Competing interests
The authors declare that they have no competing
interests.
References
|
1
|
Brekelmans MP, Ageno W, Beenen LF, Brenner
B, Buller HR, Chen CZ, Cohen AT, Grosso MA, Meyer G, Raskob G, et
al: Recurrent venous thromboembolism in patients with pulmonary
embolism and right ventricular dysfunction: A post-hoc analysis of
the Hokusai-VTE study. Lancet Haematol. 3:e437–e445.
2016.PubMed/NCBI View Article : Google Scholar
|
|
2
|
Fang MC, Fan D, Sung SH, Witt DM,
Schmelzer JR, Williams MS, Yale SH, Baumgartner C and Go AS:
Treatment and outcomes of acute pulmonary embolism and deep venous
thrombosis: The CVRN VTE study. Am J Med. 132:1450–1457.e1.
2019.PubMed/NCBI View Article : Google Scholar
|
|
3
|
Coquoz N, Weilenmann D, Stolz D, Popov V,
Azzola A, Fellrath JM, Stricker H, Pagnamenta A, Ott S, Ulrich S,
et al: Multicentre observational screening survey for the detection
of CTEPH following pulmonary embolism. Eur Respir J.
51(1702505)2018.PubMed/NCBI View Article : Google Scholar
|
|
4
|
Jiménez D, Bikdeli B, Quezada A, Muriel A,
Lobo JL, de Miguel-Diez J, Jara-Palomares L, Ruiz-Artacho P, Yusen
RD and Monreal M: RIETE investigators. Hospital volume and outcomes
for acute pulmonary embolism: Multinational population based cohort
study. BMJ. 366(l4416)2019.PubMed/NCBI View Article : Google Scholar
|
|
5
|
Becattini C, Giustozzi M, Cerdà P, Cimini
LA, Riera-Mestre A and Agnelli G: Risk of recurrent venous
thromboembolism after acute pulmonary embolism: Role of residual
pulmonary obstruction and persistent right ventricular dysfunction.
A meta-analysis. J Thromb Haemost. 17:1217–1228. 2019.PubMed/NCBI View Article : Google Scholar
|
|
6
|
Xiong Y, Mi BB, Liu MF, Xue H, Wu QP and
Liu GH: Bioinformatics analysis and identification of genes and
molecular pathways involved in synovial inflammation in rheumatoid
arthritis. Med Sci Monit. 25:2246–2256. 2019.PubMed/NCBI View Article : Google Scholar
|
|
7
|
Yu T, You X, Zhou H, Kang A, He W, Li Z,
Li B, Xia J, Zhu H, Zhao Y, et al: p53 plays a central role in the
development of osteoporosis. Aging (Albany NY). 12:10473–10487.
2020.PubMed/NCBI View Article : Google Scholar
|
|
8
|
Yu T, Xiong Y, Luu S, You X, Li B, Xia J,
Zhu H, Zhao Y, Zhou H, Yu G and Yang Y: The shared KEGG pathways
between icariin-targeted genes and osteoporosis. Aging (Albany NY).
12:8191–8201. 2020.PubMed/NCBI View Article : Google Scholar
|
|
9
|
Xiong Y, Cao F, Chen L, Yan C, Zhou W,
Chen Y, Endo Y, Leng X, Mi B and Liu G: Identification of key
microRNAs and target genes for the diagnosis of bone nonunion. Mol
Med Rep. 21:1921–1933. 2020.PubMed/NCBI View Article : Google Scholar
|
|
10
|
Yu T, Wang Z, You X, Zhou H, He W, Li B,
Xia J, Zhu H, Zhao Y, Yu G, et al: Resveratrol promotes
osteogenesis and alleviates osteoporosis by inhibiting p53. Aging
(Albany NY). 12:10359–10369. 2020.PubMed/NCBI View Article : Google Scholar
|
|
11
|
Desch KC, Ozel AB, Halvorsen M, Jacobi PM,
Golden K, Underwood M, Germain M, Tregouet DA, Reitsma PH, Kearon
C, et al: Whole-exome sequencing identifies rare variants in STAB2
associated with venous thromboembolic disease. Blood. 136:533–541.
2020.PubMed/NCBI View Article : Google Scholar
|
|
12
|
Veninga A, De Simone I, Heemskerk JWM,
Cate HT and van der Meijden PEJ: Clonal hematopoietic mutations
linked to platelet traits and the risk of thrombosis or bleeding.
Haematologica. 105:2020–2031. 2020.PubMed/NCBI View Article : Google Scholar
|
|
13
|
Mi B, Liu G, Zhou W, Lv H, Zha K, Liu Y,
Wu Q and Liu J: Bioinformatics analysis of fibroblasts exposed to
TGF-β at the early proliferation phase of wound repair. Mol Med
Rep. 16:8146–8154. 2017.PubMed/NCBI View Article : Google Scholar
|
|
14
|
Huang da W, Sherman BT and Lempicki RA:
Systematic and integrative analysis of large gene lists using DAVID
bioinformatics resources. Nat Protoc. 4:44–57. 2009.PubMed/NCBI View Article : Google Scholar
|
|
15
|
von Mering C, Jensen LJ, Snel B, Hooper
SD, Krupp M, Foglierini M, Jouffre N, Huynen MA and Bork P: STRING:
Known and predicted protein-protein associations, integrated and
transferred across organisms. Nucleic Acids Res. 33 (Database
Issue):D433–D437. 2005.PubMed/NCBI View Article : Google Scholar
|
|
16
|
Shannon P, Markiel A, Ozier O, Baliga NS,
Wang JT, Ramage D, Amin N, Schwikowski B and Ideker T: Cytoscape: A
software environment for integrated models of biomolecular
interaction networks. Genome Res. 13:2498–2504. 2003.PubMed/NCBI View Article : Google Scholar
|
|
17
|
Bader GD and Hogue CW: An automated method
for finding molecular complexes in large protein interaction
networks. BMC Bioinformatics. 4(2)2003.PubMed/NCBI View Article : Google Scholar
|
|
18
|
Livak KJ and Schmittgen TD: Analysis of
relative gene expression data using real-time quantitative PCR and
the 2(-Delta Delta C(T)) method. Methods. 25:402–408.
2001.PubMed/NCBI View Article : Google Scholar
|
|
19
|
Essien EO, Rali P and Mathai SC: Pulmonary
embolism. Med Clin North Am. 103:549–564. 2019.PubMed/NCBI View Article : Google Scholar
|
|
20
|
Liu TW, Liu F and Kang J: Let-7b-5p is
involved in the response of endoplasmic reticulum stress in acute
pulmonary embolism through upregulating the expression of
stress-associated endoplasmic reticulum protein 1. IUBMB Life.
72:1725–1736. 2020.PubMed/NCBI View
Article : Google Scholar
|
|
21
|
Yang K, Li W, Duan W, Jiang Y, Huang N, Li
Y, Ren B and Sun J: Resveratrol attenuates pulmonary embolism
associated cardiac injury by suppressing activation of the
inflammasome via the MALAT1-miR-22-3p signaling pathway. Int J Mol
Med. 44:2311–2320. 2019.PubMed/NCBI View Article : Google Scholar
|
|
22
|
Su Q, Lv X, Sun Y, Ye Z, Kong B and Qin Z:
Role of TLR4/MyD88/NF-κB signaling pathway in coronary
microembolization-induced myocardial injury prevented and treated
with nicorandil. Biomed Pharmacother. 106:776–784. 2018.PubMed/NCBI View Article : Google Scholar
|
|
23
|
Xiong L, Sun L, Liu S, Zhu X, Teng Z and
Yan J: The protective roles of urinary trypsin inhibitor in brain
injury following fat embolism syndrome in a rat model. Cell
Transplant. 28:704–712. 2019.PubMed/NCBI View Article : Google Scholar
|
|
24
|
Licata G, Tuttolomondo A, Di Raimondo D,
Corrao S, Di Sciacca R and Pinto A: Immuno-inflammatory activation
in acute cardio-embolic strokes in comparison with other subtypes
of ischaemic stroke. Thromb Haemost. 101:929–937. 2009.PubMed/NCBI
|
|
25
|
Sun TW, Zhang JY, Li L and Wang LX: Effect
atorvastatin on serum tumor necrosis factor alpha and
interleukin-1β following acute pulmonary embolism. Exp Lung Res.
37:78–81. 2011.PubMed/NCBI View Article : Google Scholar
|
|
26
|
von Zur Mühlen C, Koeck T, Schiffer E,
Sackmann C, Zürbig P, Hilgendorf I, Reinöhl J, Rivera J, Zirlik A,
Hehrlein C, et al: Urine proteome analysis as a discovery tool in
patients with deep vein thrombosis and pulmonary embolism.
Proteomics Clin Appl. 10:574–584. 2016.PubMed/NCBI View Article : Google Scholar
|
|
27
|
Kölmel S, Hobohm L, Käberich A, Krieg VJ,
Bochenek ML, Wenzel P, Wiedenroth CB, Liebetrau C, Hasenfuß G,
Mayer E, et al: Potential involvement of osteopontin in
inflammatory and fibrotic processes in pulmonary embolism and
chronic thromboembolic pulmonary hypertension. Thromb Haemost.
119:1332–1346. 2019.PubMed/NCBI View Article : Google Scholar
|