Introduction
Budd-Chiari syndrome (BCS) is a pathological
condition associated with obstruction of the hepatic veins (HVs)
and/or the inferior vena cava (IVC) above its opening (1). Percutaneous transluminal angioplasty
is a relatively effective treatment but relapse after surgery is
common; therefore, it is important to determine the mechanism
underlying the development of BCS and evaluate interventional
efficacy (2,3). Previous studies have demonstrated that
hemodynamic changes are crucial for the occurrence of
cardiovascular system-associated diseases but currently available
research has mostly been limited to the arterial vasculature,
including cerebral arteries, carotid arteries, and thoracic and
abdominal aorta (4-6).
Research on the diseases of the IVC is still in its early stages.
In the present study, a patient with BCS with obstruction of the
IVC was selected and the computational fluid dynamics (CFD)
technique was used to evaluate the changes in blood flow velocity,
wall pressure and wall shear stress prior to and after
interventional treatment. Based on previous research, a combination
of semi-quantitative and quantitative indicators was used to
analyze the hydrodynamic parameters of the IVC (7). The aim of the present study was to
provide a novel quantitative method to further elucidate the
hemodynamic changes and possible mechanisms underlying IVC
obstruction in BCS prior to and after interventional therapy.
Materials and methods
Study subject
A female 64-year-old patient with BCS and IVC
obstruction was selected as the study subject. The patient was
admitted to the Affiliated Hospital of Xuzhou Medical University
(Xuzhou, China) due to abdominal distension and wheezing. The
patient had signed an informed consent form prior to treatment and
consent for publication was also obtained from the patient. The
present study was approved by the Institutional Review Board of
Affiliated Hospital of Xuzhou Medical University.
MRI data acquisition
MR venography was performed with a 3.0-T clinical
unit (Discovery 750w; GE Healthcare) along with a 32-element
phased-array coil. Dynamic LAVA MR sequences were performed prior
to and after the administration of the contrast agent
(gadopentetate dimeglumine) during three different phases: Hepatic
arterial phase (25 sec after contrast agent administration), portal
venous phase (60 sec after contrast agent administration) and
equilibrium phase (150 sec after contrast agent administration).
The parameters for the LAVA sequence were as follows: Matrix,
288x256; flip angle, 12˚; bandwidth, 83.33; field of view, 40 cm;
layer thickness, 0.8 mm.
Interventional therapy
A GE 3100 digital subtraction angiography machine
(GE Healthcare) and the Seldinger puncture technique were used for
endovascular interventional therapy. The stenosis of IVC was
pre-dilated with a small balloon catheter (Cook Medical Inc.) and
then dilated repeatedly with a large balloon (Cook Medical
Inc.).
Vascular modeling
The 3-dimensional (3D) image was reconstructed by
Simpleware software using MR venography images and the model was
smoothed and meshed by intercepting the target blood vessels.
Subsequently, the files were imported into the Fluent 17.0 software
(ANSYS, Inc.) to establish an individualized model of the IVC. The
IVC model included the IVC and HVs. The blood flow in the lumen was
modeled as a homogeneous and incompressible Newtonian fluid, the
dynamic blood viscosity was 0.0035 P and the mass density was 1,050
kg/m3. It was hypothesized that the vessel wall was
rigid and the velocity on the wall was set to 0 m/sec. The
continuity equation of flow mass conservation and the Navier-Stokes
equation of momentum conservation were adopted (8). The heart rate was assumed to be 85/min
and the cardiac cycle 0.7 sec. The entire calculation process
started from the static flow field with a time step of 0.035 sec.
The maximum number of iterations per time step was 2,000 and the
time step was 20 steps. Fluent software was used to output the
maximum and minimum hemodynamic simulation values of blood flow
velocity, wall shear stress and wall pressure prior to and after
interventional therapy in one cardiac cycle. The mass flow rate was
all set at 0.1 m/sec at the inlets and the blood pressure at the
exit was set to 0 Pa.
Statistical analysis
All statistical analyses were performed using
GraphPad Prism software (version 5.0; GraphPad Software, Inc.). The
hemodynamic parameters (blood flow velocity, wall shear stress and
wall pressure) of 20 nodes in a complete cardiac cycle at the
narrowest point of the IVC were measured and their mean values (±
standard deviation) were calculated. The parameters prior to and
after interventional therapy were compared using a paired-samples
t-test. P<0.01 was considered to indicate a statistically
significant difference.
Results
General characteristics of the
model
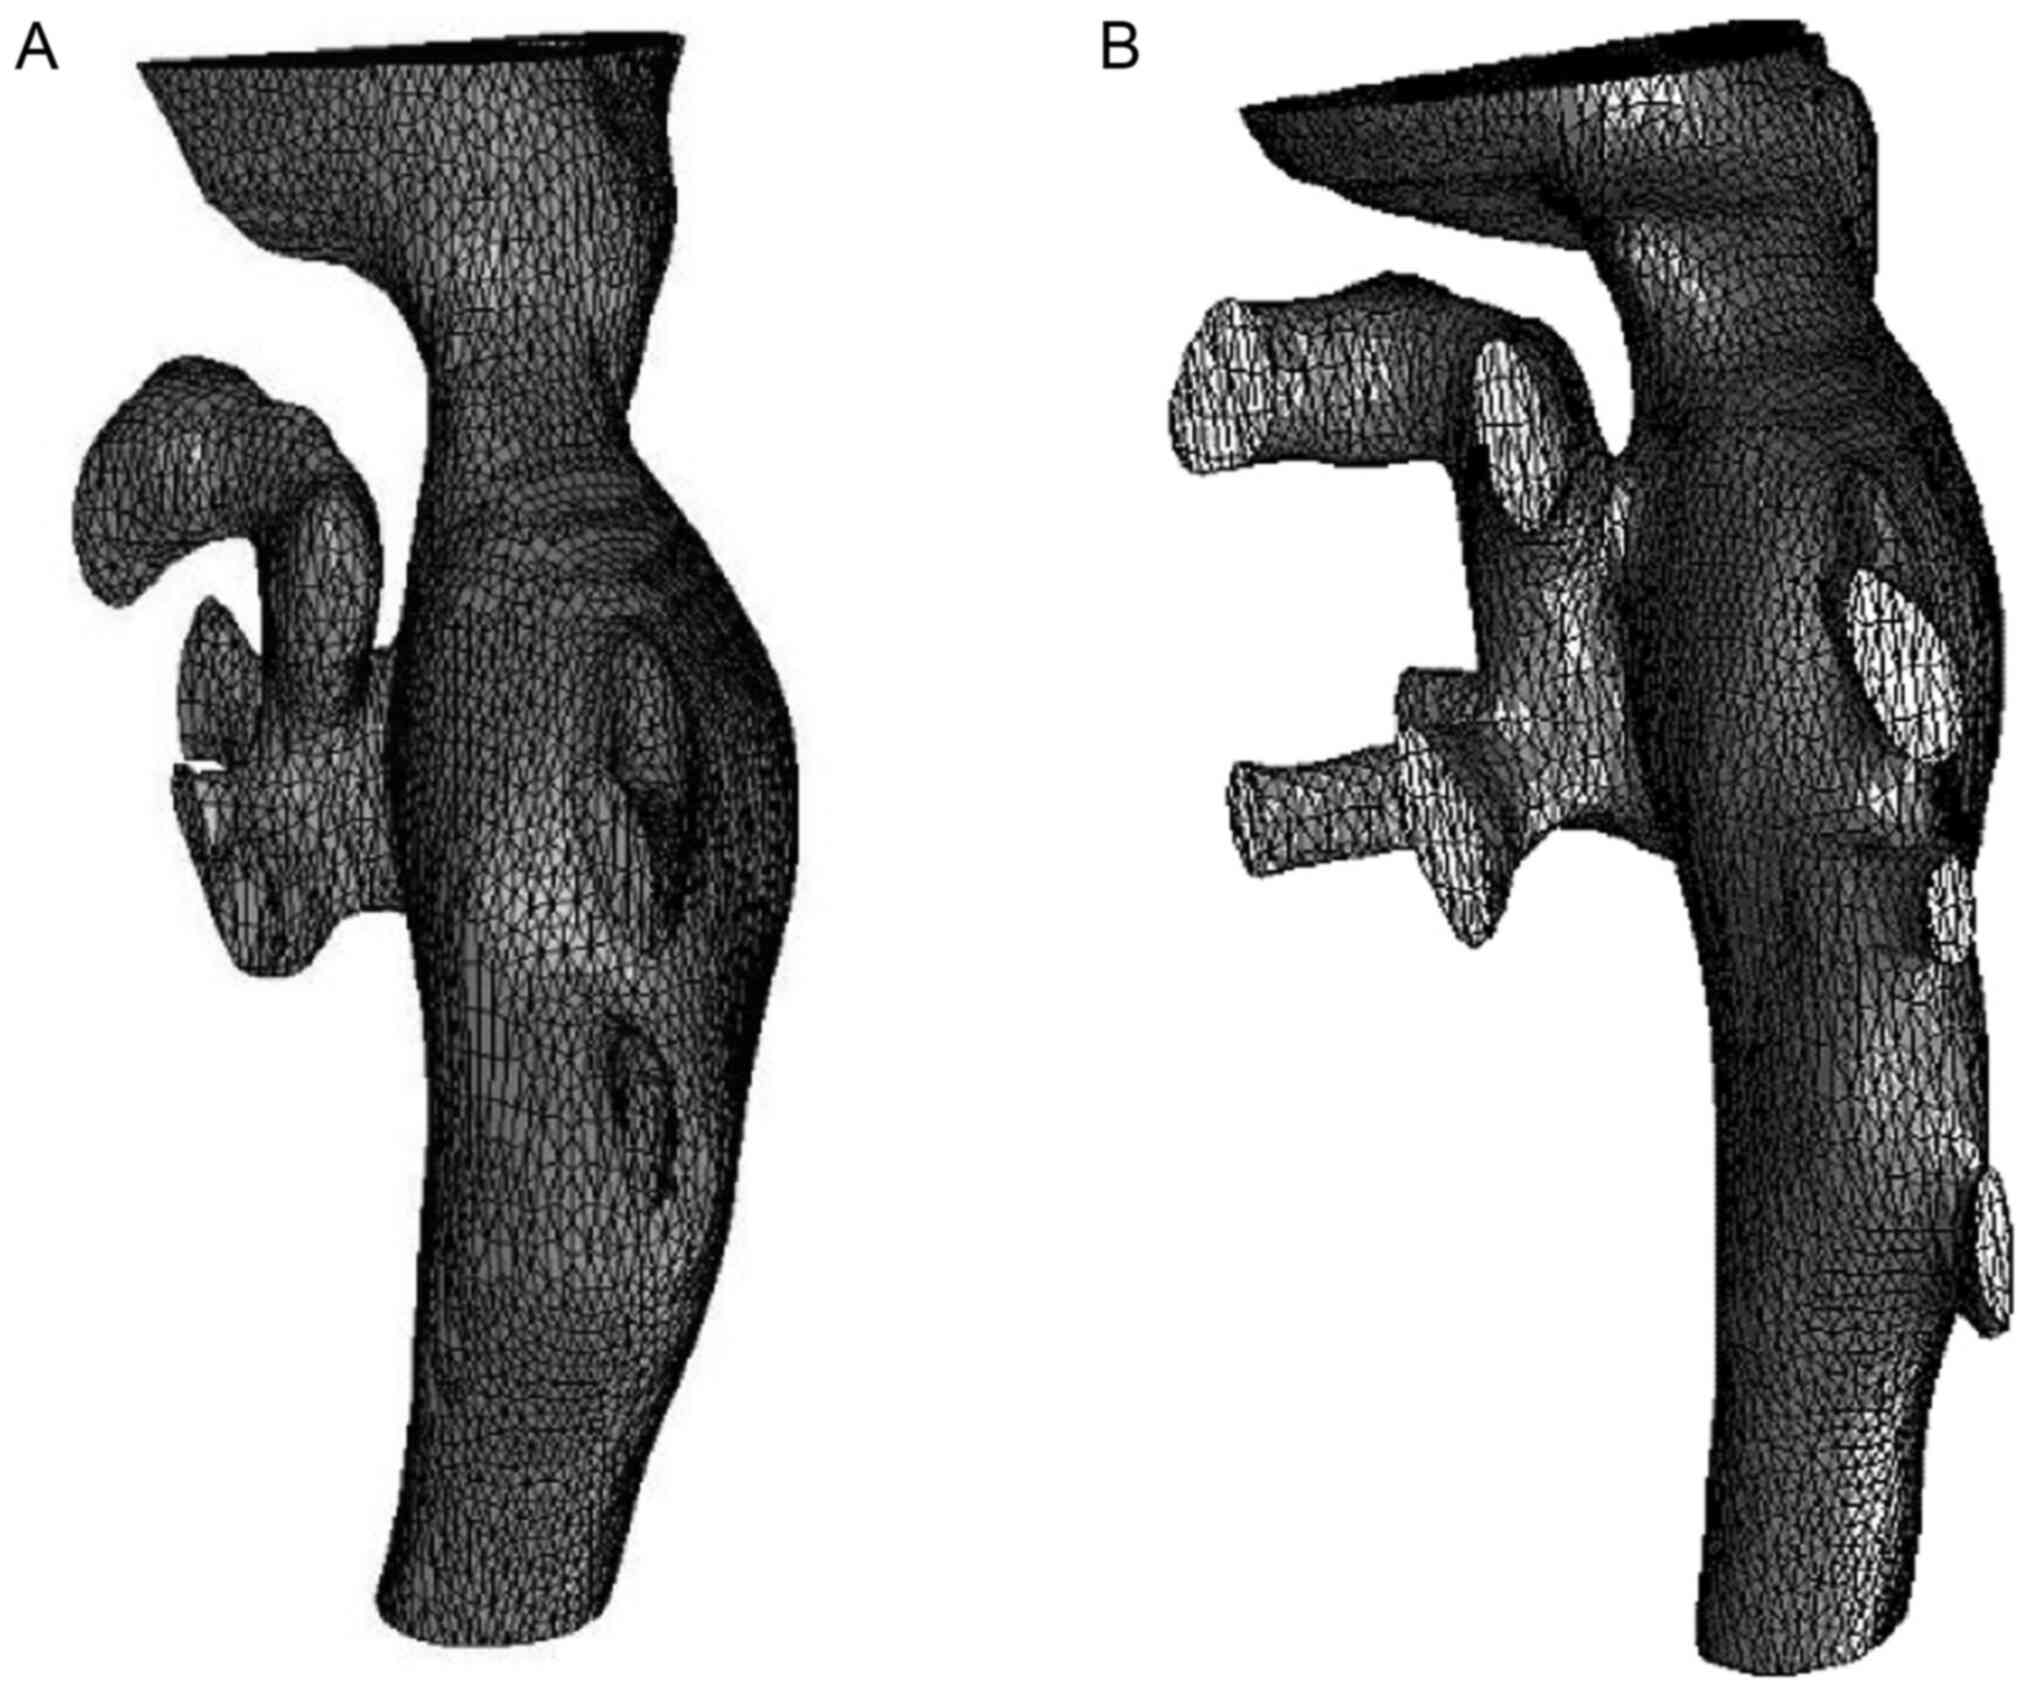
The pre-operative IVC 3D model included 17,482
finite element model units and 49,533 nodes. The total number of
finite element model units after interventional therapy was 17,542
and the total number of nodes was 50,372. According to the model,
the diameter and shape of the IVC after balloon dilatation were
restored to approximately normal levels (Fig. 1).
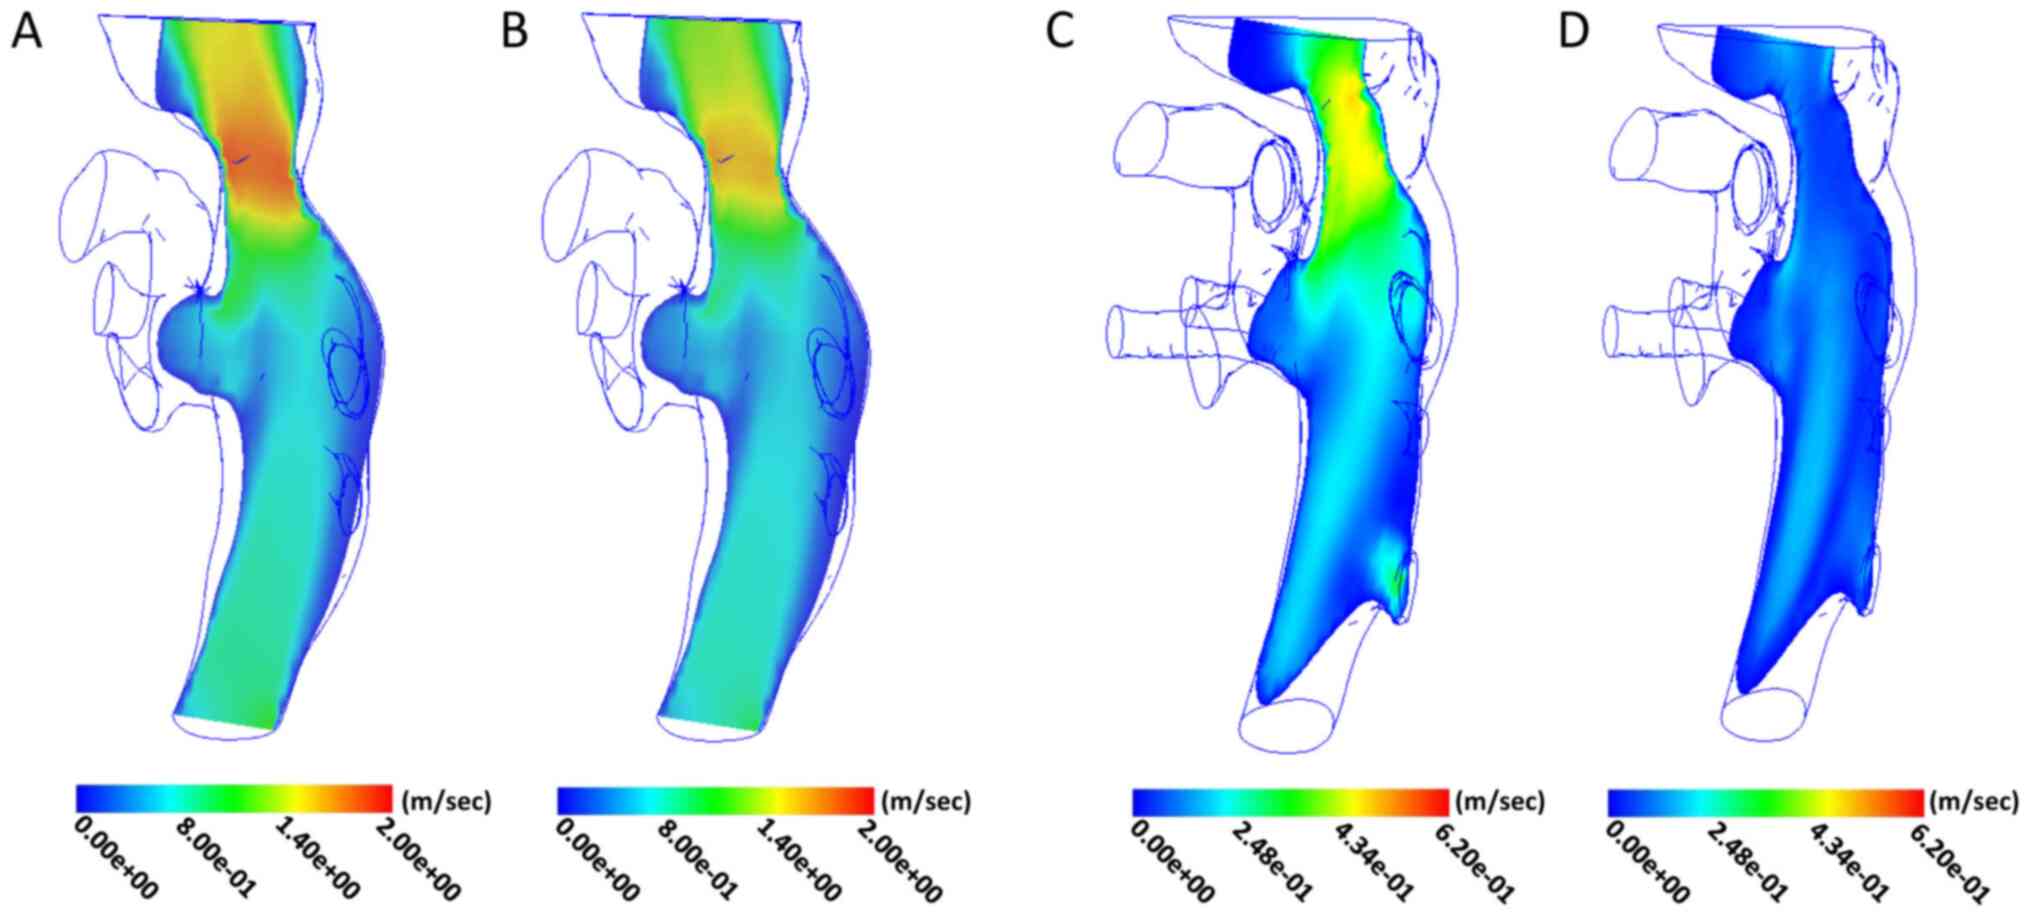
Analysis of blood flow velocity
Pre-operative blood flow velocity was measured in
the midline region of the IVC, where stenosis was the most
prominent. The maximum value in the cardiac cycle was 1.85 m/sec,
the minimum value was 1.53 m/sec and the mean value was 1.64±0.10
m/sec. The flow velocity in the upper and lower regions was
relatively reduced (Fig. 2A and
B). After treatment, the maximum
value of blood flow velocity in the original stenosis of the IVC
was 0.48 m/sec, the minimum value was 0.06 m/sec and the mean value
was 0.34±0.14 m/sec. The post-operative flow velocity distribution
characteristics were similar to those prior to treatment, i.e., the
maxima region was still distributed in the central line area of the
IVC and the blood flow velocity in the adjacent region was slightly
lower (Fig. 2C and D).
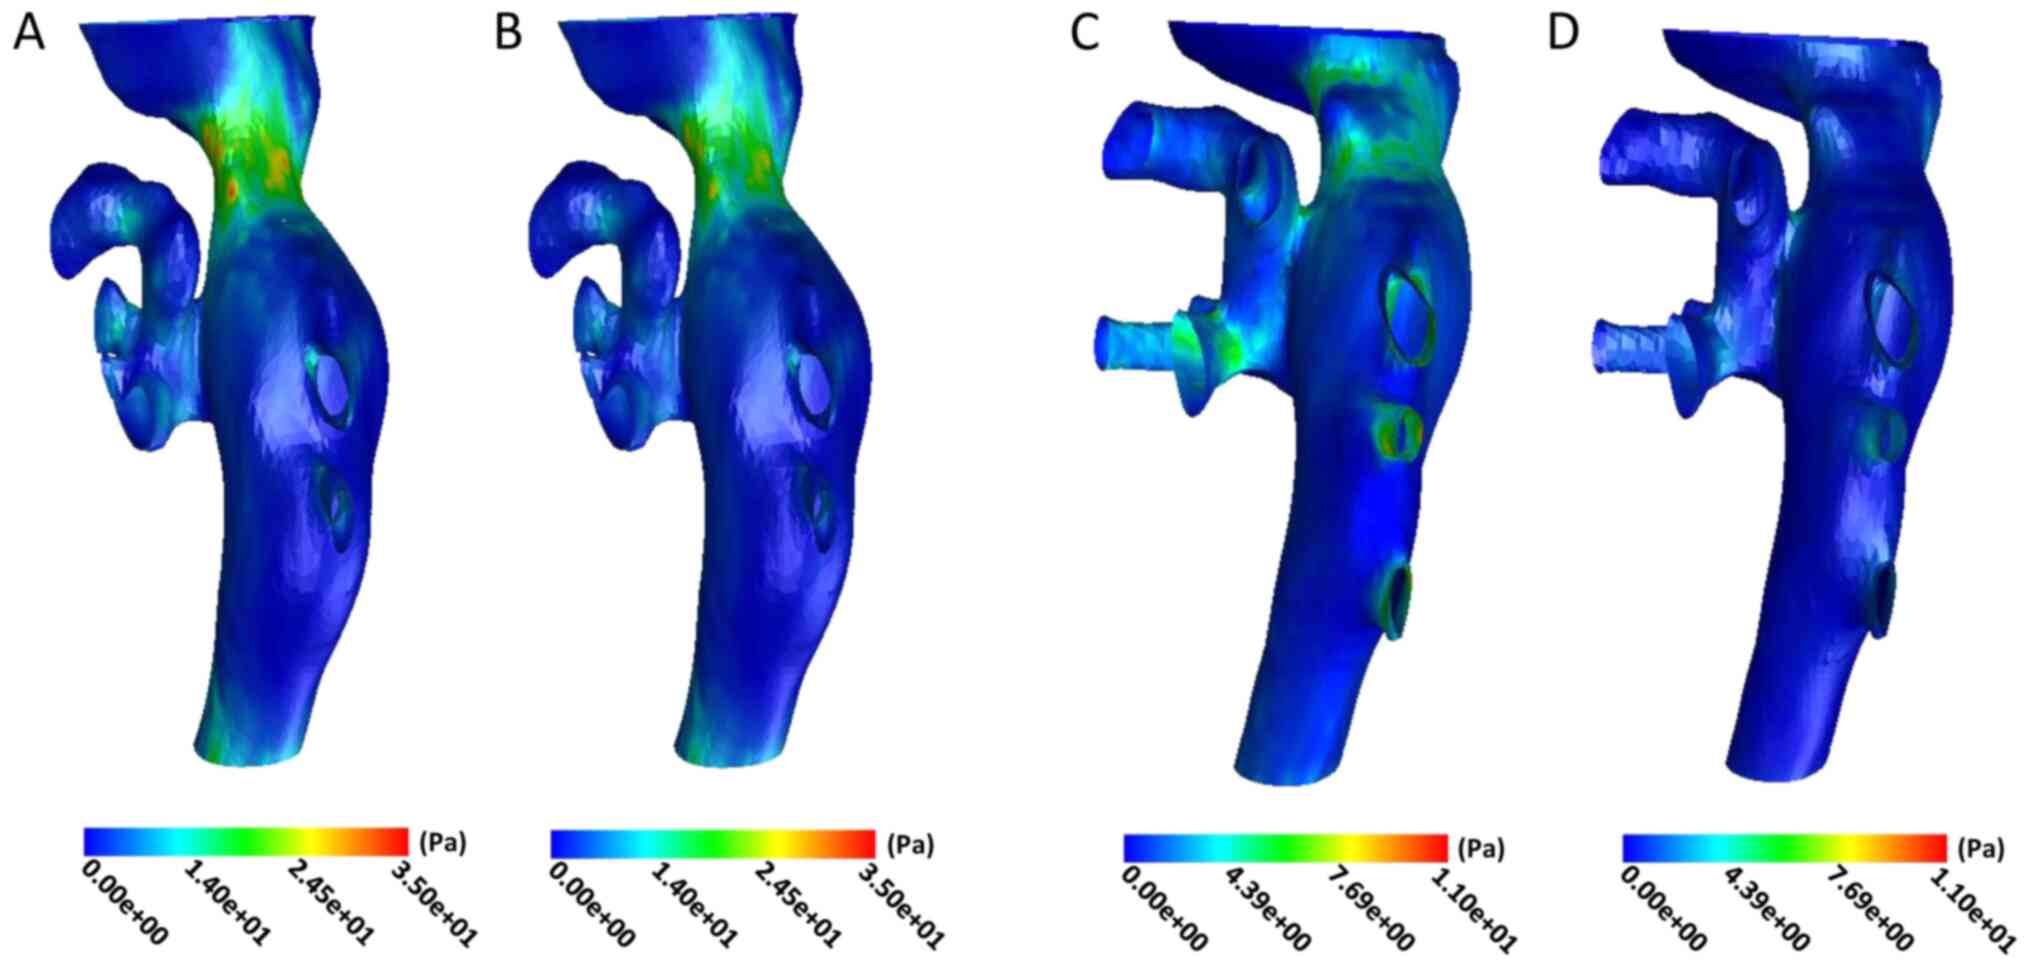
Analysis of wall shear stress
Prior to the operation, the shear stress of the IVC
wall increased significantly in the stenotic area and it was
relatively uniform in the non-stenotic area. The maximum and
minimum values of wall shear stress in the stenotic area were 29.71
and 21.37 Pa in the cardiac cycle, with a mean of 25.69±2.85 Pa
(Fig. 3A and B). The maximum and minimum wall shear
stress were 6.12 and 0.53 Pa in the original stenotic area after
treatment, with a mean value of 3.51±1.70 Pa. However, the wall
shear stress in the stenotic part of the cardiac cycle was still
higher compared with that in the non-stenotic part (Fig. 3C and D).
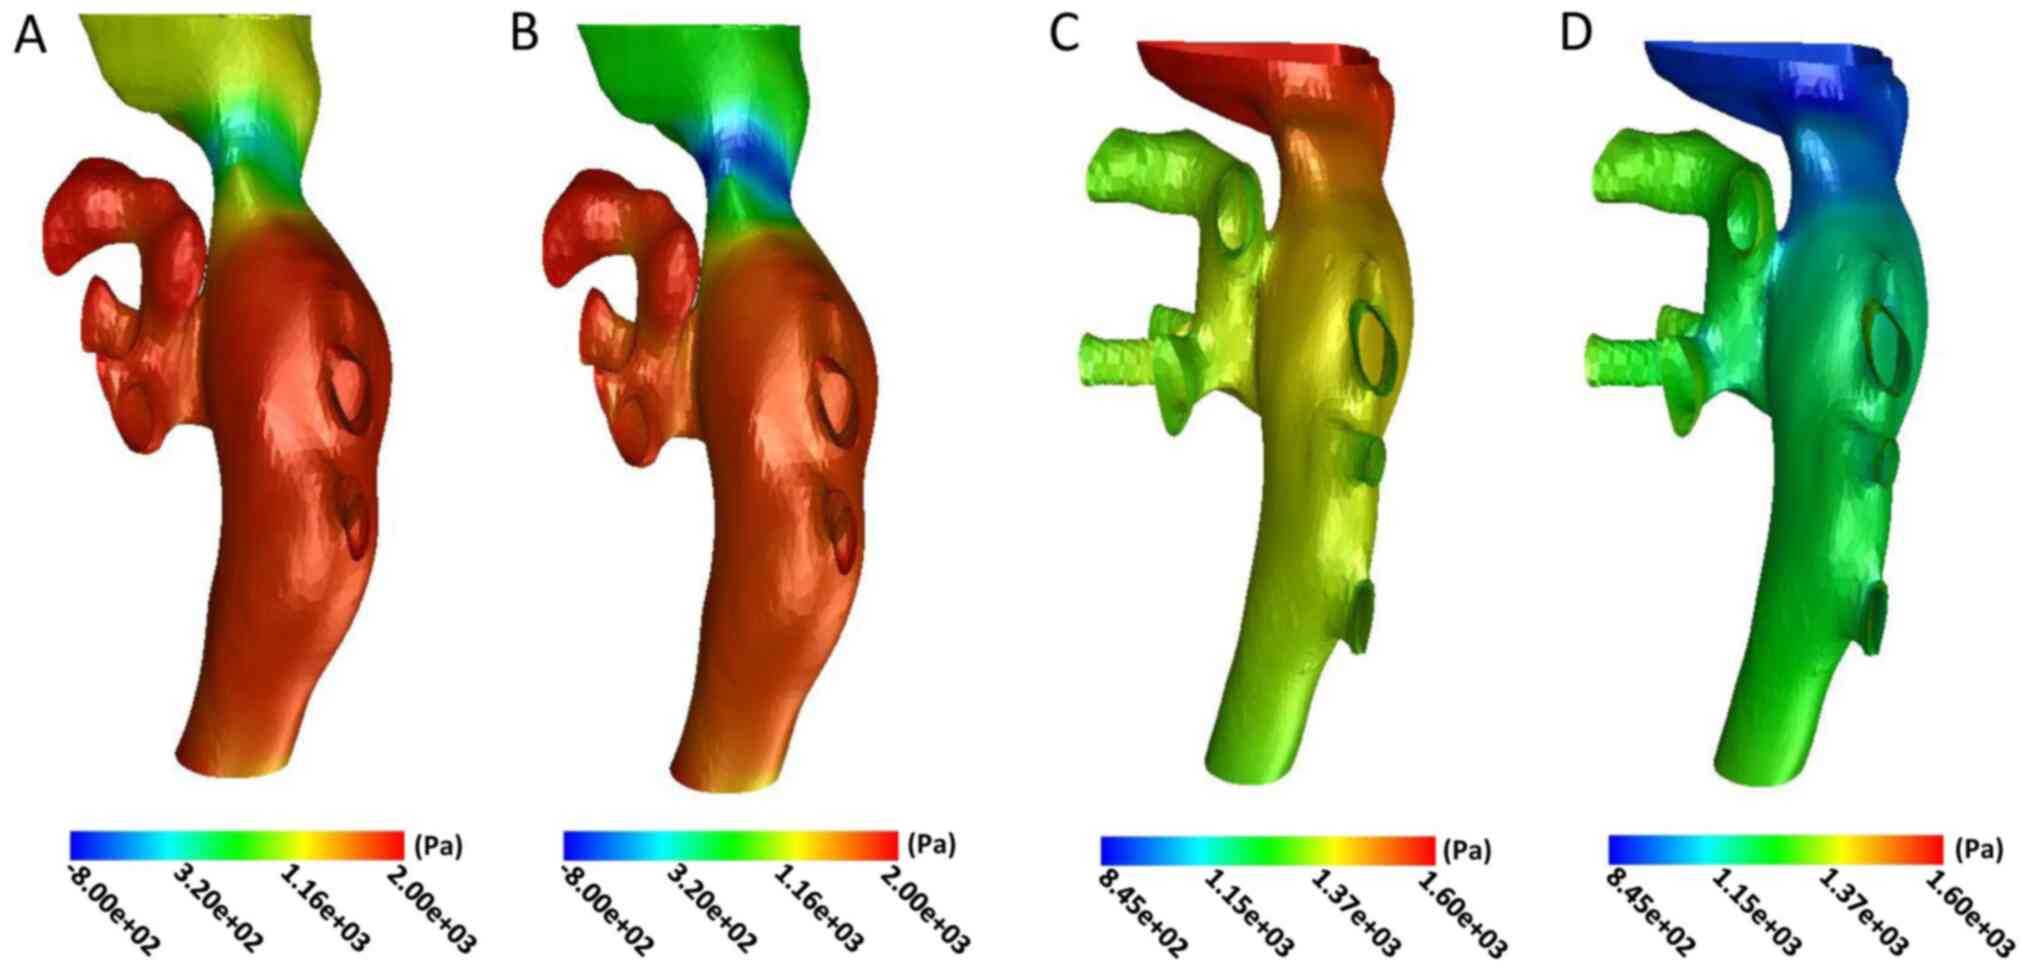
Analysis of wall pressure
The wall pressure of the distal end of the IVC was
significantly increased prior to the operation. The wall pressure
gradually decreased in the stenotic and proximal end of the IVC,
particularly in the narrowest part of the lumen during the cardiac
cycle (Fig. 4A and B). The maximum and minimum wall pressure
in the narrowest area prior to the operation were 290.32 and
-464.21 Pa, with a mean of -119.33±251.50 Pa in the cardiac cycle.
The wall pressure of the distal end of the IVC decreased
significantly after interventional therapy (Fig. 4C and D). The maximum and minimum values in the
narrowest part were 1,431.23 and 850.68 Pa in the cardiac cycle,
with a mean of 1,128.42±207.70 Pa.
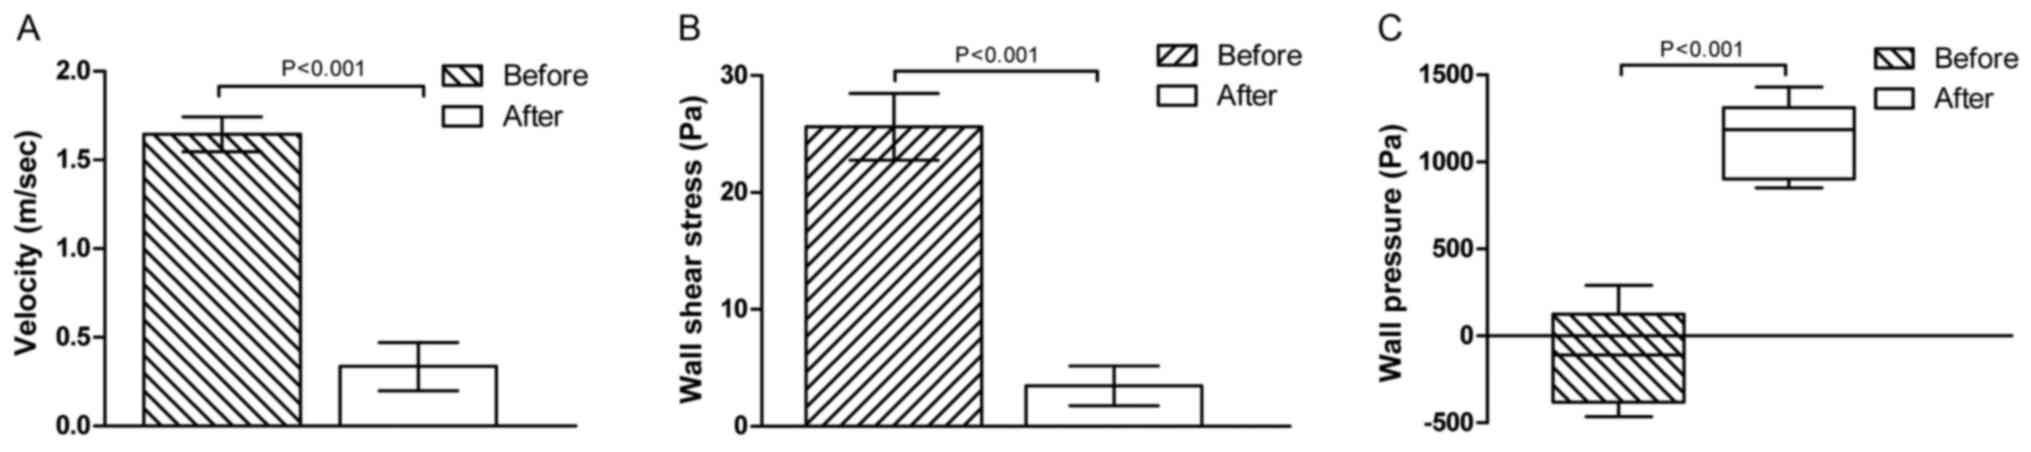
Following treatment, the blood flow velocity and
wall shear stress all decreased significantly in the narrowest part
of the lumen (t=34.97 and 29.86; P<0.001; Fig. 5A and B). However, the wall pressure increased
remarkably in the lesion area after interventional therapy
(t=17.10, P<0.001; Fig. 5C).
Discussion
In recent years, CFD technology has been widely used
in biomedical research (9-11).
This technology may be used to calculate important functional
indicators, including target vessel wall pressure, wall shear
stress and blood flow velocity. The application of CFD in the
cerebral artery has been well established, particularly for the
evaluation of risk factors for aneurysm rupture and the efficacy of
stent surgery, which has important clinical significance (12). At present, the morphological and
functional assessment of IVC in BCS mainly includes ultrasound, CT,
MRI and digital subtraction angiography (DSA) (13-15).
Among these, CT and MRI are able to evaluate the shape of stenotic
vessels, but it is difficult to perform a functional evaluation.
Ultrasound may achieve morphological and functional evaluation but
the subjective factors of the operator confer a somewhat poor
repeatability. DSA may be used to evaluate blood flow in the lumen
of the lesion, but it is difficult to observe the shape of the
blood vessels and wall structure (16). CFD technology has enabled a better
analysis of the morphology and function of the IVC in patients with
BCS.
Previous studies have used CFD to evaluate the IVC
in BCS: Certain scholars have used CFD technology to construct a
three-dimensional model of IVC occlusion and clarify the
distribution of local blood flow velocity and shear stress on the
wall of the IVC, and have proposed that this may be the cause of
thickening and thrombosis of the IVC in patients with BCS (17). By analyzing the changes in the blood
flow parameters prior to and after BCS interventional therapy, Nai
et al (18) pointed out that
the wall shear force remained higher compared with that of the
normal IVC in patients with BCS, which may be one of the reasons
for restenosis after BCS interventional therapy. Cheng et al
(7) constructed a BCS vascular
model based on MRI and idealized membranes with different degree of
stenosis (16, 37 and 54%) were built based on the vascular model of
BDS. CFD technology was used to successfully analyze the blood flow
parameters in the lesion area, and the difference of wall shear
force in different degrees of stenosis was demonstrated. In the
present study, the time factor of the cardiac cycle was added to
the basis provided by previous studies. Quantitative parameters of
vascular stenosis in the cardiac cycle were obtained, and the
parameters prior to and after the operation were compared and
analyzed, in the hope that this may enable a more objective
analysis of the changes in the vascular parameters in the lesion
area of BCS and the fluid parameters following interventional
therapy.
The experimental results demonstrated that the blood
flow velocity and wall shear stress were highest and the wall
pressure was lowest in the IVC stenosis prior to the intervention.
The results were consistent with those reported by a previous study
(18). According to the
incompressible fluid continuity equation, Q=V1 x A1=V2 x A2, where
V indicates the mean flow velocity of the section and A the
cross-sectional area of the flow, for any two flow cross-sections,
V is inversely proportional to A when the total flow is constant.
When blood flows through the stenotic area of the IVC, V markedly
increases due to a sharp decrease in A. After the intervention, the
V value decreased due to the increase of the A in the narrowed
area.
According to the Bernoulli principle (19), p + 1/2ρv2 + ρgh=C, where
p is the pressure at a point in the fluid, v is the velocity at
that point, ρ is the fluid density, g is the gravitational
acceleration, h is the height of the point and C is a constant,
when the blood flow is at a high flow rate, a higher flow rate is
associated with a smaller pressure. Prior to treatment, the blood
flow velocity through the stenotic area was higher, which reduced
the pressure on the blood vessel wall. Therefore, the stenotic area
of IVC would have a negative value, i.e., a ‘negative pressure’
state. As the flow rate at the stenosis decreased after treatment,
the corresponding wall pressure increased.
The shear stress is obtained by the Hagen-Poiseuille
formula (20): F=
4ηQ/πR3, where F is the shear stress, η is the fluid
viscosity, Q is the flow rate and R is the lumen radius. The shear
stress is a force that obstructs the blood flow parallel to the
axis of the blood vessel. Its mechanism is that blood viscosity
causes friction between the blood and the vessel wall, which is
opposite to the direction of blood flow (21). A commonly used unit for describing
the shear force of a blood vessel wall is Dyne/cm2 (1
Dyne/cm2=0.1 Pa). It was previously reported that the
vascular endothelial cell basement membrane may become exposed due
to direct mechanical damage in the presence of excessive wall shear
forces (>100 Dyne/cm2), resulting in endogenous
coagulation followed by vascular occlusion (20). In the present study, the mean wall
shear force of the stenotic area pre-operatively was 25.69 Pa
>100 Dyne/cm2, and this excessive wall shear force
may be one of the causes of IVC stenosis in BCS. The mean value of
wall shear stress in the original stenotic area was 3.51 Pa (35.1
Dyne/cm2). This value was significantly lower compared
with that prior to treatment and had then returned to the
physiological high shear force range (15-50 Dyne/cm2).
The physiological high shear force enables timely endothelial cell
repair and intimal hyperplasia is suppressed, which may promote
benign remodeling based on vasodilation (20,22).
Therefore, the evaluation of the shear force changes of the IVC
wall in BCS may help elucidate the cause of vascular stenosis and
also provides quantitative indicators and theoretical support for
the evaluation of interventional therapy and post-operative
follow-up. In addition, under physiological conditions, the blood
flow in the circulatory system periodically changes with the
cardiac cycle, which is referred to as pulsating flow (23,24).
Based on previous studies on IVC, the time factor
was added to the model. The results demonstrated that the blood
flow velocity, wall pressure and wall shear stress change
periodically with the cardiac cycle, which may prove helpful in
establishing a three-dimensional model of IVC occlusion in BCS in
the real circulatory state that is more in line with human
hemodynamics in the future.
Although the model of IVC stenosis in BCS was
successfully established in the present study, there were certain
limitations. First, the human vascular wall is characterized by
elasticity but in the present study, the vascular wall was
considered as a rigid structure, which is different from the real
blood flow environment. Furthermore, the extent and degree of
venous stenosis, the complexity of collateral circulation and the
individual differences of venous vascular lesions caused by BCS
will affect the repeatability of modeling to a certain extent.
In conclusion, the present study successfully
established a model of IVC stenosis based on BCS through CFD. The
hemodynamic characteristics of blood flow velocity, wall shear
stress and wall pressure in the lesion area in association with the
cardiac cycle were obtained, which may provide a new possibility
for the clinical evaluation of IVC in BCS.
Acknowledgements
Not applicable.
Funding
The present study was supported by grants from the
Clinical Medical Science and Technology Project of Jiangsu Province
(grant no. BE2017637), Key Research and Development Plan of Xuzhou
City (grant no. KC20111) and the Medical Innovation Team (leading
talent) of Jiangsu Province (grant no. CXTDA2017028).
Availability of data and materials
All data generated during this study are included in
this published article.
Authors' contributions
LL designed the experiments and drafted the
manuscript. PX and JP performed the experiments and analyzed data.
CH conducted statistical analysis, data interpretation and revised
the manuscript. KX designed the study, interpreted data, provided
administrative support and study supervision, and, additionally,
conducted critical revision and final approval of the manuscript.
All authors read and approved the final manuscript.
Ethics approval and consent to
participate
All patients provided written informed consent prior
to treatment. The present study was approved by the Institutional
Review Board of Affiliated Hospital of Xuzhou Medical
University.
Patient consent for publication
All patients provided written informed consent for
publication.
Competing interests
The authors declare that they have no competing
interests.
References
|
1
|
Copelan A, Remer EM, Sands M, Nghiem H and
Kapoor B: Diagnosis and management of Budd Chiari syndrome: An
update. Cardiovasc Intervent Radiol. 38:1–12. 2015.PubMed/NCBI View Article : Google Scholar
|
|
2
|
Huang Q, Shen B, Zhang Q, Xu H, Zu M, Gu
Y, Wei N, Cui Y and Huang R: Comparison of long-term outcomes of
endovascular management for membranous and segmental inferior vena
cava obstruction in patients with primary Budd-Chiari syndrome.
Circ Cardiovasc Interv. 9(e003104)2016.PubMed/NCBI View Article : Google Scholar
|
|
3
|
Mukund A, Pargewar SS, Desai SN, Rajesh S
and Sarin SK: Changes in liver congestion in patients with
Budd-Chiari syndrome following endovascular interventions:
Assessment with transient elastography. J Vasc Interv Radiol.
28:683–687. 2017.PubMed/NCBI View Article : Google Scholar
|
|
4
|
Fukazawa K, Ishida F, Umeda Y, Miura Y,
Shimosaka S, Matsushima S, Taki W and Suzuki H: Using computational
fluid dynamics analysis to characterize local hemodynamic features
of middle cerebral artery aneurysm rupture points. World Neurosurg.
83:80–86. 2015.PubMed/NCBI View Article : Google Scholar
|
|
5
|
Numata S, Itatani K, Kanda K, Doi K,
Yamazaki S, Morimoto K, Manabe K, Ikemoto K and Yaku H: Blood flow
analysis of the aortic arch using computational fluid dynamics. Eur
J Cardiothorac Surg. 49:1578–1585. 2016.PubMed/NCBI View Article : Google Scholar
|
|
6
|
Gharahi H, Zambrano BA, Zhu DC, DeMarco JK
and Baek S: Computational fluid dynamic simulation of human carotid
artery bifurcation based on anatomy and volumetric blood flow rate
measured with magnetic resonance imaging. Int J Adv Eng Sci Appl
Math. 8:46–60. 2016.PubMed/NCBI View Article : Google Scholar
|
|
7
|
Cheng D, Zhuang Y, Kou Q, Zhang M, Zhao Y,
Han C, Li J, Wang Y, Xu K, Mo F and Zhang J: Numerical simulation
of hemodynamics in membranous obstruction of the suprahepatic
inferior vena cava based on a subject-specific Budd-Chiari syndrome
model. Clin Biomech (Bristol, Avon). 52:20–24. 2018.PubMed/NCBI View Article : Google Scholar
|
|
8
|
Khalafvand SS, Ng EY, Zhong L and Hung TK:
Three-dimensional diastolic blood flow in the left ventricle. J
Biomech. 50:71–76. 2017.PubMed/NCBI View Article : Google Scholar
|
|
9
|
Katritsis DG, Theodorakakos A, Pantos I,
Andriotis A, Efstathopoulos EP, Siontis G, Karcanias N, Redwood S
and Gavaises M: Vortex formation and recirculation zones in left
anterior descending artery stenoses: Computational fluid dynamics
analysis. Phys Med Biol. 55:1395–1411. 2010.PubMed/NCBI View Article : Google Scholar
|
|
10
|
Choi G, Lee JM, Kim HJ, Park JB, Sankaran
S, Otake H, Doh JH, Nam CW, Shin ES, Taylor CA and Koo BK: Coronary
artery axial plaque stress and its relationship with lesion
geometry: Application of computational fluid dynamics to coronary
CT angiography. JACC Cardiovasc Imaging. 8:1156–1166.
2015.PubMed/NCBI View Article : Google Scholar
|
|
11
|
Yeri A and Shah RV: Comparison of
computational fluid dynamics and machine learning-based fractional
flow reserve in coronary artery disease. Circ Cardiovasc Imaging.
11(e007950)2018.PubMed/NCBI View Article : Google Scholar
|
|
12
|
Munarriz PM, Gómez PA, Paredes I,
Castaño-Leon AM, Cepeda S and Lagares A: Basic principles of
hemodynamics and cerebral aneurysms. World Neurosurg. 88:311–319.
2016.PubMed/NCBI View Article : Google Scholar
|
|
13
|
Xu K, Ren K and Chen YS: Application and
evaluation of non-invasive imaging examination of Budd-Chiari
syndrome. Chin Med J (Engl). 120:91–94. 2007.PubMed/NCBI
|
|
14
|
Faraoun SA, Boudjella Mel A, Debzi N,
Afredj N, Guerrache Y, Benidir N, Bouzid C, Bentabak K, Soyer P and
Bendib SE: Budd-Chiari syndrome: A prospective analysis of hepatic
vein obstruction on ultrasonography, multidetector-row computed
tomography and MR imaging. Abdom Imaging. 40:1500–1509.
2015.PubMed/NCBI View Article : Google Scholar
|
|
15
|
Wang HW, Shi HN, Cheng J, Xie F, Luo YK
and Tang J: Real-time shear wave elastography (SWE) assessment of
short-and long-term treatment outcome in Budd-Chiari syndrome: A
pilot study. PLoS One. 13(e0197550)2018.PubMed/NCBI View Article : Google Scholar
|
|
16
|
Van Wettere M, Bruno O, Rautou PE,
Vilgrain V and Ronot M: Diagnosis of Budd-Chiari syndrome. Abdom
Radiol (NY). 43:1896–1907. 2018.PubMed/NCBI View Article : Google Scholar
|
|
17
|
Sun C, Zhao Y, Ping J and Cui Y: Numerical
simulation analysis of hemodynamic values of Budd-Chiari syndrome
based on MR image. J Med Postgra. 27:1297–1300. 2014.
|
|
18
|
Nai Q, Ping J, Xu W, Xu H, Wei M and Zhang
W: Analysis of simulated hemodynamic parameters of Budd-Chiari
syndrome with perforated membrane of inferior vena cava before and
after interventional therapy. Chin J Hepatobiliary Surg.
22:734–737. 2016.
|
|
19
|
Yu H, Yan H and Jiang Y: Discussions on
Bernoulli Equations. Insight-Mechanics. 1:12–16. 2018.
|
|
20
|
Xu Y and Zhang L: Changes in shear force
after autologous arteriovenous fistula establishment. Natl Med J
China. 95:3473–3475. 2015.(In Chinese).
|
|
21
|
Van Tricht I, De Wachter D, Tordoir J and
Verdonck P: Hemodynamics and complications encountered with
arteriovenous fistulas and grafts as vascular access for
hemodialysis: A review. Ann Biomed Eng. 33:1142–1157.
2005.PubMed/NCBI View Article : Google Scholar
|
|
22
|
Cao X, Dong G and Yang S: Influence of
shear stress on vascular endothelial function and its mechanism. J
Chin Pract Diagn Ther. 30:956–958. 2016.(In Chinese).
|
|
23
|
Liu Z, Teng Z and Tan K: Stress
distribution on arterial wall under pulsatile flow. Chin J Theor
Appl Mech. 34:696–704. 2002.(In Chinese).
|
|
24
|
Lin Y, Jing Z, Zhao Z, Mei Z, Feng X, Feng
R and Lu Q: Three-dimensional simulation of pulsatile blood low in
human thoracic aorta. Acad J Sec Mil Med Univ. 27:867–875. 2006.(In
Chinese).
|