Introduction
Since the initial report in C. elegans
(1), microRNAs (miRNAs/miRs) and
their supposed roles have been described in different organisms and
human diseases, including cancers. miRs have been reported to be
involved in cancer progression, such as miR-1 and miR-106b-25 in
prostate carcinogenesis (2-4).
In order to identify additional miRs relevant to
disease progression, research efforts have concentrated on the miRs
associated with survival. Utilizing a publicly available database
of miRs in prostate cancer (5),
miR-769-5p was identified and its expression predicted disease-free
survival of patients with prostate cancer. There have been certain
reports on miR-769-5p in cancer. For instance, miR-769-5p was
indicated to be a prognostic biomarker for survival in pancreatic
cancer (6), and it was highly
expressed in Merkel cell carcinoma with positivity for Merkel cell
polyomavirus vs. those that were negative (7). It was also reported to be a prognostic
biomarker in non-small cell lung cancer (NSCLC) (8) and inhibited NSCLC tumorigenesis in
vitro and in vivo (9).
All of these studies suggested a potential function of miR-769-5p
as an oncogene, but its role in prostate cancer has not been
previously reported. Of note, one of its potential targets is Rho
GTPase activating protein 10 (ARHGAP10), a putative tumor
suppressor in ovarian cancer (10).
In addition, ARHGAP10 expression has been reported to be positively
associated with the survival of patients with prostate cancer
(11); thus, it appeared worthwhile
to investigate the relationship between miR-769-5p and ARHGAP10
within the context of prostate cancer.
In the present study, it was hypothesized that
miR-769-5p acts as an oncogene by targeting ARHGAP10 to achieve its
degradation. Inhibition of miR-769-5p affected the proliferation
and apoptosis of prostate cancer cells, the latter of which was
partially counteracted by knockdown of ARHGAP10, likely in concert
with cell division cycle (CDC)42.
Materials and methods
Cell lines
The normal cell line RWPE-1 and the cancerous cell
lines 22Rv1, LNCaP, MDA-PCa-2b, DU145, PC-3 and HEK-293 were
obtained from the American Type Culture Collection. The following
media were used for the cells: RWPE-1, Keratinocyte serum free
medium (K-SFM) + EGF + bovine pituitary extract (BPE) (Gibco cat.
no. 17005-042); 22Rv1, RPMI (Gibco; Thermo Fisher Scientific, Inc.;
cat. no. 11875-093) + 10% FBS (R&D systems; cat. no. S12450);
LNCaP, RPMI (Gibco; Thermo Fisher Scientific, Inc.; cat. no.
11875-093) + 10% FBS (R&D Systems; cat. no. S12450);
MDA-PCa-2b, F12K (ATCC; cat. no. 30-2004) + 20% FBS (R&D
systems; cat. no. S12450) + 25 ng/ml cholera toxin (Sigma-Aldrich;
Merck KGaA; cat. no. C8052) + 10 ng/ml mouse epidermal growth
factor (Corning, Inc.; cat. no. 354010) + 0.005 mM
phosphoethanolamine (Sigma-Aldrich; Merck KGaA; cat. no. P0503) +
100 pg/ml hydrocortisone (Sigma-Aldrich; Merck KGaA; cat. no.
H0135) + 45 nM sodium selenite (Sigma-Aldrich; Merck KGaA; cat. no.
9133) + 0.005 mg/ml human recombinant insulin (Thermo Fisher
Scientific, Inc.; cat. no. 12585-014); DU145, MEM (Gibco; Thermo
Fisher Scientific, Inc.; cat. no. 11095-080) + 10% FBS (R&D
systems, Inc.; cat. no. S12450); PC-3, F12 (Gibco; Thermo Fisher
Scientific, Inc.; cat. no. 11765-054) + 10% FBS (R&D systems,
Inc.; cat. no. S12450); HEK-293, MEM (Gibco; Thermo Fisher
Scientific, Inc.; cat. no. 11095-080) + 10% FBS (R&D Systems,
Inc.; cat. no. S12450). All cells were cultured at 37˚C in a
humidified atmosphere containing 5% CO2. A short tandem
repeat analysis with GenePrint10 was performed for regular
authentication and the cells were regularly tested for mycoplasma
contamination.
RNA extraction and reverse
transcription-quantitative PCR and (RT-qPCR)
Total RNA was isolated using TRIzol (Thermo Fisher
Scientific, Inc.; cat. no. 15596026) according to the
manufacturer's protocol. For RT-qPCR of miRNA, 10 ng total RNA was
reverse transcribed using the TaqMan MicroRNA Reverse Transcription
kit (Thermo Fisher Scientific, Inc.; cat. no. 4366596) according to
the manufacturer's protocol. The expression levels of miR-769-5p
were assessed in triplicate using TaqMan probes for miR-769-5p
(Thermo Fisher Scientific, Inc.; cat. no. 4427975; assay ID 001998)
and the internal standard reference U6 small nuclear RNA (Thermo
Fisher Scientific, Inc.; cat. no. 4427975; assay ID 001973) with
TaqMan Universal Master Mix II (not containing uracil-DNA
glycosylase; Thermo Fisher Scientific, Inc.; cat. no. 4440041).
For RT-qPCR analysis of mRNAs, 1 µg total RNA was
reverse transcribed using the High-Capacity cDNA Reverse
Transcription Kit with RNase Inhibitor (Thermo Fisher Scientific,
Inc.; cat. no. 4374967) according to the manufacturer's
instructions. Expression levels of genes were assessed in
triplicate using TaqMan probes for 1-acyl-sn-glycerol-3-phosphate
acyltransferase α (Thermo Fisher Scientific, Inc.; cat. no.
4331182; assay ID Hs00965850_g1), Kremen protein 1 (Thermo Fisher
Scientific, Inc.; cat. no. 4331182; assay ID Hs00230750_m1),
cyclin-D1-binding protein 1 (Thermo Fisher Scientific, Inc.; cat.
no. 4351372; assay ID Hs01050839_m1), ARHGAP10 (Rho
GTPase-activating protein 10; Thermo Fisher Scientific, Inc.; cat.
no. 4331182; assay ID Hs00226305_m1), FHL3 (four and a half LIM
domains protein 3; Thermo Fisher Scientific, Inc.; cat. no.
4331182; assay ID Hs00916408_g1), KCTD11 (Potassium Channel
Tetramerisation Domain Containing 11; Thermo Fisher Scientific,
Inc.; cat. no. 4331182; assay ID Hs00922550_s1) and the internal
standard reference 18s ribosomal (r)RNA (Thermo Fisher Scientific,
Inc.; cat. no. 4331182; assay ID Hs99999901_s1) with TaqMan Gene
Expression Master Mix (Thermo Fisher Scientific, Inc.; cat. no.
4369016).
Owing to the high abundance of 18s rRNA, total RNA
was diluted 1:100 for the 18s rRNA assay yielding average
Cqs of 13-20. Assays were run on a MicroAmp Optical
384-Well Reaction Plate with Barcode (cat. no. 4343814). The
following thermocycling conditions were used: 1-2 min at 50˚C, 2-10
min at 95˚C, 3-15 sec at 95˚C and 4-60 sec at 60˚C, repeated x40.
Results were then analyzed using 7900HT Fast Real-Time PCR System
with a 384-well block module (Thermo Fisher Scientific, Inc.; cat.
no. 4329001). To calculate normalized expression levels, the
comparative Cq method was used and fold changes for
miR-769-5p or each gene were obtained from the 2ΔΔCq
values (12).
Cell proliferation
Human prostate cells were seeded at 2x10⁵
cells/well in 6-well plates and transfected using one of two
different protocols: i) At 24 h after seeding, the cells were
transfected with 30 nM mirVana miRNA inhibitor, negative control #1
(Thermo Fisher Scientific, Inc.; cat. no. 4464076) or mirVana
miR-769-5p inhibitor (Thermo Fisher Scientific, Inc.; cat. no.
4464084, assay ID MH11974) using Lipofectamine RNAiMAX (Thermo
Fisher Scientific, Inc.; cat. no. 13778150). By using RT-qPCR, a
40-50% reduction of miR-769-5p was verified, which was induced by
the inhibitor relative to the negative control. ii) At 24 h after
seeding, the cells were transfected with one of the following: a)
30 nM each of mirVana miRNA inhibitor, negative control #1 (Thermo
Fisher Scientific, Inc.; cat. no. 4464076) and Silencer Select
negative control #1 siRNA (Thermo Fisher Scientific, Inc.; cat. no.
4390843); b) 30 nM each of mirVana miR-769-5p inhibitor (Thermo
Fisher Scientific, Inc.; cat. no. 4464084, assay ID MH11974) and
Silencer Select negative control #1 siRNA (Thermo Fisher
Scientific, Inc.; cat. no. 4390843); or c) 30 nM each of mirVana
miR-769-5p inhibitor (Thermo Fisher Scientific, Inc.; cat. no.
4464084, assay ID MH11974) and ARHGAP10 Silencer Select small
interfering (si)RNAs (Thermo Fisher Scientific, Inc.; cat. no.
4392420, IDs s36028 and s36029) using Lipofectamine RNAiMAX (Thermo
Fisher Scientific, Inc.; cat. no. 13778150). Downregulation of
miR-769-5p and upregulation of ARHGAP10 in response to mirVana
miRNA inhibitor were verified by RT-qPCR. Furthermore,
downregulation of ARHGAP10 in response to ARHGAP10 siRNAs was
verified.
After 48 h of transfection, 4 columns of wells were
seeded in a 96-well plate with each of the following for the 2
transfection groups: i) 100 µl of media/well with no cells,
1x10³ negative control-transfected cells/well or
1x10³ miR-769-5p inhibitor-transfected cells/well; ii)
100 µl of media/well with no cells, 1x10³ negative
control miR- and siRNA control-transfected cells/well,
1x10³ miR-769-5p inhibitor- and siRNA
control-transfected cells/well or 1x10³ miR-769-5p
inhibitor- and ARHGAP10 siRNA-transfected cells/well. Each column
of wells represented 8 replicates for a specific time-point (days
0, 1, 3 or 5).
Cell viability was measured on days 0, 1, 3 and5
using alamarBlue Cell Viability Reagent (Thermo Fisher Scientific,
Inc.; cat. no. DAL1025) with a FLUOstar Omega microplate reader
from BMG Labtech, using fluorescence (excitation, 544 nm/emission,
590 nm). Background fluorescence values of media-only wells were
subtracted from the values of wells with treated cells. The
subtracted fluorescence values of the 8 replicate wells from on day
5 were compared as follows for the 2 transfections: i) Negative
control vs. miR-769-5p inhibitor-transfected cells. ii) miR control
and siRNA control vs. miR-769-5p inhibitor and siRNA control. miR
control and siRNA control vs. miR-769-5p inhibitor and ARHGAP10
siRNAs. The experiment was performed as three independent
replicates for both transfection conditions.
Apoptosis
The seeding and transfection conditions were as
follows: i) Cells were seeded at 1.6x10⁶ cells/well in
T25 flasks (n=9). At 24 h after seeding, the cells were transfected
with 30 nM mirVana miRNA inhibitor, negative control #1 (Thermo
Fisher Scientific, Inc.; cat. no. 4464076) or mirVana miR-769-5p
inhibitor (Thermo Fisher Scientific, Inc.; cat. no. 4464084, assay
ID MH11974) using Lipofectamine RNAiMAX (Thermo Fisher Scientific,
Inc.; cat. no. 13778150). A 40-50% reduction of miR-769-5p induced
by the inhibitor relative to the negative control was verified by
RT-qPCR. ii) PC-3 cells were seeded at 1.6x10⁶
cells/well in T25 flasks (n=7). At 24 h after seeding, the cells
were transfected with one of the following: i) 30 nM each of
mirVana miRNA inhibitor, negative control #1 (cat. no. 4464076) and
Silencer Select negative control #1 siRNA (cat. no. 4390843); ii)
30 nM each of mirVana miR-769-5p inhibitor (cat. no. 4464084, assay
ID MH11974) and Silencer Select negative control #1 siRNA (cat. no.
4390843); or iii) 30 nM each of mirVana miR-769-5p inhibitor (cat.
no. 4464084, assay ID MH11974) and ARHGAP10 Silencer Select siRNAs
(cat. no. 4392420, IDs s36028 and s36029) using Lipofectamine
RNAiMAX (cat. no. 13778150), all from Thermo Fisher Scientific,
Inc. Downregulation of miR-769-5p and upregulation of ARHGAP10 in
response to mirVana miRNA inhibitor were verified by RT-qPCR.
Furthermore, downregulation of ARHGAP10 in response to ARHGAP10
siRNAs was verified.
At 48 h after transfections, 1.2x10⁶ cell
pellets from each treatment group were harvested and frozen at
-80˚C. Caspase-3 levels, an indicator of apoptosis, were measured
in cell pellets using the EnzChek Caspase-3 Assay Kit #2 (Thermo
Fisher Scientific, Inc.; cat. no. E13184). and a FLUOstar Omega
microplate reader from BMG Labtech, using fluorescence (excitation,
485 nm/emission, 520 nm). The caspase-3 levels were compared as
follows for the 2 transfections: i) Negative control vs. miR-769-5p
inhibitor-transfected cells. ii) miR control and siRNA control vs.
miR-769-5p inhibitor and siRNA control. miR control and siRNA
control vs. miR-769-5p inhibitor and ARHGAP10 siRNAs.
Migration and invasion assays
DU145 or PC-3 cells were seeded at 2x10⁵
cells/well in 6-well plates. At 24 h after seeding, the cells were
transfected with 30 nM mirVana miRNA inhibitor, negative control #1
(Thermo Fisher Scientific, Inc.; cat. no. 4464076) or mirVana
miR-769-5p inhibitor (Thermo Fisher Scientific, Inc.; cat. no.
4464084, assay ID MH11974) using Lipofectamine RNAiMAX (Thermo
Fisher Scientific, Inc.; cat. no. 13778150). A 40-50% reduction of
miR-769-5p induced by the inhibitor relative to the negative
control was verified (Fig SI).
Migration assay
After 48 h of transfection, 3x10⁴ DU145
cells were seeded for each treatment condition in replicate wells
in the upper chamber of a cell invasion and migration (CIM) plate
16 (ACEA Biosciences; cat. no. 05665817001), whose bottom chamber
contained media with 10% FBS (R&D systems, Inc.; cat. no.
S12450) as an attractant. The chambers of a CIM plate 16 were
assembled and loaded onto xCELLigence RTCA Systems (ACEA
Biosciences; cat. no. 00380601050). The xCELLigence machinery
quantified cell movements from the upper to the bottom chambers in
15-min intervals for 48 h. The experiment was performed as three
independent replicates.
Invasion assay
The steps described for the migration assay were
reperformed with PC-3 cells with two additional steps: Prior to
seeding of the cells onto the plate, the wells in the upper chamber
of the CIM plate 16 (ACEA Biosciences; cat. no. 05665817001) were
coated with 5% Matrigel Matrix (BD Biosciences; cat. no. 356234),
and the upper chamber was placed in a 37˚C incubator for 4 h for
the Matrigel to solidify.
RNA sequencing (RNAseq) and strategy
to obtain gene targets of miR-769-5p
DU145 and PC-3 cells were transfected with 100 nM of
mirVana miRNA mimics, negative control #1 (Thermo Fisher
Scientific, Inc.; cat. no. 4464058) or miR-769-5p mimics (Thermo
Fisher Scientific, Inc.; cat. no. 4464066, assay ID MC11974) in
quadruplicates and submitted to RNAseq, whose workflow was as
follows: The Sequencing Facility was at Leidos Biomedical Research,
Inc., Frederick National Laboratory for Cancer Research performed
RNA sequencing. For library preparation, the TruSeq V3 chemistry
kit from Illumina, Inc. was used with 500 ng total RNA. The
Illumina HiSeq 2000 system was utilized for sequencing. For each
sample, ~50 million paired-end reads with a length of 101 bp were
generated. Trimmomatic software version 0.36 (usadellab.org) was used for trimming reads for both
adapters and low-quality bases and the Tophat software version
2.1.1 (http://ccb.jhu.edu/software/tophat/index.shtml) was
used for aligning the trimmed reads with the reference human hg19
genome and gene annotation from the Ensembl database (http://grch37.ensembl.org/index.html).
Picard software version 2.0.1 (https://broadinstitute.github.io/picard/) was used for
calculating RNA mapping statistics and the average uniquely aligned
reads were ~90% for all samples. The RNA-seq workflow module in
Partek Genomics Suite 6.6 (Partek, Inc.) and the R/Bioconductor
package DESeq2 version 3.12 (https://bioconductor.org/packages/release/bioc/html/DESeq2.html)
were used to identify differentially expressed genes with a false
discovery rate of <5% and a fold change (≤-1.5) as cut-offs.
Partek was utilized to perform an analysis based on reads per
kilobase per million mapped reads and it allowed the gene counts to
be fitted to a negative binomial generalized linear model with
DESeq2.
Strategy
The TargetScan database (http://www.targetscan.org) was utilized to generate a
list of predicted gene targets of miR-769-5p. In order to generate
an overlap between TargetScan-predicted targets and the
RNAseq-downregulated transcripts in miR-769-5p mimics-transfected
DU145 or PC-3 cells [cut-off: P<0.01 and ≤-1.5 fold expression
change (5)], the Oliveros, J.C.
(2007-2015) Venny software (http://bioinfogp.cnb.csic.es/tools/venny/index.html),
an interactive tool for comparing lists using Venn diagrams, was
applied.
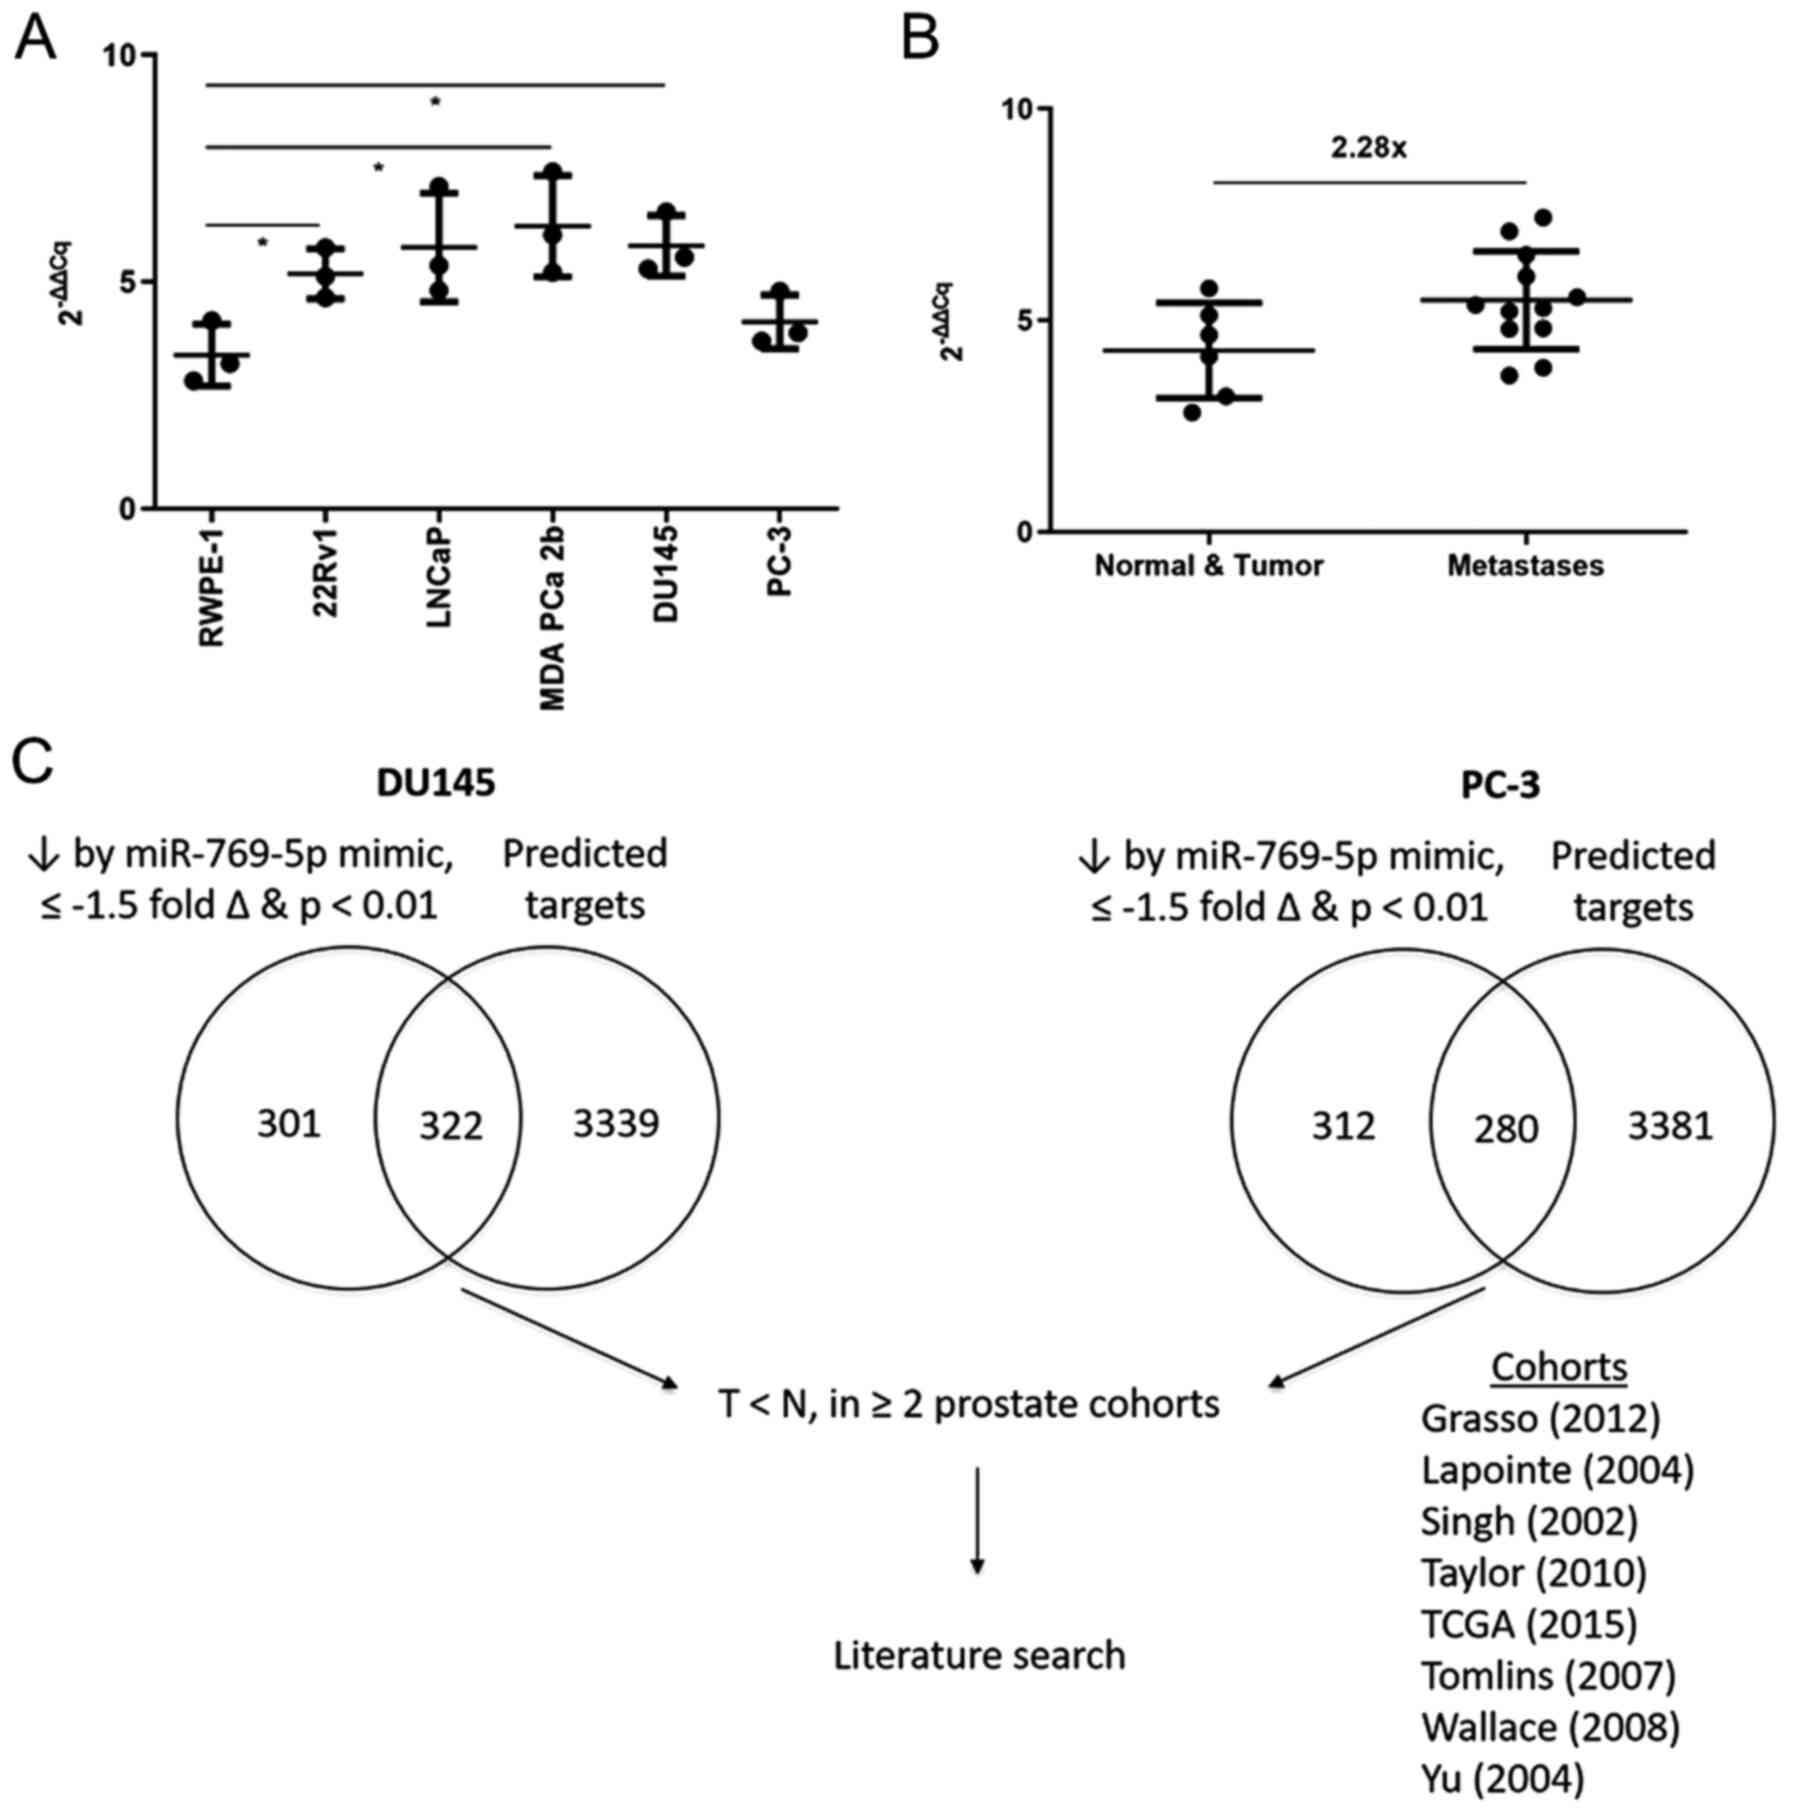
In order to reduce the list of genes from the
overlap (322 candidate genes for DU145 and 280 for PC-3), the
expression of genes in prostate tumor vs. non-cancerous tissues
from 8 cohorts [Grasso et al (13), Lapointe et al (14), Singh et al (15), Taylor et al (5), The Cancer Genome Atlas (TCGA)
(16), Tomlins et al
(17), Wallace et al
(18) and Yu et al (19)] was obtained from Oncomine
(http://www.oncomine.org, December 2016, Thermo
Fisher Scientific, Inc.). The gene lists for DU145 and PC-3 were
compared with the gene lists from these 8 cohorts. Entries with an
overlap with genes that had a higher expression in normal tissue
vs. tumors in ≥2 cohorts were selected and they were searched in
PubMed. Subsequently, the list of potential tumor suppressors
targeted by miR-769-5p was further reduced.
Luciferase reporter assay
The TargetScan database (http://www.targetscan.org) was utilized to locate the
putative binding sites of miR-769-5p in the 3'-untranslated region
(3'-UTR) of ARHGAP10 and to generate 4 constructs, 1 wild-type (WT)
and 3 mutants (MUT). The reporter construct, pLenti-UTR-Luc,
contains a cytomegalovirus (CMV) promoter followed by luciferase
from Photinus pyralis, and it was digested with EcoRI
and XhoI. The 3'-UTR sequences of ARHGAP10 WT, ARHGAP10
MUT1, ARHGAP10 MUT2 and ARHGAP10 MUT1+2 were amplified by PCR from
human genomic DNA (isolated from HEK-293 using DNAzol, Thermo
Fisher Scientific, Inc. cat. no. 10503027, according to the
manufacturer's instructions) plus complementary DNA as follows: PCR
was used to amplify the WT sequence with primers at both ends. The
MUT1, MUT2 and MUT1+2 were amplified using outer primers together
with internal primers that carried the mutation. A Ligation-Free
Cloning kit (cat. no. E001) from ABM was used to assemble the 2 PCR
amplicons into 1 mutant 3'-UTR, feasible due to the overlapping
sequences of the 2 internal primers. Each 3'-UTR was inserted into
the reporter construct using the Ligation-Free Cloning kit. The
sequences of the 4 WT and MUT constructs were verified using
Macrogen (https://dna.macrogen.com/main.do#) (Table SI).
A total of 7x10⁴ DU145 cells per well
were seeded in 24-well plates and co-transfected with 100 nM
mirVana miRNA mimics, negative control #1 (Thermo Fisher
Scientific, Inc.; cat. no. 4464058) or miR-769-5p mimics (Thermo
Fisher Scientific, Inc.; cat. no. 4464066, assay ID MC11974), 100
ng of luciferase reporter pLenti-UTR-Luc ARHGAP10 WT,
pLenti-UTR-Luc ARHGAP10 MUT1, pLenti-UTR-Luc ARHGAP10 MUT2 or
pLenti-UTR-Luc ARHGAP10 MUT1+2 and 4 ng of pRL-CMV Renilla
luciferase reporter (Promega; cat. no. E2261) using TransIT-X2
(Mirus; cat. no. 6004). Subsequently, the cells were cultured for
48 h and washed with PBS. Using a Luc-Pair Duo-Luciferase HS Assay
kit (GeneCopoeia; cat. no. LF004), the cells were lysed, the
lysates were loaded onto white 96 wells in quadruplicates and their
luciferase/Renilla ratios were measured using a FLUOstar
Omega microplate reader (BMG Labtech). The experiment was
performed, n=5.
CDC42 activity measurement
DU145 cells were seeded at 2x10⁵
cells/well in 6-well plates (n=6 experiments). At 24 h after
seeding, the cells were transfected with one of the following: i)
30 nM each of mirVana miRNA inhibitor, negative control #1 (Thermo
Fisher Scientific, Inc.; cat. no. 4464076) and Silencer Select
negative control #1 siRNA (Thermo Fisher Scientific, Inc.; cat. no.
4390843); ii) 30 nM each of mirVana miR-769-5p inhibitor (Thermo
Fisher Scientific, Inc.; cat. no. 4464084; assay ID MH11974) and
Silencer Select negative control #1 siRNA (Thermo Fisher
Scientific, Inc.; cat. no. 4390843); or iii) 30 nM each of mirVana
miR-769-5p inhibitor (Thermo Fisher Scientific, Inc.; cat. no.
4464084; assay ID MH11974) and ARHGAP10 Silencer Select siRNAs
(Thermo Fisher Scientific, Inc.; cat. no. 4392420; assay IDs s36028
and s36029) using Lipofectamine RNAiMAX (Thermo Fisher Scientific,
Inc.; cat. no. 13778150). Downregulation of miR-769-5p and
upregulation of ARHGAP10 in response to mirVana miRNA inhibitor
transfection were verified. Furthermore, downregulation of ARHGAP10
in response to ARHGAP10 siRNAs was verified.
At 48 h after transfection, cell lysates were
harvested on ice as per the instructions for the CDC42 G-LISA
Activation Assay (Cytoskeleton, Inc.; cat. no. BK127). Protein
concentrations were measured according to the manufacturer's
instructions using Precision Red™ Advanced Protein Assay Reagent,
absorbance at 600 nm. The equation used is as follows: C=A/εl;
where C = protein concentration (mg/ml), A = absorbance, l =
pathlength (cm) and ε = extinction coefficient
[(mg/ml)-1 cm-1]. The samples were normalized
accordingly. CDC42 activity was measured according to the
manufacturer's protocol. CDC42 activity was compared as follows:
miR control and siRNA control vs. miR-769-5p inhibitor and siRNA
control; and miR control and siRNA control vs. miR-769-5p inhibitor
and ARHGAP10 siRNAs.
Statistical analysis and usage of
public databases
A two-sided, unpaired t-test with Welch's correction
was used to assess the endpoints, including differences in miRNA
expression, proliferation, apoptosis and results of the luciferase
assays. Welch's ANOVA with Dunnett's test was used for comparing
>2 groups for miRNA and mRNA expression, CDC42 activity and
apoptosis. Kaplan-Meier analysis was utilized to compare the
differences in disease-free survival between groups of patients
divided by miR-769-5p and/or ARHGAP10 expression.
TCGA data on prostate cancer were downloaded from
the cBio Cancer Genomics Portal (http://cbio.mskcc.org/cancergenomics/prostate/data/)
to obtain the expression of miR-769-5p and ARHGAP10 in patients.
The data from Taylor et al (5) were downloaded from the National Center
for Biotechnology Information (NCBI, https://www.ncbi.nlm.nih.gov/) to obtain miR-769-5p
expression, ARHGAP10 expression and disease-free survival data of
patients according to the expression of miR-769-5p and ARHGAP10.
Recurrence-associated transcripts from Taylor et al
(5) were derived utilizing Partek
Genomics Suite 6.6 from Partek using Cox proportional hazards
regression. The Spearman correlation between ARHGAP10 and
miR-769-5p expression in tumor samples from Taylor et al
(5) was determined.
For t-tests, Welch's ANOVA with Dunnett's test,
Kaplan-Meier and Spearman analyses, GraphPad Prism 7.0 (GraphPad
Software, Inc.) was utilized. P<0.05 was considered to indicate
statistical significance.
Results
Expression of miR-769-5p is inversely
associated with disease-free survival and upregulated in human
prostate tumors
Combination analysis of the publicly available data
set (5) and utilization of the
strategy (3) to dichotomize miRs
into low or high expression groups based on their median values
indicated that patients with high expression of miR-769-5p had
significantly decreased disease-free survival compared with that of
patients with low expression (Fig.
1A). Furthermore, the expression of miR-769-5p in tumor tissues
was significantly higher compared with that in non-cancerous
tissues in the complete dataset (Fig.
1B). While this difference did not reach statistical
significance when focusing on only the matching pairs (n=28), a
stratified analysis into high- and low-expressing tumors using the
median miR-769-5p value as the cutoff revealed a prevalent
upregulation of this miR in the subset of prostate tumors with high
expression of miR-769-5p. In addition, miR-769-5p was significantly
upregulated in metastases when compared to primary tumors and the
non-cancerous tissues in the dataset (Fig. 1C). This phenomenon of higher
expression of miR-769-5p in tumor compared to non-cancerous tissues
was also observed in the TCGA dataset matching pairs (Fig. 1D). Taken together, the survival and
expression data pointed towards miR-769-5p being a candidate
oncogene.
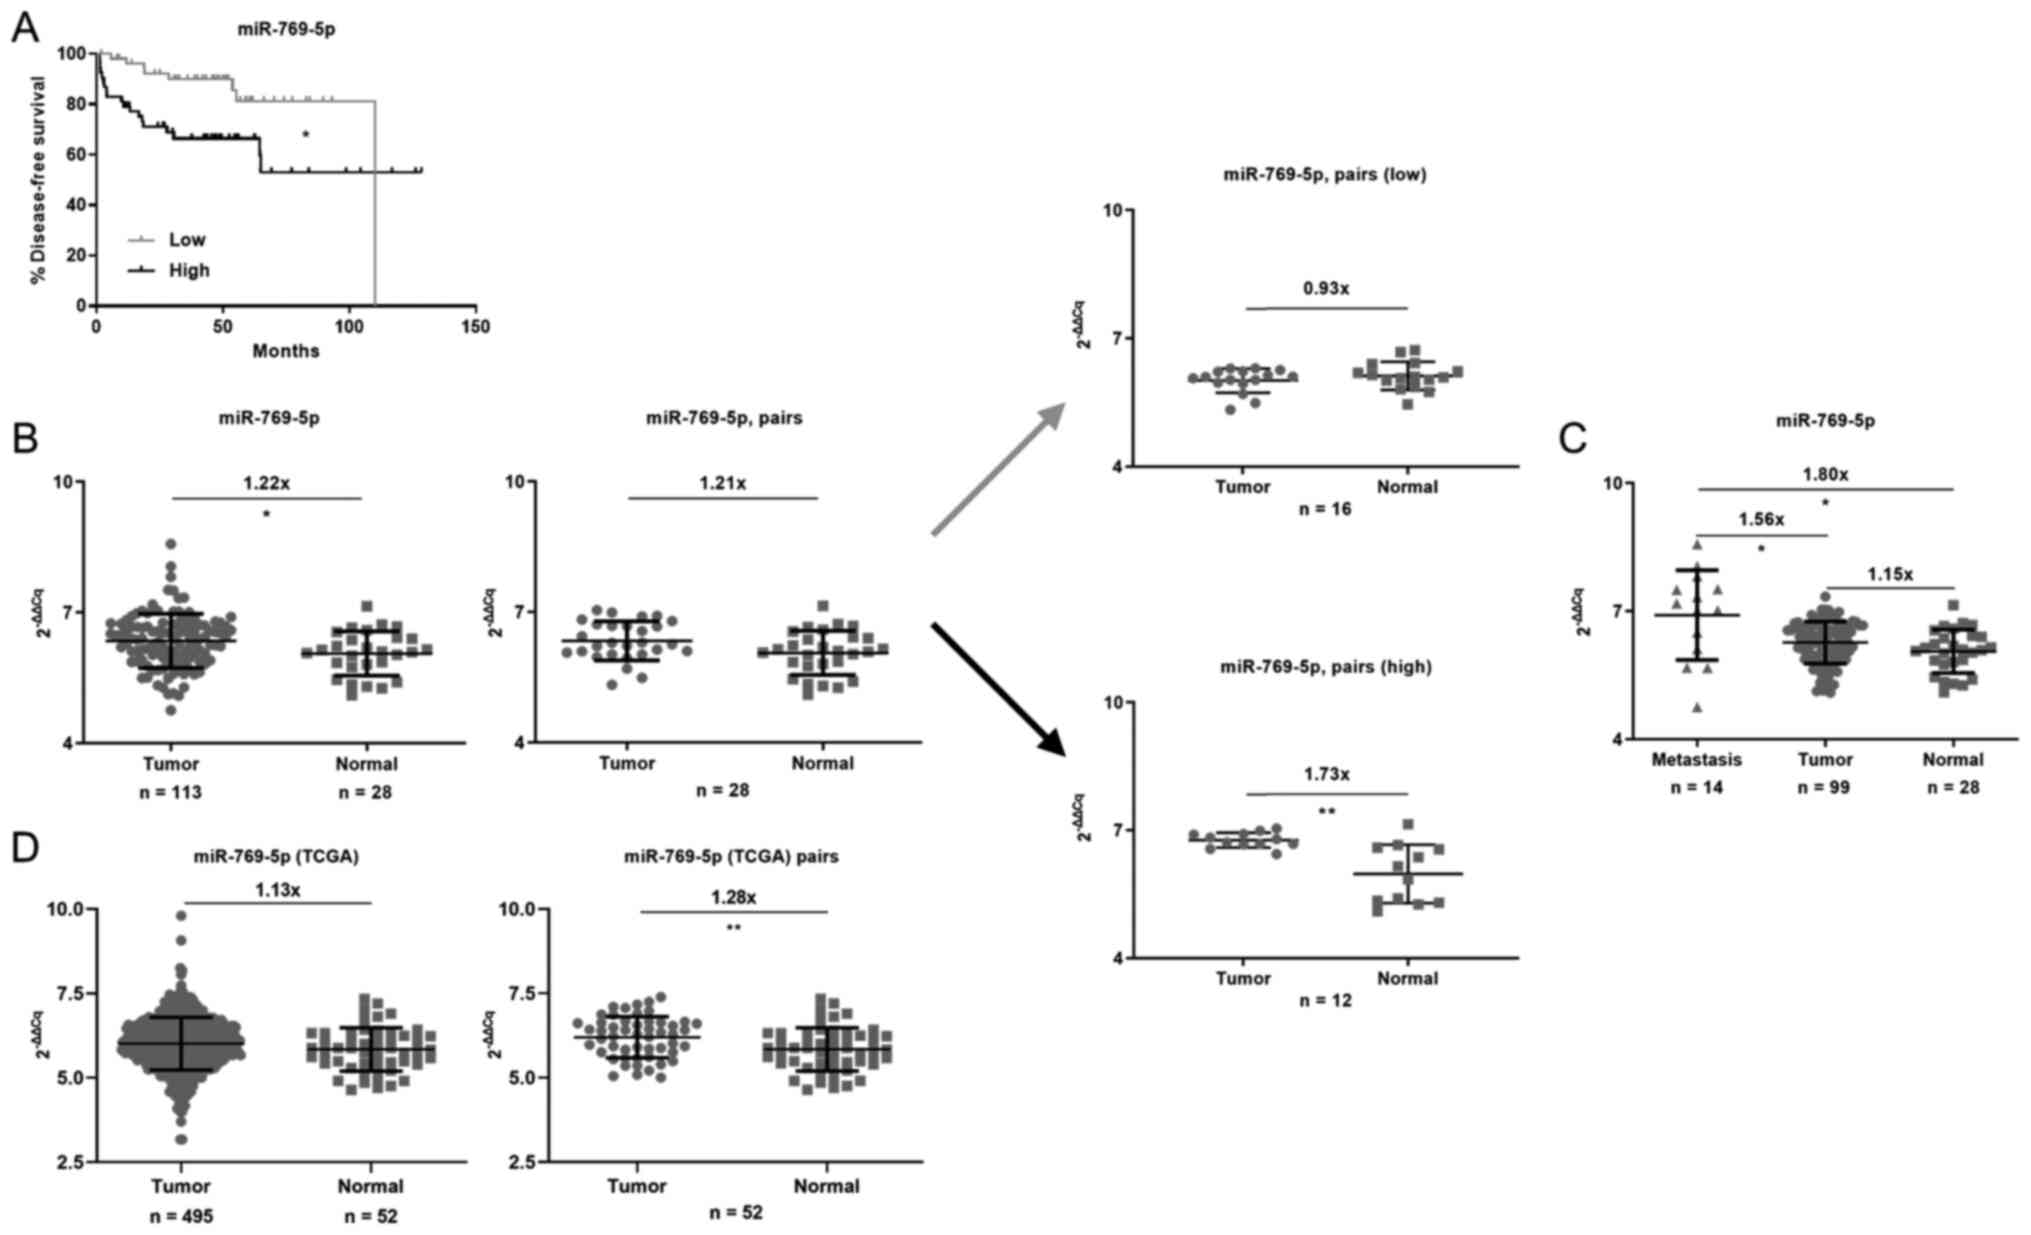 | Figure 1Analyses of miR-769-5p expression and
its impact on survival. (A) Kaplan-Meier survival analysis
suggested that miR-769-5p expression was inversely associated with
disease-free survival. Data were extracted from Taylor et al
(5) *P<0.05 according
to the log-rank test with n=107. The patients were stratified into
groups of high and low expression of miR-769-5p by assigning the
bottom 50% (n=54) to the ‘Low’ and the top 50% (n=53) to the ‘High’
group according to their rank of miR-769-5p expression. Low: 46
censored, 8 events. High: 34 censored, 19 events. (B) miR-769-5p
expression was elevated in tumor vs. normal tissues among all
cases. In an analysis of matched pairs (n=28), the difference in
miR-769-5p expression was not significant. However, after dividing
the patients into groups with low (gray arrow) or high expression
(black arrow) in the tumors, the difference in miR-769-5p
expression between tumor and adjacent non-cancerous tissue was
significant in the latter group. (C) When subdivided into 3 groups,
miR-769-5p expression was the highest in metastasis, followed by
tumor and then normal tissues. For B and C, normalized miR-769-5p
expression data were extracted from Taylor et al (5) and fold differences were calculated
using 2-∆∆Cq. (D) Analysis of all TCGA samples indicated
that the difference in miR-769-5p expression between tumor and
normal tissue did not reach statistical significance, but in
matched pairs (n=52), miR-769-5p expression was significantly
elevated in tumor vs. normal tissues. Normalized miR-769-5p
expression data were extracted from TCGA and fold differences were
calculated using 2-∆∆Cq. *P<0.05,
**P<0.01 according to an unpaired t-test with Welch's
correction or Welch's ANOVA with Dunnett's test in C. miR,
microRNA; TCGA, The Cancer Genome Atlas. |
Identification of protein-coding genes
that are candidate targets of miR-769-5p
miR-769-5p expression was assessed in six human
prostate cell lines by using RT-qPCR (Fig. 2A) and a trend toward a higher
expression in the cancer cell lines was noted, specifically those
derived from metastases compared to the non-tumorigenic RWPE1 and
tumorigenic 22Rv1 cells (Fig. 2B).
Therefore, it was reasoned that miR-769-5p may be most relevant in
the metastatic cell lines and the two metastatic cell lines DU145
and PC-3 were used for the subsequent experiments.
miR-769-5p mimics were transfected into DU145 and
PC-3 cells, followed by RNAseq and TargetScan analyses. TargetScan
is a bioinformatics tool for miR research that may be used to
select candidate target genes of miRNAs relevant in carcinogenesis.
Protein-coding genes that were predicted to be targets of
miR-769-5p according to TargetScan were focused on, and they were
required to exhibit significant downregulation 24 h after
transfection of the miR mimics.
Subsequently, the downregulated genes in the DU145
(n=322) and PC-3 (n=280) cell lines from the overlap with
TargetScan predictions (Fig. 2C and
Table I) were compared against a
list of candidate tumor suppressors (decreased expression in tumors
compared with normal tissue in two Oncomine datasets) and a
literature search was performed, focusing on potential tumor
suppressors yet to be extensively reported. The aim was to combine
the powers of RNAseq, TargetScan, Oncomine and literature searches
to select tumor suppressors targeted by miR-769-5p. This approach
yielded several candidates (Table
SII) and the top six are presented in Fig. 3.
 | Figure 3RT-qPCR analysis of predicted
candidate targets of miR-769-5p. Top ranked candidate tumor
suppressors were selected from the gene lists obtained from RNAseq
data after transfection of DU145 and PC-3 cells with the miR-769-5p
mimics. Their fold changes and P-values from RNAseq are listed in
the embedded table. miR-769-5p inhibitor, negative control or
miR-769-5p mimics were transfected into DU145 cells, followed by
RT-qPCR to measure the expression of the predicted targets (n=3).
Fold differences compared to the negative control miR group were
calculated using the 2-∆∆Cq method.
*P<0.05, **P<0.01,
***P<0.001 and ****P<0.0001 according
to Welch's ANOVA with Dunnett's test. AGPAT1,
1-acyl-sn-glycerol-3-phosphate acyltransferase α; KREMEN1, kremen
protein 1; CCNDBP1, cyclin-D1-binding protein 1; ARHGAP10, Rho
GTPase-activating protein 10; FHL3, four and a half LIM domains
protein 3; KCTD11, potassium channel tetramerisation domain
containing 11; miR, microRNA; RNAseq, RNA sequencing; RT-qPCR,
reverse-transcription quantitative PCR. |
 | Table ITop 50 candidates from the RNAseq and
TargetScan overlap for DU145 (n=322) and PC-3 (n=280). |
Table I
Top 50 candidates from the RNAseq and
TargetScan overlap for DU145 (n=322) and PC-3 (n=280).
| Item | DU145 | PC-3 |
|---|
| RNAseq candidates
(n) | 623 | 592 |
| TargetScan
candidates (n) | 3,661 | 3,661 |
| Top 50 overlapping
genes | SET, AGPAT1,
MARCH8, RUNX3, CDKN2AIPNL, ATP6V1C1, RAB3D, B3GALT6, SSNA1, MEN1,
GJB7, C17orf72, SLC45A3, CA13, UBE2D4, INHBE, KREMEN1, SH2D3C,
CERCAM, LYRM9, COL5A1, SCAMP3, CCNDBP1, ARHGAP10, DDIT3, FAM167A,
SLC35D1, HTR7, ASB13, FHL3, ABCG1, CPA4, CDH1, PHF5A, SYT3, TFAM,
FAM117B, ZADH2, SPOCK1, TK2, KIF20A, MX2, WASF3, MSC, LRP12,
HPCAL4, COPZ2, KCTD5, KIAA1199, LRP3 | SET, RUNX3,
CDKN2AIPNL, AGPAT1, MARCH8, COPZ2, ATP6V1C1, TFAM, CERCAM, NCCRP1,
CDH1, BNC1, FBLN5, MEN1, FAM117B, LRP3, CCNDBP1, B3GALT6, SCAMP3,
KREMEN1, XYLT1, SOD3, SSNA1, NUDT19, RAB3D, ZADH2, MX2, SERPINE1,
SLC35D1, SNAI3, KIF20A, STRN4, PHF5A, REEP6, KCNE3, LRP12,
ARHGAP10, KCTD5, EPSTI1, SLC44A4, WASF3, CPA4, VSIG10, RCC2, FOXO6,
GPSM3, RSAD1, CHMP3, ASB13, TK2 |
ARHGAP10 is a candidate target of
miR-769-5p
Among the six candidates, only ARHGAP10, FHL3 and
KCTD11 had the expected increase in expression upon treatment with
a miR-769-5p inhibitor and decrease in expression following
transfection of miR-769-5p mimics. ARHGAP10 expression had the
largest fold change and the strongest association with the
experimental miR-769-5p status. ARHGAP10 has been reported to be
downregulated in ovarian cancer (10), having a tumor suppressor role. In
addition, it is associated with a favorable prognosis for patients
with prostate cancer (11).
Therefore, subsequent experiments aimed to clarify the relationship
between miR-769-5p and the candidate tumor suppressor ARHGAP10 in
prostate cancer.
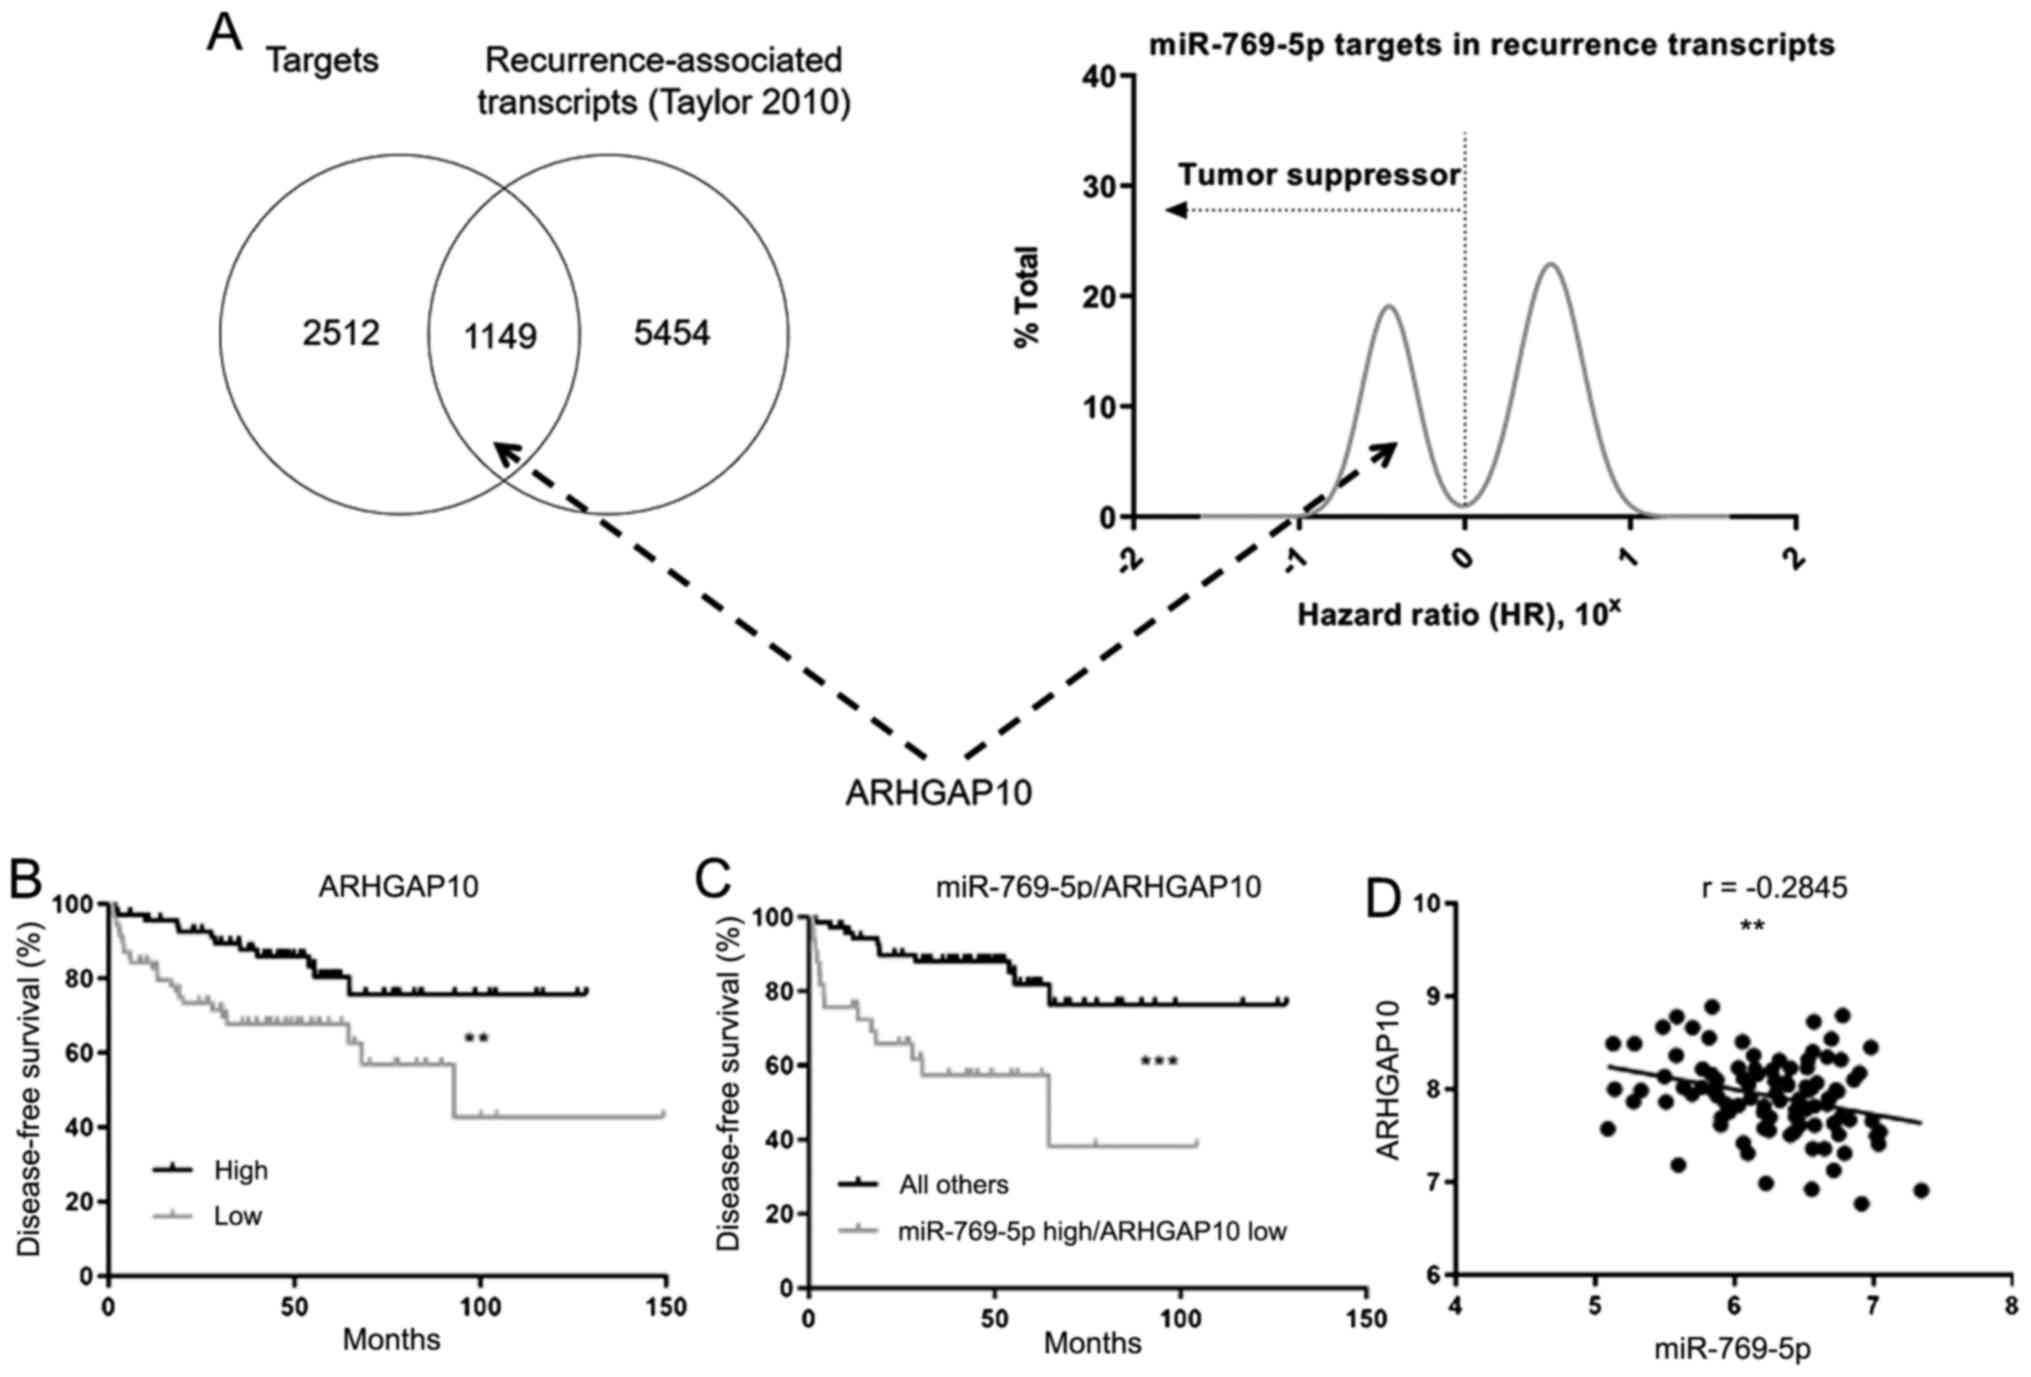
Moving forward, ARHGAP10 was indicated to be both a
predicted target of miR-769-5p in TargetScan and a prostate cancer
recurrence-associated transcript (Fig.
4A). When all recurrence-associated transcripts in the dataset
by Taylor et al (5) were
plotted according to their corresponding hazard ratios, ARHGAP10
congregated with the gene group with hazard ratios ≤1, indicating
its likely tumor suppressor role. Additional survival and
correlation analyses were performed to test the relationship
between miR-769-5p and ARHGAP10, expecting that if ARHGAP10 is
truly a target of miR-769-5p, the two entities would be inversely
correlated. The patients who had low expression of ARHGAP10 in
their tumor had reduced survival (Fig.
4B), which further confirmed its role as a tumor suppressor in
prostate cancer. Furthermore, patients who expressed miR-769-5p at
a high level and ARHGAP10 at a low level in their tumor exhibited
poor survival (Fig. 4C), consistent
with a functional relationship that affects patient survival, and
the two entities were also inversely correlated (Fig. 4D), providing additional evidence for
this relationship.
miR-769-5p targets ARHGAP10 and
influences cell survival
Based on the observations linking miR-769-5p and
ARHGAP10, it was assessed whether miR-769-5p directly targets
ARHGAP10. DU145 cells were transfected with luciferase reporter
plasmids containing variations of the binding sequence from the
3'-UTR of ARHGAP10. The plasmids with the 3'-UTR sequences
contained the WT or MUT binding sites for miR-769-5p and there were
two predicted sites, which were mutated into MUT1, MUT2 or MUT1+2.
miR-769-5p mimics significantly downregulated the luciferase
activity of the plasmid containing the WT 3'-UTR, albeit
moderately. By contrast, in the luciferase assays with the MUT1,
MUT2 and MUT1+2 plasmids, the luciferase activity was not
significantly affected by the miR-769-5p mimics (Fig. 5A), suggesting that both sites were
binding targets of miR-769-5p.
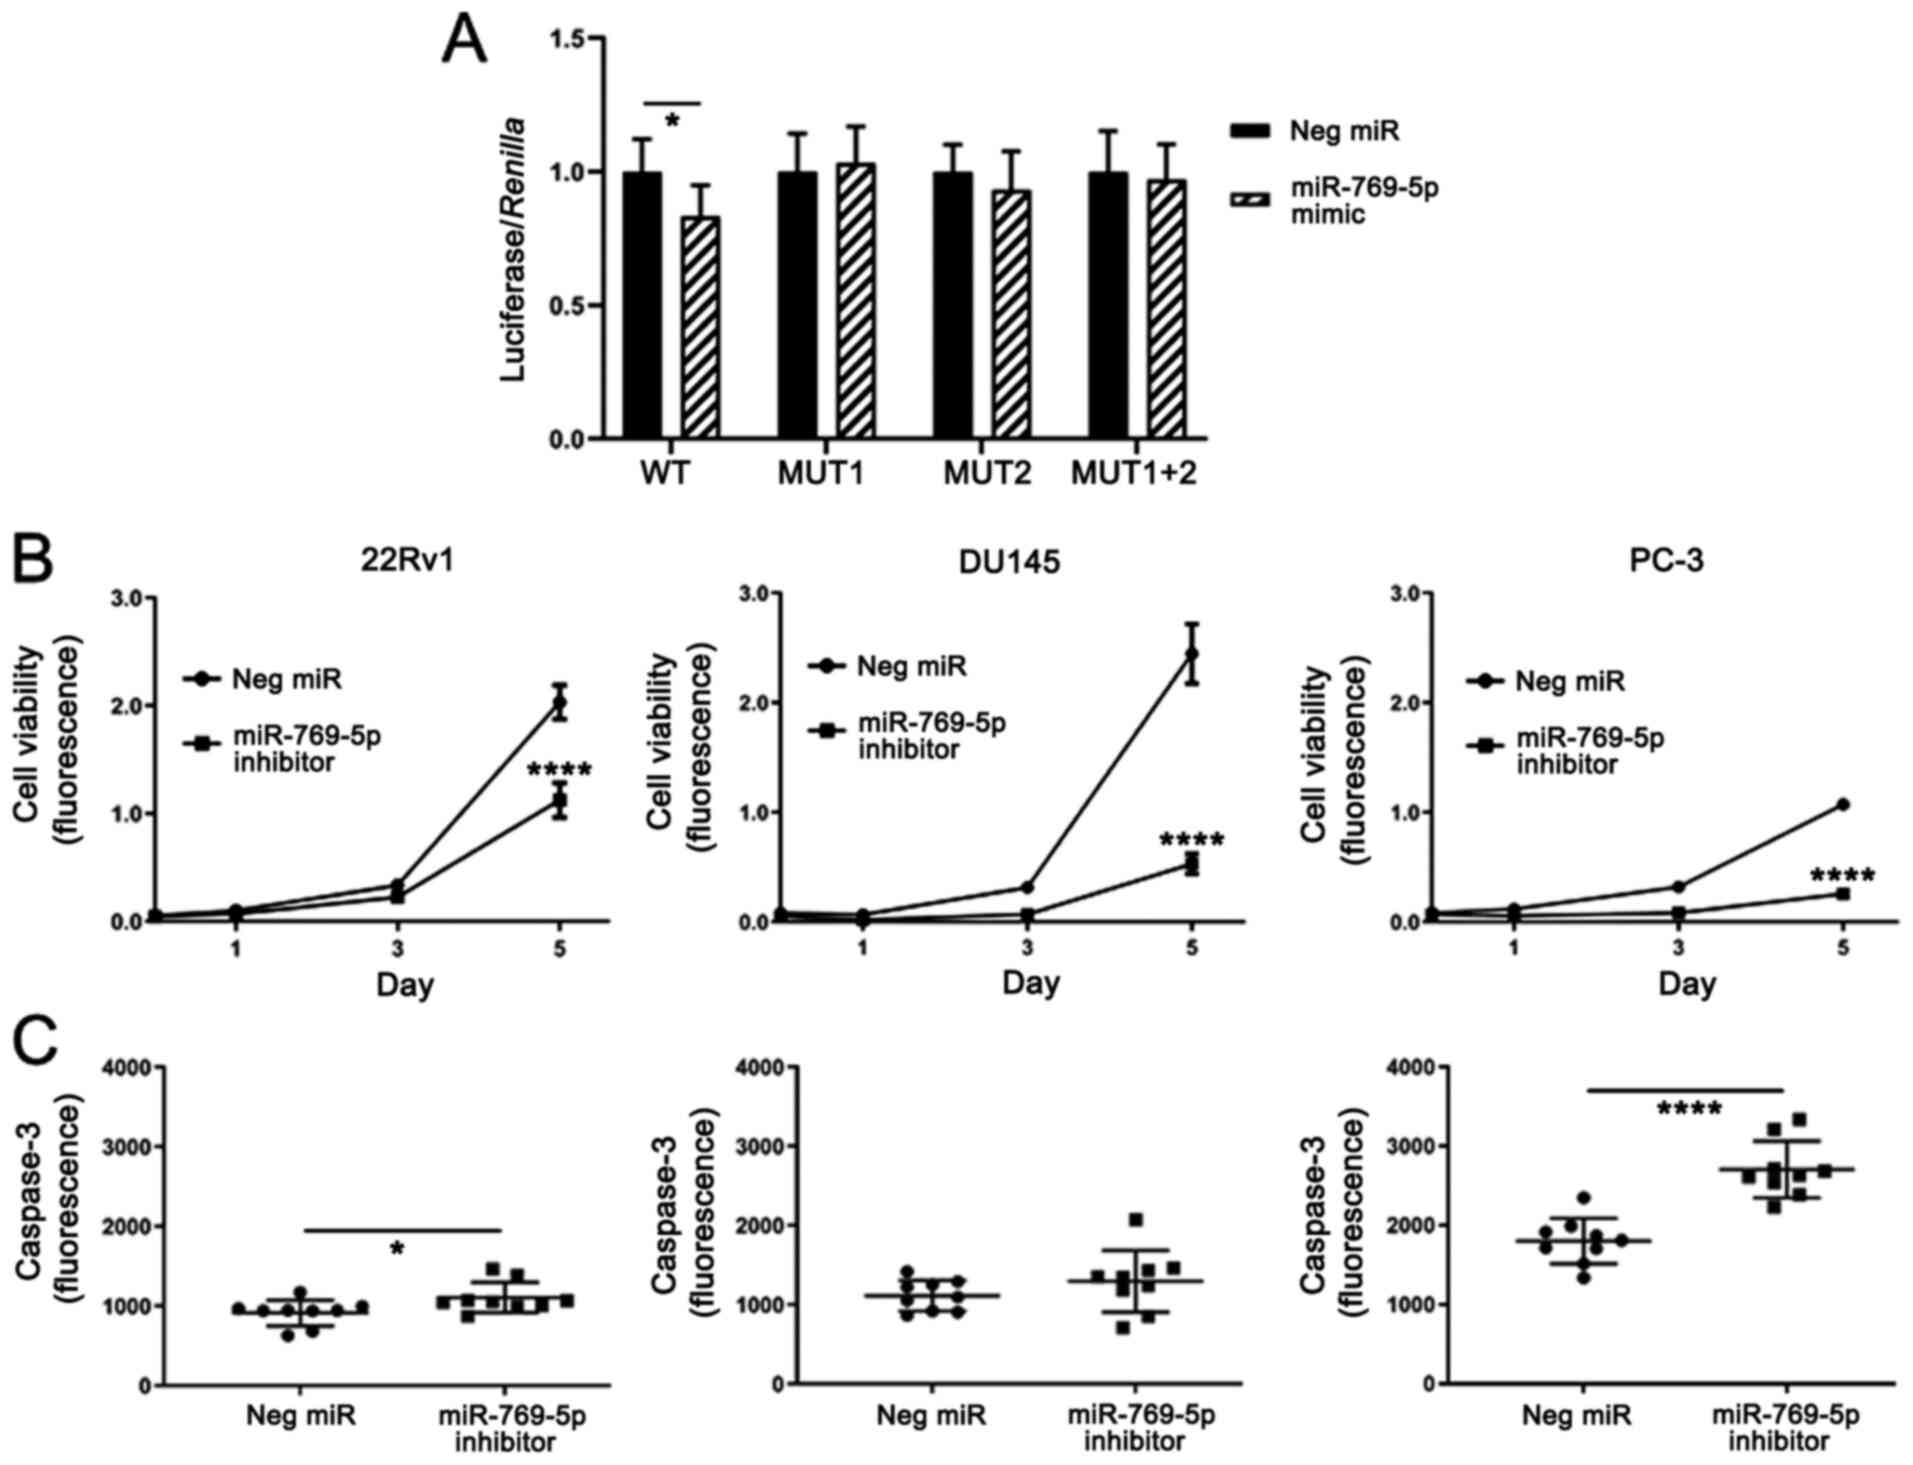 | Figure 5miR-769-5p targets ARHGAP10 and
affects proliferation and apoptosis. (A) Sequence-verified WT
3'UTR, MUT1 3'UTR, MUT2 3'UTR or MUT1+2 3'UTR of ARHGAP10 was
cloned into a luciferase reporter plasmid and transfected into
DU145 human prostate cancer cells together with a Renilla
plasmid for normalization and either negative control miR or
miR-769-5p mimics. The Y-axis indicates the ratio of luciferase to
Renilla, relative to the miRNA mimics, when the negative
control was set at 1.0. (B) Reduced proliferation following
inhibition of R-769-5p in three prostate cancer cell lines. (C)
miR-769-5p inhibition significantly increases apoptosis in two
human prostate cancer cell lines, as measured by caspase-3
activity, most noticeably in PC-3 cells. Values are expressed as
the mean ± standard deviation (n=5 in A, 3 in B and 9 in C).
*P<0.05, ****P<0.0001 according to
unpaired t-test with Welch's correction. UTR, untranslated region;
ARHGAP10, Rho GTPase activating protein 10; miR/miRNA, microRNA;
MUT, mutant; WT, wild-type; Neg, negative control. |
When the cellular functions of miR-769-5p were
assessed, it was noted that its inhibition consistently led to
reduced proliferation of the 22Rv1, DU145 and PC-3 cell lines
(Fig. 5B). Furthermore, it was
assessed whether the reduced proliferation was a result of
apoptosis by using caspase-3 as a readout. In 22Rv1 and PC-3 cells,
caspase-3 increased significantly as a result of miR-769-5p
inhibition (Fig. 5C). Therefore,
miR-769-5p may have an oncogenic function to enhance the
proliferation and inhibit apoptosis in at least a subset of human
prostate cancer cell lines.
The anti-apoptotic effect of
miR-769-5p is partially counteracted by ARHGAP10 through CDC42
Inhibition of miR-769-5p increased ARHGAP10
(Fig. 3) and ARHGAP10 was reported
to bind CDC42 to inhibit its activity (10). Therefore, it was hypothesized that
inhibition of miR-769-5p, leading to high ARHGAP10 levels, may
reduce CDC42 activity in prostate cancer cells, which was
experimentally confirmed (Fig. 6A).
Furthermore, the combined inhibition of miR-769-5p and knockdown of
ARHGAP10 negated the decreased CDC42 activity brought about by
miR-769-5p inhibition alone. Accordingly, it was hypothesized that,
similar to the relationship between ARHGAP10 and CDC42 in ovarian
cancer (10), miR-769-5p, ARHGAP10
and CDC42 have a regulatory interaction in prostate cancer cells,
i.e., miR-769-5p inhibits ARHGAP10, which suppresses CDC42. As a
result of a reduction in ARHGAP10, CDC42 would then be upregulated.
Next, it was assessed whether the combined inhibition of miR-769-5p
and knockdown of ARHGAP10 reduces the increase in caspase-3 caused
by miR-769-5p inhibition alone. The combined miR-769-5p inhibition
and ARHGAP10 knockdown modestly reduced the increased caspase-3
activity caused by miR-769-5p inhibition alone (Fig. 6B). In other words, ARHGAP10
knockdown partially rescued the increased caspase-3 activity
induced by inhibition of miR-769-5p.
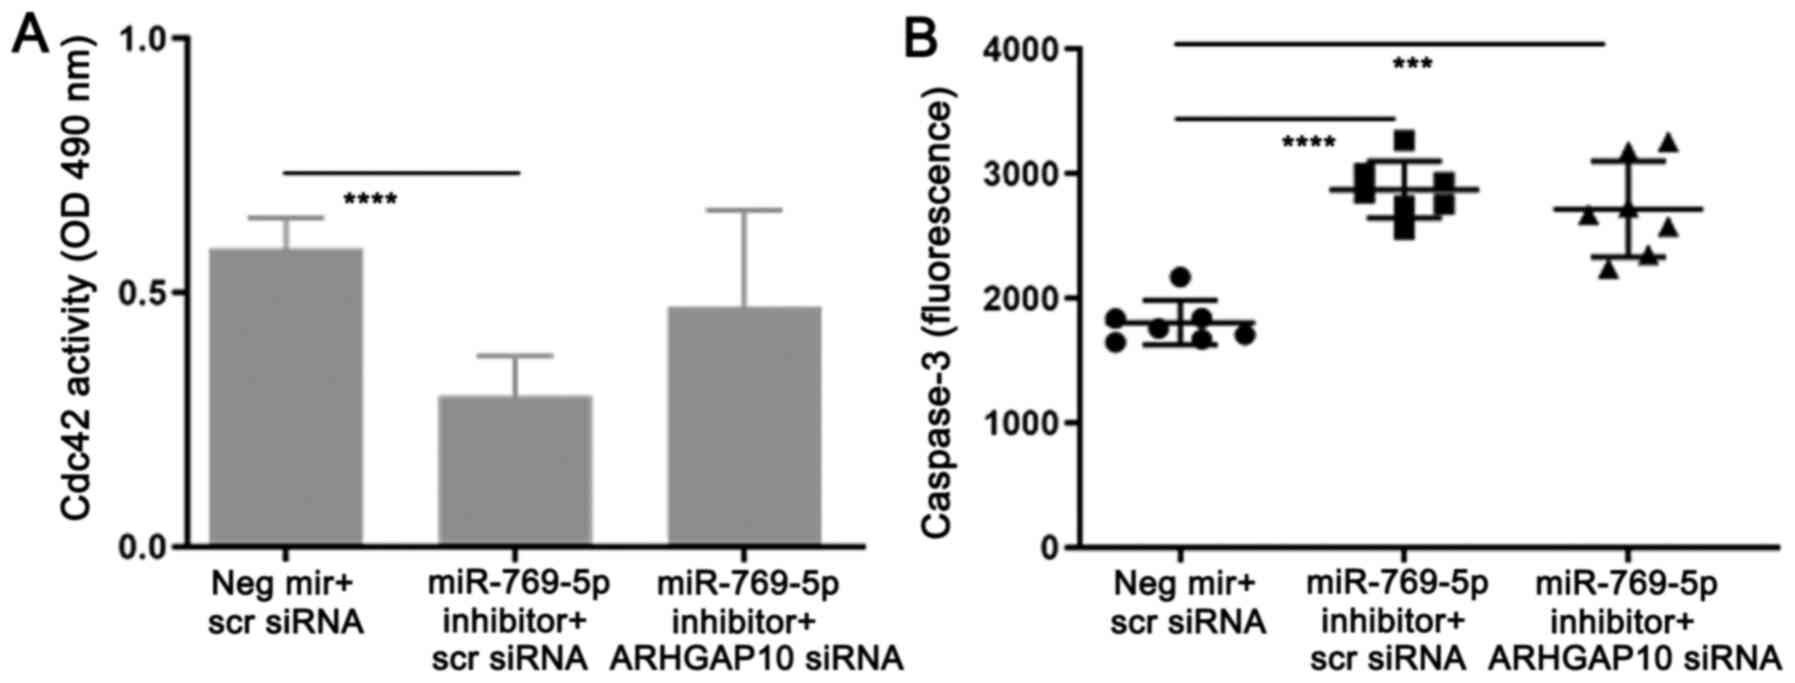 | Figure 6CDC42 activity and the effect of
double transfection of miR-769-5p inhibitor and ARHGAP10 siRNA on
apoptosis. (A) CDC42 activity was inversely associated with
ARHGAP10, consistent with the literature; CDC42 activity was lower
with miR-769-5p inhibitor vs. control miR. Combined miR-769-5p
inhibition and ARHGAP10 knockdown increased CDC42 activity vs.
miR-769-5p inhibition alone; thus, ARHGAP10 knockdown reversed the
effect of miR-769-5p inhibition. (B) miR-769-5p inhibition
increased apoptosis, which was slightly inhibited by ARHGAP10
knockdown (however, this effect was not remarkable). Values are
expressed as the mean ± standard deviation (n=6 in A and 7 in B).
***P<0.001, ****P<0.0001 according to
Welch's ANOVA with Dunnett's test. Scr, scrambled; CDC, cell
division cycle; ARHGAP10, Rho GTPase activating protein 10; miR,
microRNA; siRNA, small interfering RNA; OD, optical density; Neg,
negative control. |
Discussion
miRs have been reported to be involved in cancer.
For instance, miR-155 targets von Hippel-Lindau for degradation and
consequently upregulates angiogenesis in breast cancer (20). miR-19 degrades mitochondrial tumor
suppressor 1 to increase proliferation and migration of lung cancer
cells (21). Similarly, certain
miRs are able to promote prostate carcinogenesis in numerous ways.
miR-96 targets retinoid receptor γ (22), which is reduced in prostate cancer,
and miR-210-3p degrades TNFAIP3-interacting protein 1 and
suppressor of cytokine signaling 1(23), consequently activating NF-κβ
signaling to increase migration, invasion and metastasis of
prostate cancer cells. miR-27a-5p acts as a tumor suppressor in
prostate cancer cells, where its inhibition promoted cell growth
but its overexpression attenuated the malignant phenotype (24). Similarly, miR-197-3p functions as a
tumor suppressor by reducing prostate cancer cell proliferation and
colony formation, likely by downregulating phosphorylated Akt and
β-catenin (25).
There have been various reports on the functions of
miR-769-5p in the literature, which described its relevance in lung
cancer. miR-769-5p was noted to be upregulated in hypoxic lung
cancer cells and to affect their cell cycle by reducing the
percentage of cells in S phase (26). Also in lung cancer, miR-769-5p was
described to target transforming growth factor β receptor I to
reduce proliferation, migration and invasion in vitro and
tumor growth and metastasis in vivo (9). More studies are needed to elucidate
the role of miR-769-5p in different malignancies, including
prostate cancer. In the present study, it was indicated that
miR-769-5p modulated the proliferation and apoptosis of prostate
cancer cells. In contrast to the study on NSCLC (9), no significant relationship of
miR-769-5p expression with cell migration or invasion was obtained
in prostate cancer. Therefore, the functions of miR-769-5p are
likely context- and organ-dependent.
The luciferase assays suggested that ARHGAP10 is
targeted by miR-769-5p and the expression of the two entities was
inversely correlated in human prostate tumors. These observations
were noteworthy because ARHGAP10 has been previously reported to be
a positive prognostic factor for overall survival in prostate
cancer (11). In the present
experiments, ARHGAP10 knockdown modestly reversed the caspase-3
increase brought about by miR-769-5p inhibition. This result
implies that even though ARHGAP10 is involved in apoptosis of
prostate cancer cells caused by miR-769-5p, additional mechanisms
are likely involved. Therefore, gene targets of miR-769-5p in
addition to ARHGAP10 may require to be knocked down before a full
rescue is accomplished. Despite numerous attempts using different
cell lines and reagents, western blots to detect ARHGAP10 were
unsuccessful. No flow cytometry or western blot analysis was
performed to confirm caspase-3 activation because EnzChek Caspase-3
Assay Kit #2 (Thermo Fisher Scientific, Inc. cat. no. E13184) is a
reliable, sensitive and validated method consistent with western
blot results (27-29).
A limitation of the apoptosis experiments is that the cells were
subjected to multiple transfections prior to the assay, which adds
variability. Another limitation of the experiments in this study is
that even though both DU145 and PC-3 are from metastases, DU145
worked better for migration than PC-3 with the xCELLigence system.
In contrast, PC-3 worked better for invasion than DU145 with the
system. Repetition of the motility experiments with additional cell
lines would strengthen the findings.
In conclusion, miR-769-5p is a negative prognostic
marker in prostate cancer, consistent with an oncogenic function to
increase proliferation and inhibit apoptosis of prostate cancer
cells. One of its binding targets evidenced through luciferase
assay is ARHGAP10, whose knockdown partially reversed the effect of
miR-769-5p inhibition on apoptosis. By highlighting the relevance
of miR-769-5p and ARHGAP10 in prostate carcinogenesis, the present
study shed light on future areas of research.
Supplementary Material
Effect of miR-769-5p inhibition on
cell motility. (A and B) miR-769-5p inhibition influenced neither
(A) migration in DU145 nor (B) invasion in PC-3. Values are
expressed as the mean ± standard deviation (n=3). miR, microRNA;
Neg, negative control.
Luciferase reporter constructs.
Selected candidate gene targets of
miR-769-5p in DU145 and PC-3.
Acknowledgements
Not applicable.
Funding
Funding: This research was generously supported by the Medical
Oncology Service and the Center for Cancer Research, National
Cancer Institute, National Institutes of Health (Bethesda,
USA).
Availability of data and materials
The datasets used and/or analyzed during the current
study are available from the corresponding author on reasonable
request.
Authors' contributions
DL performed the conception and design of the study,
the experiments and bioinformatics analysis and writing of the
manuscript. The author read and approved the final manuscript for
publication.
Ethics approval and consent to
participate
Not applicable.
Patient consent for publication
Not applicable.
Competing interests
The author declares that he has no competing
interests.
References
|
1
|
Lee RC, Feinbaum RL and Ambros V: The
C. elegans heterochronic gene lin-4 encodes small RNAs with
antisense complementarity to lin-14. Cell. 75:843–854.
1993.PubMed/NCBI View Article : Google Scholar
|
|
2
|
Hudson RS, Yi M, Esposito D, Watkins SK,
Hurwitz AA, Yfantis HG, Lee DH, Borin JF, Naslund MJ, Alexander RB,
et al: MicroRNA-1 is a candidate tumor suppressor and prognostic
marker in human prostate cancer. Nucleic Acids Res. 40:3689–3703.
2012.PubMed/NCBI View Article : Google Scholar
|
|
3
|
Hudson RS, Yi M, Esposito D, Glynn SA,
Starks AM, Yang Y, Schetter AJ, Watkins SK, Hurwitz AA, Dorsey TH,
et al: MicroRNA-106b-25 cluster expression is associated with early
disease recurrence and targets caspase-7 and focal adhesion in
human prostate cancer. Oncogene. 32:4139–4147. 2013.PubMed/NCBI View Article : Google Scholar
|
|
4
|
Ambs S, Prueitt RL, Yi M, Hudson RS, Howe
TM, Petrocca F, Wallace TA, Liu CG, Volinia S, Calin GA, et al:
Genomic profiling of microRNA and messenger RNA reveals deregulated
microRNA expression in prostate cancer. Cancer Res. 68:6162–6170.
2008.PubMed/NCBI View Article : Google Scholar
|
|
5
|
Taylor BS, Schultz N, Hieronymus H,
Gopalan A, Xiao Y, Carver BS, Arora VK, Kaushik P, Cerami E, Reva
B, et al: Integrative genomic profiling of human prostate cancer.
Cancer Cell. 18:11–22. 2010.PubMed/NCBI View Article : Google Scholar
|
|
6
|
Schultz NA, Andersen KK, Roslind A,
Willenbrock H, Wojdemann M and Johansen JS: Prognostic microRNAs in
cancer tissue from patients operated for pancreatic cancer-five
microRNAs in a prognostic index. World J Surg. 36:2699–2707.
2012.PubMed/NCBI View Article : Google Scholar
|
|
7
|
Xie H, Lee L, Caramuta S, Höög A, Browaldh
N, Björnhagen V, Larsson C and Lui WO: MicroRNA expression patterns
related to merkel cell polyomavirus infection in human merkel cell
carcinoma. J Invest Dermatol. 134:507–517. 2014.PubMed/NCBI View Article : Google Scholar
|
|
8
|
Gasparini P, Cascione L, Landi L, Carasi
S, Lovat F, Tibaldi C, Alì G, D'Incecco A, Minuti G, Chella A, et
al: MicroRNA classifiers are powerful diagnostic/prognostic tools
in ALK-, EGFR-, and KRAS-driven lung cancers. Proc Natl Acad Sci
USA. 112:14924–14929. 2015.PubMed/NCBI View Article : Google Scholar
|
|
9
|
Yang Z, He J, Gao P, Niu Y, Zhang J, Wang
L, Liu M, Wei X, Liu C, Zhang C, et al: miR-769-5p suppressed cell
proliferation, migration and invasion by targeting TGFBR1 in
non-small cell lung carcinoma. Oncotarget. 8:113558–113570.
2017.PubMed/NCBI View Article : Google Scholar
|
|
10
|
Luo N, Guo J, Chen L, Yang W, Qu X and
Cheng Z: ARHGAP10, downregulated in ovarian cancer, suppresses
tumorigenicity of ovarian cancer cells. Cell Death Dis.
7(e2157)2016.PubMed/NCBI View Article : Google Scholar
|
|
11
|
Gong H, Chen X, Jin Y, Lu J, Cai Y, Wei O,
Zhao J, Zhang W, Wen X, Wang Y and Chen W: Expression of ARHGAP10
correlates with prognosis of prostate cancer. Int J Clin Exp
Pathol. 12:3839–3846. 2019.PubMed/NCBI
|
|
12
|
Livak KJ and Schmittgen TD: Analysis of
relative gene expression data using real-time quantitative PCR and
the 2(-Delta Delta C(T)) method. Methods. 25:402–408.
2001.PubMed/NCBI View Article : Google Scholar
|
|
13
|
Grasso CS, Wu YM, Robinson DR, Cao X,
Dhanasekaran SM, Khan AP, Quist MJ, Jing X, Lonigro RJ, Brenner JC,
et al: The mutational landscape of lethal castration-resistant
prostate cancer. Nature. 487:239–243. 2012.PubMed/NCBI View Article : Google Scholar
|
|
14
|
Lapointe J, Li C, Higgins JP, van de Rijn
M, Bair E, Montgomery K, Ferrari M, Egevad L, Rayford W, Bergerheim
U, et al: Gene expression profiling identifies clinically relevant
subtypes of prostate cancer. Proc Natl Acad Sci USA. 101:811–816.
2004.PubMed/NCBI View Article : Google Scholar
|
|
15
|
Singh D, Febbo PG, Ross K, Jackson DG,
Manola J, Ladd C, Tamayo P, Renshaw AA, D'Amico AV, Richie JP, et
al: Gene expression correlates of clinical prostate cancer
behavior. Cancer Cell. 1:203–209. 2002.PubMed/NCBI View Article : Google Scholar
|
|
16
|
Cancer Genome Atlas Research Network. The
molecular taxonomy of primary prostate cancer. Cell. 163:1011–1025.
2015.PubMed/NCBI View Article : Google Scholar
|
|
17
|
Tomlins SA, Mehra R, Rhodes DR, Cao X,
Wang L, Dhanasekaran SM, Kalyana-Sundaram S, Wei JT, Rubin MA,
Pienta KJ, et al: Integrative molecular concept modeling of
prostate cancer progression. Nat Genet. 39:41–51. 2007.PubMed/NCBI View
Article : Google Scholar
|
|
18
|
Wallace TA, Prueitt RL, Yi M, Howe TM,
Gillespie JW, Yfantis HG, Stephens RM, Caporaso NE, Loffredo CA and
Ambs S: Tumor immunobiological differences in prostate cancer
between African-American and European-American men. Cancer Res.
68:927–936. 2008.PubMed/NCBI View Article : Google Scholar
|
|
19
|
Yu YP, Landsittel D, Jing L, Nelson J, Ren
B, Liu L, McDonald C, Thomas R, Dhir R, Finkelstein S, et al: Gene
expression alterations in prostate cancer predicting tumor
aggression and preceding development of malignancy. J Clin Oncol.
22:2790–2799. 2004.PubMed/NCBI View Article : Google Scholar
|
|
20
|
Kong W, He L, Richards EJ, Challa S, Xu
CX, Permuth-Wey J, Lancaster JM, Coppola D, Sellers TA, Djeu JY and
Cheng JQ: Upregulation of miRNA-155 promotes tumour angiogenesis by
targeting VHL and is associated with poor prognosis and
triple-negative breast cancer. Oncogene. 33:679–689.
2014.PubMed/NCBI View Article : Google Scholar
|
|
21
|
Gu Y, Liu S, Zhang X, Chen G, Liang H, Yu
M, Liao Z, Zhou Y, Zhang CY, Wang T, et al: Oncogenic miR-19a and
miR-19b co-regulate tumor suppressor MTUS1 to promote cell
proliferation and migration in lung cancer. Protein Cell.
8:455–466. 2017.PubMed/NCBI View Article : Google Scholar
|
|
22
|
Long MD, Singh PK, Russell JR, Llimos G,
Rosario S, Rizvi A, van den Berg PR, Kirk J, Sucheston-Campbell LE,
Smiraglia DJ and Campbell MJ: The miR-96 and RARγ signaling axis
governs androgen signaling and prostate cancer progression.
Oncogene. 38:421–444. 2019.PubMed/NCBI View Article : Google Scholar
|
|
23
|
Ren D, Yang Q, Dai Y, Guo W, Du H, Song L
and Peng X: Oncogenic miR-210-3p promotes prostate cancer cell EMT
and bone metastasis via NF-κB signaling pathway. Mol Cancer.
16(117)2017.PubMed/NCBI View Article : Google Scholar
|
|
24
|
Barros-Silva D, Costa-Pinheiro P, Duarte
H, Sousa EJ, Evangelista AF, Graça I, Carneiro I, Martins AT,
Oliveira J, Carvalho AL, et al: MicroRNA-27a-5p regulation by
promoter methylation and MYC signaling in prostate carcinogenesis.
Cell Death Dis. 9(167)2018.PubMed/NCBI View Article : Google Scholar
|
|
25
|
Huang Q, Ma B, Su Y, Chan K, Qu H, Huang
J, Wang D, Qiu J, Liu H, Yang X and Wang Z: miR-197-3p represses
the proliferation of prostate cancer by regulating the
VDAC1/AKT/β-catenin signaling axis. Int J Biol Sci. 16:1417–1426.
2020.PubMed/NCBI View Article : Google Scholar
|
|
26
|
Geng Y, Deng L, Su D, Xiao J, Ge D, Bao Y
and Jing H: Identification of crucial microRNAs and genes in
hypoxia-induced human lung adenocarcinoma cells. Onco Targets Ther.
9:4605–4616. 2016.PubMed/NCBI View Article : Google Scholar
|
|
27
|
Chen S, Evans HG and Evans DR:
FAM129B/MINERVA, a novel adherens junction-associated protein,
suppresses apoptosis in HeLa cells. J Biol Chem. 286:10201–10209.
2011.PubMed/NCBI View Article : Google Scholar
|
|
28
|
Detournay O and Weis VM: Role of the
sphingosine rheostat in the regulation of cnidarian-dinoflagellate
symbioses. Biol Bull. 221:261–269. 2011.PubMed/NCBI View Article : Google Scholar
|
|
29
|
Hug H, Los M, Hirt W and Debatin KM:
Rhodamine 110-linked amino acids and peptides as substrates to
measure caspase activity upon apoptosis induction in intact cells.
Biochemistry. 38:13906–13911. 1999.PubMed/NCBI View Article : Google Scholar
|