Introduction
With population aging and lifestyle changes, the
incidence of atherosclerotic cardiovascular disease continues to
rise (1). It was estimated that the
number of patients with cardiovascular diseases was 422.7 million
globally in 2015(2). In China, the
number of patients with cardiovascular diseases was >290 million
in 2015, and such diseases have become a major cause of death in
Chinese populations (1).
The current available approaches, such as
angiography and intravascular ultrasound, have shown diagnostic
value for atherosclerosis; however, these tools are all invasive,
and are not of diagnostic significance until the atherosclerotic
plaques are large enough or the vascular stenosis is severe
(3). A search for novel,
noninvasive approaches for diagnosis of early atherosclerosis is
therefore of great importance for the assessment and management of
atherosclerosis. Atherosclerosis is accepted as a chronic
inflammatory disorder (4), and the
monocyte-macrophage system has been shown to have a critical role
in its development and progression (5,6).
Uptake of 18F-fluorodeoxyglucose (18F-FDG)
has been reported to be strongly associated with macrophage
density. Chen et al (7)
suggested that the standardized uptake values (SUVs) of
18F-FDG may be closely associated with the number of
macrophages, and indicated that 18F-FDG positron
emission tomography (18F-FDG PET) imaging may be able to
quantify the metabolic activity of macrophages in the rat arterial
vessel walls under various physiological or pathological
conditions. In addition, 18F-FDG PET imaging may
directly display local inflammation and the metabolic activity of
macrophage accumulation in atherosclerosis, which may be used to
assess early inflammation in atherosclerosis (8-10).
The utility of 18F-FDG PET as a marker of inflammation
has been extensively studied in mouse and rabbit models of
atherosclerosis, as well as in humans (11). The purpose of the present study was
to design a Wistar rat model of high-fat and high-salt diet-induced
inflammatory lesions of the arterial vessel walls, in order to
evaluate the value of 18F-FDG PET, as a noninvasive
tool, in the assessment and management of early inflammation in
atherosclerosis. These findings could be of great clinical
significance for early diagnosis, assessment and treatment of early
atherosclerotic diseases.
Materials and methods
Modeling inflammatory lesions of the
arterial vessel walls in rats
A total of 20 healthy 8-week-old male rats (230-250
g) of the Wistar strain were purchased from the Comparative
Medicine Center of Yangzhou University (Yangzhou, China). After
adaptive feeding for a week in the laboratory, rats were randomly
grouped, with 10 animals in each group. Rats in the normal diet
group (n=10) were given conventional rodent feed (10% fat, 22%
protein, 68% carbohydrate and 0.5% salt; Shanghai SLAC Laboratory
Animal Co., Ltd.), whereas rats in the high-fat diet group (n=10)
consumed high-fat and high-salt feed (49% fat, 21% protein, 30%
carbohydrate and 2% salt; Shanghai SLAC Laboratory Animal Co.,
Ltd.) for 16-24 weeks. All rats were caged and given free access to
food and water. All animals were housed in a facility at room
temperature (18-26˚C) and ~50% humidity under a 12/12-h light/dark
cycle. Rats were fed in the morning and evening each day, and the
water was changed every other day. Body weight, body length and
abdominal circumference were measured once every 4 weeks, and blood
pressure, heart rate, blood lipid, blood glucose and insulin (INS)
levels were measured once every 8 weeks.
Measurement of blood pressure
Rat blood pressure was measured using a rat-tail
artery blood pressure test system (BP-98A meter; Softron Beijing
Biotechnology Co., Ltd; http://www.softron.cn/). All rats were kept in an
incubator at 37˚C for 5 min before the measurement. During the
measurement, all animals were kept awake, with limited activity.
Each rat was measured twice, and the mean blood pressure was
calculated. Meanwhile, the rat heart rates were monitored during
the blood pressure measurement.
Measurement of body weight, body
length and abdominal circumference
The rat body weight was measured via the
conventional method, using an electronic balance with an accuracy
of 0.1 g to measure the weight of each rat. When the data became
stable, the readout was recorded. Abdominal circumference (cm) was
assessed on the largest zone of the rat abdomen using a plastic
non-extensible measuring tape, and body length was defined as the
length between the nose and anus. Lee's index was calculated as
follows: Lee's index = [body weight (g)]x1/3x[103/body length
(cm)].
Measurement of blood lipids, blood
glucose and INS levels
After fasting for 12 h, blood samples (0.5-1.0 ml)
were collected by cutting the rat tail. The blood glucose level was
measured using a ONETOUCH® UltraVue™ glucose meter
(LifeScan, LLP), and the triglyceride (TG), total cholesterol (TC),
high-density lipoprotein cholesterol (HDL-C) and low-density
lipoprotein cholesterol (LDL-C) levels were tested with commercial
reagents (Wako Pure Chemical Industries, Ltd.) on a Hitachi 7600
fully automatic biochemical analyzer (Hitachi, Ltd.). Blood INS
concentration was measured with commercial reagents (Beckman
Coulter, Inc.) on a DxI 800 Access Immunoassay system (Beckman
Coulter, Inc.). All measurements were performed according to the
manufacturers' instructions. Rats were anesthetized with 400 mg/kg
chloral hydrate (Sinopac Chemical Reagent Co., Ltd.). Before use, a
4% chloral hydrate solution was prepared using 0.9% sodium chloride
and subsequently it was intraperitoneally injected to the rats. If
rats lost >15% of their body weight or could not eat for >3
days, rats were euthanized by cervical dislocation. However, none
of the rats reached the humane endpoints early in the study.
18F-FDG micro-PET
imaging
A total of 16 and 24 weeks after feeding, Wistar
rats in the normal diet group and the high-fat diet group (n=5
rats/group) were injected with 18F-FDG (supplied by the
Department of Nuclear medicine, Affiliated Hospital of Jiangnan
University, Wuxi, China; http://www.wuxihospital.com/petct/index.html) through
the tail vein at a dose of 1 mCi/kg after fasting for 12 h. After 1
h, 2% isoflurane (Minrad International, Inc.) was used to induce
anesthesia in rats and anesthesia was maintained with 1.5%
isoflurane (12,13) using a Midmark Matrx anesthesia
machine (Midmark Corporation). Subsequently, micro-PET imaging was
performed using a Siemens Inveon micro-PET scanner (Siemens
Healthineers) with an LSO crystal; the conditions were as follows:
Death time of 40 nsec, a 20x20 matrix, a 1.4-mm maximum resolution
of the imaging field of view, a detection range of 10x10x12.7 cm, a
slice thickness of 0.8 mm, and a 10-min image capture duration. To
ensure consistency between the micro-PET scanning slices and the
pathological sections, the blood vessels in the inferior segment of
the abdominal aorta that were proximal to the bilateral iliac
artery bifurcation were sampled for micro-PET scanning.
Pathological examinations
After micro-PET imaging, rats were intraperitoneally
injected with chloral hydrate (400 mg/kg) for anesthesia (14,15),
and euthanized by cardiac perfusion with normal saline and 4%
paraformaldehyde. Death was confirmed by cardiac and respiratory
arrest. The abdominal aorta and the bilateral iliac artery were
then dissected, and the blood vessels in the inferior segment of
the abdominal aorta that were proximal to the bilateral iliac
artery bifurcation were collected. Blood vessels were fixed in 4%
paraformaldehyde (4˚C; 12 h), dehydrated in a gradient ethanol
series and embedded in paraffin wax at 25˚C overnight. The duration
of the experiment lasted for ~1 h. Subsequently, the vascular cross
sections were sectioned into 4-µm thick slices. For
immunohistochemistry, vascular sections were incubated with a
primary antibody against CD68 (1:1,000; cat. no. ab125212; Abcam)
at 4˚C overnight, followed by incubation with an HRP-conjugated
secondary antibody (1:2,000; cat. no. 8114; Cell Signaling
Technology, Inc.) for 1 h at room temperature, detected with
3,3'-diaminobenzidine at 25˚C for 20 min, and counterstained with
hematoxylin. The slides were examined using Olympus microscope
(BX41) and Olympus DP70 Digital Camera System at x200 magnification
(Olympus Corporation). The brown-stained area (CD68+
cells) was separately quantified using ImageJ version 1.52a
(National Institutes of Health).
Ethical considerations
All animal studies were conducted in accordance with
the recommendations in the Guidelines for the management and use of
laboratory animals (16) The
present study was approved by the Ethics Review Committee of
Jiangsu Lake Taihu Sanatorium (permission no. SGLERC-2011008; Wuxi,
China) and Jiangsu Provincial People's Hospital Group (permission
no. SRY20100820).
Data analyses
The region of interest (ROI) of high
18F-FDG uptake in the blood vessels was marked using the
ASI Pro VM™ MicroPET Analysis software version 6.8.6.9 (Concorde
Microsystems, Inc.) and the 18F-FDG SUVs were calculated
using the following formula: SUV mean (the average of uptake within
the ROI) = (radioactivity concentration in ROI x rat body
weight)/total administered dose of 18F-FDG (decay
corrected).
Independent samples t-test was used to assess the
differences in physiological indexes and metabolic parameters
between the groups. In addition, comparison of SUV values between
the different groups over the same period was made using the
independent samples t-test. Considering the influence of time and
sample size, the Mann-Whitney U test was used to compare SUV values
at weeks 16 and 24 in the high-fat group. The differences in CD68
staining intensity among groups were analyzed by one-way ANOVA
followed by Tukey's post hoc test. The data are presented as the
mean ± SEM and box-and-whisker diagrams in Figs.
1-3. All statistical analyses were conducted using SPSS
statistical software, version 15.0 (SPSS, Inc.). P<0.05 was
considered to indicate a statistically significant difference.
Results
Changes in physical and metabolic
parameters
As shown in Table I,
there were no significant differences between the normal diet group
and the high-fat diet group in terms of body weight, abdominal
circumference, body length, Lee's index or blood pressure at
baseline and after 8 weeks of feeding (P>0.05). Differences
between groups were analyzed by independent samples t-test. The
body weight and abdominal circumference were higher in the high-fat
diet group compared with those in the normal diet group at 8 weeks
(P<0.05), and the systolic blood pressure (SBP) and diastolic
blood pressure (DBP) were higher in the high-fat diet group
compared with those in the normal diet group at 12 weeks
(P<0.05). There was no significant difference in heart rate
between the two groups (P>0.05) (Table I).
 | Table IChanges in physical and metabolic
parameters in rats. |
Table I
Changes in physical and metabolic
parameters in rats.
| | Baseline | 4 weeks | 8 weeks | 12 weeks | 16 weeks | 20 weeks | 24 weeks |
|---|
| Characteristic | Normal diet | High-fat diet | Normal diet | High-fat diet | Normal diet | High-fat diet | Normal diet | High-fat diet | Normal diet | High-fat diet | Normal diet | High-fat diet | Normal diet | High-fat diet |
|---|
| Weight (g) | 241.20±17.04 | 238.71±18.53 | 318.52±34.51 | 315.47±43.48 | 363.08±42.20 |
418.18±63.49a | 377.05±62.27 |
463.75±68.38b | 410.09±59.33 |
528.59±92.26b | 429.76±64.29 |
585.69±83.05b | 453.86±57.22 |
614.00±121.83b |
| Body length
(cm) | 20.97±1.34 | 20.73±0.96 | 22.4±1.24 | 22.18±1.73 | 23.39±1.05 | 23.89±1.41 | 24.70±1.09 | 24.04±1.68 | 24.35±1.27 | 24.95±1.25 | 24.57±1.40 | 25.88±1.30 | 25.76±0.89 | 25.43±2.30 |
| Abdominal
circumference (cm) | 16.20±0.63 | 16.36±0.85 | 17.85±1.23 | 18.18±0.97 | 18.35±0.75 |
19.24±0.71b | 18.05±1.14 |
19.82±1.01b | 19.00±2.21 |
20.92±1.88a | 20.07±1.17 |
21.75±1.60a | 21.21±0.91 |
23.14±1.07b |
| Lee's index | 297.59±17.00 | 299.54±12.41 | 304.91±10.61 | 307.18±13.83 | 304.65±4.25 |
312.41±6.15b | 306.80±39.29 | 321.80±10.62 | 304.79±16.39 |
322.98±13.93a | 306.68±12.08 |
322.89±11.23a | 303.89±11.62 |
333.90±17.32b |
| HR (bpm) | 377.9±24.55 | 362.43±13.52 | / | / | 371.80±42.37 | 406.29±45.82 | 372.60±29.95 | 375.21±46.00 | 365.80±66.99 | 399.25±30.38 | 386.71±37.66 | 397.50±43.82 | 401.5±42.95 | 413.71±26.65 |
| SBP (mmHg) | 116.40±9.79 | 113.14±7.12 | / | / | 117.90±13.54 | 126.00±16.30 | 120.80±6.88 |
138.21±14.43b | 106.00±15.98 |
141.17±21.61b | 112.57±13.11 |
142.33±26.29b | 102.33±24.65 |
145.00±17.17b |
| DBP (mmHg) | 76.60±5.35 |
69.57±7.56a | / | / | 86.50±11.92 | 89.64±17.93 | 77.70±11.00 |
104.36±15.44b | 75.10±16.48 |
106.50±22.37b | 74.29±10.77 |
98.33±11.71b | 74.83±11.97 |
92.43±20.25a |
| TG (mmol/l) | 0.38±0.16 | 0.39±0.09 | / | / | 1.43±0.59 | 1.04±0.87 | / | / | 1.46±0.32 | 2.02±0.51 | / | / | 1.53±0.39 | 1.44±0.63 |
| TC (mmol/l) | 1.79±0.31 | 1.71±0.44 | / | / | 1.69±0.14 |
2.21±0.33b | / | / | 1.51±0.36 | 2.02±0.47 | / | / | 1.57±0.44 |
2.31±0.45a |
| HDL-C (mmol/l) | 0.94±0.13 | 0.96±0.31 | / | / | 0.86±0.09 | 0.85±0.23 | / | / | 0.99±0.18 | 0.97±0.22 | / | / | 0.96±0.24 | 1.05±0.33 |
| LDL-C (mmol/l) | 0.68±0.09 | 0.67±0.20 | / | / | 0.69±0.21 | 0.72±0.30 | / | / | 0.67±0.09 |
0.89±0.09a | / | / | 0.81±0.23 | 0.61±0.46 |
| FBG (mmol/l) | 4.98±0.44 | 4.66±0.63 | / | / | 4.83±0.44 | 5.13±0.39 | / | / | 5.32±0.56 | 4.84±0.20 | / | / | 4.97±0.36 | 5.55±0.58 |
| INS (µU/ml) | 0.11±0.06 | 0.13±0.17 | / | / | 0.19±0.13 | 0.17±0.14 | / | / | 0.14±0.05 | 0.12±0.04 | / | / | 0.08±0.03 |
0.19±0.09a |
There were no significant differences in the INS
levels between the two groups at baseline, and at 8 and 16 weeks
(P>0.05). However, higher INS levels were detected in the
high-fat diet group compared with those in the normal diet group at
24 weeks (P<0.05). Higher TC concentrations were detected in the
high-fat diet group compared with those in the normal diet group at
8 and 24 weeks (P<0.05), and a higher LDL-C concentration was
revealed in the high-fat diet group compared with that in the
normal diet group at 16 weeks (P<0.05). No significant
differences were observed between the two groups in terms of
fasting glucose concentration, TG or HDL-C levels (P>0.05)
(Table I).
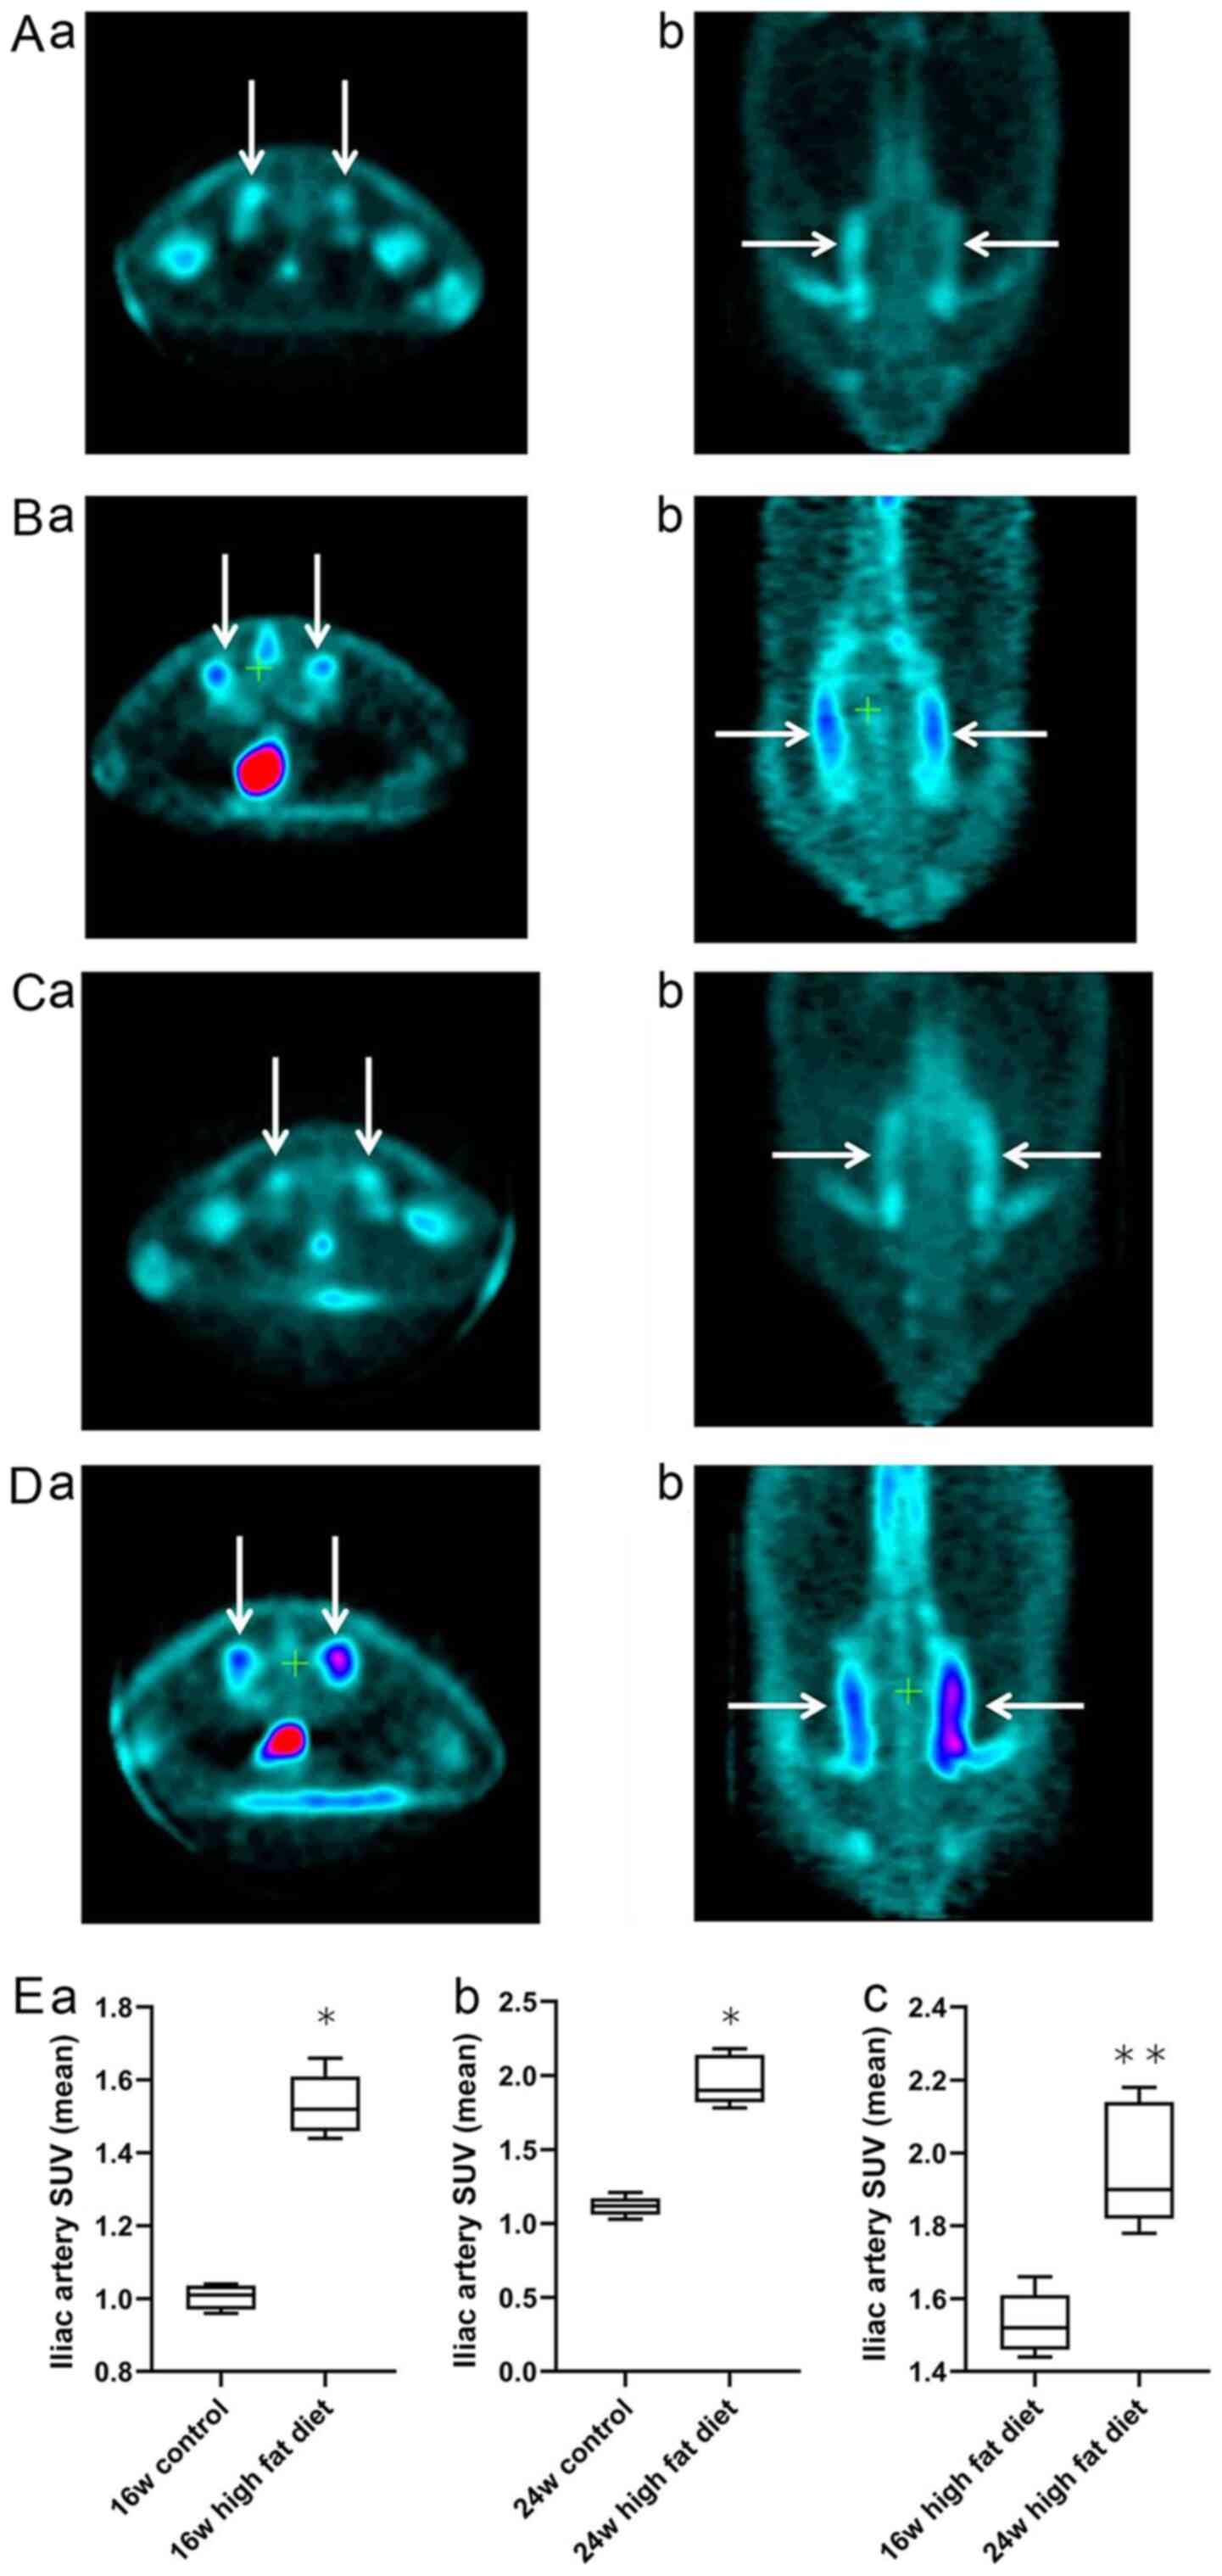
18F-FDG micro-PET imaging
of rats
The cross-sectional and coronal profiles of
18F-FDG uptake by bilateral iliac arteries at weeks 16
and 24 in rats in the normal diet group (Fig. 1Aa, b, Ca and
b) and high-fat diet group
(Fig. 1Ba, b, Da and
b) are shown. Independent samples
t-test was used for analysis of the normal diet and high-fat diet
groups. At week 16, the mean SUV of 18F-FDG in the iliac
artery vessels in the high-fat diet group was significantly higher
than that in the normal diet group (1.53±0.08 vs. 1.04±0.03;
P<0.05; Fig. 1Ea). At week 24,
the mean SUV of 18F-FDG in the iliac artery vessels in
the high-fat diet group was significantly higher than that in the
normal diet group (1.96±0.17 vs. 1.11±0.07; P<0.05; Fig. 1Eb). For analysis of rats in the
high-fat diet group at weeks 16 and 24, a Mann-Whitney U test was
used. The average SUV intake of 18F-FDG in the iliac
artery at week 24 was significantly higher than that at week 16 in
the high-fat diet group (1.96±0.17 vs. 1.53±0.08; P<0.01;
Fig. 1Ec). These results indicated
that the uptake of 18F-FDG into the iliac artery wall
was significantly increased in rats on a high-fat diet with
increased feeding time.
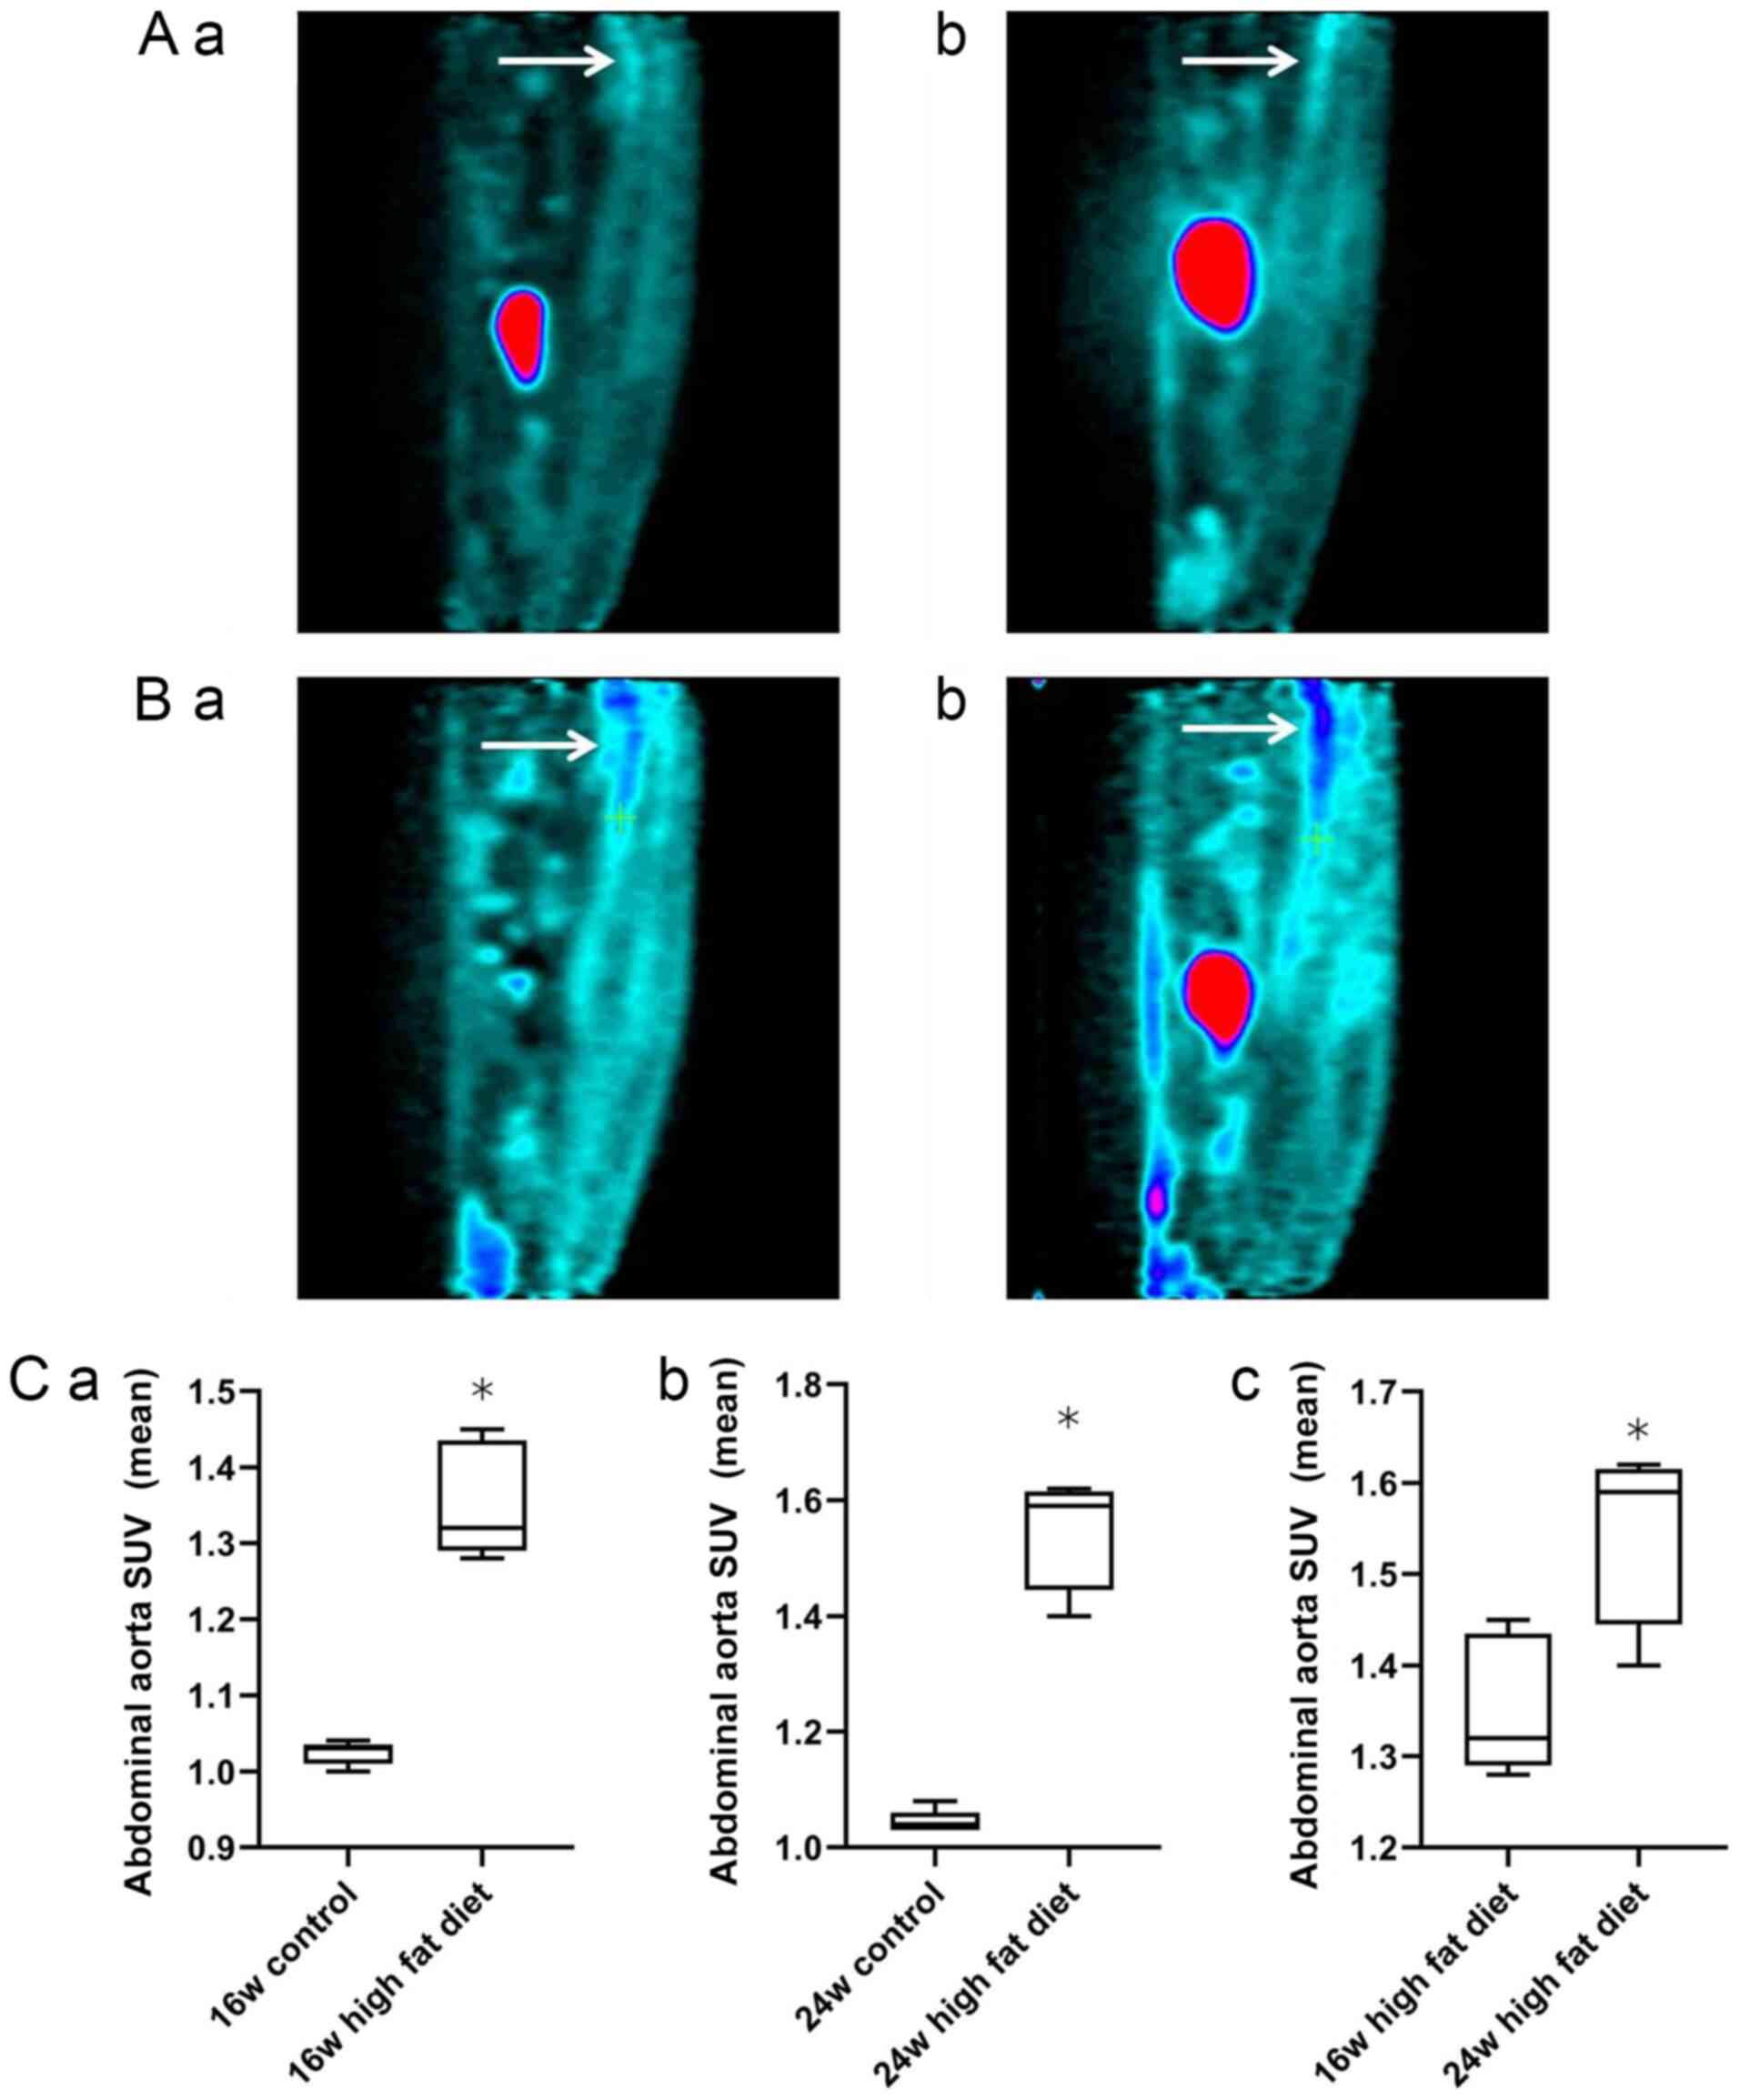
The sagittal plane of 18F-FDG uptake by
the abdominal aorta at weeks 16 and 24 in rats in the normal diet
group (Fig. 2Aa and b) and high-fat diet group (Fig. 2Ba and b) are shown. Independent samples t-test
was used for analysis of the normal diet and high-fat diet groups.
At weeks 16 (1.35±0.08 vs. 1.02±0.02) and 24 (1.54±0.09 vs.
1.04±0.02), the mean SUV of 18F-FDG in the abdominal
aorta in the high-fat diet group was significantly higher than that
in the normal diet group (all P<0.05; Fig. 2Ca and b). For analysis of rats in the high-fat
diet group at weeks 16 and 24, a Mann-Whitney U test was used. The
uptake of 18F-FDG in the abdominal aorta in the high-fat
diet group at week 24 was significantly higher than that at week 16
(1.54±0.09 vs. 1.35±0.08; P<0.05; Fig. 2Cc). These findings indicated that,
with the increase in feeding time, the uptake of 18F-FDG
into the abdominal aortic wall of the rats on a high-fat diet was
significantly increased.
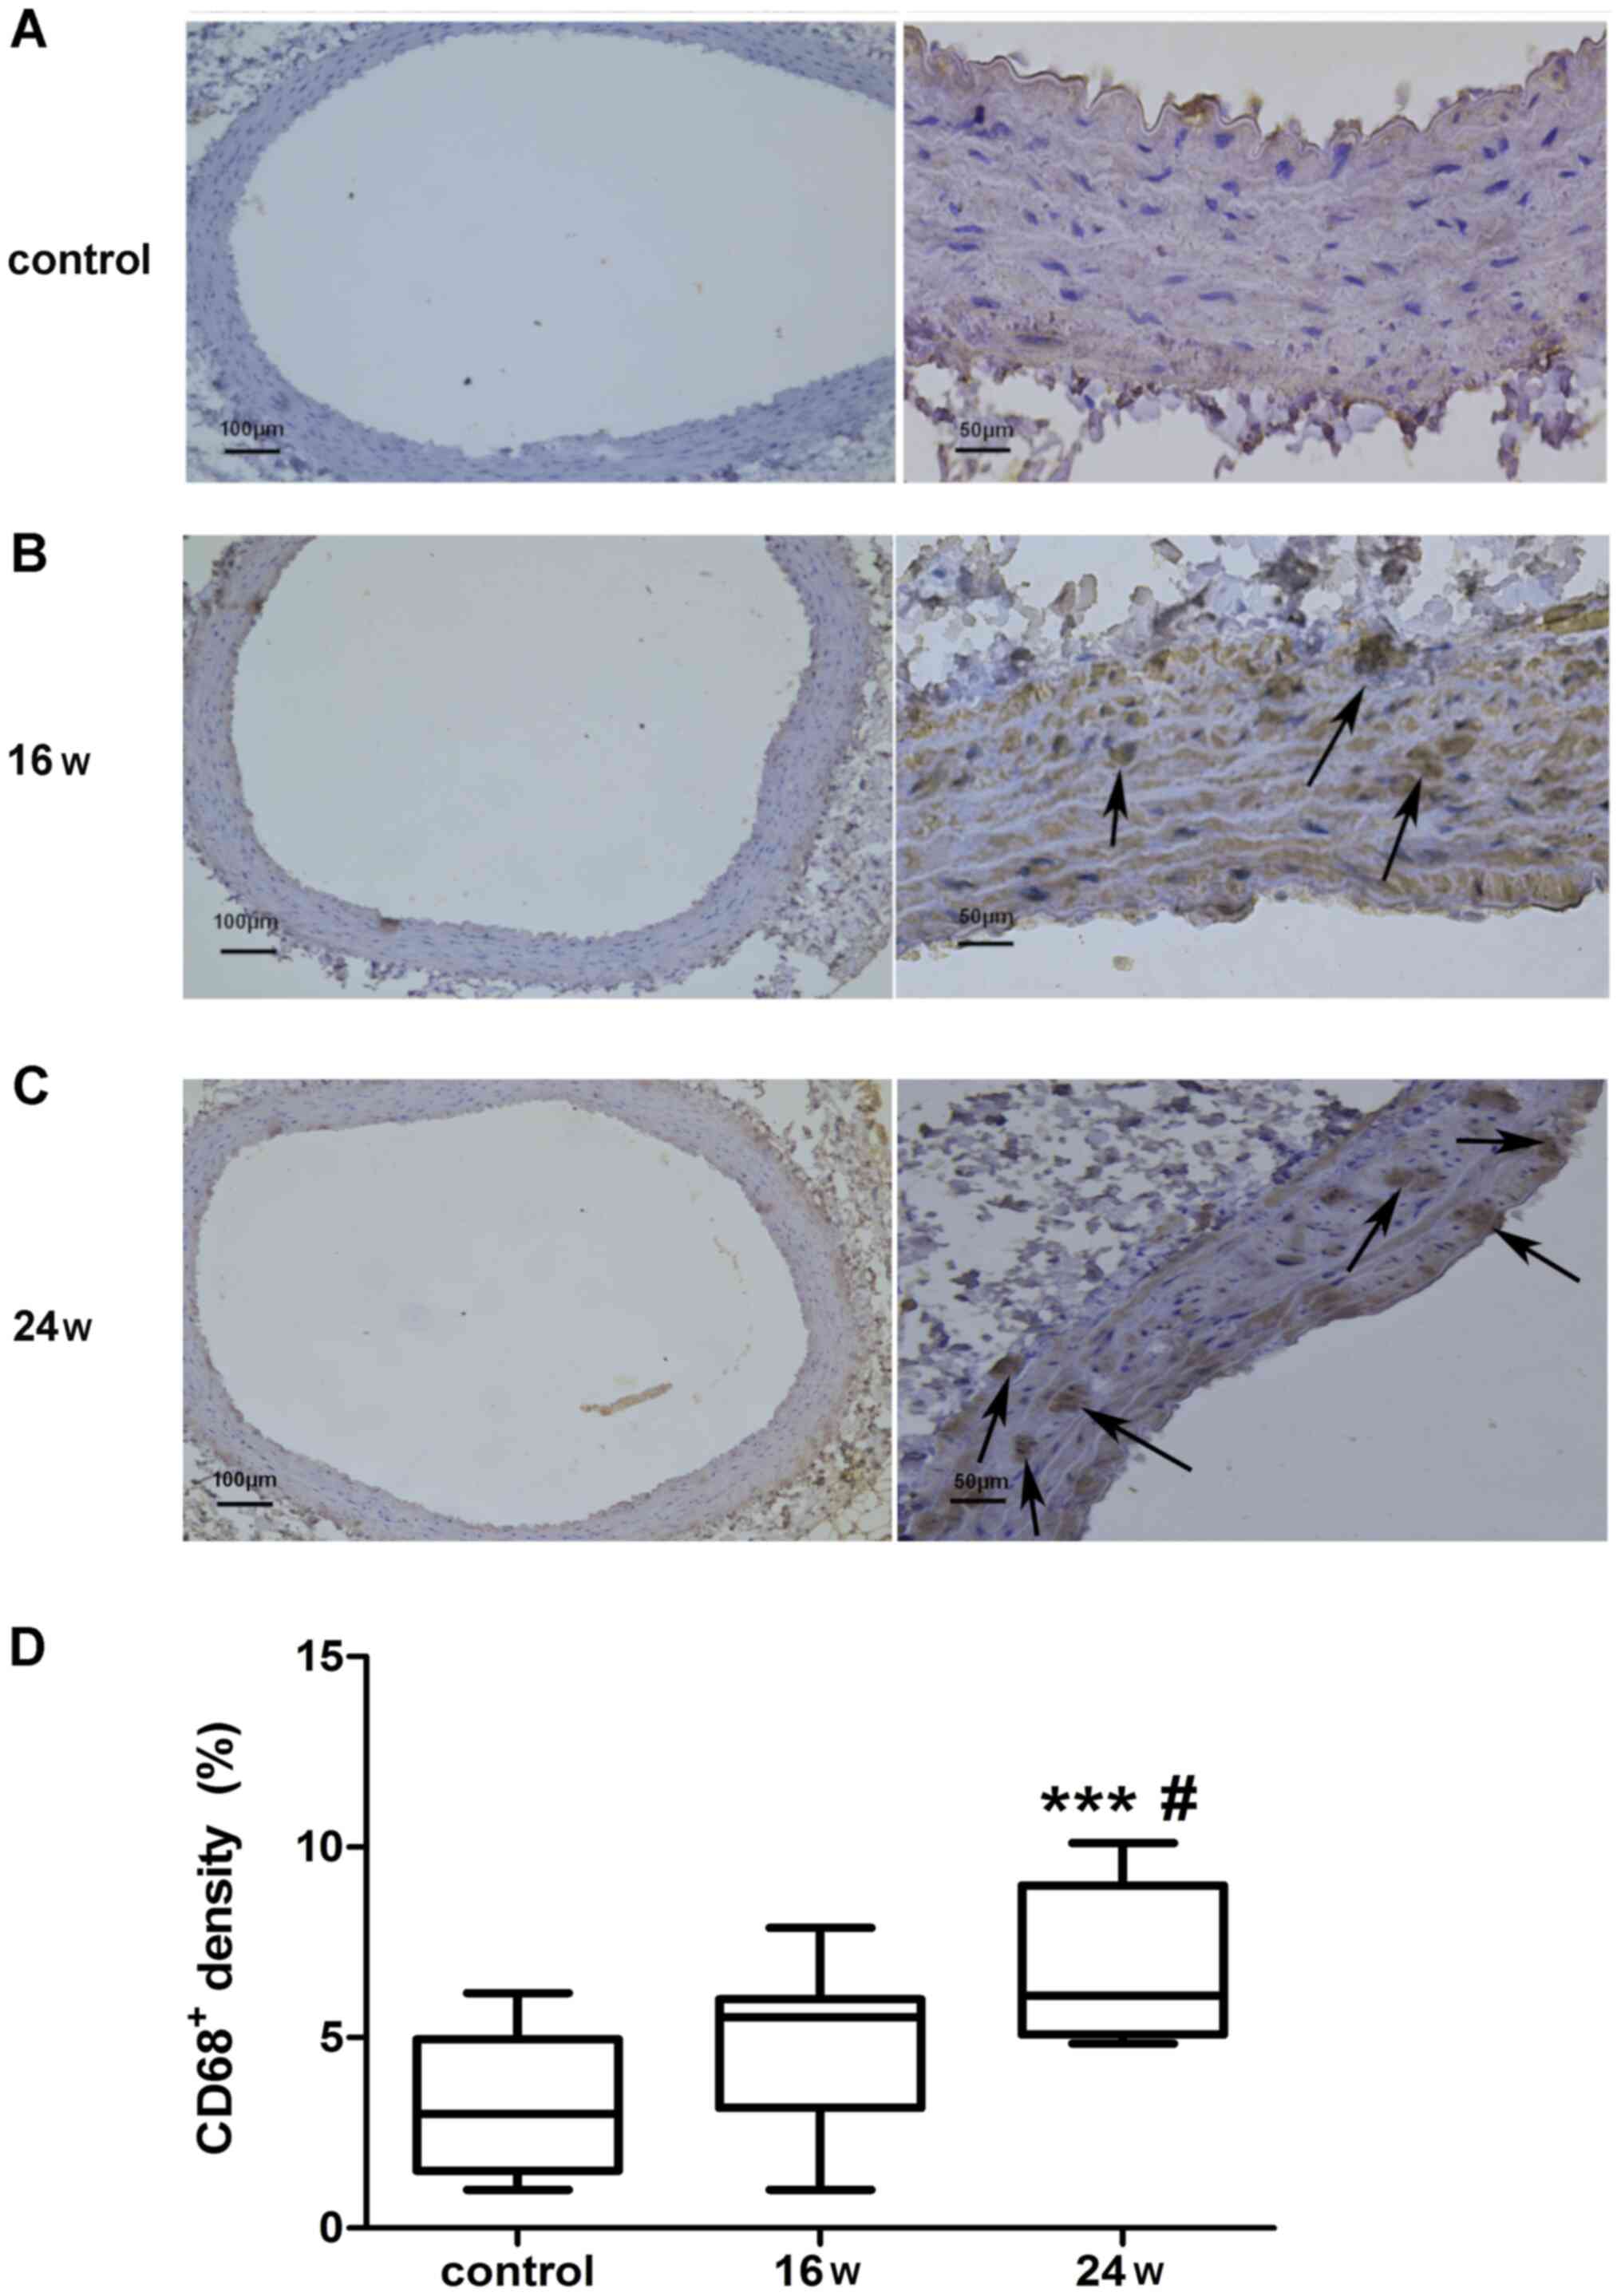
CD68-positive cells
The expression of CD68-positive macrophages was
detected in the abdominal aortic wall of rats (Fig. 3). Immunohistochemical staining of
CD68 in the abdominal aortic vascular wall was conducted on rats in
the normal diet group at 24 weeks, and on rats in the high-fat diet
group at 16 and 24 weeks (Fig.
3A-C). Brown cells indicated macrophages with positive CD68
expression and revealed the aggregation of CD68-positive
macrophages in the high-fat diet group (Fig. 3B and C). The staining intensity of CD68 was
statistically analyzed by one-way ANOVA and Tukey's post hoc test.
The percentage of CD68-positive cells in the total number of cells
per unit area in each group was 3.20±1.80% in the normal diet
group; 4.70±2.02% in the 16-week high-fat diet group; and
6.94±2.02% in the 24-week high-fat diet group. The percentage of
CD68-positive cells was significantly higher in the 24-week
high-fat diet group compared with in the 16-week high-fat diet
group (P<0.05; Fig. 3D). In
addition, the percentage of CD68-positive cells was significantly
higher in the 24-week high-fat diet group compared with in the
normal diet group at week 24 (P<0.001; Fig. 3D). The percentage of CD68-positive
cells was higher in the 16-week high-fat diet group compared with
that in the normal diet group at week 24; however, there was no
significant difference (P>0.05; Fig.
3D). These findings demonstrated that, with the increase in
feeding time, the percentage of CD68-positive cells was increased
in the aortic wall of rats on a high-fat diet, thus suggesting that
the density of macrophages in the vascular wall of the abdominal
aorta was increased with the increase in feeding time.
Discussion
Since the inflammatory hypothesis of atherosclerosis
was proposed in 1999(4), a growing
number of studies have shown that monocytes, macrophages and
vascular endothelial cells are involved in the inflammation of
atherosclerosis, and macrophages have been reported to serve a
critical role in the development and progression of atherosclerosis
(17,18). Kubota et al (19) detected a higher uptake of
18F-FDG in the cells around a tumor compared with in
viable tumor cells with high metabolic activity. A retrospective
review of the records of 85 patients with cancer undergoing
18F-FDG PET/CT demonstrated that 18F-FDG
uptake in the thoracic aortic wall may be correlated with the
metabolic activity of atherosclerotic changes (20). In addition, 18F-FDG
accumulation has been shown to be caused by macrophage uptake, and
it has been suggested that 18F-FDG imaging may be used
to provide a qualitative characterization of the inflammatory
features of atherosclerosis and to quantify the degree of
inflammation (10,21-24).
The present study detected significantly higher SUVs
of 18F-FDG in the iliac artery and abdominal aorta in
the high-fat diet group compared with those in the normal diet
group at 16 and 24 weeks, and a significantly greater SUV of
18F-FDG in the arteries in the high-fat diet group at 24
weeks than at 16 weeks. These data indicated a significant increase
in cellular metabolic activity in the vascular walls of the iliac
artery and the abdominal aorta in the high-fat diet group compared
with those in the normal diet group. Immunohistochemical staining
detected accumulation of CD68-positive macrophages in the rat
abdominal aortic wall in the high-fat diet group at 16 and 24
weeks; the 24-week high-fat diet groups exhibited significantly
higher percentages of CD68-positive cells compared with in the
normal diet group (P<0.001), and the percentage of CD68-positive
cells was significantly higher in the 24-week high-fat diet group
compared with that in the 16-week high-fat diet group (P<0.05).
These results are similar to those of previous studies, which
reported that 18F-FDG uptake was strongly associated
with macrophage density in atherosclerotic vessels (10,25-27).
However, rabbits or mice were used in previous studies, whereas
Wistar rats were used as an animal model in the present study
(10,25-27).
Because rats have no gallbladder, feeding them with
a high-fat diet does not easily induce a rise in cholesterol and
produce atherosclerotic lesions (28,29).
Therefore, atherosclerosis has been predominantly modeled in
rabbits and mice. However, in previous studies in rat models of
atherosclerosis, it has been reported that vitamin D + high-fat
diet may induce atherosclerotic plaques (29-32).
In the present study, inflammatory lesions of the arterial vessel
walls were induced with a high-fat and high-salt diet in Wistar
rats, and significantly higher body weight, abdominal circumference
and Lee's index were detected in the high-fat diet group compared
with those in the normal diet group at 8 weeks. In addition,
significantly greater SBP and DBP were detected in the high-fat
diet group than those in the normal diet group at 12 weeks, and
significantly higher INS levels were revealed in the high-fat diet
group than those in the normal diet group at 24 weeks, Conversely,
there was no significant difference in fasting blood glucose
between the two groups. In addition, rat blood pressure and body
weight exhibited a consistent tendency: Body weight was shown to
increase earlier than blood pressure, which was similar to previous
findings demonstrating that rats with obesity induced by diet alone
presented an increase in blood pressure after 12 weeks of feeding,
and that elevated blood pressure may be associated with high-salt
diet and obesity (33,34). Abdominal obesity has been accepted
as the primary cause of INS resistance (27,32,35-38).
In addition, in the present study, significantly higher TC levels
were measured at 8 and 24 weeks, and a significantly higher LDL-C
concentration was detected at 16 weeks in the high-fat diet group
compared with in the normal diet group. Although pathological
examinations did not detect typical atherosclerotic plaques, the
aforementioned results indicated that 18F-FDG uptake was
increased in the rat iliac artery and abdominal aortic wall in the
high-fat diet group compared with in the normal diet group, and
that the SUV of 18F-FDG was significantly higher in the
high-fat diet group at 24 weeks than at 16 weeks. Taken together,
these findings suggested that 18F-FDG uptake may be
associated with local macrophage accumulation, and the results of
immunohistochemistry revealed that the increase in macrophage
density was associated with the increase in 18F-FDG
uptake in arteries. These data are similar to previous studies
reporting an association between the number of macrophages and the
SUV of 18F-FDG in mice (27). These findings also confirmed the
successful modeling of inflammatory lesions of the arterial vessel
walls induced by a high-fat and high-salt diet in Wistar rats.
Currently, most available imaging techniques used
for the detection of atherosclerosis are based on the description
of morphological features of atherosclerotic plaques, and there
remains a lack of approaches for early diagnosis of
atherosclerosis. Notably, there is a lack of non-invasive
approaches that can be used for continuous monitoring of the range
and degree of vascular wall inflammation. As a technique involving
a combination of functional and structural imaging, PET/CT imaging
has shown great potential in the assessment and diagnosis of
atherosclerosis. 18F-FDG activity has been reported to
correlate with macrophage content within aortic atherosclerosis,
and 18F-FDG PET imaging may serve as a useful
non-invasive imaging technique for the detection of atherosclerotic
lesions (39). SUV is normally used
to assess disease activity during PET imaging, which may provide
quantitative information on the severity of vascular wall
inflammation for metabolic and structural imaging approaches. In
animal models of atherosclerosis (mice or rabbits) receiving
18F-FDG PET imaging, the metabolic activity of
18F-FDG was shown to increase in activated macrophages,
and a marked increase was detected in 18F-FDG uptake in
regions with macrophage activity (11). In addition, nanoparticle PET-CT
imaging of macrophages in inflammatory atherosclerosis further
revealed that the radionuclide activity of in vivo imaging
was strongly correlated with macrophages in atherosclerotic plaques
(11,40), and 18F-FDG uptake has
been reported to be proportional to the duration of cholesterol
feeding, and to peak with plaque disruption and thrombosis
(41).
In the current study, a Wistar rat model of vascular
wall inflammation induced by a high-fat and high-salt diet was
used. In this animal model, the arterial vessel walls were shown to
display inflammatory lesions. This can also be said to be the early
stage of atherosclerosis confirmed by the combination of
18F-FDG PET and immunohistochemistry. The relationship
between uptake of 18F-FDG and inflammation has been
demonstrated using histology linking 18F-FDG uptake with
the number of macrophages in arterial specimens (8,42,43).
It may be hypothesized that although rats have no gallbladder and
are resistant to atherosclerosis, their application prospects will
improve if they can be developed and studied as an animal model of
atherosclerosis. This is primarily because rats are low in cost,
easily accessible, easy to feed and exhibit similar physiological
anatomy to humans. In addition, compared with mice, rats are more
suitable for the interventional study of drugs and instruments for
endovascular angioplasty and stenting. Pahk et al (44) established a Sprague-Dawley rat model
using right carotid artery ligation plus atherosclerosis diet and
vitamin D injection. After 1 month, 18F-FDG PET/CT
indicated increased uptake of FDG in carotid atherosclerosis
arteries, and the uptake in the inner layer was higher compared
with that in the outer layer.
However, there are limitations in the present study:
i) The rat model of the early inflammatory stage of atherosclerosis
lacks evidence of inflammatory markers, such as leukocytes, high
sensitivity C-reactive protein, myeloperoxidase, LI-6, monocyte
chemoattractant protein-1, etc. ii) In addition, the results may be
more meaningful if ultrasound was used to measure the thickness of
the abdominal aorta and the feeding time was prolonged. Previous
studies have revealed that 18F-FDG PET/CT can
specifically display inflammatory activity. For example, both human
vascular tissue biopsy and animal studies have shown that
18F-FDG intake is in direct proportion to the number of
plaque macrophages (45), thus
18F-FDG imaging can be used to identify unstable
plaques. 18F-FDG PET/CT can also detect atrial/auricular
inflammation and is associated with stroke in patients with atrial
fibrillation (46-48).
Notably, 18F-FDG PET/CT has unique and important value
in the detection of a variety of types of cardiovascular
inflammation. The present study assessed the establishment of an
early inflammatory model of atherosclerosis in Wistar rats. The
results revealed that 18F-FDG PET might directly display
the metabolic activity of macrophage accumulation in local arterial
vessel walls in Wistar rats. These data demonstrated that
18F-FDG PET imaging may be considered a feasible method
to detect inflammatory lesions of the arterial vessel walls in
Wistar rats. It was therefore hypothesized that stable modeling of
atherosclerosis in Wistar rats by vitamin D treatment + intima
injury and extension of the feeding duration of the high-fat and
high-salt diet (29-32,44),
which may strengthen the characteristics of the Wistar rat
atherosclerosis model (arterial intima thickness, vascular wall
plaque formation and vascular lumen stenosis), followed by
18F-FDG PET imaging, may provide imaging data support
for the early identification, non-invasive assessment and dynamic
monitoring of atherosclerosis.
Acknowledgements
We would like to thank Dr Zhang Mengqian, physician
of Taihu Sanatorium of Jiangsu Province, for their help in the
preparation of the figures and Dr Xie Shengming of the
Rehabilitation Department, Jiangsu Provincial Research Center for
Health Assessment and Intervention, for their help in translation
and proofreading of the present manuscript.
Funding
Funding: The research leading to these results received funding
from the National Natural Science Foundation of China (grant no.
81600346), the Natural Science Foundation of Jiangsu Province,
China (grant nos. BK20151115 and BK2011162), the Medical Science
Key Subject of Jiangsu Province (grant no. ZDXKC2016011), the
R&D Fund of Wuxi Municipal Science & Technology Bureau,
China (grant no. CMB41S1701), and the Jiangsu Department of Health,
China (grant nos. Z201519 and H201639).
Availability of data and materials
The datasets used and/or analyzed during the current
study are available from the corresponding author on reasonable
request.
Authors' contributions
SS conceived and designed the study, drafted the
manuscript, interpreting data and revised important academic
contents; HL conceived and designed the study, drafted the
manuscript, analyzed physiological and biochemical data; SG drafted
the manuscript, interpreting data and revised important academic
content; HH performed PET detection and data collection; HZ
performed pathological examination and data collection; FL
performed physiological data recording and data collection; YF
collected the vascular specimens of rats and analyzed the PET and
pathological test data; LW performed feeding and physiological data
acquisition of rats; XW performed blood biochemical detection and
data collection; YL conceived and designed the study, interpreted
the data, modified important academic content and gave final
approval to the publication of this edition; ZS conceived and
designed the study, analyzed and interpreted data, modified
important academic content and gave final approval to the
publication of this edition. All authors read and approved the
final manuscript.
Ethics approval and consent to
participate
This study was approved by the Ethics Review
Committee of Jiangsu Lake Taihu Sanatorium (Permission number:
SGLERC-2011008; Wuxi, China) and Jiangsu Provincial People's
Hospital Group (Permission number: SRY20100820).
Patient consent for publication
Not applicable.
Competing interests
The authors declare that they have no competing
interests.
References
|
1
|
National Center for Cardiovascular
Disease: China. Report on Cardiovascular disease in China (2016).
Encyclopedia of China Publishing House, Beijing, 2017.
|
|
2
|
Roth GA, Johnson C, Abajobir A, Abd-Allah
F, Abera SF, Abyu G, Ahmed M, Aksut B, Alam T, Alam K, et al:
Global, regional and national burden of cardiovascular diseases for
10 causes, 1990 to 2015. J Am Coll Cardiol. 70:1–25.
2017.PubMed/NCBI View Article : Google Scholar
|
|
3
|
McKenney-Drake ML, Moghbel MC, Paydary K,
Alloosh M, Houshmand S, Moe S, Salavati A, Sturek JM, Territo PR,
Weaver C, et al: 18F-NaF and 18F-FDG as
molecular probes in the evaluation of atherosclerosis. Eur J Nucl
Med Mol Imaging. 45:2190–2200. 2018.PubMed/NCBI View Article : Google Scholar
|
|
4
|
Ross R: Atherosclerosis - an inflammatory
disease. N Engl J Med. 340:115–126. 1999.PubMed/NCBI View Article : Google Scholar
|
|
5
|
Fan LM: Rethinking the pathogenesis of
atherosclerosis. Chin J Arterioscler. 13:249–253. 2005.
|
|
6
|
Hosono M, de Boer OJ, van der Wal AC, van
der Loos CM, Teeling P, Piek JJ, Ueda M and Becker AE: Increased
expression of T cell activation markers (CD25, CD26, CD40L and
CD69) in atherectomy specimens of patients with unstable angina and
acute myocardial infarction. Atherosclerosis. 168:73–80.
2003.PubMed/NCBI View Article : Google Scholar
|
|
7
|
Chen W, Bural GG, Torigian DA, Rader DJ
and Alavi A: Emerging role of FDG-PET/CT in assessing
atherosclerosis in large arteries. Eur J Nucl Med Mol Imaging.
36:144–151. 2009.PubMed/NCBI View Article : Google Scholar
|
|
8
|
Wang ZJ, Deng G, Huang HB, Li AM, Ju SH,
Zhao R, Jin H and Wei XY: Noninvasive observation of
atherosclerosis in mice with 7.0T MR and Micro-PET. Chin J Med
Imaging Technol. 26:209–212. 2010.
|
|
9
|
Ogawa M, Ishino S, Mukai T, Asano D,
Teramoto N, Watabe H, Kudomi N, Shiomi M, Magata Y, Iida H, et al:
(18)F-FDG accumulation in atherosclerotic plaques:
Immunohistochemical and PET imaging study. J Nucl Med.
45:1245–1250. 2004.PubMed/NCBI
|
|
10
|
Tawakol A, Migrino RQ, Hoffmann U, Abbara
S, Houser S, Gewirtz H, Muller JE, Brady TJ and Fischman AJ:
Noninvasive in vivo measurement of vascular inflammation with F-18
fluorodeoxyglucose positron emission tomography. J Nucl Cardiol.
12:294–301. 2005.PubMed/NCBI View Article : Google Scholar
|
|
11
|
Feng TT and Zhao QM: Advances of PET/CT in
noninvasive assessing of atherosclerosis plaque. Chin J Med Imaging
Technol. 26:971–973. 2010.
|
|
12
|
Lau AZ, Miller JJ, Robson MD and Tyler DJ:
Cardiac perfusion imaging using hyperpolarized (13)C urea using
flow sensitizing gradients. Magn Reson Med. 75:1474–1483.
2016.PubMed/NCBI View Article : Google Scholar
|
|
13
|
Di Cesare Mannelli L, Micheli L, Carta F,
Cozzi A, Ghelardini C and Supuran CT: Carbonic anhydrase inhibition
for the management of cerebral ischemia: In vivo evaluation of
sulfonamide and coumarin inhibitors. J Enzyme Inhib Med Chem.
31:894–899. 2016.PubMed/NCBI View Article : Google Scholar
|
|
14
|
Pan L, Yang F, Lu C, Jia C, Wang Q and
Zeng K: Effects of sevoflurane on rats with ischemic brain injury
and the role of the TREK-1 channel. Exp Ther Med. 14:2937–2942.
2017.PubMed/NCBI View Article : Google Scholar
|
|
15
|
Li S, et al: Comparative study on
anesthetic role of chloral hydrate on rat. Drug Res. 23:22–23.
2014.
|
|
16
|
Wang JF: Guidelines for the Management and
Use of Laboratory Animals. Shanghai Science and Technology Press,
2012.
|
|
17
|
Tabas I and Bornfeldt KE: Macrophage
phenotype and function in different stages of atherosclerosis. Circ
Res. 118:653–667. 2016.PubMed/NCBI View Article : Google Scholar
|
|
18
|
Zhang Y, Zhang C and Zhang M: A new era of
anti-inflammatory therapy for atherosclerosis. Zhonghua Xin Xue
Guan Bing Za Zhi. 46:332–337. 2018.PubMed/NCBI View Article : Google Scholar : (In Chinese).
|
|
19
|
Kubota R, Yamada S, Kubota K, Ishiwata K,
Tamahashi N and Ido T: Intratumoral distribution of
fluorine-18-fluorodeoxyglucose in vivo: High accumulation in
macrophages and granulation tissues studied by
microautoradiography. J Nucl Med. 33:1972–1980. 1992.PubMed/NCBI
|
|
20
|
Tatsumi M, Cohade C, Nakamoto Y and Wahl
RL: Fluorodeoxyglucose uptake in the aortic wall at PET/CT:
Possible finding for active atherosclerosis. Radiology.
229:831–837. 2003.PubMed/NCBI View Article : Google Scholar
|
|
21
|
Cullen P, Baetta R, Bellosta S, Bernini F,
Chinetti G, Cignarella A, von Eckardstein A, Exley A, Goddard M,
Hofker M, et al: MAFAPS Consortium: Rupture of the atherosclerotic
plaque: Does a good animal model exist? Arterioscler Thromb Vasc
Biol. 23:535–542. 2003.PubMed/NCBI View Article : Google Scholar
|
|
22
|
Ogawa M, Magata Y, Kato T, Hatano K,
Ishino S, Mukai T, Shiomi M, Ito K and Saji H: Application of
18F-FDG PET for monitoring the therapeutic effect of
antiinflammatory drugs on stabilization of vulnerable
atherosclerotic plaques. J Nucl Med. 47:1845–1850. 2006.PubMed/NCBI
|
|
23
|
Matter CM, Wyss MT, Meier P, Späth N, von
Lukowicz T, Lohmann C, Weber B, Ramirez de Molina A, Lacal JC,
Ametamey SM, et al: 18F-choline images murine
atherosclerotic plaques ex vivo. Arterioscler Thromb Vasc Biol.
26:584–589. 2006.PubMed/NCBI View Article : Google Scholar
|
|
24
|
Zhao QM, Feng TT, Zhao X, Xu ZM, Liu Y, Li
DP, Li LQ, Su G and Zhang XX: Imaging of atherosclerotic aorta of
rabbit model by detection of plaque inflammation with fluorine-18
fluorodeoxyglucose positron emission tomography/computed
tomography. Chin Med J (Engl). 124:911–917. 2011.PubMed/NCBI
|
|
25
|
Knesaurek K, Machac J, Vallabhajosula S
and Buchsbaum MS: A new iterative reconstruction technique for
attenuation correction in high-resolution positron emission
tomography. Eur J Nucl Med. 23:656–661. 1996.PubMed/NCBI View Article : Google Scholar
|
|
26
|
Lederman RJ, Raylman RR, Fisher SJ, Kison
PV, San H, Nabel EG and Wahl RL: Detection of atherosclerosis using
a novel positron-sensitive probe and 18-fluorodeoxyglucose (FDG).
Nucl Med Commun. 22:747–753. 2001.PubMed/NCBI View Article : Google Scholar
|
|
27
|
Wang XN, et al: Application of
18F-FDG nuclide imaging of atherosclerotic plaques in
apolipoprotein E-deficient mice. J Chin PLA Postgrad Med Sch.
6:645–647. 2011.
|
|
28
|
Wang HR and Yu CJ: New progress in
mechanism and treatment of atherosclerosis. J Cap Med Univ.
31:828–833. 2010.
|
|
29
|
Zhang YL, et al: Method of establishment
of model of experimental atherosclerosis in rats. J Wenzhou Med
Coll. 37:331–333. 2007.
|
|
30
|
Xue YQ and Huang SA: A fast method of
establishment of atherosclerotic rat model. Med Innov Chin. 11:1–4.
2014.
|
|
31
|
Zhou H, Wu XY, Yuan YB and Qi XH:
Comparison of methods for establishing a rat model of
atherosderosis using three-doses of Vitamin D3 and atherogenic
diet. Chin J Arterioscler. 20:995–998. 2012.
|
|
32
|
Guo YS, et al: Comparison on the three
duplication methods of atherosclerosis model in rat. Chin J
Arterioscler. 11:465–469. 2003.
|
|
33
|
Hu H, Xu Y, Liu C, Zhao H, Zhang H and
Wang L: Changes in behavior and in brain glucose metabolism in rats
after nine weeks on a high fat diet: A randomized controlled trial.
Shanghai Arch Psychiatry. 26:129–137. 2014.PubMed/NCBI View Article : Google Scholar
|
|
34
|
Dobrian AD, Davies MJ, Prewitt RL and
Lauterio TJ: Development of hypertension in a rat model of
diet-induced obesity. Hypertension. 35:1009–1015. 2000.PubMed/NCBI View Article : Google Scholar
|
|
35
|
Hamman RF: Genetic and environmental
determinants of non-insulin-dependent diabetes mellitus (NIDDM).
Diabetes Metab Rev. 8:287–338. 1992.PubMed/NCBI View Article : Google Scholar
|
|
36
|
Tankó LB, Bagger YZ, Alexandersen P,
Larsen PJ and Christiansen C: Peripheral adiposity exhibits an
independent dominant antiatherogenic effect in elderly women.
Circulation. 107:1626–1631. 2003.PubMed/NCBI View Article : Google Scholar
|
|
37
|
Chen J: Dietary capsaicin prevents insulin
resistance in high fat diet-induced mice. Di 3 Jun Yi Da Xue Xue
Bao. 35:585–588. 2013.(In Chinese).
|
|
38
|
Alexander RW: President's address. Common
mechanisms of multiple diseases: Why vegetables and exercise are
good for you. Trans Am Clin Climatol Assoc. 121:1–20.
2010.PubMed/NCBI
|
|
39
|
Zhang Z, Machac J, Helft G, Worthley SG,
Tang C, Zaman AG, Rodriguez OJ, Buchsbaum MS, Fuster V and Badimon
JJ: Non-invasive imaging of atherosclerotic plaque macrophage in a
rabbit model with F-18 FDG PET: A histopathological correlation.
BMC Nucl Med. 6(3)2006.PubMed/NCBI View Article : Google Scholar
|
|
40
|
Nahrendorf M, Zhang H, Hembrador S,
Panizzi P, Sosnovik DE, Aikawa E, Libby P, Swirski FK and
Weissleder R: Nanoparticle PET-CT imaging of macrophages in
inflammatory atherosclerosis. Circulation. 117:379–387.
2008.PubMed/NCBI View Article : Google Scholar
|
|
41
|
Aziz K, Berger K, Claycombe K, Huang R,
Patel R and Abela GS: Noninvasive detection and localization of
vulnerable plaque and arterial thrombosis with computed tomography
angiography/positron emission tomography. Circulation. 2061–2070.
2008.PubMed/NCBI View Article : Google Scholar
|
|
42
|
Bucerius J, Dijkgraaf I, Mottaghy FM and
Schurgers LJ: Target identification for the diagnosis and
intervention of vulnerable atherosclerotic plaques beyond
18F-fluorodeoxyglucose positron emission tomography
imaging: Promising tracers on the horizon. Eur J Nucl Med Mol
Imaging. 46:251–265. 2019.PubMed/NCBI View Article : Google Scholar
|
|
43
|
Tawakol A, Migrino RQ, Bashian GG, Bedri
S, Vermylen D, Cury RC, Yates D, LaMuraglia GM, Furie K, Houser S,
et al: In vivo 18F-fluorodeoxyglucose positron emission
tomography imaging provides a noninvasive measure of carotid plaque
inflammation in patients. J Am Coll Cardiol. 48:1818–1824.
2006.PubMed/NCBI View Article : Google Scholar
|
|
44
|
Pahk K, Joung C, Jung SM, Young Song H,
Yong Park J, Woo Byun J, Lee YS, Chul Paeng J, Kim C, Kim S, et al:
Visualization of synthetic vascular smooth muscle cells in
atherosclerotic carotid rat arteries by F-18 FDG PET. Sci Rep.
7(6989)2017.PubMed/NCBI View Article : Google Scholar
|
|
45
|
Evans NR, Tarkin JM, Chowdhury MM,
Warburton EA and Rudd JH: PET imaging of atherosclerotic disease:
Advancing plaque assessment from anatomy to pathophysiology. Curr
Atheroscler Rep. 18(30)2016.PubMed/NCBI View Article : Google Scholar
|
|
46
|
Yang MF: Advancing the clinical
application of (18)F-fluorodeoxyglucose positron emission
tomography/computed tomography in cardiovascular inflammation.
Zhonghua Xin Xue Guan Bing Za Zhi. 48:181–185. 2020.PubMed/NCBI View Article : Google Scholar : (In Chinese).
|
|
47
|
Xie B, Chen BX, Wu JY, Liu X and Yang MF:
Factors relevant to atrial 18F-fluorodeoxyglucose uptake
in atrial Fibrillation. J Nucl Cardiol. 27:1501–1512. 2018.
|
|
48
|
Sinigaglia M, Mahida B, Piekarski E,
Chequer R, Mikail N, Benali K, Hyafil F, Le Guludec D and Rouzet F:
FDG atrial uptake is associated with an increased prevalence of
stroke in patients with atrial fibrillation. Eur J Nucl Med Mol
Imaging. 46:1268–1275. 2019.PubMed/NCBI View Article : Google Scholar
|