Introduction
Aristolochic acid (AA) is a major component of
several Chinese herbs that exhibits a wide range of pharmacological
effects, including anti-infective, anticancer and immunostimulatory
effects, and may be used for termination of pregnancy (1,2).
Clinical reports and experimental studies have demonstrated that AA
causes renal toxicity (3), acute
renal failure (ARF) (4) and
interstitial fibrosis (5). AA
nephropathy (AAN) has become a worldwide problem (6). Recently, the use of AA-containing
drugs was pronounced forbidden in the US, Canada, several countries
in Europe and even certain countries in Asia.
Pathological analysis demonstrated that the
infiltration of monocytes/macrophages and T lymphocytes was present
in the necrotic area of proximal renal tubules in a rat model of
AAN (7). However, the molecular
mechanisms underlying the nephrotoxicity of AA have remained to be
fully elucidated. Previous studies have reported that human renal
toxicity attributes to the mutagenicity and DNA adducts derived by
AA in the kidney and other tissue types (8). This suggests that AA-induced genetic
alterations may have an important role in renal toxicity induced by
AA. In addition, changes in mRNA expression are considered one of
the earliest events prior to the occurrence of clinical symptoms.
Microarray technology makes it possible to study genome-wide
expression profiles and determine the potential molecular
mechanisms of Chinese medicine with complex components. Previous
studies have aimed to determine more accurate and earlier toxicity
biomarkers for clinical and preclinical safety assessment using
genomics analysis (9,10). Thus, there remains an urgent
requirement to perform genomics analysis to identify accurate
biomarkers of AA-induced renal toxicity, which may contribute to
the clinical drug safety of AA.
Terminal differentiation cells, such as renal
tubular epithelial cells, are commonly used for nephrotoxic tests
in vitro. These cells are primary cells or established cell
lines; however, they cannot function as specialized organs or the
whole body during long-term cultivation. Embryonic stem cells
(ESCs) are pluripotent cells isolated from early embryos (11), which have highly undifferentiated
potential and are capable of differentiating into all kinds of body
tissues and organs, including liver, kidney, heart and nerves
(12). It has been reported that
ESCs are sensitive to drug stimulation and may thus serve as
important tools for in vitro assessment of drug toxicity
(13). The application of ESCs in
toxicology studies will help to overcome the disadvantages of time
consumption and low sensitivity of in vivo studies and also
overcome the disadvantages of using terminal cells that cannot
accurately represent the target organ.
The present study aimed to identify accurate
biomarkers of AA-induced renal toxicity on ESCs. Genomics analysis
was performed to screen for genes with changes in expression levels
in ESCs following treatment with AA in order to determine the
potential biological processes through which AA induces renal
toxicity.
Materials and methods
Animals
A total of 50 Kunming mice (age, 6 weeks; body
weight, 20±2 g), half of them were male and half female, were
obtained from Charles River Laboratory Animal Co., Ltd. The animals
were fed with normal feed and water ad libitum and kept at
25±2˚C with a humidity of 60%. Animals were acclimated for one week
and then female and male mice were housed in pairs within one cage
(14). On day 12.5 after pregnancy
was determined in the female mice through observing the presence of
vaginal suppositories, animals were anesthetized by intraperitoneal
injection of 10% chloral hydrate (300 mg/kg) and then sacrificed by
neck dislocation. The experimental protocol conformed to the
National Institutes of Health (NIH) Guide for the Care and Use of
Laboratory Animals.
Cell culture
Mouse embryonic fibroblasts (MEFs) were obtained
from the embryos of Kunming mice (15) at 12.5 days of gestation and
maintained in high-glucose DMEM (4.5 g glucose/l; Gibco; Thermo
Fisher Scientific, Inc.) supplemented with 10% FBS, 50 U/ml
penicillin and 50 mg/ml streptomycin and 1% non-essential amino
acids (Gibco; Thermo Fisher Scientific, Inc.). MEFs were treated
with 10 mg/l mitomycine for 2.5 h to attain feeder cells. The
murine (m)ESCs (CRL-11632™) were obtained from Shanghai Institutes
for Biological Sciences, Chinese Academy of Sciences and maintained
in DMEM (4.5 g glucose/l; Gibco; Thermo Fisher Scientific, Inc.)
supplemented with 15% FBS, 2 mM glutamine (Sigma Aldrich; Merck
KGaA), 50 U/ml penicillin, 50 mg/ml streptomycin (Sigma Aldrich;
Merck KGaA), 1% non-essential amino acids (Gibco; Thermo Fisher
Scientific, Inc.), 0.1 mm β-mercaptoethanol (Sigma Aldrich; Merck
KGaA) and leukemia inhibitory factor (1,000 U/ml; Gibco; Thermo
Fisher Scientific, Inc.) on MEF feeders to undifferentiate them at
37˚C in an atmosphere containing 5% CO2. The present
study was approved by the Animal Ethics Committee of Tianjin
University of Traditional Chinese Medicine (Tianjin, China).
MTT assay
An MTT assay was performed to determine the
cytotoxicity of AA. ESCs were seeded into 96-well plates at a
density of 1.5x10⁵/ml (0.1 ml) per well. Different
concentrations of AA (50.0, 25.0, 12.5, 10.0, 6.25, 5.0, 3.13 and
2.5 µg/ml; Tianjin Yifang Science & Technology Co., Ltd.) were
added to each well, followed by incubation at 37˚C in an atmosphere
with 5% CO2 for 48 h. The supernatant was discarded and
20 µl of MTT (0.5 mg/ml; Sigma-Aldrich Merck KGaA) was added to
each well, followed by incubation for 4 h at 37˚C in an atmosphere
with 5% CO2. The supernatant was discarded, the purple
formazan crystals that had formed were dissolved using DMSO (150
µl) and cytotoxicity was subsequently measured at a wavelength of
570 nm. The concentration that reduced the number of viable cells
by 10% (IC10) of AA was calculated using SPSS software
(version 11.5; SPSS, Inc.) and then AA was used at this
concentration in the following experiments. There were 3
independent replicates and 6 multiple wells per experiment.
Drug concentrations and treatment
regime for microarray
ESCs were seeded into 6-well plates at a density of
1.5x10⁵/ml (2 ml) per well and incubated at 37˚C in an
atmosphere with 5% CO2. Vitamin C (Vc) was used as a
non-toxic control (16). Cells were
subsequently treated with AA (IC10) or Vc (7.92 µg/ml)
and cultured for 48 h; these conditions were selected from the MTT
assay and other preliminary experiments (data not shown).
Microarray assay
RNA was extracted from cells following exposure to
AA or Vc for 48 h. In brief, following drug treatment, cells were
collected and extracted using TRIzol® reagent
(Invitrogen; Thermo Fisher Scientific, Inc.) at -80˚C. Total RNA
was purified using the RNeasy® Mini kit (Qiagen China
Co., Ltd.), with the additional DNase treatment (RNase-Free DNase
Set; Qiagen China Co., Ltd.), according to the manufacturer's
protocols. Total RNA was quantified using the NanoDrop 1000
spectrophotometer (NanoDrop Technologies; Thermo Fisher Scientific,
Inc.), by determining the optical density at 260 nm
(OD260)/OD280 ratio. Total RNA was
subsequently purified using the Qiagen RNeasy total RNA cleanup kit
(Qiagen China Co., Ltd.) and the concentration was measured using a
NanoDrop 1000.
The microarray experiment was performed using the
GeneChip® 3IVT Express kit (Affymetrix; Thermo Fisher
Scientific, Inc.), according to the manufacturer's protocol. For
the microarray data analysis, 6 samples in total (including 3
control and 3 AA-treated samples) were included. For each sample,
100 ng of purified RNA was reverse transcribed using T7-(dT) 24
primers containing a T7 RNA polymerase promoter to generate
first-strand complementary (c)DNA, which was subsequently converted
into a double-stranded cDNA template. The DNA template was used to
transcribe cRNA and incorporate a biotin-conjugated nucleotide. A
total of 10 µg of cRNA from each sample was hybridized with the
mouse MG 430 2.0 GeneChips (Affymetrix; Thermo Fisher Scientific,
Inc.) for 16 h at 45˚C, with constant rotation at 3.5 x g.
Following hybridization, the microarray was washed and stained in
an automated fluidics station (Affymetrix GeneChip Hybridization
Wash and Stain kit; Affymetrix; Thermo Fisher Scientific, Inc.).
Quality controls were assessed, which were demonstrated to be
within acceptable limits for all arrays. Signals were quantified by
detection of bound phycoerythrin using an Affymetrix GeneChip
Scanner 3000 (Affymetrix; Thermo Fisher Scientific, Inc.) to
generate CEL data. The CEL data were then subjected to analysis
using DNA-Chip (dChip) software (version 2010; http://www.dchip.net/) (17) and array hybridization signal levels
were normalized using the invariant set normalization method, which
is part of the dChip software.
Microarray data analysis
Microarray data were assessed and normalized to
exclude background signals and analyzed using the dChip (version
2010; http://www.dchip.net/) (17) with a model-based computation. All
arrays were normalized to a common baseline array and the
expression levels of each gene in all samples were computed using
the perfect match-mismatch differences for all probes in a probe
set. A combined analysis was performed to identify the genes that
exhibited different expression patterns between the experimental
group and control group. For the extracted genes, hierarchical
clustering was performed to visualize the changes in gene
expression between the Vc- and AA-treated groups. Enrichment
analysis of the differentially expressed genes was performed
manually using relevant bioinformatics databases including Gene
Ontology (GO; http://www.geneontology.org), GenBank (National Center
for Biotechnology Information; http://www.ncbi.nlm.nih.gov/), LocusLink (http://www.ncbi.nlm.nih.gov/LocusLink),
PubMed and Kyoto Encyclopedia of Genes and Genomes (KEGG;
http://www.genome.ad.jp). The protein-protein
interaction network was constructed using Cytoscape 3.2 software
(www.genomeweb.com), which incorporates the hub
genes and GO/KEGG terms. Enrichment of GO/KEGG terms by
differentially expressed genes (DEGs) was assessed using the SciPy
module in Python by computing a unilateral Fisher exact P≤0.05.
Reverse transcription-quantitative
(RT-q) PCR
Microarray data for a selection of genes were
confirmed via RT-qPCR analysis. Total RNA (0.8 µg) was extracted as
aforementioned and reverse-transcribed into complementary DNA using
the PrimeScript RT reagent kit (Takara Bio, Inc.) according to the
manufacturer's protocol at 37˚C for 15 min and 85˚C for 5 sec. qPCR
was subsequently performed using SYBR® Green PCR Master
Mix (Applied Biosystems; Thermo Fisher Scientific, Inc.) following
the manufacturer's protocol. The following thermocycling conditions
were used: 1 cycle at 50˚C for 2 min and 95˚C for 10 min, followed
by 40 cycles at 95˚C for 10 sec and 60˚C for 30 sec; a final
elongation cycle at 95˚C for 15 sec, 72˚C for 30 sec and 95˚C for
15 sec, using the ABI7300 Real-Time PCR System (Applied Biosystems;
Thermo Fisher Scientific, Inc.) according to the manufacturer's
protocol. Relative expression levels were quantified using the
2-ΔΔCq method (18) and
normalized to the internal reference gene β-actin. PCR
amplifications were performed in triplicate. RNA quality was
confirmed by denaturing agarose gel electrophoresis, which produced
two sharp and distinct bands at 18S and 28S and
OD260/OD280 ratios were at a range of
1.9-2.1. The primer sequences were listed in Table SI.
If the expression level in the AA group divided by
that in a control was >1, the gene was considered to be
upregulated. Furthermore, the upward trend of the results of the
chip means that the gene is upregulated. Therefore, the results of
genes were all upregulated, indicating that the results of the qPCR
and chip (upward trend) were consistent. The expression level of
gene was <1 (not <0), which is consistent with the chip
result (downward trend).
Statistical analysis
SPSS 11.5 software (SPSS, Inc.) was used to
determine the inhibitory concentration of AA and ‘Probit analysis’
in SPSS software was used to determine the IC10 value.
Statistical analysis was performed by filtering out the genes with
absent calls and genes with significantly different expression
levels were identified using the following formula: E/B >2 or
B/E >2, where E is the expression value in the experimental
group and B is the expression value in the control group. One-way
analysis of variance with Tukey's post-hoc test was performed for
comparisons among groups in Fig. 1.
P<0.05 was considered to indicate a statistically significant
difference.
Results
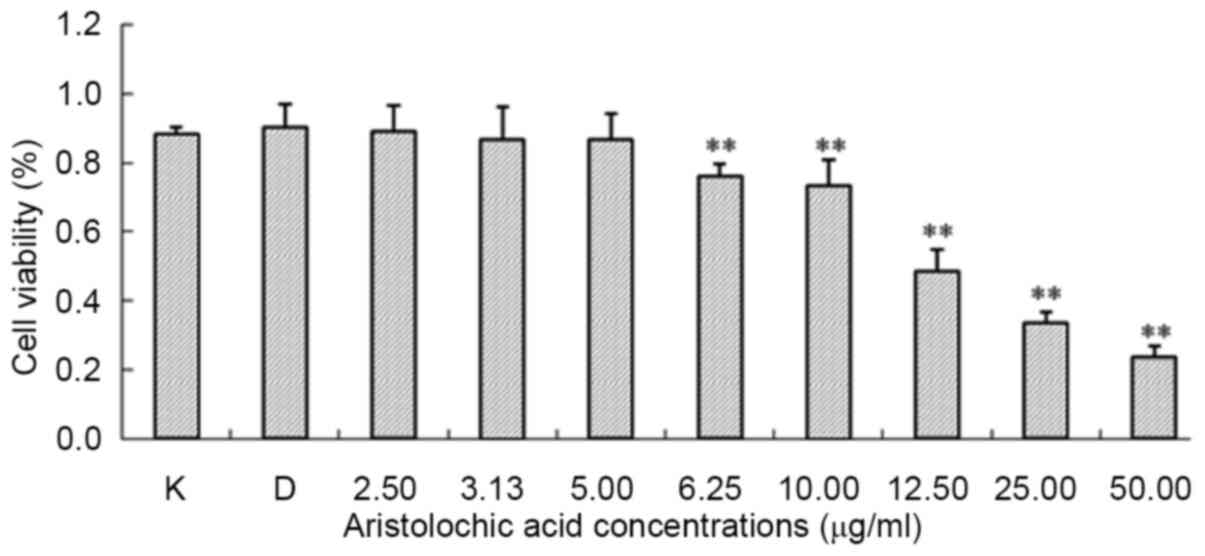
Cytotoxicity of AA on mESCs
The cytotoxicity of AA in ESCs was assessed via the
MTT assay. The results demonstrated that the viability of ESCs
decreased in a concentration-dependent manner following treatment
with AA for 48 h. Fig. 1 presents
the effect of different concentrations of AA on the proliferation
of ESCs. The IC10 was selected for the microarray
experiments and for validation of microarray data via RT-qPCR
analysis. The results demonstrated that ESCs were more susceptible
to AA compared with non-stem cells (such as renal tubular
epithelial cells) and the IC10 (5.20 µg/ml) was selected
for the subsequent experiments.
Changes in the gene expression profile
of ESCs following treatment with AA
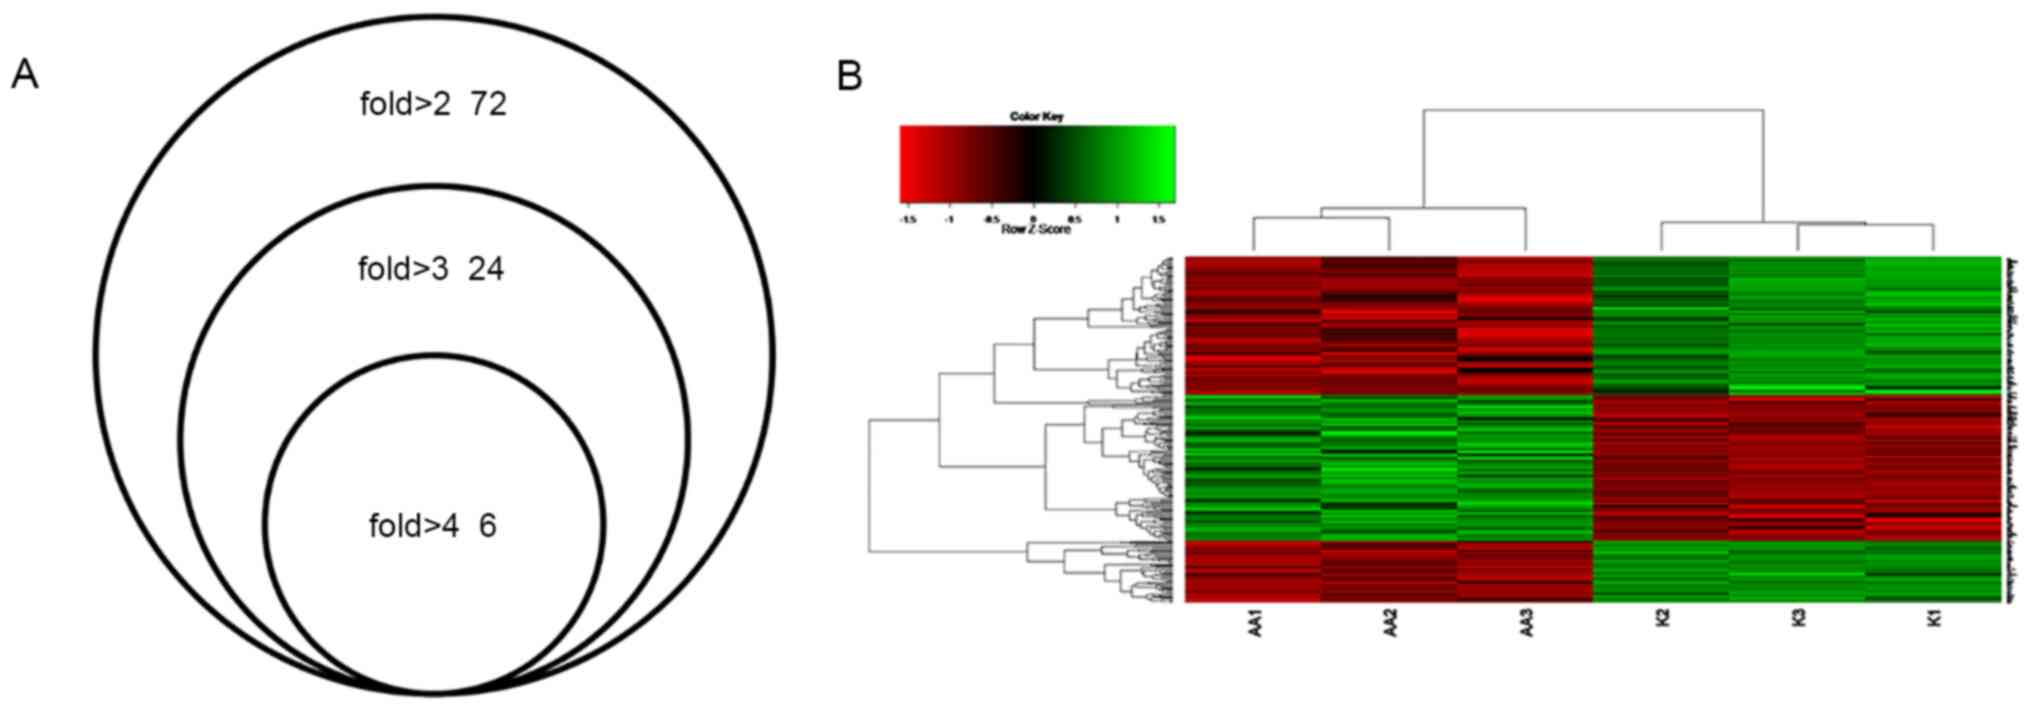
Compared with the expression levels in the control
group, 72 DEGs were dysregulated (49 upregulated and 23
downregulated genes) by >2 fold (Table SII), 23 DEGs were dysregulated (15
upregulated and 8 downregulated genes) by >3 fold and five DEGs
were dysregulated (4 upregulated and 1 downregulated gene) by >4
fold in the AA group (Fig. 2A).
Among these genes, the expression of calcium binding and
coiled-coil domain 2 was upregulated by 6-fold compared with that
in the control group and serine incorporator 3 was upregulated by
4.68-fold. Tumor protein 53 apoptosis effector (Perp) was
upregulated by 4.38-fold, while suprabasin was upregulated by
4-fold, and cation transport regulator-like 1 (E. coli)
(Chac1) was downregulated by 4.17-fold.
Clustering analysis
Clustering analysis was performed to classify
different data groups into clusters according to distance
measurement (the length of the line segment). The results
demonstrated that the trend of gene expression within the
drug-treated group was consistent and that the gene expression
within the control group also presented a consistent trend, which
may be divided into the AA group or the control group (Fig. 2B). The results indicated that
differential gene expression grouping of microarray data was in
agreement with the experimental groups.
Bioinformatics analysis
The functional terms in the GO category biological
process enriched by the DEGs are presented in Table SIII. DEGs that were changed by
>2 fold in the AA vs. control group were selected for analysis.
The downregulated DEGs were indicated to have roles in ‘metabolic
process’, ‘gluconeogenesis’, ‘cytolysis’, ‘defense response to
Gram-negative bacterium’, ‘positive regulation of cell-substrate
adhesion’, ‘defense response to gram-positive bacterium’,
‘forebrain development’, ‘steroid metabolic process’, ‘cholesterol
metabolic process’, ‘neuron migration’ and ‘negative regulation of
mesenchymal cell proliferation’ as the top 10 biological process
terms. The upregulated DEGs were enriched in the following:
‘Positive regulation of intracellular signal transduction’,
‘negative regulation of cysteine-type endopeptidase activity
involved in apoptotic process’, ‘positive regulation of heart
rate’, ‘positive regulation of focal adhesion assembly’,
‘gluconeogenesis’, ‘positive regulation of smooth muscle
contraction’, ‘positive regulation of sodium ion transport’,
‘intrinsic apoptotic signaling pathway by p53 class mediator’,
‘transmembrane transport’ and ‘lung development’. Furthermore, GO
terms in the categories cellular component and molecular function
were determined to further estimate gene functions (Table SIV). The results demonstrated that
in the category cellular component, the most enriched terms were
‘extracellular region’, ‘rough endoplasmic reticulum lumen’,
‘extracellular exosome’, ‘golgi cis cisterna’, ‘mitochondrion’,
‘microvillus’, ‘trans-golgi network transport vesicle’,
‘extracellular space’, ‘costamere’ and ‘cell surface’. The
molecular function terms included ‘catalytic activity’, ‘lysozyme
activity’, ‘AMP binding’, ‘aldehyde dehydrogenase activity’,
‘GO:0016620’, ‘structural constituent of eye lens’, ‘calcium ion
binding’, ‘growth factor binding’, ‘ATPase activity’, ‘coupled to
transmembrane movement of substances’ and ‘heparin binding’.
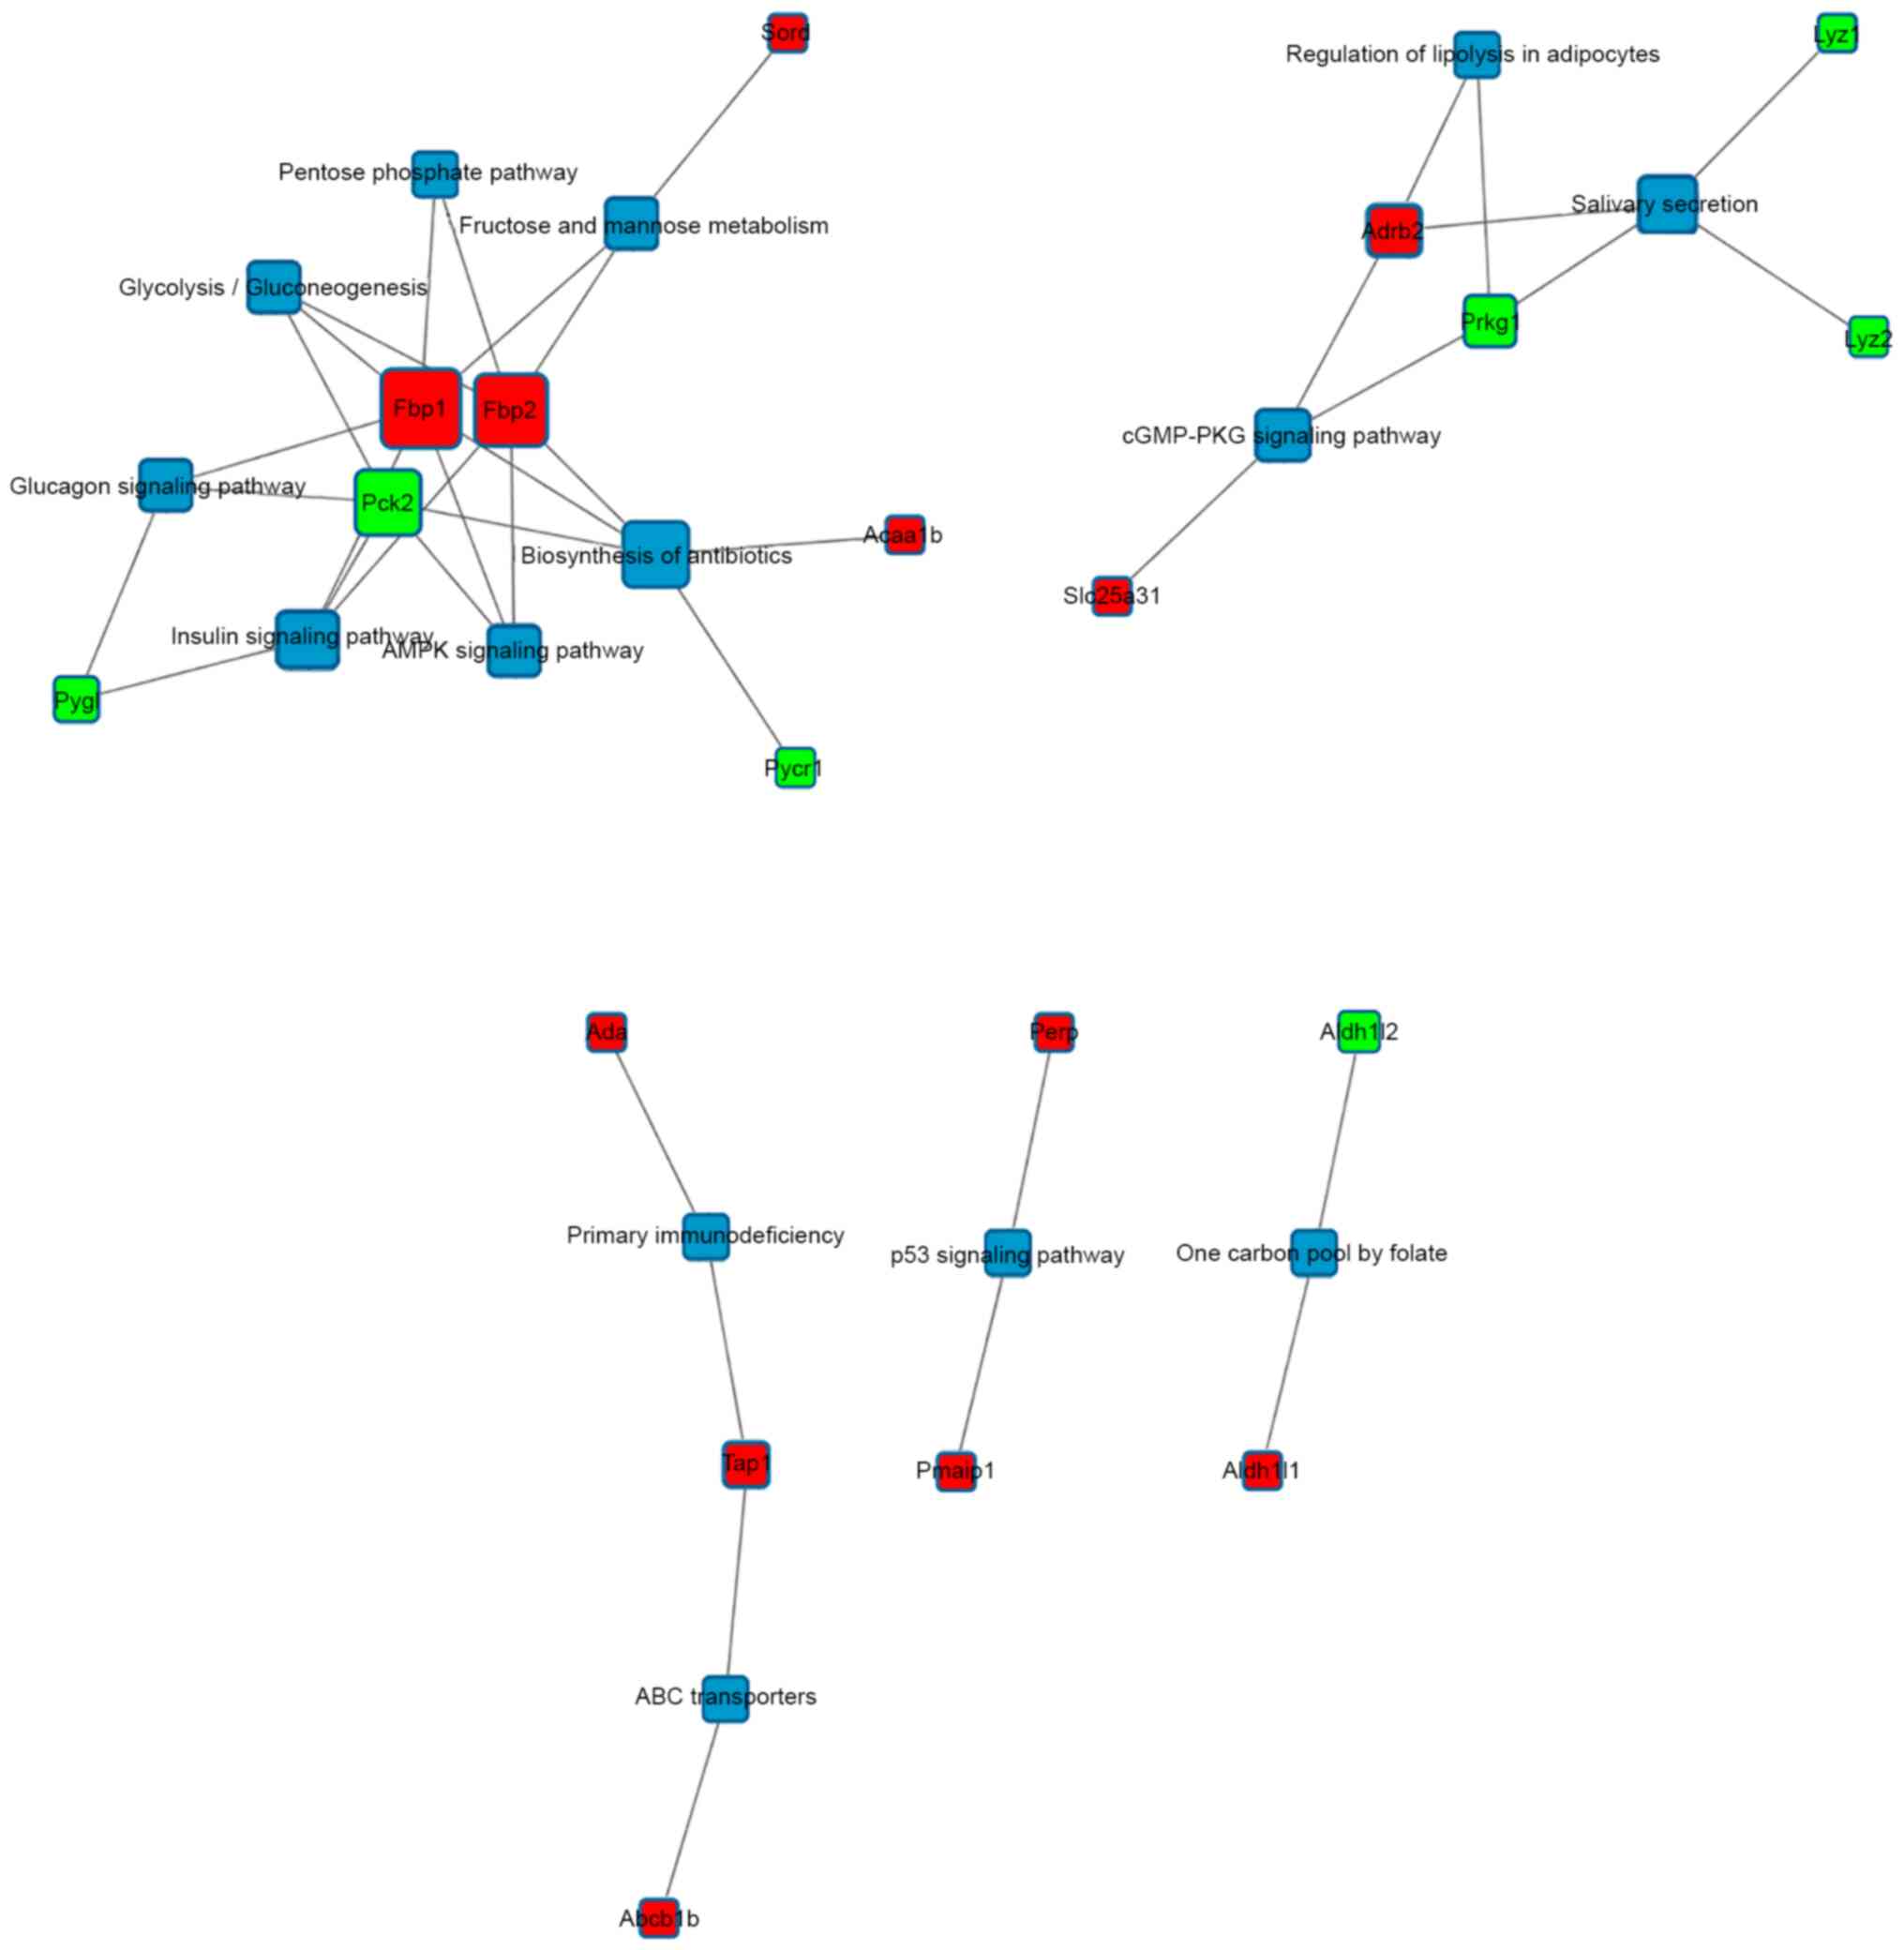
The results of the KEGG analysis demonstrated that
these genes participated in 92 different pathways. The pathways
involved and changes in the number of gene accumulated in the KEGG
pathways after treatment with AA are presented in Table SV. Pathway analysis demonstrated
that ‘salivary secretion’, ‘fructose and mannose metabolism’,
‘biosynthesis of antibiotics glycolysis/gluconeogenesis’, the
‘insulin signaling pathway’, the ‘AMP-activated protein kinase
(AMPK) signaling pathway’ and the ‘p53 signaling pathway’ were
involved in early AA-induced toxicity.
Protein-protein interaction network analysis
demonstrated that fructose-1, 6-bisphosphatase (Fbp)1 and Fbp2 were
two important hub genes (Fig. 3).
In addition, Ada, Tap1 and Abcb1b were indicated to participate in
primary immunodeficiency, while Perp and Pmaip1 have vital roles in
the p53 signaling pathway.
Validation of microarray data via
RT-qPCR analysis
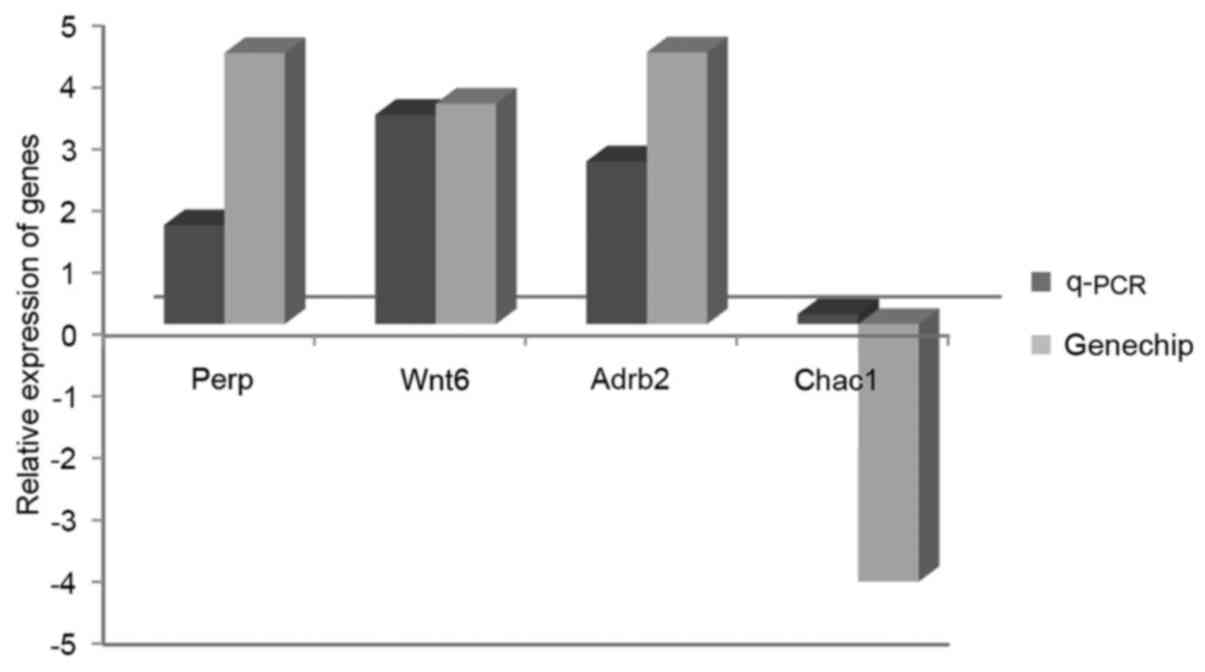
RT-qPCR analysis was performed to validate the
microarray data. A total of four genes from the aforementioned
experiments were selected [Perp, Chac1, adrenoceptor β2 (Adrb2) and
Wnt6]. The results demonstrated consistency between the microarray
data and the RT-qPCR data (Fig. 4),
indicating good reliability and reproducibility of the microarray
data in the present study.
Discussion
Akebia quinata is a traditional Chinese
medicinal plant that is commonly used for treating different types
of diseases. Recently, one of its components, AA, has raised
concerns. In the 1990s, several patients who consumed medicines
containing AA exhibited different degrees of anemia, mild tubular
proteinuria, extensive hypocellular interstitial fibrosis, tubular
atrophy and even ARF. These AA-induced disorders were named AAN.
The effects of AA-induced toxicity have been studied in several
different animal models (19).
Although conventional animal tests are able to demonstrate the
toxic effects of drugs on the whole animal, most of the indexes are
descriptive, lack high sensitivity and specificity, and seldom
indicate the molecular mechanisms associated with toxicity.
Although it is well-known that AA causes renal damage (20), the molecular mechanisms of
AA-induced toxicity still remain elusive. Thus, the renal toxicity
of AA requires further investigation to prevent renal damage and
appropriately use this Chinese herbal medicine.
Clinical studies have indicated that AA-induced
genotoxicity is a primary cause of renal tubule epithelial cell
apoptosis and damage. As a tumor suppressor gene, p53 is able to
regulate various cellular functions, including the cell cycle, DNA
repair and apoptosis. Perp is a proapoptotic target of p53. It has
been reported that p53-dependent overexpression of Perp in proximal
tubular epithelium induces ischemia/reperfusion injury (21). Another study suggested that Perp may
induce mitochondrial permeability to exacerbate injury in
vitro (22). Lord et al
(23) demonstrated that in AAN,
adducts with DNA formed by AA lead to excessive tubular epithelial
cell apoptosis via the p53-mediated signaling pathway. In the
present study, Perp was significantly upregulated. In addition, the
target genes of p53, DNA-damage-inducible transcript 4-like and
transformed mouse 3T3 cell double minute, were both elevated,
indicating that DNA damage and apoptosis were induced by AA and the
toxic effects may be caused by activation of the p53 signaling
pathway.
Fbp, a key gluconeogenic enzyme, was demonstrated to
be directly suppressed by 5-aminoimidazole-4-carboxamide
ribonucleoside, which is a compound for AMPK activation (24). Shi et al (25) demonstrated that Fbp1 regulates cell
proliferation and glycolysis through a hypoxia-inducible factor
1α-dependent hypoxic response in breast cancer cells. In clinical
practice, pediatric patients with idiopathic nephrotic syndrome
(INS) have significantly higher Fbp1 activity and protein
concentrations in urine compared with healthy children, suggesting
that Fbp1 activity in urine may be considered an indicator of
damage to renal proximal tubules in pediatric patients with INS
(26,27). In the present study, elevated Fbp1
and Fbp2 levels were observed and pathway analysis demonstrated
that Fbp1 and Fbp2 participated in certain metabolic pathways,
including fructose and mannose metabolism,
glycolysis/gluconeogenesis, biosynthesis of antibiotics and the
AMPK signaling pathway.
To confirm the results of the microarray analysis,
RT-qPCR was performed on four DEGs and the results obtained with
the two methods regarding the changes in gene expression were
compared. Gene chip is an effective tool for drug toxicity studies,
and in the present study, it was used to assess the molecular
mechanisms of the nephrotoxicity of AA on ESCs in vitro. The
results of the present study require further analysis and
validation at the genomic and proteomic levels. With the
application of novel gene chip technology, the toxicity of drugs
may be assessed in a more comprehensive and objective way. The
present study also provides valuable information when screening for
nephrotoxicity-associated genes to establish and improve the
database of nephrotoxicity gene expression profiles of traditional
Chinese medicines.
Genomics technology may be used to observe the
damage caused by drugs in the early stage of disease or prior to
changes of clinical biochemical indexes and histopathology
(28). In the present study, a
genomics analysis was used to evaluate the toxicology of ESCs. The
GO functional enrichment analysis in the category of biological
process of drug effects on ESCs was investigated after AA treatment
at the concentration of IC10. The changes of gene
expression in ESCs were investigated and nephrotoxicity markers
were identified based on ESC genomics. These results may be used to
evaluate the toxicity of traditional Chinese medicine drugs and
provide a rapid, sensitive and reliable toxicity marker for the
evaluation of nephrotoxicity of traditional Chinese medicines in
the future. In the present study, AA was used at its
IC10 concentration, which is more in line with the
normal condition than the IC50. General toxicology
experiments use IC50 or higher concentration, which is
not conducive to the detection of toxic markers. As embryonic stem
cells are particularly sensitive, the present study used the
IC10, to detect toxicity changes in the early stage
after AA administration (29).
Thus, the IC10 is more conducive to the evaluation of
early toxicity changes, and the IC10 was selected in the
present study.
Wnt6 is considered a key gene in the development of
renal tubules (30). In the present
study, ESCs were used and it was attempted to investigate whether
AA may have nephrotoxicity. Therefore, Wnt6 is important in
AA-induced early nephrotoxicity. For Chac1, it was reported that
human Chac1 protein degrades glutathione and mRNA induction is
regulated by the transcription factors activating transcription
factor (ATF) 4 and ATF3 and a bipartite ATF/cAMP response element
regulatory element (31),
indicating that Chac1 is an important gene in the ATF4-ATF3 axis.
In addition, ATF3 was able to attenuate cyclosporin A-induced
nephrotoxicity by downregulating C/EBP homologous protein in HK-2
cells (32). Therefore, Chac1 may
also be important in nephrotoxicity.
The limitation of the present study is that
assessment was only performed via bioinformatics analysis. Thus, in
prospective studies, it will be endeavored to perform biological
experiments in vivo. In addition, although AA-induced DNA
damage and apoptosis were determined in the present study, it
remains elusive whether the toxic effect of AA on mESCs is exerted
through the generation of AA-DNA adducts and activating the p53
pathway, which requires further investigation. Furthermore,
validation experiments could not be performed. Thus, validation
experiments for Fbp1 and Fbp2 in early AA toxicity are also
required to be performed in future experiments.
In conclusion, the results of the present study
demonstrated that Fbp1 and -2 are two important hub genes, and Perp
and Pmaip1 have vital roles in the p53 signaling pathway as part of
the mechanisms of the nephrotoxicity of AA. Taken together, the
results of the present study provide potential biomarkers for the
early toxicity of AA.
Supplementary Material
The primer sequences for PCR
amplifications.
Expression (fold change) of
differentially expressed genes associated with aristolochic
acid-induced early toxicity determined by microarray analysis.
Gene Ontology terms enriched by the
DEGs associated with aristolochic acid-induced early toxicity in
the category biological process.
Gene Ontology terms enriched by the
differentially expressed genes associated with aristolochic
acid-induced early toxicity in the categories cellular component
and molecular function.
Pathways enriched by the
differentially expressed genes associated with aristolochic
acid-induced early toxicity.
Acknowledgements
Not applicable.
Funding
This study was funded by the National Basic Research Program of
China (grant no. 2011CB505302) and Tianjin Health and Family
Planning Commission Chinese Medicine, Integrative Medicine Research
Special Project (grant no. 2017073).
Availability of data and materials
The datasets used and/or analyzed during the current
study are available in the National Center for Biotechnology
Information Gene Expression Omnibus, (GEO; http://www.ncbi.nlm.nih.gov/geo/; accession no.
GSE162195).
Authors' contributions
LW, SSM and YHB wrote the initial draft; LW and SSM
performed the data analysis; LW and YHB conceived and designed the
study. All authors have seen the final draft and agreed to the
contents. LW and SSM checked and approved the authenticity of the
raw data.
Ethics approval and consent to
participate
This study was approved by the (animal) ethics
committee of Tianjin University of Traditional Chinese Medicine
(Tianjin, China).
Patient consent for publication
Not applicable.
Competing interests
The authors declare that they have no competing
interests.
References
|
1
|
Yun KY, Xu ZU and Song JY: Traditional
Chinese medicine containing aristolochic acids and their detection.
Sci Sin Vitae. 49:238–249. 2019.
|
|
2
|
Kuo PC, Li YC and Wu TS: Chemical
constituents and pharmacology of the aristolochia (mădōu ling)
species. J Tradit Complement Med. 2:249–266. 2012.PubMed/NCBI View Article : Google Scholar
|
|
3
|
Li J and Zhang L, Jiang Z, Shu B, Li F,
Bao Q and Zhang L: Toxicities of aristolochic acid I and
aristololactam I in cultured renal epithelial cells. Toxicol In
Vitro. 24:1092–1097. 2010.PubMed/NCBI View Article : Google Scholar
|
|
4
|
Honarpisheh M, Foresto-Neto O, Steiger S,
Kraft F, Koehler P, von Rauchhaupt E, Potempa J, Adamowicz K,
Koziel J and Lech M: Aristolochic acid I determine the phenotype
and activation of macrophages in acute and chronic kidney disease.
Sci Rep. 8(12169)2018.PubMed/NCBI View Article : Google Scholar
|
|
5
|
Yang L, Li X and Wang H: Possible
mechanisms explaining the tendency towards interstitial fibrosis in
aristolochic acid-induced acute tubular necrosis. Nephrol Dial
Transplant. 22:445–456. 2007.PubMed/NCBI View Article : Google Scholar
|
|
6
|
Debelle FD, Vanherweghem JL and Nortier
JL: Aristolochic acid nephropathy: A worldwide problem. Kidney Int.
74:158–169. 2008.PubMed/NCBI View Article : Google Scholar
|
|
7
|
Chen D, Tang Z, Luo C, Chen H and Liu Z:
Clinical and pathological spectrums of aristolochic acid
nephropathy. Clin Nephrol. 78:54–60. 2012.PubMed/NCBI View
Article : Google Scholar
|
|
8
|
Bastek H, Zubel T, Stemmer K, Mangerich A,
Beneke S and Dietrich DR: Comparison of aristolochic acid I derived
DNA adduct levels in human renal toxicity models. Toxicology.
420:29–38. 2019.PubMed/NCBI View Article : Google Scholar
|
|
9
|
Fuchs TC and Hewitt P: Biomarkers for
drug-induced renal damage and nephrotoxicity-an overview for
applied toxicology. AAPS J. 13:615–631. 2011.PubMed/NCBI View Article : Google Scholar
|
|
10
|
Mori Y, Kondo C, Tonomura Y, Torii M and
Uehara T: Identification of potential genomic biomarkers for early
detection of chemically induced cardiotoxicity in rats. Toxicology.
271:36–44. 2010.PubMed/NCBI View Article : Google Scholar
|
|
11
|
Pal R, Mamidi MK, Das AK and Bhonde R:
Human embryonic stem cell proliferation and differentiation as
parameters to evaluate developmental toxicity. J Cell Physiol.
226:1583–1595. 2011.PubMed/NCBI View Article : Google Scholar
|
|
12
|
Ahuja YR, Vijayalakshmi V and Polasa K:
Stem cell test: A practical tool in toxicogenomics. Toxicology.
231:1–10. 2007.PubMed/NCBI View Article : Google Scholar
|
|
13
|
Cezar GG, Quam JA, Smith AM, Rosa GJ,
Piekarczyk MS, Brown JF, Gage FH and Muotri AR: Identification of
small molecules from human embryonic stem cells using metabolomics.
Stem Cells Dev. 16:869–882. 2007.PubMed/NCBI View Article : Google Scholar
|
|
14
|
Asaba A, Okabe S, Nagasawa M, Kato M,
Koshida N, Osakada T, Mogi K and Kikusui T: Developmental social
environment imprints female preference for male song in mice. PLoS
One. 9(e87186)2014.PubMed/NCBI View Article : Google Scholar
|
|
15
|
Fagundez CB, Loresi MA, Ojea Quintana ME,
Delcourt SM, Testa R, Gogorza SJ and Argibay PF: A simple approach
for mouse embryonic stem cells isolation and differentiation
inducing embryoid body formation. Cell Biol Int. 33:1196–1200.
2009.PubMed/NCBI View Article : Google Scholar
|
|
16
|
West PR, Weir AM, Smith AM, Donley EL and
Cezar GG: Predicting human developmental toxicity of
pharmaceuticals using human embryonic stem cells and metabolomics.
Toxicol Appl Pharmacol. 247:18–27. 2010.PubMed/NCBI View Article : Google Scholar
|
|
17
|
Li C and Wing H: DNA-Chip Analyzer
(dChip). The analysis of gene expression data: Methods and
software. Parmigiani G, Garrett ES, Irizarry R and Zeger SL (eds).
Springer, New York, pp120-141, 2003.
|
|
18
|
Livak KJ and Schmittgen TD: Analysis of
relative gene expression data using real-time quantitative PCR and
the 2(-Delta Delta C(T)) method. Methods. 25:402–408.
2001.PubMed/NCBI View Article : Google Scholar
|
|
19
|
Mei N, Arlt VM, Phillips DH, Heflich RH
and Chen T: DNA adduct formation and mutation induction by
aristolochic acid in rat kidney and liver. Mutat Res. 602:83–91.
2006.PubMed/NCBI View Article : Google Scholar
|
|
20
|
De Broe ME, Curhan GC and Forman JP:
Nephropathy induced by aristolochic acid (AA) containing herbs.
UpToDate, 2018.
|
|
21
|
Singaravelu K, Devalaraja-Narashimha K,
Lastovica B and Padanilam BJ: PERP, a p53 proapoptotic target,
mediates apoptotic cell death in renal ischemia. Am J Physiol Renal
Physiol. 296:F847–F858. 2009.PubMed/NCBI View Article : Google Scholar
|
|
22
|
Singaravelu K and Padanilam B: The role of
p53 pro-apoptotic target, PERP, induces mitochondrial permeability
and apoptosis in hypoxic renal cells. FASEB J. 22 (1
Suppl)(730.11)2008.PubMed/NCBI View Article : Google Scholar
|
|
23
|
Lord GM, Hollstein M, Arlt VM, Roufosse C,
Pusey CD, Cook T and Schmeiser HH: DNA adducts and p53 mutations in
a patient with aristolochic acid-associated nephropathy. Am J
Kidney Dis. 43:e11–e17. 2004.PubMed/NCBI View Article : Google Scholar
|
|
24
|
Schimmack G, Defronzo RA and Musi N:
AMP-activated protein kinase: Role in metabolism and therapeutic
implications. Diabetes Obes Metab. 8:591–602. 2006.PubMed/NCBI View Article : Google Scholar
|
|
25
|
Shi L, He C, Li Z, Wang Z and Zhang Q:
FBP1 modulates cell metabolism of breast cancer cells by inhibiting
the expression of HIF-1α. Neoplasma. 64:535–542. 2017.PubMed/NCBI View Article : Google Scholar
|
|
26
|
Kępka A, Dariusz Szajda S, Stypułkowska A,
Waszkiewicz N, Jankowska A, Chojnowska S and Zwierz K: Urinary
fructose-1, 6-bisphosphatase activity as a marker of the damage to
the renal proximal tubules in children with idiopathic nephrotic
syndrome. Clin Chem Lab Med. 46:831–835. 2008.PubMed/NCBI View Article : Google Scholar
|
|
27
|
Kepka A, Szajda SD and Zwierz K:
Fructose-1, 6-bisphosphatase-marker of damage to proximal renal
tubules. Pol Merkur Lekarski. 24:125–130. 2008.PubMed/NCBI View Article : Google Scholar : (In Polish).
|
|
28
|
Upadhyaya Y, Xie L, Salama P, Cao S, Nho
K, Saykin AJ and Yan J: For The Alzheimer's Disease Neuroimaging
Initiative. Differential co-expression analysis reveals early stage
transcriptomic decoupling in alzheimer's disease. BMC Med Genomics.
13 (Suppl 5)(S53)2020.PubMed/NCBI View Article : Google Scholar
|
|
29
|
Hsin YH, Cheng CH, Tzen JT, Wu MJ, Shu KH
and Chen HC: Effect of aristolochic acid on intracellular calcium
concentration and its links with apoptosis in renal tubular cells.
Apoptosis. 11:2167–2177. 2006.PubMed/NCBI View Article : Google Scholar
|
|
30
|
Itäranta P, Lin Y, Peräsaari J, Roël G,
Destrée O and Vainio S: Wnt-6 is expressed in the ureter bud and
induces kidney tubule development in vitro. Genesis. 32:259–268.
2002.PubMed/NCBI View Article : Google Scholar
|
|
31
|
Crawford RR, Prescott ET, Sylvester CF,
Higdon AN, Shan J, Kilberg MS and Mungrue IN: Human CHAC1 protein
degrades glutathione, and mRNA induction is regulated by the
transcription factors ATF4 and ATF3 and a bipartite ATF/CRE
regulatory element. J Biol Chem. 290:15878–15891. 2015.PubMed/NCBI View Article : Google Scholar
|
|
32
|
Choi YM, Cho HY, Anwar MA, Kim HK, Kwon JW
and Choi S: ATF3 attenuates cyclosporin A-induced nephrotoxicity by
downregulating CHOP in HK-2 cells. Biochem Biophys Res Commun.
448:182–188. 2014.PubMed/NCBI View Article : Google Scholar
|