Introduction
Patients with intracerebral hemorrhage (ICH) have
high disability and mortality rates, and the survivors suffer from
a variety of neurological dysfunctions (1). The death of neurons during cerebral
hemorrhage may lead to a decrease in the number of synapses
(2). It has been demonstrated that
the number of synapses increases gradually during the recovery
period following cerebral infarction (3,4).
Although extensive studies on the mechanisms of ICH have been
performed, the underlying mechanisms remain largely unknown
(5,6).
It has been demonstrated that thrombospondin ½
(TSP1/2) and its receptor, calcium voltage-gated channel auxiliary
subunit (Cacna2δ1; α2δ1), promote the formation of synapses and
synaptogenesis (7). α2δ1 was
originally isolated from skeletal muscle as a non-essential subunit
of the L-type voltage-gated calcium channel complex (8). It is widely expressed in a number of
tissues, including neurons (9,10).
α2δ1 expression is altered in several pathophysiological
conditions. In this regard, neuropathic pain is associated with
increased α2δ1 expression in the dorsal root ganglion and spinal
cord (11). Furthermore, α2δ1
expression is increased in cerebral ischemia-reperfusion injury
(12). A recent study has also
indicated that ICH increases the expression levels of α2δ1 and
glutamate NMDA receptor subunit ζ1(13). TSPs are multi-domain
calcium-binding extracellular glycoproteins mediating cell-cell and
cell matrix interactions (14,15).
TSPs can be categorized into two subfamilies: Trimer subgroup A
(TSP1 and TSP2) and pentamer subgroup B (TSP3, TSP4 and TSP5)
(16-18).
Each of these five TSPs is encoded by a separate gene. It has been
reported that TSP1 and TSP2 exhibit increased expression levels in
brain tissues affected by hemorrhage, to regulate angiogenesis
through their anti-angiogenic properties (19). TSP1/2 binding to α2δ1 serves a
crucial role in promoting synaptic formation and synaptogenesis
(20,21). TSP1 also enhances the migration and
adhesion of macrophages, smooth muscle cells (SMCs) and fibroblasts
into the vessel walls, and promotes the migration and proliferation
of SMCs (22). TSP1 is highly
expressed in the ischemic brain (4,23).
Therefore, it was hypothesized that alterations in the levels of
TSP1/2 and α2δ1 affect synaptogenesis during hemorrhagic injury. In
the present study, the expression levels of TSP1/2 and α2δ1 were
measured in a rat model of ICH established by injecting collagenase
IV into the rat striatum. The present study aimed to provide
insights that would benefit the recovery of neuronal function after
ICH.
Materials and methods
Animal model of ICH
A total of 28 adult male Sprague-Dawley rats
(weight, 280-320 g; 7-10 weeks old), purchased from the
Experimental Animal Science Center of Hebei Medical University
(Shijiazhuang, China) were used in the present study. All animals
were housed under the same conditions (atmospheric humidity,
50-60%; 25˚C; 12-h light/dark cycle) and were allowed free access
to food and tap water. In the present study, the animal experiments
complied with the regulations of the Animal Welfare Act of the
National Institutes of Health Guide for the Care and Use of
Laboratory Animals and were approved by the Ethics Committee of
Hebei Medical University (IACUC Hebmu-Glp-2016017; Shijiazhuang,
China).
The rats were randomly divided into seven groups as
follows: The first was the sham group with injection of 10 µl
saline into the striatum; the six other groups comprised rats that
were injected with collagenase IV dissolved in 10 µl saline into
the striatum and examined on days 1, 3, 5, 7, 14 or 21
post-injection. ICH was induced by the injection of collagenase IV
into the globus pallidus. Collagenases are proteolytic enzymes that
are present within cells in an inactive form. Collagenase is
released in response to inflammation. Collagen is a substrate of
collagenase and exists in the basal lamina of blood vessels in
brain tissue. The infusion of collagenase into the brain damages
blood vessels and the blood brain barrier to mimic ICH (24,25).
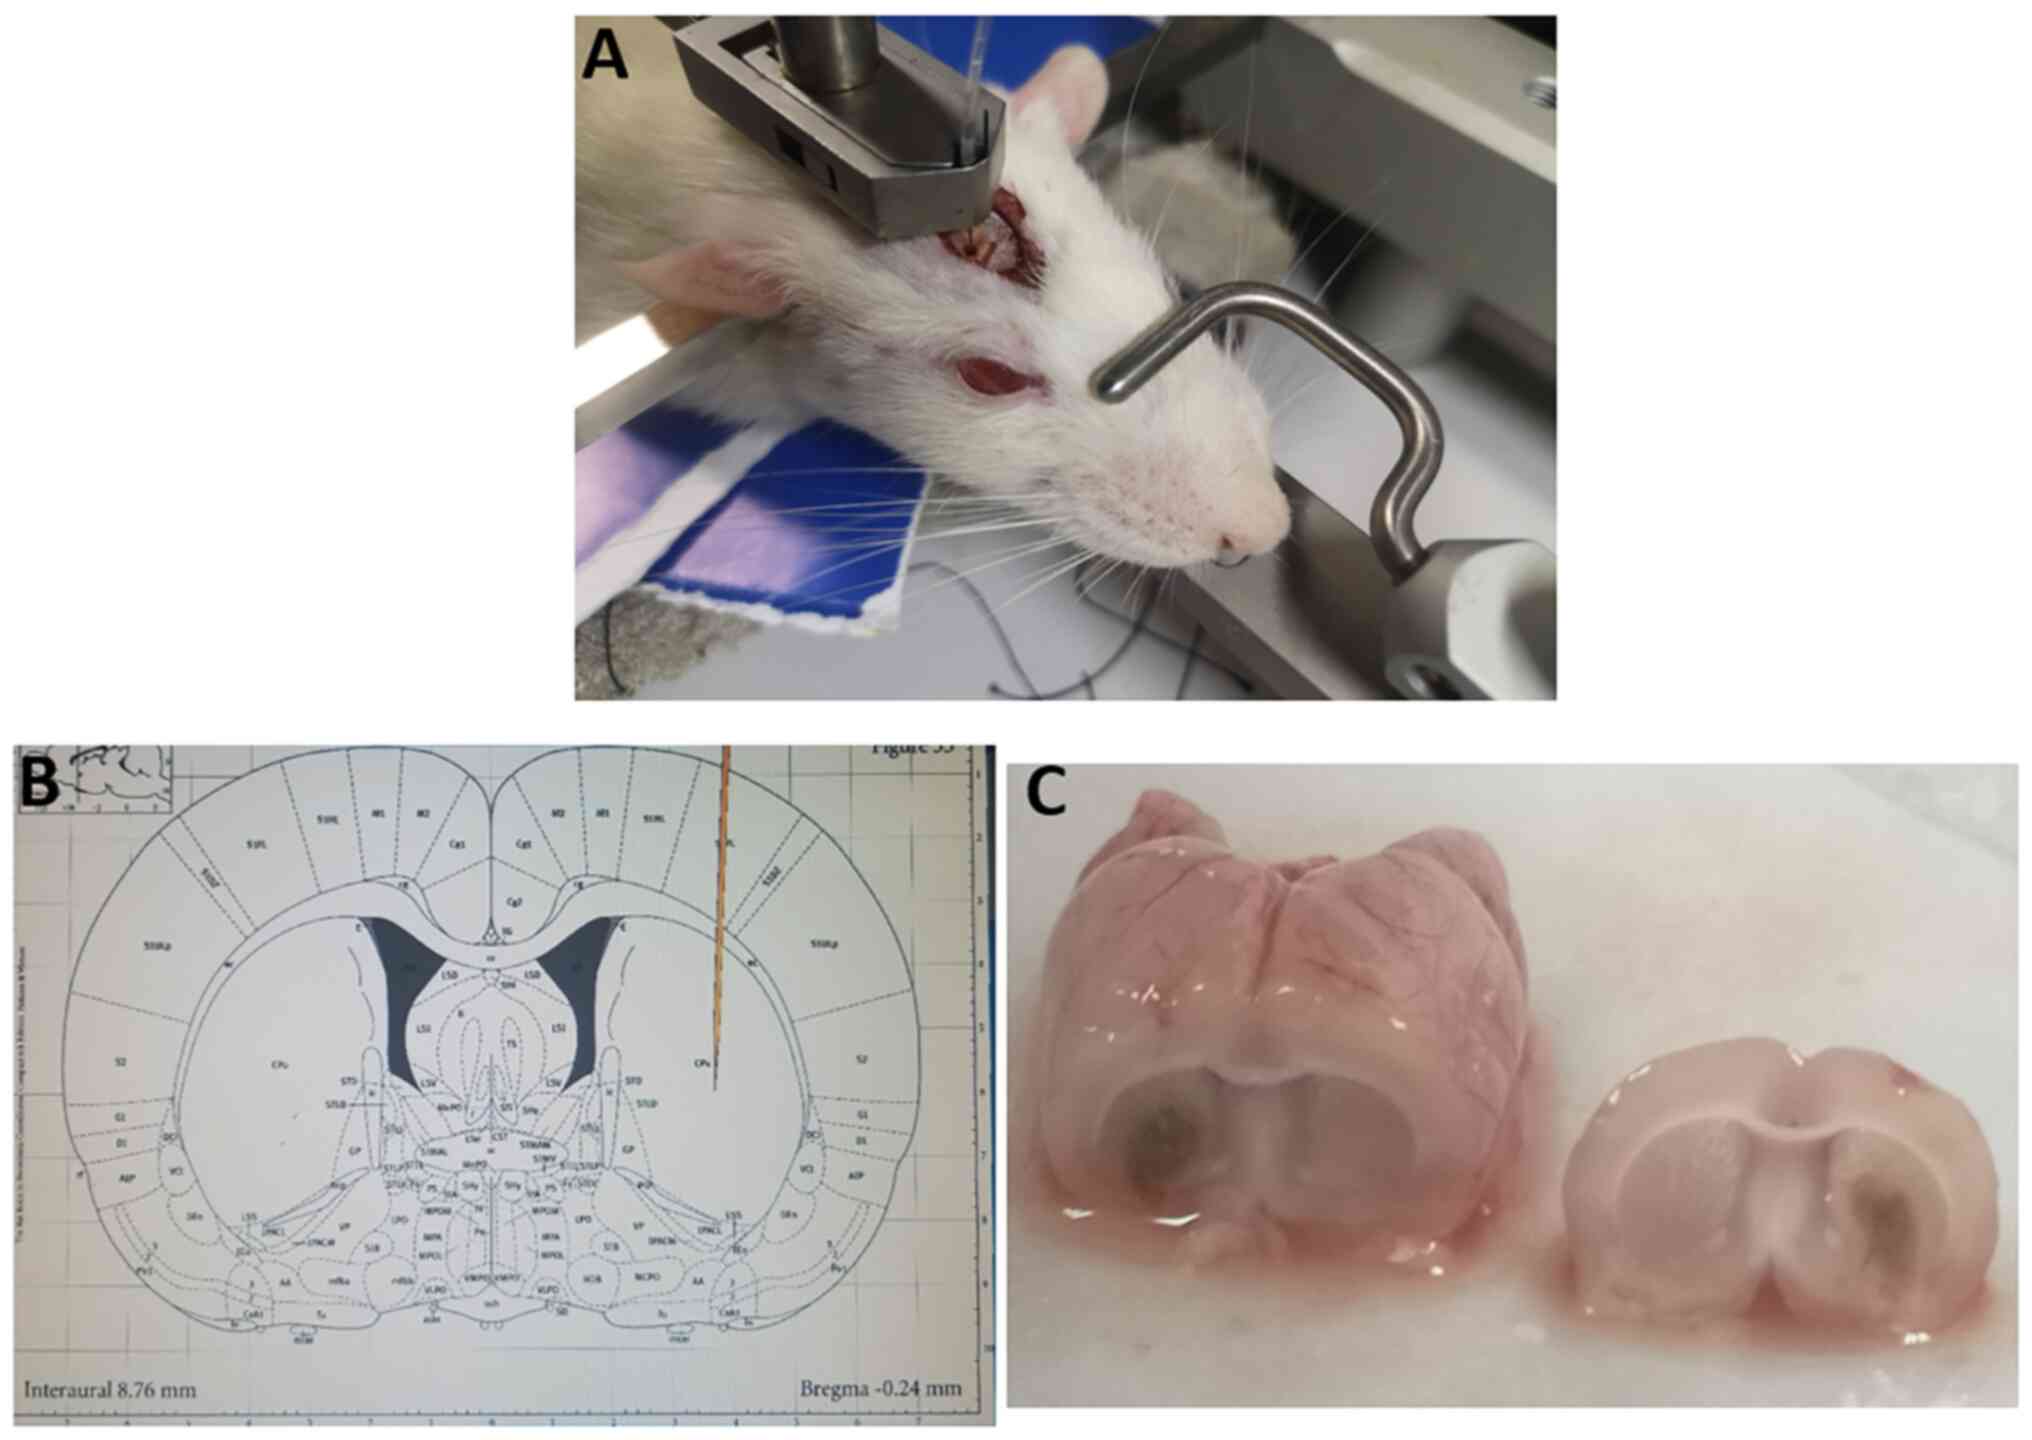
The rats in the present study were anesthetized with 1%
pentobarbital sodium (intraperitoneal; 30 mg/kg) and the rats were
placed in a position such that their heads were fixed on a
stereotactic frame (model SD252; NeuroStar) in order for the
posterior and anterior fontanelle to be on the same horizontal
plane. A hole at a diameter of 1 mm was drilled into the skull on
the right side at 2.4 mm caudal to the bregma. The needle was
inserted into the brain tissue at 6 mm deep. Collagenase IV (0.3 U
in 1 µl; Sigma-Aldrich; Merck KGaA) was dissolved in 0.9% sterile
saline and injected into the right globus pallidus with a Hamilton
syringe at a speed of 0.2 µl/min (Fig.
1A and B). The sham control
animals received an injection of 10 µl saline into the right globus
pallidus. The hole in the skull was closed with bone wax and the
wound was closed with a suture. The rats were placed in a warm box
during the recovery period. For harvesting brain tissue samples,
the rats were decapitated under anesthesia with intraperitoneal
injection of 1% sodium pentobarbital at a dosage of 30 mg/kg. Brain
samples were obtained on days 1, 3, 5, 7, 14 or 21 following the
collagenase IV injection. Briefly, the rat brains were removed and
the tissue surrounding the hematoma in the striatum was obtained
under a light microscope to ensure the tissues were taken from the
right location (Fig. 1C). Brain
tissues were snap frozen in liquid nitrogen and then stored at
-80˚C.
RNA extraction and reverse
transcription-quantitative PCR (RT-qPCR)
Following injection of saline (sham group) or
collagenase IV, the rat brains were removed on days 1, 3, 5, 7, 14
or 21. The striatum on the side of the hematoma was used as the
specimen, and the right striatum of rats (saline injection) was
used as a control. Total RNA was extracted from the samples using
TRIzol® reagent (Sangon Biotech Co., Ltd.) according to
the manufacturer's instructions. Reverse transcription was
performed according to the manufacturer's protocol using the
RevertAid First Strand cDNA Synthesis Kit (Thermo Fisher
Scientific, Inc.). The primers used for qPCR were designed and
synthesized by Sangon Biotech Co., Ltd. Gel electrophoresis was
used to screen the production of individual amplification products,
standard curve analysis was used to screen the PCR efficiency and
melting curve analysis was used to screen for the formation of
primer-dimers. The sequences of the primers used were as follows:
TSP1 forward, 5'-AAACTGTCCCTATGTGCCCAATGC-3' and reverse,
5'-TGCCGTCGTTGTCATCGTCATG-3' (92 bp); TSP2 forward,
5'-GCTTCCACTGCCTGCCTTGTC-3' and reverse,
5'-GCACGGATTCTCTGGCTCACATAC-3' (110 bp); α2δ1 forward,
5'-CGTGGGTGGATAACAGCAGAAC-3' and reverse,
5'-CAGAGTCAATCCGCTCACACTTCC-3' (144 bp); and β-actin forward,
5'-TGTCACCAACTGGGACGATA-3' and reverse, 5'-GGGGTGTTGAAGGTCTCAAA-3'.
β-actin (rat β-actin endogenous reference genes primers; product
no. B661202-0001; purchased from Sangon Biotech Co., Ltd.) was used
to normalize the total cDNA content and reverse transcription
efficiency.
qPCR was performed using an ABI QuantStudio6Flex
real-time fluorescence quantitative PCR instrument (Applied
Biosystems; Thermo Fisher Scientific, Inc.) using SYBR-Green
Chemical [SGExcel Fast SYBR Mixture (with ROX); Sangon Biotech Co.,
Ltd.]. All reactions were carried out under the following
conditions: 20 µl reaction system (8.2 µl ddH2O, 0.4 µl
reverse primer, 0.4 µl forward primer, 1 µl template DNA and 10 µl
mixture, which contained Fast Taq DNA Polymerase, PCR Buffer,
dNTPs, SYBR Green, fluorescence dye, Mg2+ and ROX dye),
with pre-denaturation at 95˚C for 3 min. This was followed by
denaturation at 95˚C for 5 sec, annealing at 60˚C for 20 sec and
extension at 60˚C for 20 sec for 40 cycles. The melting curve was
analyzed at the temperature range of 60-95˚C. The melting curves of
all samples were used as specific controls. All gene expression
data were calculated using the 2-ΔΔCq method, indicating
an n-fold change in gene expression compared with the sham sample
(26).
Western blot analysis
The striatum tissue on the hematoma side and the
right striatum from rats in the sham group were added to RIPA lysis
buffer (5X buffer; Beijing Solarbio Science & Technology Co.,
Ltd.) containing 1% inhibitor. Each mg of tissue was lysed with 10
µl lysate (1:10 ratio). Following ultrasonic homogenization, the
lysate was centrifuged at 12,000 x g at 4˚C for 20 min. The
supernatant was denatured with 5X buffer at 95˚C for 5 min, and the
samples were aliquoted and stored at -80˚C. The protein
concentration was determined using a BCA kit [PQ0011; Multisciences
(Lianke) Biotech Co., Ltd.]. SDS-PAGE (6-12%) protein separation
was performed using a rapid gel kit (ZD304A-1; Beijing Zoman
Biotechnology Co., Ltd.) and protein was transferred to a PVDF
membrane. Due to the low levels of TSP1 in the brain tissue and the
high molecular weight, and in order to more effectively separate
TSP1 protein and separate internal reference proteins
simultaneously, the separation gel for gel electrophoresis was
configured with a concentration of 6% in the upper layer and 8% in
the lower layer. The sample amount loaded was 80 µg total protein
per lane, and after separation, this was transferred at 100 V to a
film for 2 h, which was subsequently blocked using 5% skimmed milk
for 1.5 h at 4˚C. Incubation with the primary antibodies was
performed in the refrigerator at 4˚C overnight, and incubation with
secondary antibodies was performed at room temperature for 2 h. An
Odyssey infrared laser scanning imaging system was used for PVDF
film imaging. The primary antibodies used were as follows: TSP1
(dilution, 1:100; cat. no. MA5-13398; Invitrogen; Thermo Fisher
Scientific, Inc.), TSP2 (dilution, 1:1,000; cat. no. GTX64459;
GeneTex, Inc.), α2δ1 (dilution, 1:1,000; cat. no. ab2864; Abcam)
and β-actin (dilution, 1:500,000; cat. no. AC026; ABclonal Biotech
Co., Ltd.). The secondary antibodies used were mouse and rabbit
antibodies (dilution, 1:1,000; rabbit IgG (H&L) Antibody
Dylight™ 800-conjugated, cat. no. 611-145-122 and mouse
IgG (H&L) Antibody Dylight™ 800 Conjugated, cat. no.
610-145-002; Rockland Immunochemicals Inc.). The bands were
visualized using an ECL Plus Detection Kit (Thermo Fisher
Scientific, Inc.). The protein bands were detected and the density
was semi-quantified using the Odyssey IR fluorescence scanning
imaging system (LI-COR Biosciences) and further analyzed using
Adobe Photoshop (version CC2020; Adobe Systems, Inc.). Then, these
values were normalized to the protein bands in the sham group.
Transcriptome sequencing, proteome
quantitative analysis and combined analysis of the two groups
At the beginning of the experiment, three adult male
Sprague-Dawley rats of the same age and weight as those in the
aforementioned experiments were selected, and brain tissue samples
surrounding the hematoma were obtained after 24 h following the
establishment of the model. The samples were sent to Shanghai
Applied Protein Technology Co., Ltd. for transcriptional sequencing
and protein quantification, and the two were analyzed jointly. This
experiment mainly analyzed the proteomics of samples through the
steps and methods of protein extraction and peptide enzymolysis,
TMT labeling, high pH reversed-phase peptide classification, liquid
chromatography-tandem mass spectrometry data collection (Thermo
Scientific Acclaim PepMap100; 100 µm x 2 cm; nanoViper C18; with
positive ionization mode; Thermo Fisher Scientific, Inc.) with
nitrogen gas temperature at 300˚C, nebuliser pressure (psi) of 5-15
psi and a flow rate of 5.0 l/min, protein identification, and
quantitative analysis and bioinformatics analysis. The samples were
chromatographically separated and analyzed by mass spectrometry
using a Q-Exactive mass spectrometer. The precursor ion scanning
range was 300-1,800 m/z, the primary mass spectrometry resolution
was 70,000 at 200 m/z, the automatic gain control target was 1e6,
the maximum injection time was 50 msec, and the dynamic exclusion
time was 60.0 sec. The mass-to-charge ratios of peptides and
peptide fragments were collected as follows: 20 fragments were
collected after each full scan (MS2 scan), the MS2 Activation Type
was HCD, the isolation window was 2 m/z, MS2 resolution rate 17,500
at 200 m/z (TMT 6-plex) or 35,000 at 200 m/z (TMT 10-plex),
normalized collision energy was 30 eV, underfill was 0.1%.
Total RNA was extracted from the brain tissues using
TRIzol® reagent according to the manufacturer's
instructions (Sangon Biotech Co., Ltd.). RNA samples were detected
based on the A260/A280 absorbance ratio with a Nanodrop ND-2000
system (Thermo Fisher Scientific, Inc.), and the RNA integrity
number was determined using an Agilent Bioanalyzer 4150 system (the
nucleotide length was 350bp and a RNA Nano 6000 Assay Kit was used,
obtained from Agilent Technologies Inc.).
Only qualified samples were used for library
construction. Paired-end libraries were prepared using a ABclonal
mRNA-seq Lib Prep Kit (Product: RK20303; ABclonal Biotech Co.,
Ltd.) according to the manufacturer's instructions. The mRNA was
purified from 1 µg total RNA using oligo(dT) magnetic beads
followed by fragmentation using divalent cations at elevated
temperatures in ABclonal First Strand Synthesis Reaction Buffer
(ABclonal Biotech Co., Ltd.). Subsequently, first-strand cDNAs were
synthesized with random hexamer primers and Reverse Transcriptase
(RNase H) using mRNA fragments as templates, followed by
second-strand cDNA synthesis using DNA polymerase I, RNAseH, buffer
and deoxynucleoside triphosphates. The synthesized double-stranded
cDNA fragments were then adapter-ligated for preparation of the
paired-end library. Adapter-ligated cDNA was used for PCR
amplification. PCR products were purified (AMPure XP system) and
library quality was assessed on an Agilent Bioanalyzer 4150 system
(Agilent Technologies, Inc.). Finally, sequencing was performed
using an Illumina Novaseq 6000/MGISEQ-T7 instrument (Illumina,
Inc.).
Raw data were first processed through in-house perl
scripts by removing the adapter sequence and filtering out reads of
low quality (number of lines with a string quality value ≤25
accounts for >60% of the entire reading) and for which the N
(base information cannot be determined) ratio was >5% to obtain
clean reads for subsequent analysis. Subsequently, clean reads were
separately aligned to the reference genome with orientation mode
using HISAT2 v2.1.0 software (http://daehwankimlab.github.io/hisat2/) to obtain
mapped reads. The mapped reads were analyzed with Stringtie
software (version v2.0.4; http://ccb.jhu.edu/software/stringtie/), and then the
Gffcompare software (version v1; http://ccb.jhu.edu/software/stringtie/gffcompare.shtml)
was used to compare the mapped reads with the reference genome
GTF/GFF file to find the original unannotated transcription region
and discover novel transcripts and novel genes of the species.
FeatureCounts (release, 2.0.0; http://subread.sourceforge.net/) was used to count the
read numbers mapped to each gene. Furthermore, the fragments per
kilobase of transcript per million mapped reads of each gene was
calculated based on the length of the gene and read count mapped to
this gene. Differential expression analysis was performed using
DESeq2 (Bioconductor 3.9; http://bioconductor.org/packages/release/bioc/html/DESeq2.html).
Differentially expressed genes (DEGs) with an adjusted P<0.05
were considered to be significantly DEGs. Alternative splicing in
the RNA sequencing data was analyzed by rMATS (release, 4.0.2,
http://rnaseq-mats.sourceforge.net/index.html).
Protein-protein interaction analysis was used to
determine if there was an interaction between gene products and
proteins. Protein-protein interactions were predicted based on the
Search Tool for the Retrieval of Interacting Genes/Proteins
(STRING) database (version 11.0; https://www.string-db.org/). First, the quantitative
information of the target protein set was normalized to the (-1,1)
interval. Then, the Complexheatmap R package (Release 3.14,
https://cran.r-roject.org/src/base/R-3/)
simultaneously classified the two dimensions of sample and protein
expression (distance algorithm, Euclidean; connection, average
linkage), and a hierarchical clustering heatmap was generated
(https://bioconductor.org/packages/release/bioc/html/ComplexHeatmap.html).
Statistical analysis
GraphPad Prism 8 (GraphPad Software, Inc.) was used
for data analysis. All data are presented as the mean ± SEM. Each
experiment was repeated at least 3 times. An unpaired t-test or
one-way ANOVA with Dunnett's post hoc test was used for statistical
analyses. P<0.05 was considered to indicate a statistically
significant difference.
Results
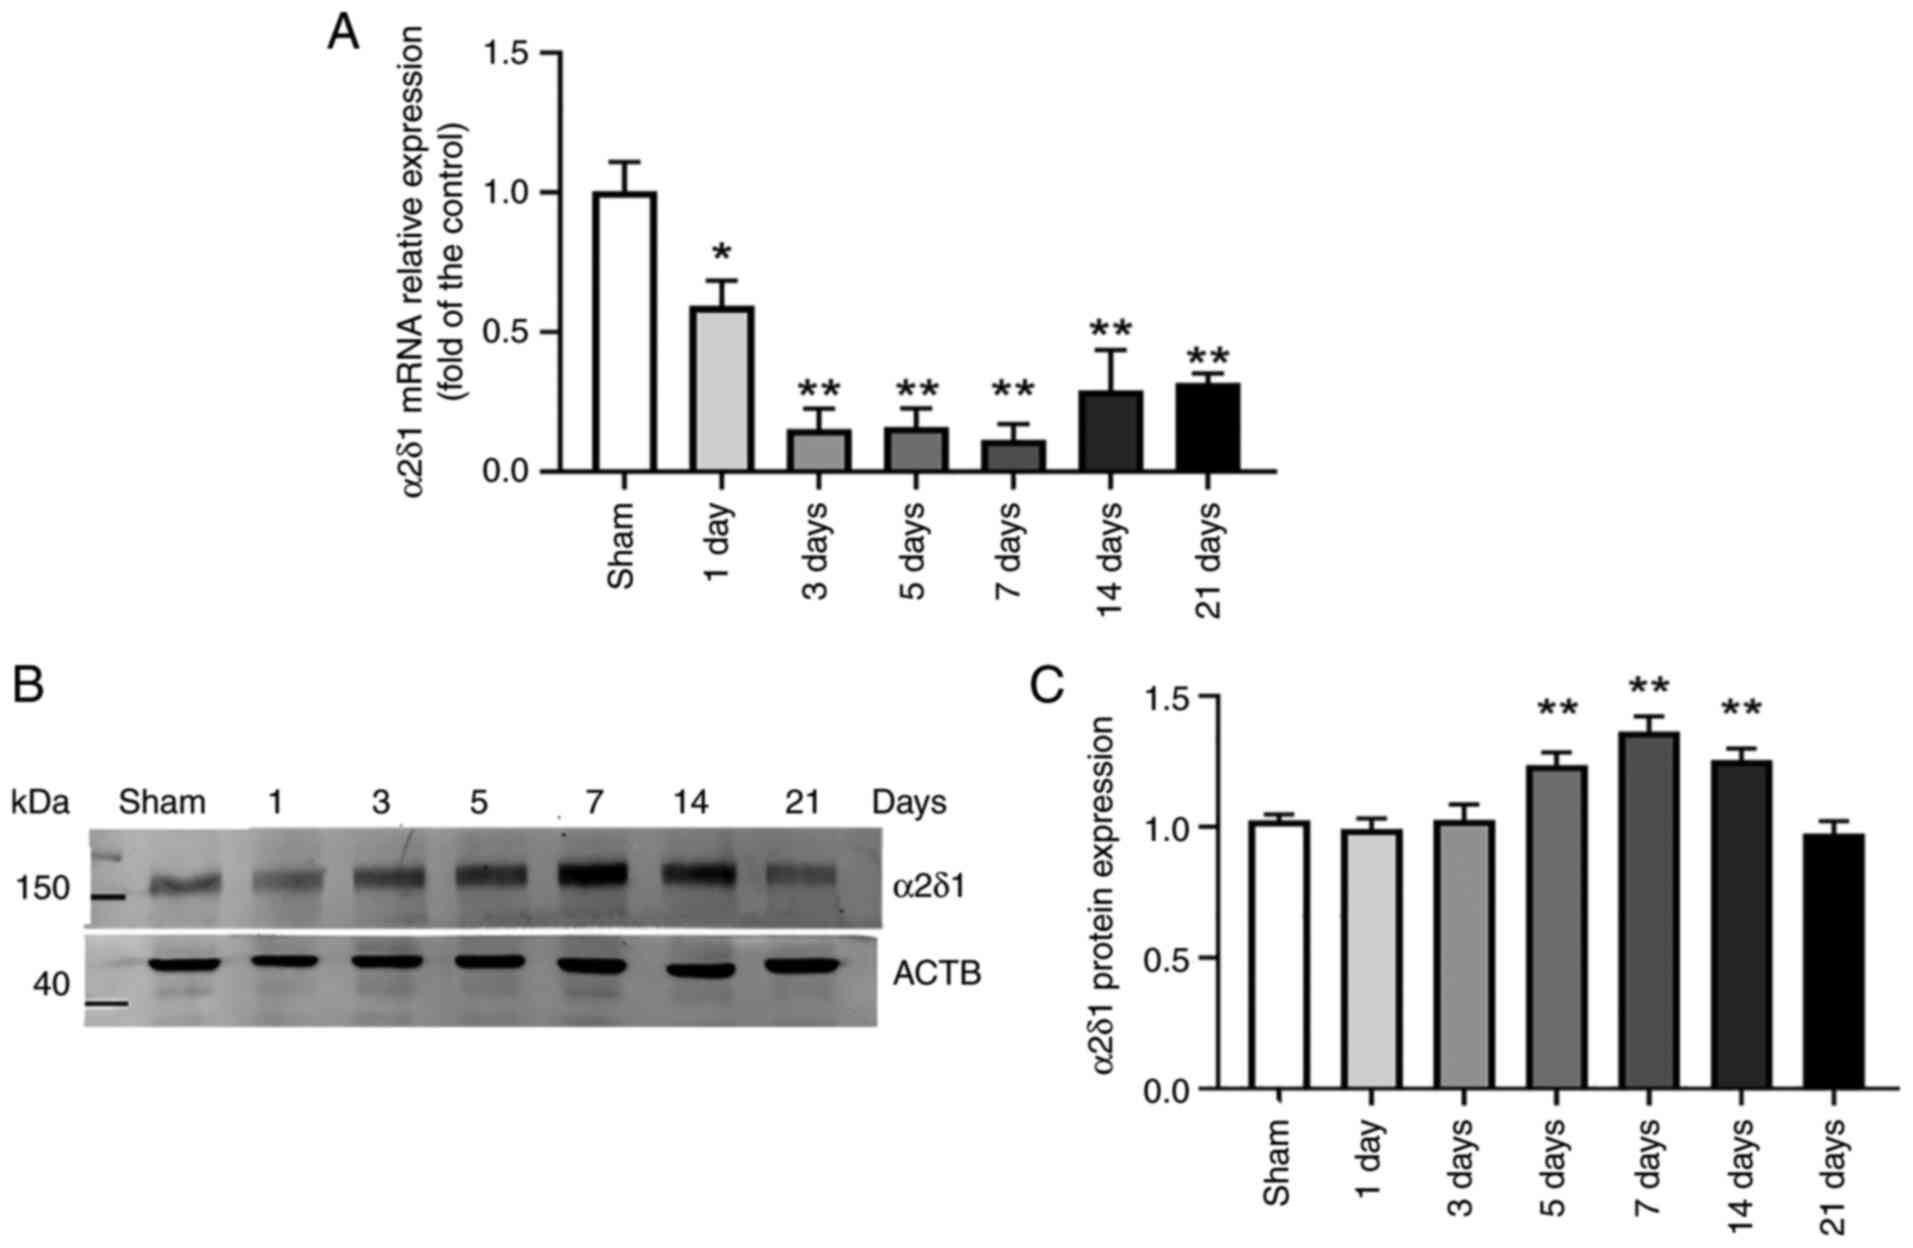
Changes in α2δ1 protein and mRNA
expression in the ICH model
To determine the changes in α2δ1 expression in brain
tissue around the hematoma following hemorrhage, the mRNA and
protein levels of α2δ1 were detected. The α2δ1 mRNA levels began to
decrease to 59±5% on the 1st day after the establishment of the
model. The α2δ1 mRNA levels were significantly decreased on days 3
(15±4%), 5 (16±3%), 7 (11±3%), 14 (29±7%) and 21 (32±2%) (Fig. 2A). Detection of α2δ1 protein levels
using western blot analysis revealed no significant difference
compared with the sham group on days 1 (99.2±0.4%) and 3
(102.5±6.0%); however, these levels significantly increased to
123.5±4.8% on day 5, 136.4±5.7% on day 7 and 125.4±4.5% on day 14,
subsequently decreasing to 97.4±4.7% on day 21 (Fig. 2B and C). The baseline levels were not different
from the levels on day 21.
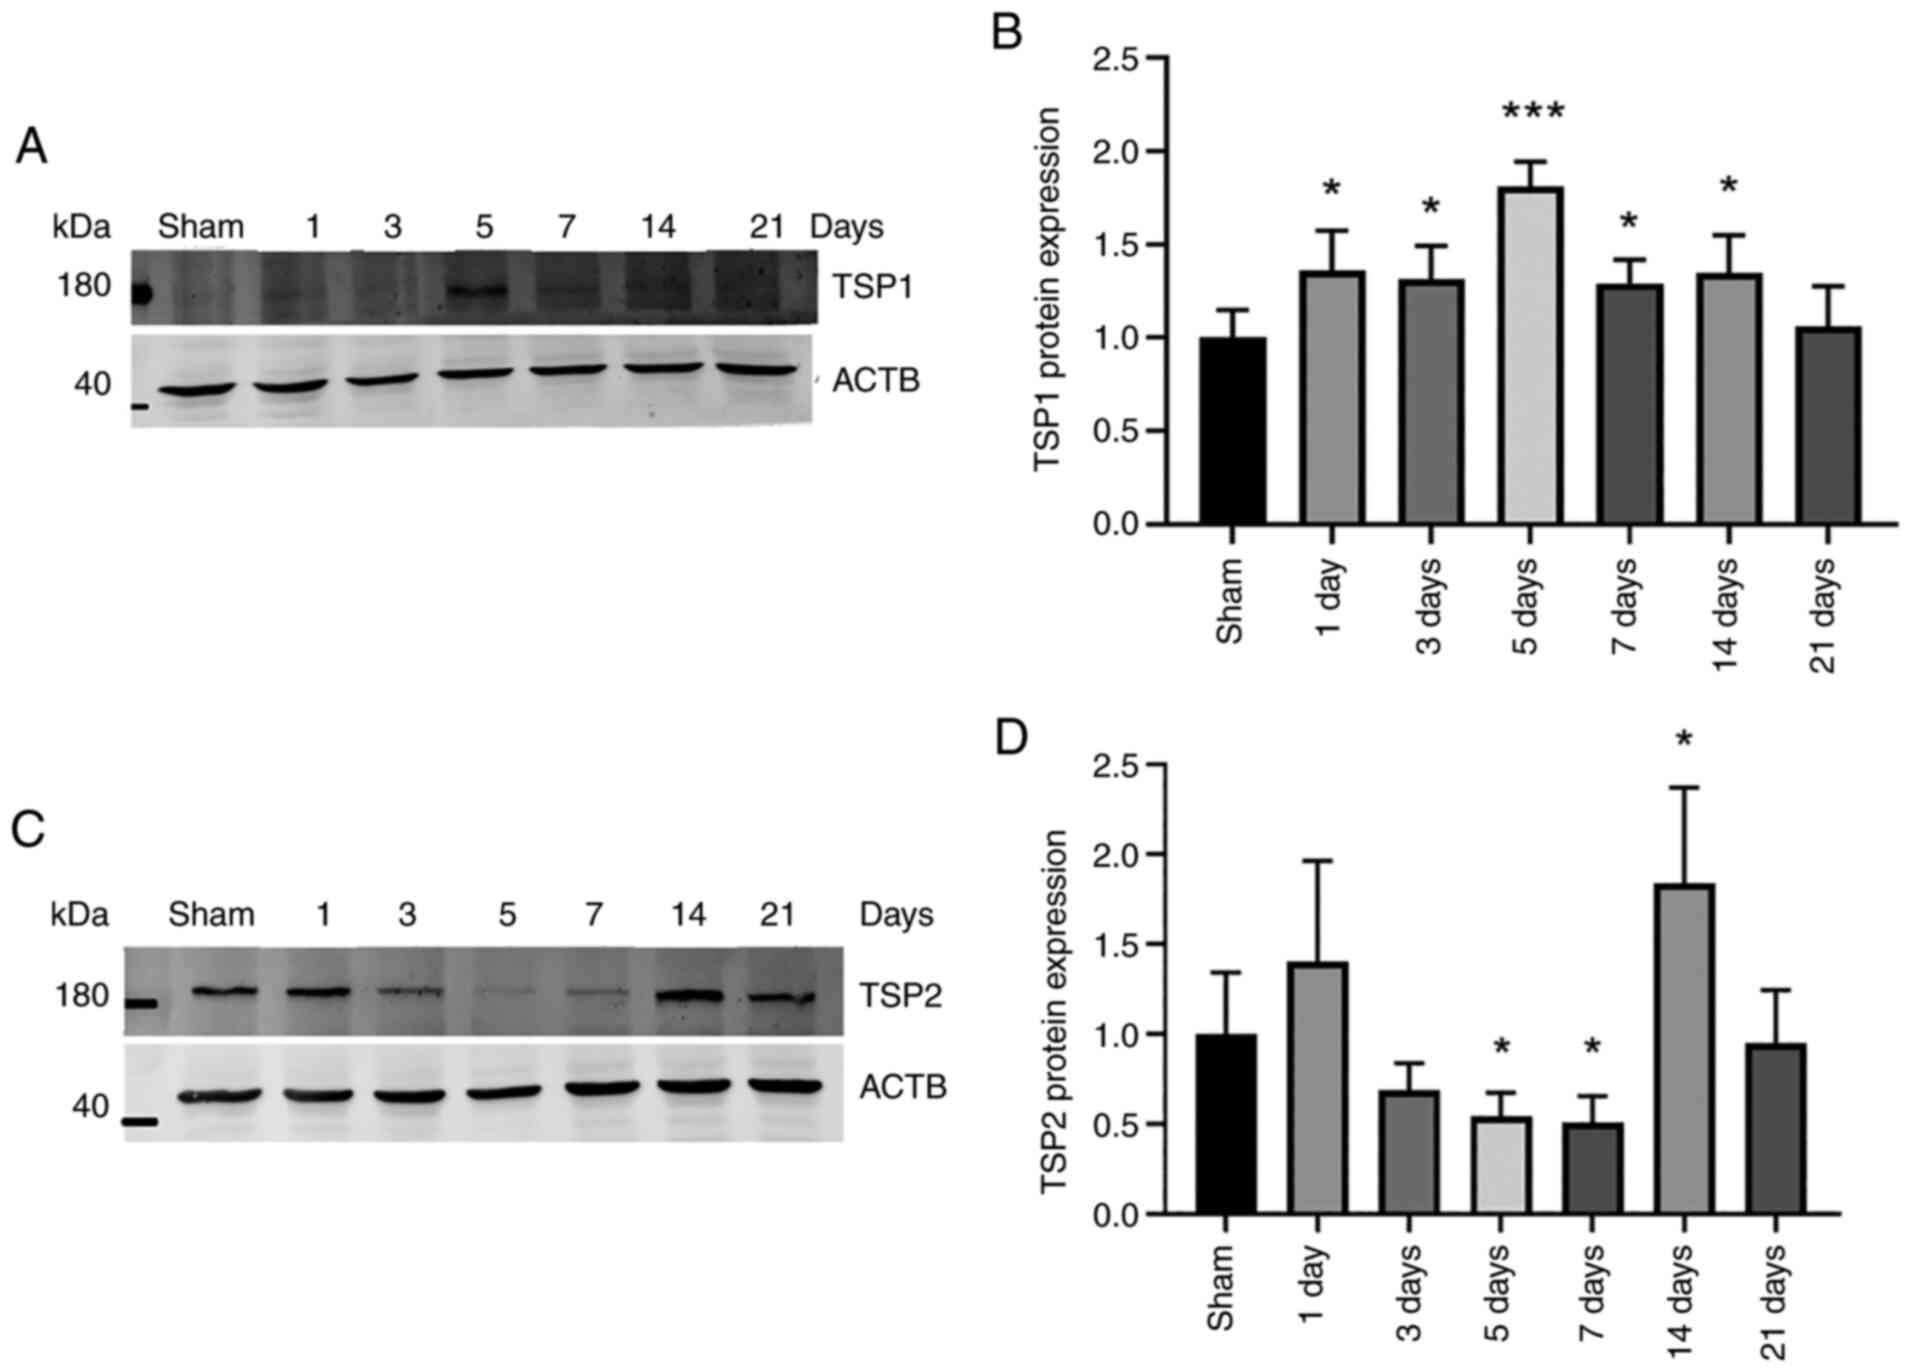
Changes in TSP1/2 protein and mRNA
expression in the ICH model
To determine the changes in TSP1/2 protein
expression following hemorrhage, the levels in the striatum around
the hemorrhage were detected using western blot analysis. TSP1
protein expression gradually increased following hemorrhage to
135±10.6% on day 1 and 131.5±8.8% on day 3, reaching peak levels on
day 5 (181.0±6.5%), and then gradually decreased to sham levels
(Fig. 3A and B). The expression levels of TSP2
decreased to 54.3±6.4% on day 5 and 50.6±7.4% on day 7 following
ICH; however, its expression increased to 183.8±26.6% on day 14
(Fig. 3C and D). The expression levels on days 1, 3 and
21 did not significantly differ from the basal expression levels.
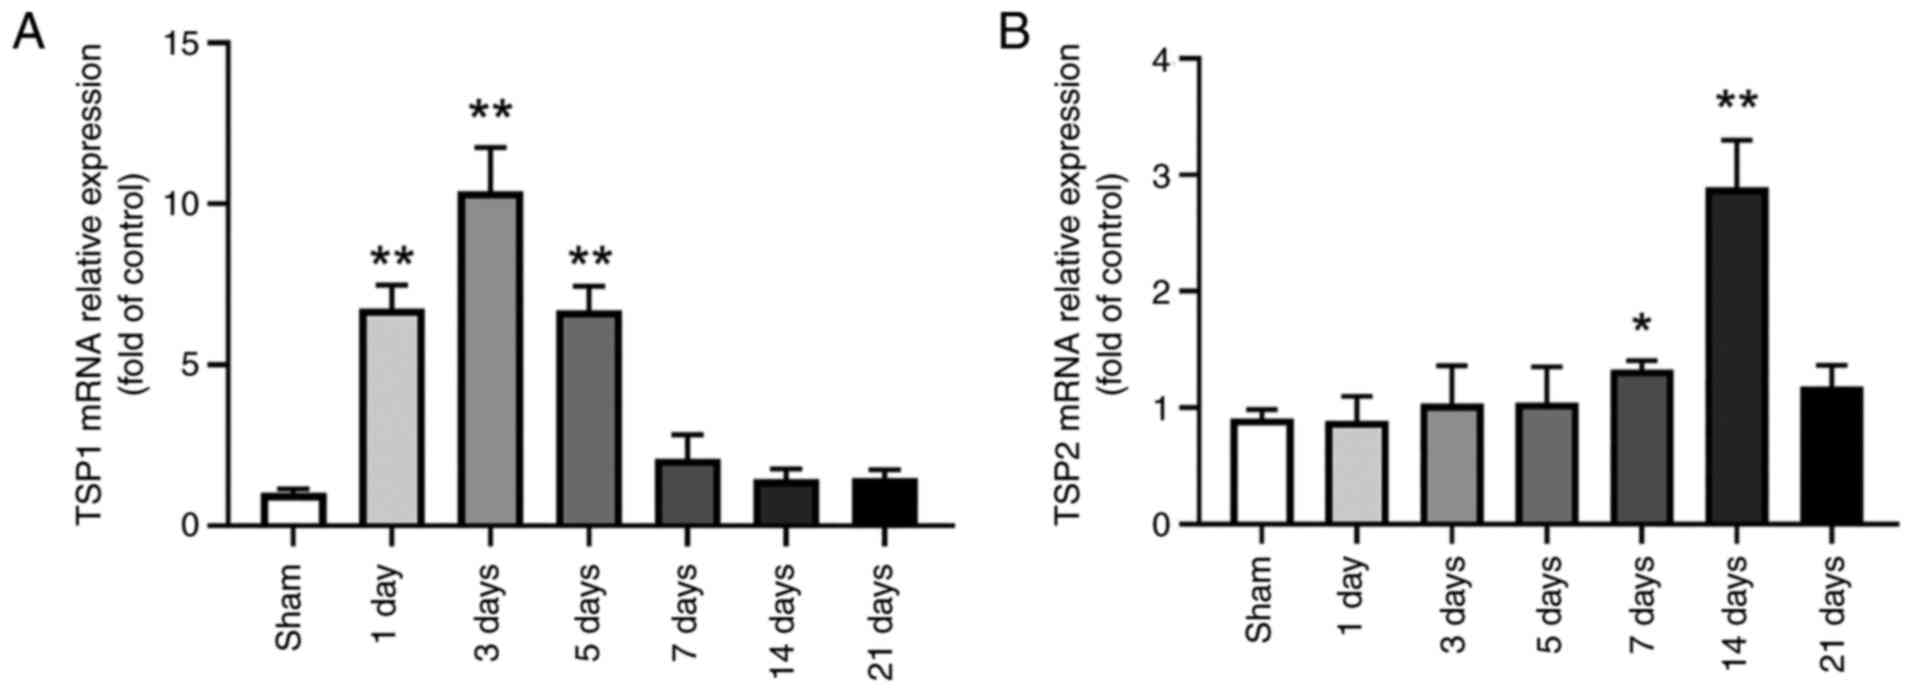
However, the changes in the mRNA levels did not completely coincide
with those observed at the protein level. TSP1 mRNA levels began to
increase on the 1st day following ICH to 675±73%, reached peak
levels of 1,039±136% on the 3rd day, and then began to recover to
670±74% on day 5, 208±74% on day 7, 144±33% on day 14 and 148±26%
on day 21. No significant difference in expression was observed
between the groups on the days 7, 14 and 21 and the sham group
(P>0.05; Fig. 4A). Compared
with the sham group, TSP2 mRNA expression did not increase or
decrease significantly on days 1 (91±8%), 3 (103±33%) and 5
(105±31%) following ICH; however, its expression began to increase
on day 7 to 133±8%, reaching peak levels on day 14 (289±41%), and
decreasing to sham levels (118±18%) on day 21 (Fig. 4B). There was no significant
difference compared with the sham group on day 21.
Analysis of DEGs related to TSP1 and
α2δ1
To determine whether ICH alters gene and protein
expression levels, DESeq2 was used to analyze the samples from ICH
and sham animals with biological repetition. DEGs are displayed in
the volcano plot and were analyzed using cluster analysis (Fig. 5A). It was revealed that 60 genes
were increased >1.5-fold compared with those in sham tissues and
40 genes were decreased to <0.8-fold compared with those in sham
tissues. The cluster map presents the top 60 upregulated genes and
the top 40 downregulated genes (Fig.
5B). Proteins were also analyzed using proteomics analysis. It
was revealed that 263 proteins exhibited a ≥1.2-fold increase and
52 proteins exhibited a ≤0.83-fold decrease compared with the
control values. The quantitative results are shown in the volcano
plot (Fig. 5C). The differentially
expressed proteins in the ICH and control group were clustered and
analyzed using the hierarchical cluster analysis and the data are
displayed in the form of a heatmap (Fig. 5D).
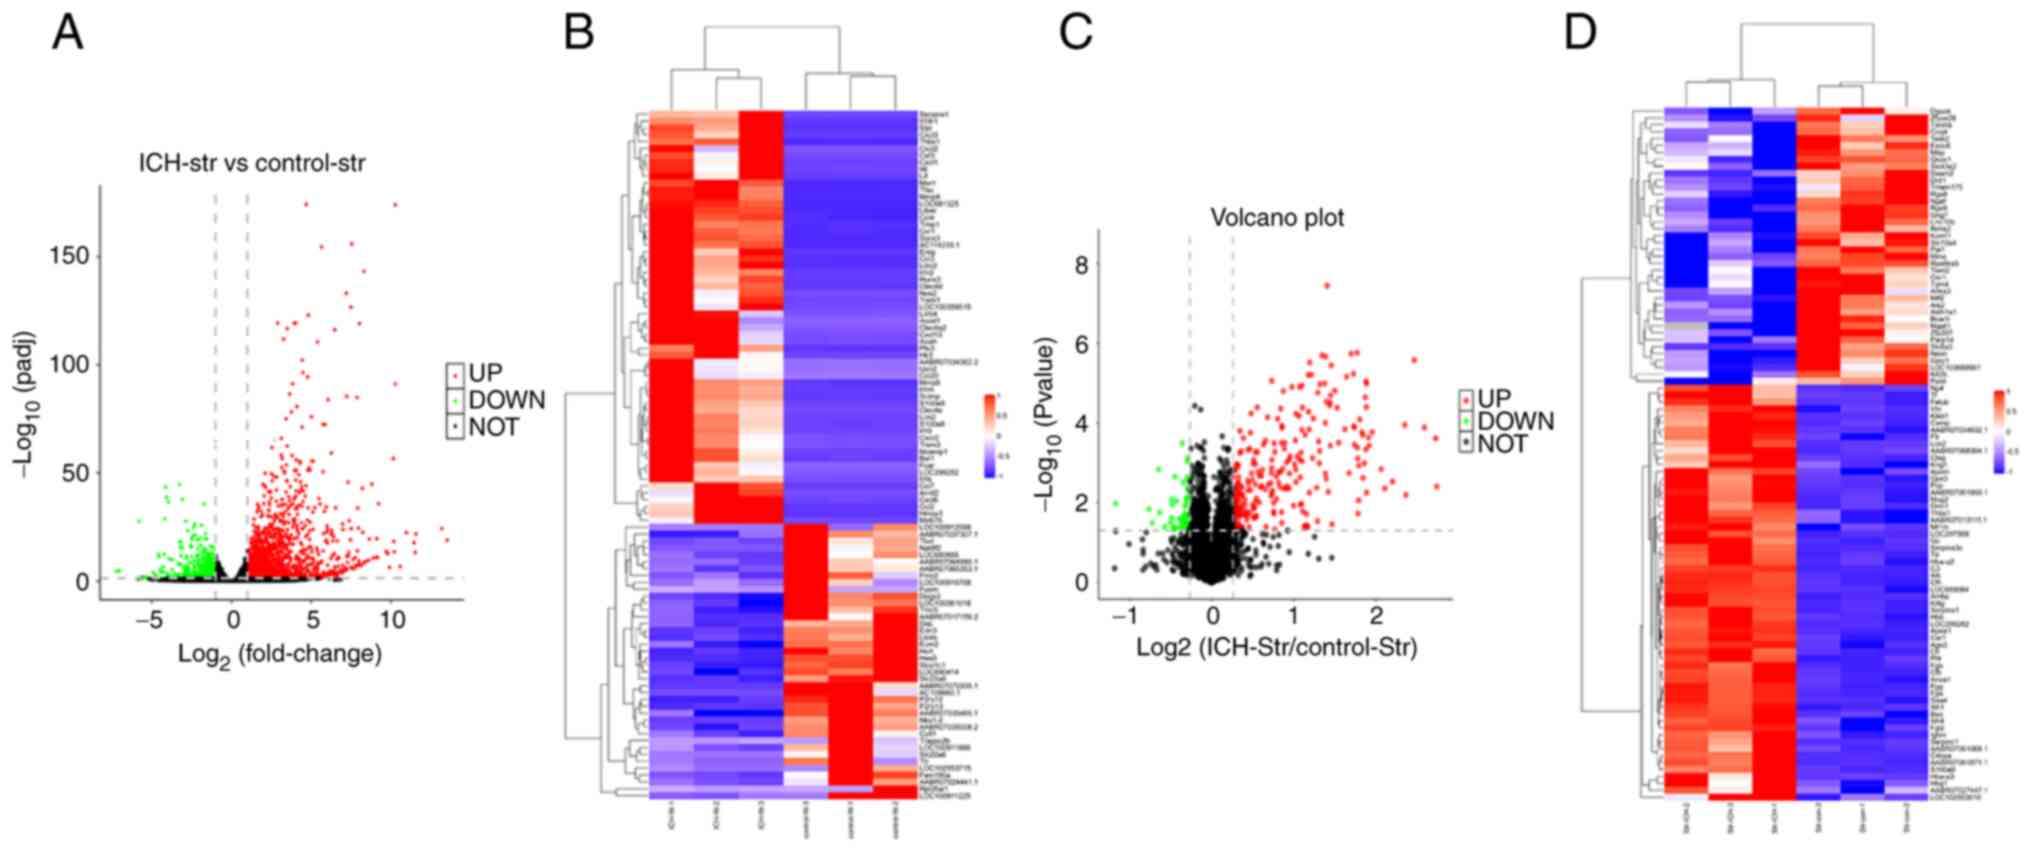 | Figure 5Analysis of differentially expressed
genes and proteins. (A) Gene expression analysis for striatum
tissues obtained from sham and ICH model animals indicating the
changes in gene expression in the different samples. The scattered
dots in the image represent genes, the black dots represent the
genes with no significant difference, the red dots represent the
upregulated genes with significant differences, and the green dots
represent the downregulated genes with significant differences. (B)
Differential gene cluster map (red indicates upregulation, blue
indicates downregulation). (C) A volcano plot was drawn using the
fold change of protein expression between the ICH and control
samples. P-values were obtained using an unpaired t-test,
indicating significant differences between the ICH and control
samples. The abscissa is the multiple of difference (logarithmic
transformation with base 2), the ordinate is the significant
P-value (logarithmic transformation with base 10), the red dots
represent proteins with a significant increase (fold change >1.2
and P<0.05), the green dots represent proteins with a
significant decrease (fold change >0.8) and black dots represent
proteins with no significant differences. (D) Hierarchical
clustering analysis represented by a tree heatmap, in which each
row represents one protein and columns represent one sample each
(n=3 each for control and ICH samples). The protein expression with
significant differences in the different samples is shown in the
heatmap; red represents significantly upregulated proteins and blue
represents significantly downregulated proteins. The gray area in
the heatmap indicates no protein quantitative information. ICH,
intracerebral hemorrhage; str, striatum. |
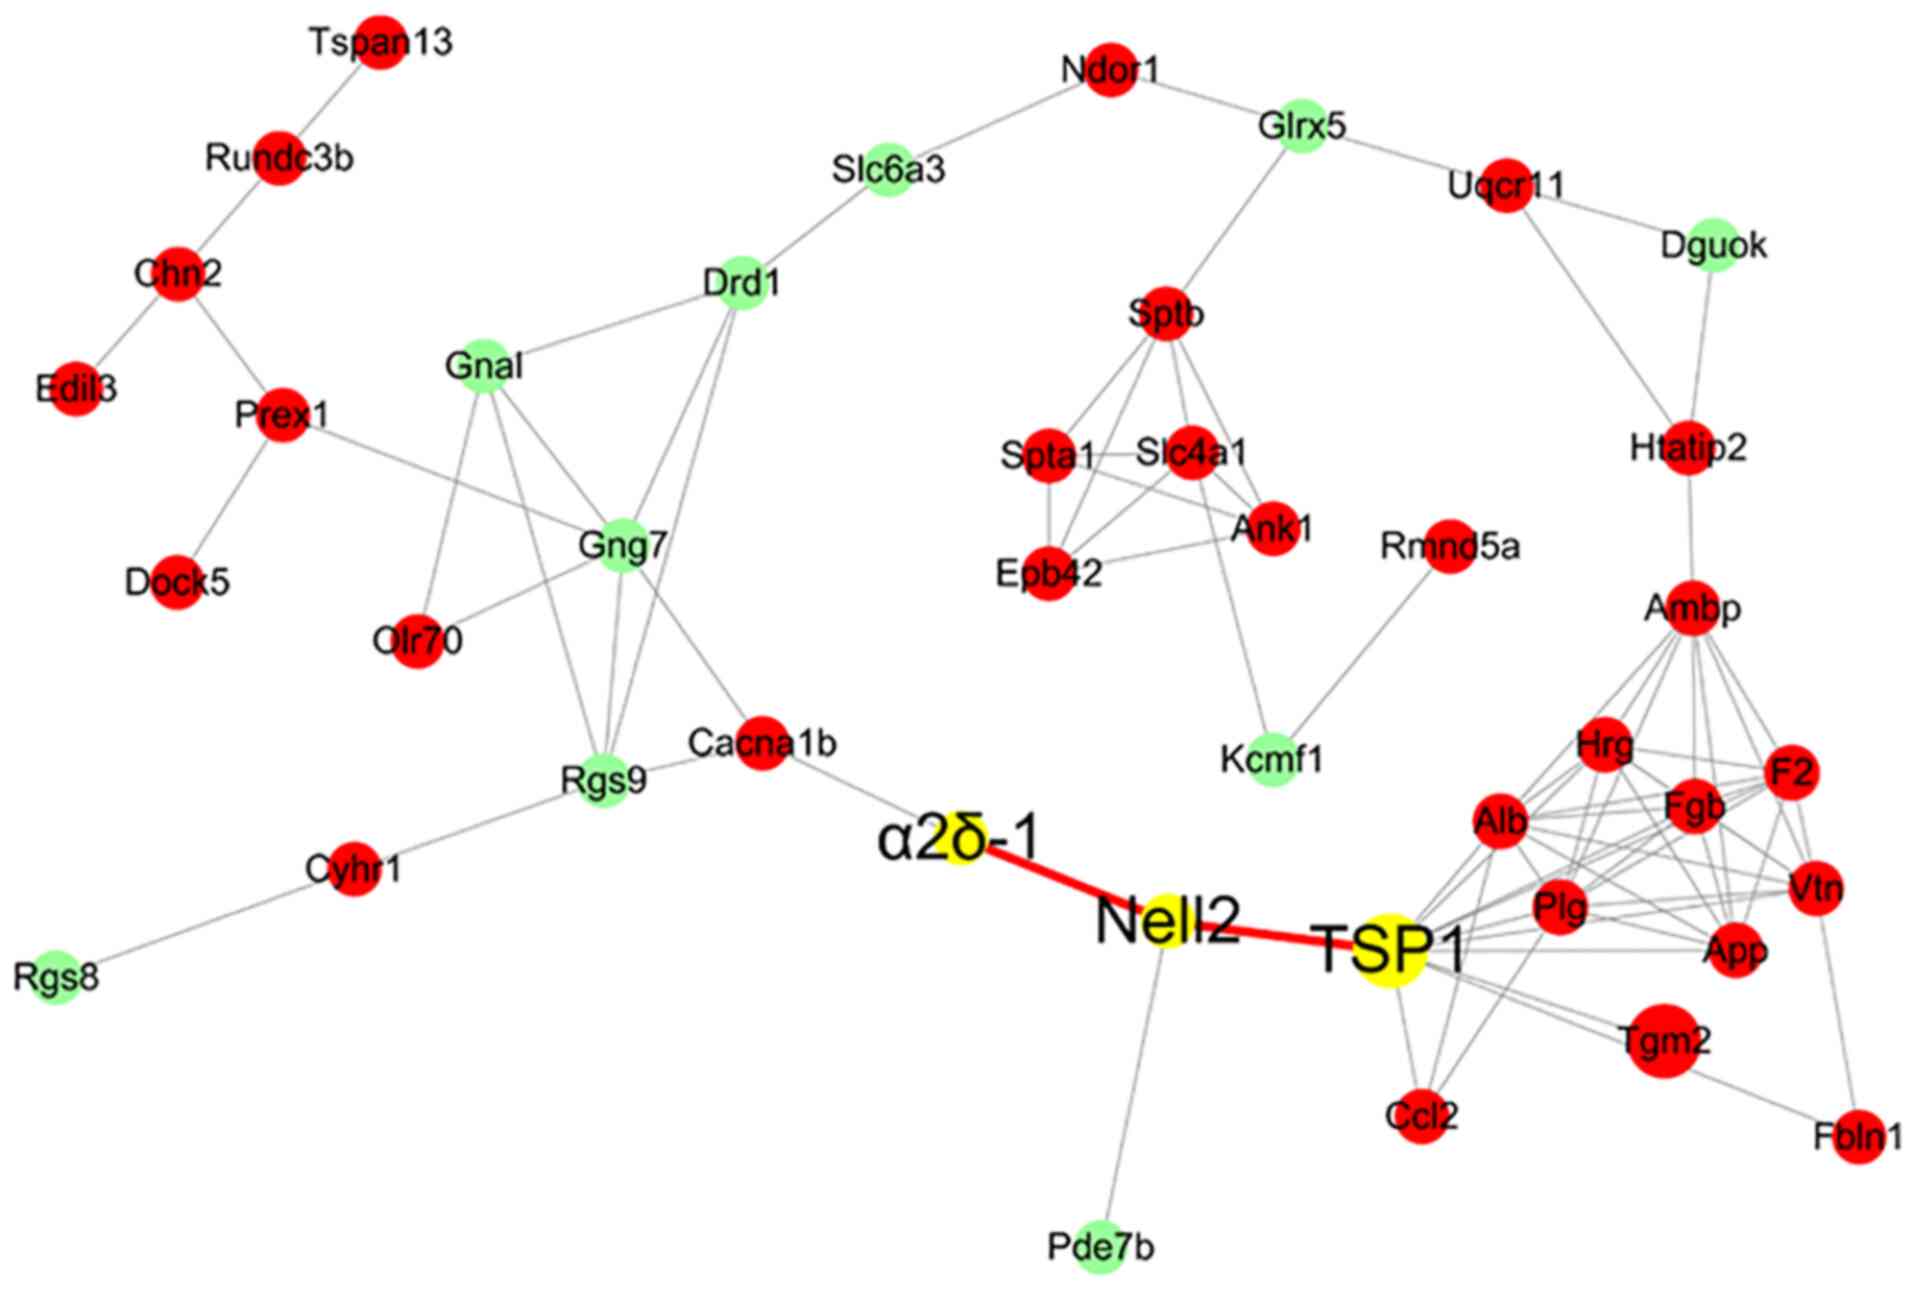
By analyzing the 24-h striatal proteomics data, the
regulatory association among the proteins in the STRING database
was determined and some proteins were selected for mapping. The
proteins with the largest difference were selected (Fig. 6). Based on the data shown in
Fig. 2C, α2δ1 protein expression
was significantly upregulated on days 5-14 and returned to baseline
level on day 21. In addition, it was found that α2δ1 has a
regulatory association with neural EGFL like 2 (Nell2), which has a
regulatory association with TSP1, based on the STRING analysis.
Discussion
Both TSP1 and TSP2 are present in the developing
brain and are proteins secreted by astrocytes (17). Their expression levels are low or
non-existent in the adult rat brain (20). They have similar structures and the
same functional domains (21).
In vitro experiments have demonstrated that all subtypes of
TSP can increase the number of synapses, and TSP1 and TSP2 have
been reported to promote synaptic formation in the central nervous
system (CNS) in vivo (20,21).
Following the ischemic injury to the CNS, the levels of TSP1/2 are
upregulated, while the lack of TSP1/2 impairs synaptic and
functional recovery following ischemic stroke (4).
α2δ1 is highly expressed throughout the entire CNS
(8) and is enriched in cortical
and hippocampal neurons. As a receptor of TSP, α2δ1 is involved in
the formation of excitatory synapses in the CNS (21). They interact through the synaptic
EGF-like domain of TSP and the VWF-A domain of α2δ1, and the
upregulation of α2δ1 in neurons enhances synaptic formation in
vivo (21). α2δ1 serves an
important role in the formation and maturation of excitatory
synapses in the cerebral cortex (20). As an auxiliary subunit of
voltage-gated calcium channels, a previous study (27) has focused on the regulation of
calcium channel function and transport, including the interaction
between gabapentin drugs and α2δ1. The role of α2δ1 in synaptic
formation is not directly related to the expression levels or
function of calcium channels (21). The expression levels of α2δ1 in the
injured brain tissue increase following ischemia, which may be
related to the activation of ion channels and the formation of
synapses (12).
A previous study has reported the increase in TSP1/2
mRNA expression in the striatum following ICH (19). It is primarily hypothesized that
TSP1/2 is related to the regulation of angiogenesis following
hemorrhage, although not from the point of view of synaptic
regeneration, and changes in TSP1/2 protein expression have not
been reported with regard to synaptic regeneration (19). However, to the best of our
knowledge, the expression levels of α2δ1 in brain tissues around
the hematoma following ICH have not been reported to date. In the
present study, a rat model of ICH was established by injection of
collagenase IV. Through gene sequencing and quantitative protein
analysis, it was revealed that the mRNA and protein expression
levels of TSP1 in the striatum around the hematoma increased at 24
h after modeling; however, α2δ1 and TSP2 transcription was detected
but not altered, whereas proteomics only detected α2δ1 but not
TSP2. These data served a guiding role in setting the detection
time of the samples in the follow-up experiment. Furthermore, the
results of western blot analysis and RT-qPCR revealed that the
changes in TSP1 expression were consistent with the results of
proteomics and transcriptome analyses, which increased the
reliability of the experimental results. By performing western blot
analysis of the brain tissue around the hematoma following ICH, it
was revealed that the protein expression levels of α2δ1 increased
following ICH, and the protein expression levels of TSP2 decreased
and then increased, while TSP1 expression increased and then
decreased. Peak TSP1 protein expression was observed after 5 days,
peak TSP2 protein expression was observed after 14 days, and peak
α2δ1 protein expression was observed after 7 days, which was
between the peaks of TSP1 and TSP2.
Following ICH, the brain tissue is destroyed by the
hematoma, and the number of synapses decreases (2). The increase in the α2δ1 and TSP1/2
expression may trigger synaptic regeneration, such as the recovery
of the number and structure of synapses (4,20,21).
Therefore, synaptic regeneration following ICH is an important
recovery process for neuronal function. However, no approaches are
currently available that can increase the expression of these
proteins following cerebral hemorrhage in order to promote the
healing process and recovery of patients. The findings of the
present study may provide useful information for the development of
novel approaches that may be used to increase α2δ1 and TSP1/2
expression in damaged brain tissues following ICH. However, each
protein in the body may serve multiple roles and participate in a
variety of mechanisms. The increase in the levels of α2δ1 and
TSP1/2 may not necessarily be caused by synaptic regeneration.
Both α2δ1 and TSP1 interacted with Nell2. It is
possible that Nell2 is also involved in the regeneration and
reconstruction of nerve synapses. α2δ1 mRNA expression decreased
following ICH, which was not consistent with that of its protein
expression levels. At present, a satisfactory explanation cannot be
provided for this phenomenon. Therefore, further studies are
warranted. ICH may alter gene transcription and translation,
affecting the expression of α2δ1 and other proteins. TSP1 and TSP2
are proteins secreted by glial cells that are involved in synaptic
production in the CNS (19). In
addition, the mechanisms of synaptogenesis and regulation of
synaptogenesis and degeneration are complex. Each type of astrocyte
may exhibit different synaptic and anti-synaptic factors. It has
been demonstrated that a variety of substances secreted by glial
cells, such as secreted protein acidic and rich in cysteine, Hevin,
and glypicans 4 and 6, are involved in this process, as well as in
the mechanisms of the α2δ1 interaction with TSP1/2 to promote
synaptogenesis (28). The synaptic
potential in each brain region may differ and may be heterogeneous,
which is mainly due to differences in the gene expression profiles,
leading to the secretion of various concentrations of synaptic
proteins with different synaptogenic potential (29). However, there is a phenomenon of
the regional restricted distribution of astrocytes in the CNS, and
there is no evidence of a second tangential migration, even after
acute injury to the CNS, which reveals the inherent limitations of
the response of astrocytes to injury (30). In the CNS, synapses can be wrapped
by astroglial processes, which are often termed peri-synaptic
astroglial processes (31). The
close association between peri-synaptic astrocytic processes
(31) and neurons provides an
indispensable factor for the formation of neural circuits, and may
provide a relatively airtight environment for synaptic formation
and regulation. This demonstrates the complexity of synaptogenesis
and regulation in the CNS. The present study only revealed the
changes in α2δ1 and TSP1/2 expression in the tissue around the
hematoma following ICH. However, the possibility that the increased
expression of these proteins in the brain produces other unexpected
effects cannot be ruled out. For example, TSP1/2 proteins are
involved in regulating blood vessel regeneration following ICH
(19). However, it is not yet
clear whether the upregulation of α2δ1 increases intracellular
Ca2+ levels to exert an unexpected effect on neuron
recovery. The expression levels of α2δ1 and TSP1/2 in other areas
of the CNS and whether these serve a dominant role in the
regulation of synapses in different brain regions remains unclear;
thus, the regulatory mechanisms of synaptic recovery following
nerve injury warrant further investigation.
The findings of the present study suggested that the
expression levels of α2δ1 and TSP1/2 were increased in brain
tissues in response to ICH. These alterations may serve an
important role in the recovery of neurons and synapses in response
to the ischemia and hypoxia during ICH. The changes in the
molecular and cellular levels are the foundation of the
neurological functional recovery.
Acknowledgements
Not applicable.
Funding
Funding: The present study was supported by National Key R&D
Program Intergovernmental Cooperation on International Scientific
and Technological Innovation of the Ministry of Science and
Technology of China (grant no. 2017YFE0110400); National Natural
Science Foundation of China (grant no. 81870984); Hebei Natural
Science Foundation General Project-Beijing-Tianjin-Hebei Basic
Research Cooperation Project (grant no. H2018206675); Special
Project for the Construction of Hebei Province International
Science and Technology Cooperation Base (grant no. 193977143D);
Government-funded Project on Training of Outstanding Clinical
Medical Personnel and Basic Research Projects of Hebei Province in
the Year of 2017; and Government-funded Project on Training of
outstanding Clinical Medical Personnel and Basic Research Projects
of Hebei Province in the Year of 2019.
Availability of data and materials
The datasets generated and/or analyzed during the
current study are available in the SRA database repository
(https://www.ncbi.nlm.nih.gov/sra/?term=PRJNA797360).
The other datasets used and/or analyzed during the current study
are available from the corresponding author on reasonable
request.
Authors' contributions
BW, XL, NY, CN, LG and ZZ conceived and designed the
study. BW, XL, NY, LY, CN and LG collected data. BW, XL, NY, LY and
ZZ analyzed and interpreted the data. BW, XL, NY, LY, CN and LG
collected materials and samples. BW, XL, NY, CN, LG and ZZ drafted
the manuscript. BW and ZZ confirm the authenticity of all the raw
data. All the authors have read and approved the final
manuscript.
Ethics approval and consent to
participate
The animal experiments complied with the regulations
of the Animal Welfare Act of the National Institutes of Health
Guide for the Care and Use of Laboratory Animals (NIH Publication
no. 85-23, revised in 1996) and were approved by the Ethics
Committee of Hebei Medical University (IACUC Hebmu-Glp-2016017,
Shijiazhuang, China).
Patient consent for publication
Not applicable.
Competing interests
The authors declare that they have no competing
interests.
References
|
1
|
Qureshi AI, Mendelow AD and Hanley DF:
Intracerebral haemorrhage. Lancet. 373:1632–1644. 2009.PubMed/NCBI View Article : Google Scholar
|
|
2
|
Dancause N, Barbay S, Frost SB, Plautz EJ,
Chen D, Zoubina EV, Stowe AM and Nudo RJ: Extensive cortical
rewiring after brain injury. J Neurosci. 25:10167–10179.
2005.PubMed/NCBI View Article : Google Scholar
|
|
3
|
Ito U, Kuroiwa T, Nagasao J, Kawakami E
and Oyanagi K: Temporal profiles of axon terminals, synapses and
spines in the ischemic penumbra of the cerebral cortex:
Ultrastructure of neuronal remodeling. Stroke. 37:2134–2139.
2006.PubMed/NCBI View Article : Google Scholar
|
|
4
|
Liauw J, Hoang S, Choi M, Eroglu C, Choi
M, Sun GH, Percy M, Wildman-Tobriner B, Bliss T, Guzman RG, et al:
Thrombospondins 1 and 2 are necessary for synaptic plasticity and
functional recovery after stroke. J Cereb Blood Flow Metab.
28:1722–1732. 2008.PubMed/NCBI View Article : Google Scholar
|
|
5
|
Keep RF, Hua Y and Xi G: Intracerebral
haemorrhage: Mechanisms of injury and therapeutic targets. Lancet
Neurol. 11:720–731. 2012.PubMed/NCBI View Article : Google Scholar
|
|
6
|
Veltkamp R and Purrucker J: Management of
spontaneous intracerebral hemorrhage. Curr Neurol Neurosci Rep.
17(80)2017.PubMed/NCBI View Article : Google Scholar
|
|
7
|
Risher WC and Eroglu C: Thrombospondins as
key regulators of synaptogenesis in the central nervous system.
Matrix Biol. 31:170–177. 2012.PubMed/NCBI View Article : Google Scholar
|
|
8
|
Arikkath J and Campbell KP: Auxiliary
subunits: Essential components of the voltage-gated calcium channel
complex. Curr Opin Neurobiol. 13:298–307. 2003.PubMed/NCBI View Article : Google Scholar
|
|
9
|
Cole RL, Lechner SM, Williams ME,
Prodanovich P, Bleicher L, Varney MA and Gu G: Differential
distribution of voltage-gated calcium channel alpha-2 delta
(alpha2delta) subunit mRNA-containing cells in the rat central
nervous system and the dorsal root ganglia. J Comp Neurol.
491:246–269. 2005.PubMed/NCBI View Article : Google Scholar
|
|
10
|
Taylor CP and Garrido R: Immunostaining of
rat brain, spinal cord, sensory neurons and skeletal muscle for
calcium channel alpha2-delta (alpha2-delta) type 1 protein.
Neuroscience. 155:510–521. 2008.PubMed/NCBI View Article : Google Scholar
|
|
11
|
Zhang GF, Chen SR, Jin D, Huang Y, Chen H
and Pan HL: α2δ-1 Upregulation in primary sensory neurons promotes
NMDA receptor-mediated glutamatergic input in
resiniferatoxin-induced neuropathy. J Neurosci. 41:5963–5978.
2021.PubMed/NCBI View Article : Google Scholar
|
|
12
|
Luo Y, Ma H, Zhou JJ, Li L, Chen SR, Zhang
J, Chen L and Pan HL: Focal cerebral ischemia and reperfusion
induce brain injury through α2δ-1-bound NMDA receptors. Stroke.
49:2464–2472. 2018.PubMed/NCBI View Article : Google Scholar
|
|
13
|
Li J, Song G, Jin Q, Liu L, Yang L, Wang
Y, Zhang X and Zhao Z: The α2δ-1/NMDA receptor complex is involved
in brain injury after intracerebral hemorrhage in mice. Ann Clin
Transl Neurol. 8:1366–1375. 2021.PubMed/NCBI View Article : Google Scholar
|
|
14
|
Bornstein P: Matricellular proteins: An
overview. Matrix Biol. 19:555–556. 2000.PubMed/NCBI View Article : Google Scholar
|
|
15
|
Lawler J: The structural and functional
properties of thrombospondin. Blood. 67:1197–1209. 1986.PubMed/NCBI
|
|
16
|
Adams J and Lawler J: Extracellular
matrix: The thrombospondin family. Curr Biol. 3:188–190.
1993.PubMed/NCBI View Article : Google Scholar
|
|
17
|
Adams JC: Thrombospondins: Multifunctional
regulators of cell interactions. Annu Rev Cell Dev Biol. 17:25–51.
2001.PubMed/NCBI View Article : Google Scholar
|
|
18
|
Lawler J: Thrombospondin-1 as an
endogenous inhibitor of angiogenesis and tumor growth. J Cell Mol
Med. 6:1–12. 2002.PubMed/NCBI View Article : Google Scholar
|
|
19
|
Zhou HJ, Zhang HN, Tang T, Zhong JH, Qi Y,
Luo JK, Lin Y, Yang QD and Li XQ: Alteration of thrombospondin-1
and -2 in rat brains following experimental intracerebral
hemorrhage. Laboratory investigation. J Neurosurg. 113:820–825.
2010.PubMed/NCBI View Article : Google Scholar
|
|
20
|
Christopherson KS, Ullian EM, Stokes CC,
Mullowney CE, Hell JW, Agah A, Lawler J, Mosher DF, Bornstein P and
Barres BA: Thrombospondins are astrocyte-secreted proteins that
promote CNS synaptogenesis. Cell. 120:421–433. 2005.PubMed/NCBI View Article : Google Scholar
|
|
21
|
Eroglu C, Allen NJ, Susman MW, O'Rourke
NA, Park CY, Ozkan E, Chakraborty C, Mulinyawe SB, Annis DS,
Huberman AD, et al: Gabapentin receptor alpha2delta-1 is a neuronal
thrombospondin receptor responsible for excitatory CNS
synaptogenesis. Cell. 139:380–392. 2009.PubMed/NCBI View Article : Google Scholar
|
|
22
|
Yabkowitz R, Mansfield PJ, Ryan US and
Suchard SJ: Thrombospondin mediates migration and potentiates
platelet-derived growth factor-dependent migration of calf
pulmonary artery smooth muscle cells. J Cell Physiol. 157:24–32.
1993.PubMed/NCBI View Article : Google Scholar
|
|
23
|
Lin TN, Kim GM, Chen JJ, Cheung WM, He YY
and Hsu CY: Differential regulation of thrombospondin-1 and
thrombospondin-2 after focal cerebral ischemia/reperfusion. Stroke.
34:177–186. 2003.PubMed/NCBI View Article : Google Scholar
|
|
24
|
Andaluz N, Zuccarello M and Wagner KR:
Experimental animal models of intracerebral hemorrhage. Neurosurg
Clin N Am. 13:385–393. 2002.PubMed/NCBI View Article : Google Scholar
|
|
25
|
Rosenberg GA, Mun-Bryce S, Wesley M and
Kornfeld M: Collagenase-induced intracerebral hemorrhage in rats.
Stroke. 21:801–807. 1990.PubMed/NCBI View Article : Google Scholar
|
|
26
|
Livak KJ and Schmittgen TD: Analysis of
relative gene expression data using real-time quantitative PCR and
the 2(-Delta Delta C(T)) method. Methods. 25:402–408.
2001.PubMed/NCBI View Article : Google Scholar
|
|
27
|
Davies A, Hendrich J, Van Minh AT, Wratten
J, Douglas L and Dolphin AC: Functional biology of the
alpha(2)delta subunits of voltage-gated calcium channels. Trends
Pharmacol Sci. 28:220–228. 2007.PubMed/NCBI View Article : Google Scholar
|
|
28
|
Risher WC, Kim N, Koh S, Choi JE, Mitev P,
Spence EF, Pilaz LJ, Wang D, Feng G, Silver DL, et al:
Thrombospondin receptor α2δ-1 promotes synaptogenesis and
spinogenesis via postsynaptic Rac1. J Cell Biol. 217:3747–3765.
2018.PubMed/NCBI View Article : Google Scholar
|
|
29
|
Buosi AS, Matias I, Araujo APB, Batista C
and Gomes FCA: Heterogeneity in synaptogenic profile of astrocytes
from different brain regions. Mol Neurobiol. 55:751–762.
2018.PubMed/NCBI View Article : Google Scholar
|
|
30
|
Tsai HH, Li H, Fuentealba LC, Molofsky AV,
Taveira-Marques R, Zhuang H, Tenney A, Murnen AT, Fancy SP, Merkle
F, et al: Regional astrocyte allocation regulates CNS
synaptogenesis and repair. Science. 337:358–362. 2012.PubMed/NCBI View Article : Google Scholar
|
|
31
|
Heller JP and Rusakov DA: Morphological
plasticity of astroglia: Understanding synaptic microenvironment.
Glia. 63:2133–2151. 2015.PubMed/NCBI View Article : Google Scholar
|