Introduction
Normal-tension glaucoma (NTG) is associated with
high rates of blindness is and characterized by chronic and
progressive damage to the optic nerve. The intraocular pressure in
patients with this type of glaucoma is within the normal range.
Therefore, symptoms (e.g., eye distension and pain) are frequently
absent and the disease onset is insidious, potentially leading to
delayed diagnosis and treatment. Symptoms become obvious to
patients only when the damage to the visual field is extensive. In
recent years, the incidence of NTG in China has been increasing
(1) and the prevalence is
relatively high in middle-aged and elderly individuals (2-4).
There are currently no effective indicators for the early diagnosis
of NTG; hence, misdiagnosis is common (5). With the in-depth study of the
pathogenesis of glaucoma and the development of imaging
technologies, optical coherence tomography angiography (OCTA) and
voxel-based morphometry with diffeomorphic anatomical registration
through exponentiated lie algebra (VBM-DARTEL) have been widely
used in measurement studies of a variety of diseases, and may
accurately display small changes in tissue morphology (6-8).
In the present study, OCTA technology was used for the quantitative
and accurate detection of optic disc blood vessels in patients with
NTG, while VBM-DARTEL technology was used for the study of brain
structural changes in patients with NTG. In the present study, the
correlation between the two functional indices was analyzed.
Furthermore, the possible pathological changes and damage
mechanisms associated with NTG are discussed, providing novel ideas
for the early diagnosis of NTG.
Materials and methods
Participants
A total of 30 patients with NTG (60 eyes in total;
15 males and 15 females; all with bilateral NTG; average age,
52.6±9.4 years; mean duration of NTG, 8.3±2.6 years) were recruited
from the First Affiliated Hospital of Nanchang University
(Nanchang, China). Furthermore, 30 healthy controls (HCs; 60 eyes
in total; 15 males and 15 females) with comparable characteristics
(sex, age and educational status) to those of the patients with NTG
were enrolled. The methods and protocols of the present study were
approved by the Medical Ethics Committee of the First Affiliated
Hospital of Nanchang University (Nanchang, China), and were in
accordance with the principles of the Declaration of Helsinki. All
subjects were informed regarding the objectives and content of the
study and latent risks, and provided written informed consent prior
to their participation. Detailed review of the medical history and
data collection was performed for all subjects. Furthermore, all
subjects underwent a routine ophthalmological examination, anterior
chamber angle microscopy, central corneal thickness and ocular axis
assessments, ultrasound biological microscopy, OCTA, fundus
photography and computer-assisted visual field examination. The
criteria for inclusion in the NTG group were as follows (9): Intraocular pressure <21 mmHg in
both eyes for 24 h without the administration of anti-glaucoma
drugs; open anterior chamber angle; presence of characteristic
optic papillary damage for glaucoma; typical visual field loss for
glaucoma; and absence of other eye diseases and systemic diseases
that may cause changes to the optic disc and visual field,
including previous traumatic increase of intra-ocular pressure,
long-term use of corticosteroids and history of uveitis.
OCTA scans of the disc area
All subjects of the present study underwent scanning
of the optic disc area using the Angio Vue OCTA angiography system
(Optovue, Inc.) with the Angio Disc (4.5x4.5 mm) standard
quantization program. All examinations were performed by a single
operator. The subject maintained their position, placed their jaw
on the mandible bracket, placed their forehead on the forehead band
and stared at the fixed light. The examiner adjusted the subject's
gaze and scanning situation through the monitoring screen. The
image acquisition for each scan was completed within 3 sec. The
scanner used the optic disc as the center and scanned an area
4.5x4.5 mm to reveal the distribution of blood vessels in the optic
disc region. The quality of the blood flow images was determined
according to the signal intensity. When the signal intensity value
was <50, the subjects were re-scanned or excluded from further
analysis. Only high-quality images without any motion artifacts and
vitreous floats were selected for analysis. Owing to the lack of a
unified analysis system for vascular parameters in the optic disc
region, the contour map was drawn using the method of local fractal
dimension and the acquired images were quantitatively analyzed
(10). Areas with a standard pixel
ratio of 0.9-1.0 represented the large vessels of the optic disc
(i.e., retinal arteries and veins), while the small vessels (i.e.,
retinal capillaries) had ratios of 0.7-0.9, the non-vascular areas
had ratios of 0-0.3 and the other areas corresponded to capillary
gaps (11). In the present study,
the ratio of the area of blood vessels in the scanned area (4.5x4.5
mm) denoted the blood vessel density in the optic disc area,
including the large-vessel density (%), capillary density (%),
capillary gap density (%) and avascular zone density (%). All of
these analyses were performed using Matlab7.11R2010b (MathWorks) to
observe and evaluate the vascular density and structural damage in
the NTG optic disc area. When calculating blood vessel density,
there was no requirement to take retinal image amplification into
account. There was no refractive error and the eye axis was in the
normal range in all patients, so no correction was required when
calculating vascular density with OCTA (11).
VBM-DARTEL data acquisition and
processing
Data were acquired using a Siemens 3.0 T
superconducting MRI scanner (Siemens AG). A sagittal image was used
as the reference, with the thalamus as the center of the stratum
and the scan baseline parallel to the anterior and posterior joint
lines. The sagittal three-dimensional T1-weighted image
high-resolution magnetization was used to prepare a fast gradient
back. The wave sequence was a full brain scan. The specific
scanning sequence and parameters were as follows: Repetition time,
2,300 msec; echo time, 2.98 msec; field of view, 256x256 mm;
matrix, 256x256 pixels; number of layers, 192; layer thickness, 2
mm; layer spacing, 0 mm; flip angle, 150˚; and voxel size, 1xlxl
mm. The raw data were imported into the computer during
pre-processing, and the VBM-DARTEL software package equipped with
SPM8 (Wellcome Department of Cognitive Neurology, Institute of
Neurology, University College London) was used for image processing
on the Matlab7.11R2010b (MathWorks). After spatial pre-processing,
smoothing and modulation, the images of the gray and white matter
and cerebrospinal fluid were segmented and adopted. The DARTEL
registration generated the optimal template to normalize the image
map. Subsequently, parametric statistical tests were used to
individually compare the components of the segmented brain tissue,
and the density and volume of the gray and white matter were
quantitatively measured to determine any abnormalities in brain
morphology.
Statistical analysis
Values are expressed as the mean ± standard
deviation and were analyzed using the SPSS version 19.0 statistical
software (IBM Corp.). Analysis of variance was used to evaluate
differences in general data and the visual field detection indices
between the two groups. A paired-samples t-test was used to compare
the differences in blood vessel density and brain parenchyma
between the two groups. The Pearson parametric correlation test was
used to analyze the correlations between blood vessel density
around the optic disc and changes in brain parenchyma. P<0.05
was considered to indicate statistical significance. The area under
ROC (receiver operating characteristic curve) was used to evaluate
the diagnostic rate.
Results
Comparative analysis of general data
and visual field detection indicators between the two groups
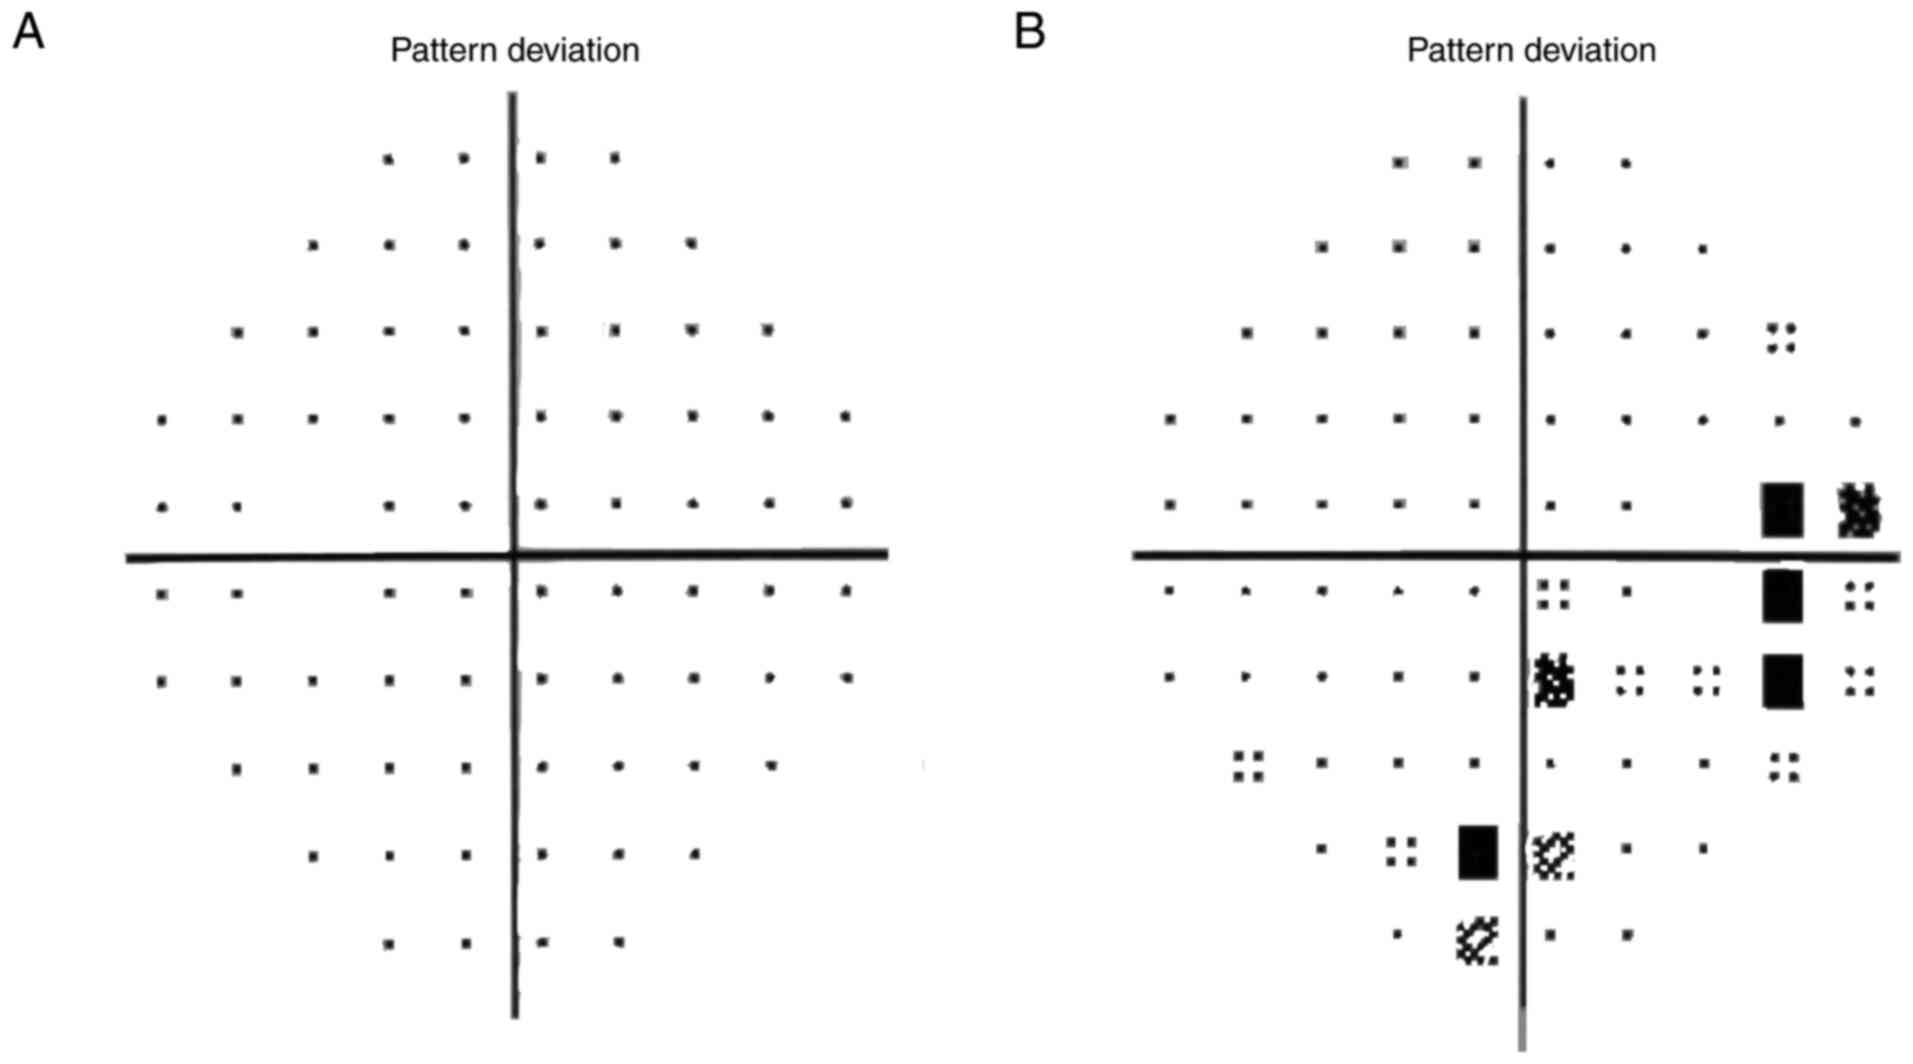
Regarding the clinical data, there were no
statistically significant differences in terms of age, sex, weight,
blood pressure, educational level or intraocular pressure between
the two groups. By contrast, the best-corrected visual acuity and
visual field mean defect were significantly different (P<0.001;
Table I, Fig. 1).
 | Table IComparison of general data and visual
field detection indexes between NTG group and HCs. |
Table I
Comparison of general data and visual
field detection indexes between NTG group and HCs.
| Characteristic | NTG (n=30) | HCs (n=30) | t | P-value |
|---|
| Age (years) | 52.62±9.44 | 56.92±10.87 | -0.437 | 0.835 |
| Males/females | 15/15 | 15/15 | N/A | >0.99 |
| Body weight (kg) | 67.87±7.62 | 66.12±6.14 | 0.132 | 0.874 |
| Systolic blood
pressure (mmHg) | 127.73±17.32 | 128.85±17.57 | -0.164 | 0.802 |
| Diastolic blood
pressure (mmHg) | 83.89±10.74 | 84.76±11.58 | -0.217 | 0.797 |
| Education level
(years) | 11.63±3.44 | 10.68±2.72 | 0.563 | 0.523 |
| Best-corrected visual
acuity | 0.62±0.24 | 1.0±0.13 | -8.378 | <0.001 |
| Intraocular pressure
(mmHg) | 15.75±1.74 | 16.02±1.69 | -0.164 | 0.703 |
| Average visual field
defect (dB) | -9.86±6.65 | 0.23±0.12 | -9.824 | <0.001 |
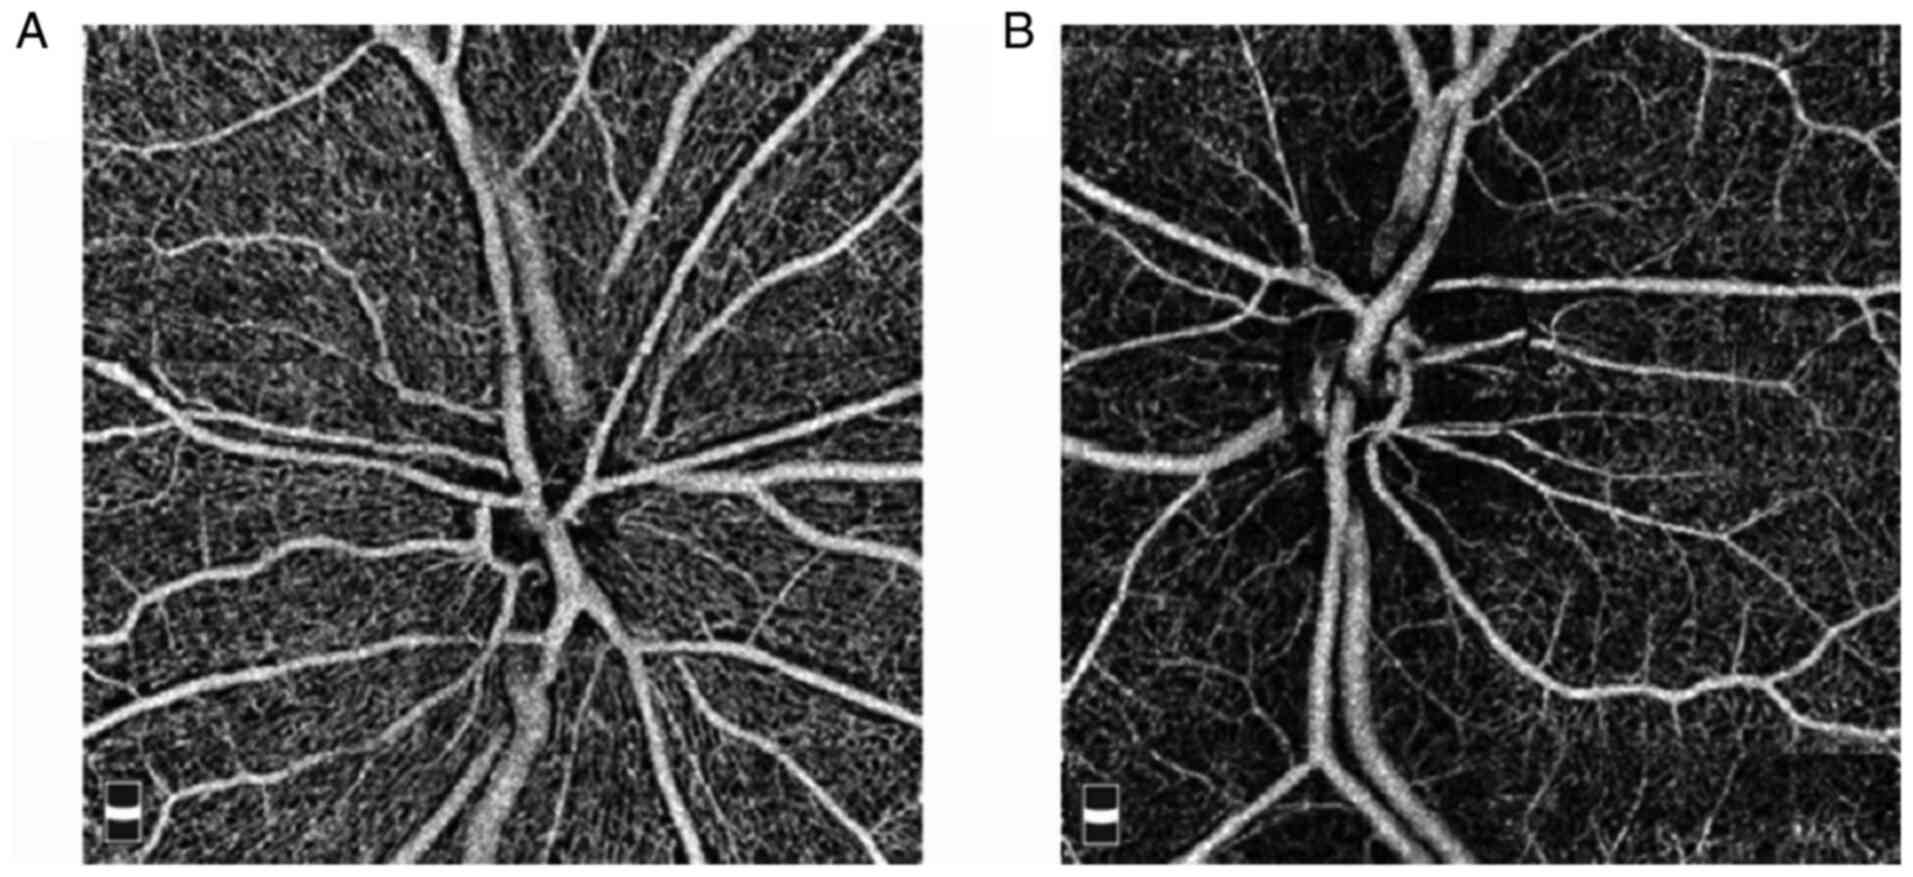
Contrastive analysis of vascular
density parameters in the optic disc area from OCTA scanning
The density of large vessels, capillaries and
whole-area vessels in the patients with NTG was significantly lower
than that in the HCs (P<0.001). However, the density of the
capillary gap and avascular zone in the patients with NTG was
significantly higher than that in the HCs (P<0.01; Table II, Fig.
2).
| Table IIComparative analysis of optical
coherence tomography angiography vascular parameters between NTG
group and HCs. |
Table II
Comparative analysis of optical
coherence tomography angiography vascular parameters between NTG
group and HCs.
| Indicators | NTG (n=30) | HCs (n=30) | t | P-value |
|---|
| Macrovascular
density | 21.32±5.97 | 30.52±7.31 | -4.318 | <0.001 |
| Capillary
density | 17.72±6.12 | 30.37±6.98 | -4.742 | <0.001 |
| Capillary gap
density | 35.40±8.39 | 28.02±4.63 | 3.975 | <0.001 |
| Density of avascular
zone | 25.56±5.28 | 10.09±2.35 | 6.448 | <0.001 |
| Regional vascular
density | 39.04±5.97 | 60.89±8.86 | -4.471 | <0.001 |
Comparison of whole-brain gray matter,
white matter and brain parenchymal volume through VBM-DARTEL
The results of the VBM-DARTEL analysis indicated
that the volume percentages of whole-brain gray matter, white
matter and brain parenchyma were not significantly different
between the NTG and HC groups (P>0.05). The volume of local gray
matter areas [i.e., the left middle frontal gyrus (LMFG), right
superior frontal gyrus (RSFG), right precuneus (RP) and right
angular gyrus (RAG)] decreased; however, there was no increase
observed in the gray matter area (P<0.05). The volume of the
white matter decreased in the RMOG, whereas it increased in the RPG
(P<0.001; Tables III and
IV, Fig. 3).
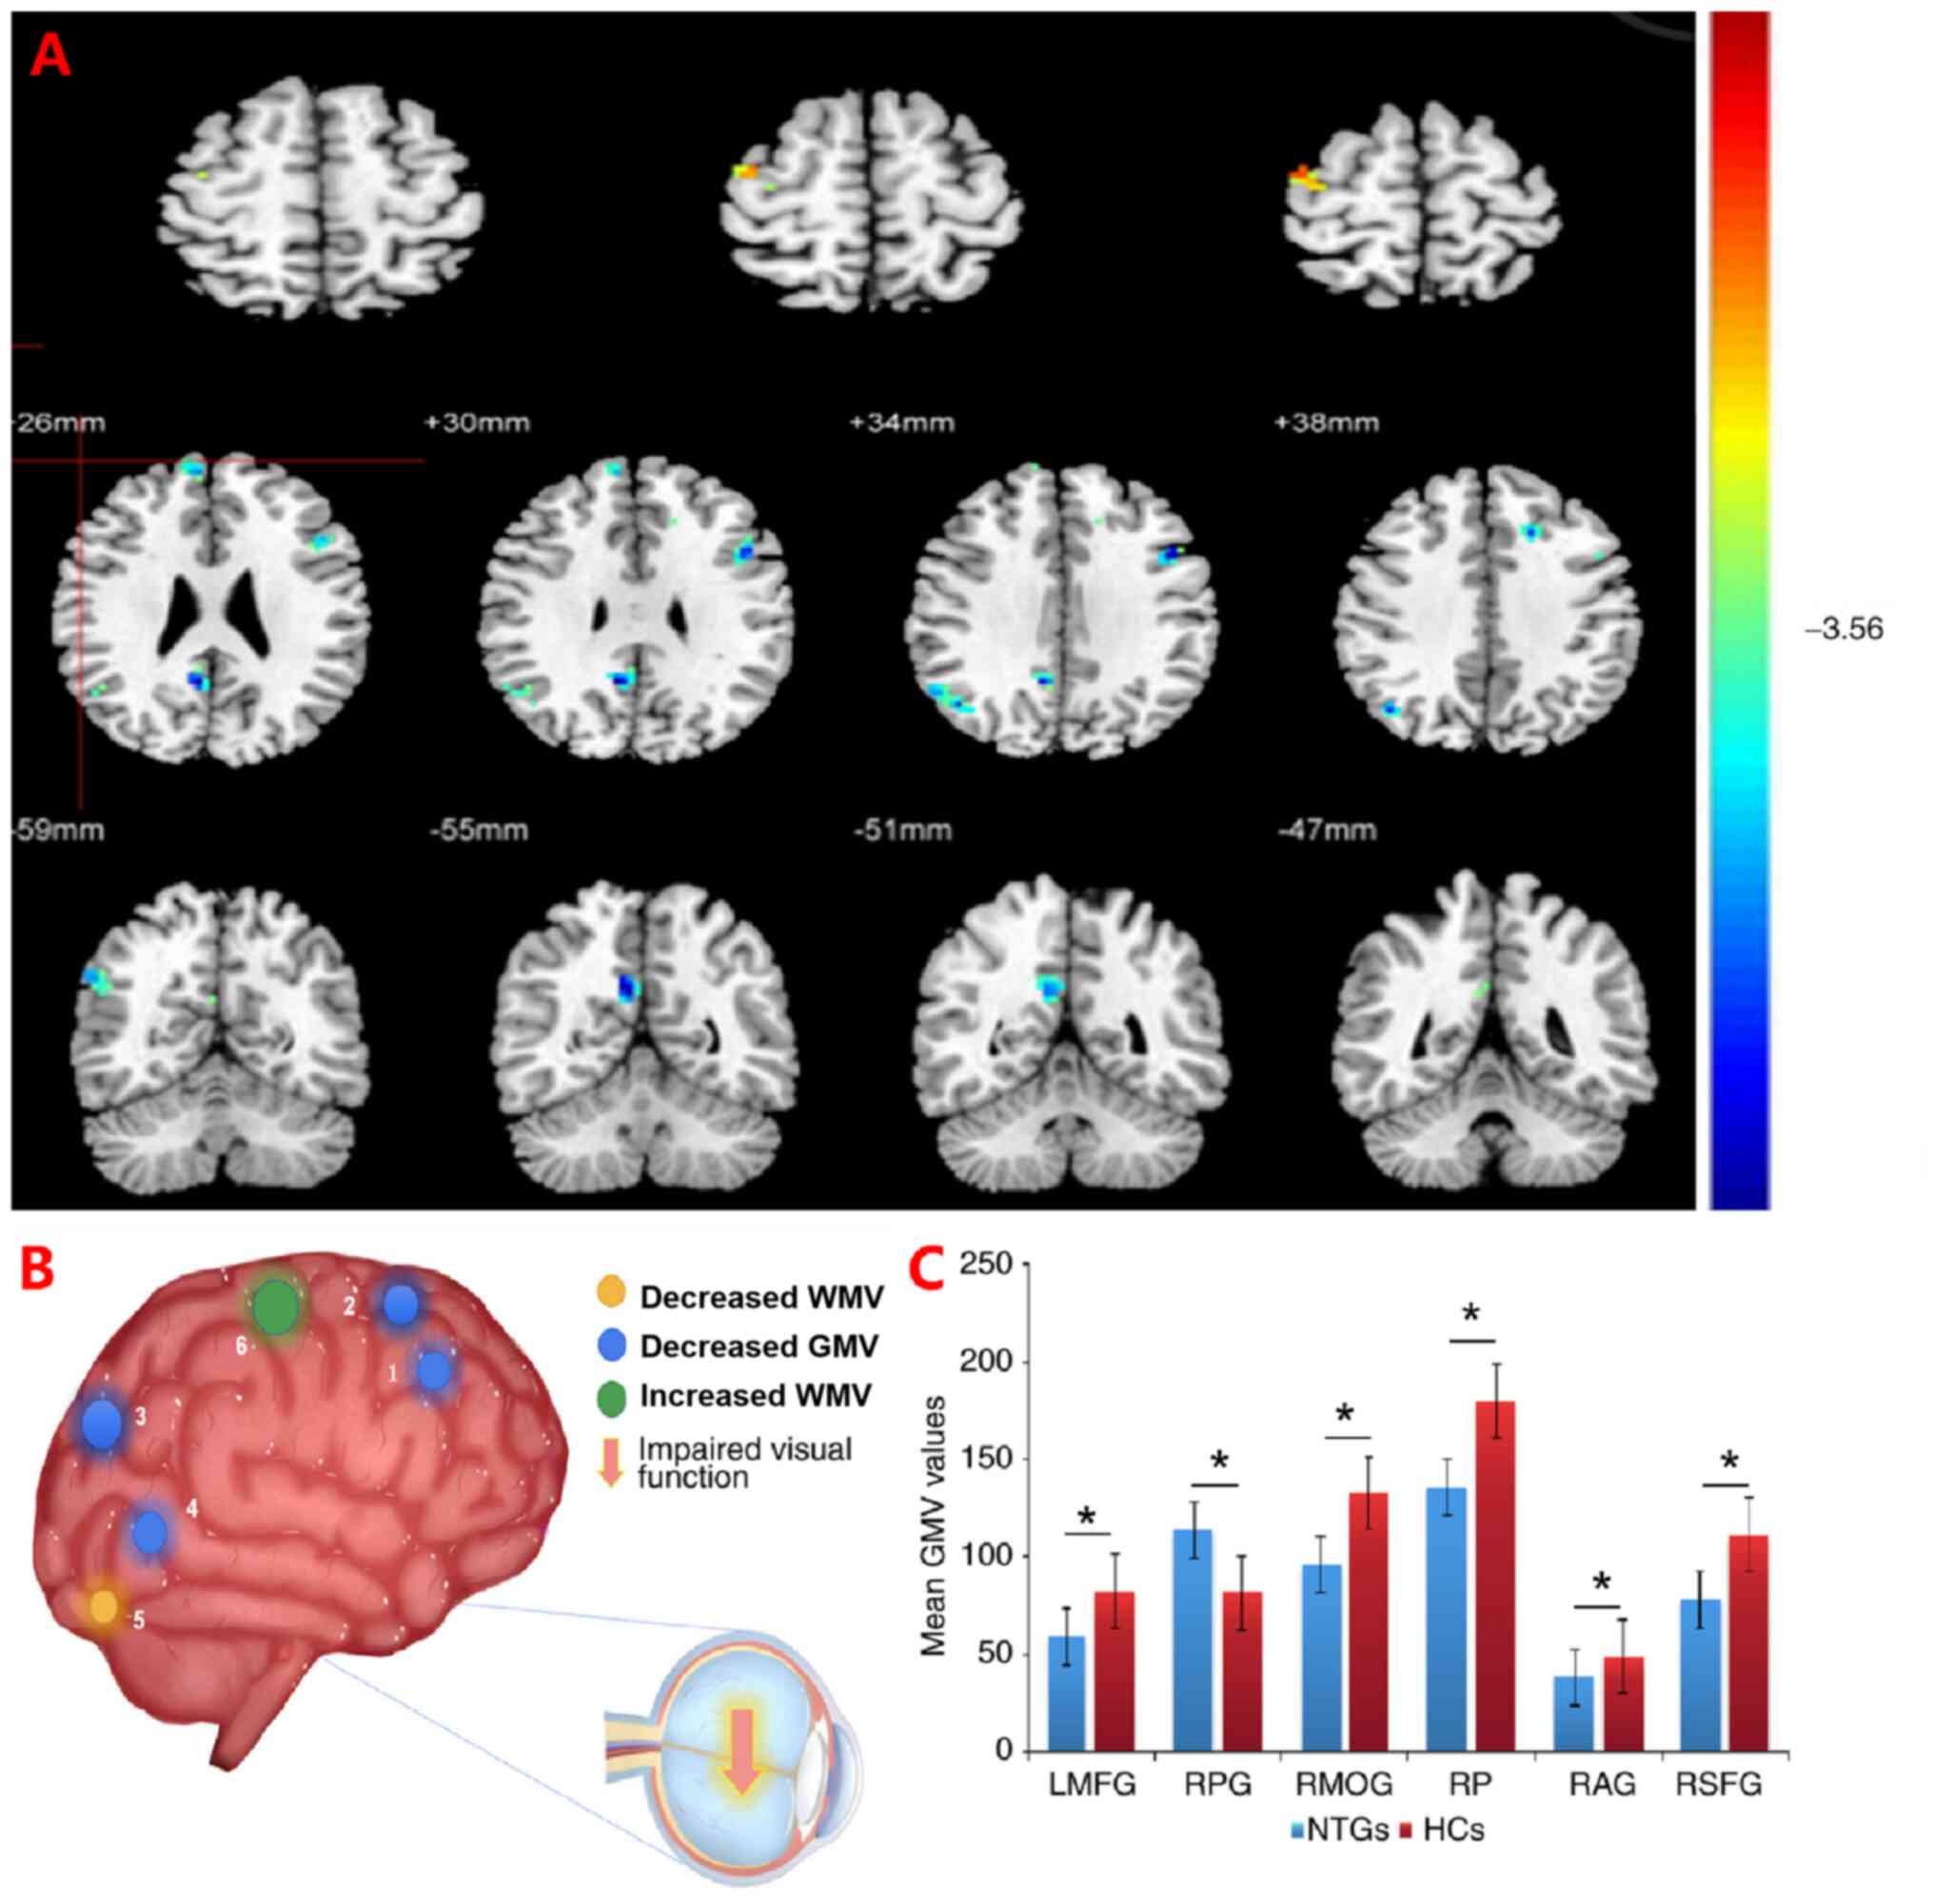 | Figure 3Significant differences in local brain
volume between patients with NTG and HCs. (A) Brain regions with
significant differences. The sizes of the spots denote the degree
of quantitative changes. Differences were observed in the LMFG,
RSFG, RP, RAG, RMOG and RPG. The yellow areas denote brain areas
with a lower WMV and the green areas denote brain areas with a
higher WMV in brain areas, while the blue areas denote brain
regions with lower GMV in patients with NTG vs. HCs (P<0.001 for
multiple comparisons using Gaussian random-field theory (z.2.3;
P<0.001; cluster: >13 voxels; Alphasim-corrected). (B) 1-6
denote RSFG, LMFG, RAG, RP, RMOG and RPG, respectively. (C) Mean
values of GMV were compared between the NTG group and HC group. The
statistical threshold was set as voxels with P<0.01 for multiple
comparisons using family-wise error correction (z>2.3;
P<0.01; cluster: >40 voxels). *P<0.05. NTG,
normal tension glaucoma; HCs, healthy controls; GMV, gray matter
volume; WMV, white matter volume; LMFG, left middle frontal gyrus;
RPG, right precentral gyrus; RMOG, right middle occipital gyrus;
RP, right precuneus; RAG, right angular gyrus; RSFG, right superior
frontal gyrus. |
| Table IIIComparison of volume results of
cerebral gray matter, white matter and cerebral parenchyma between
NTG group and HCs. |
Table III
Comparison of volume results of
cerebral gray matter, white matter and cerebral parenchyma between
NTG group and HCs.
| Indicators | NTG | HCs | t | P-value |
|---|
| Ectocinerea | 715.3±62.7 | 706.9±59.3 | 0.581 | 0.543 |
| White matter | 332.8±45.3 | 344.5±48.6 | -0.941 | 0.325 |
| Brain substance | 1,061.3±102.4 | 1,052.6±100.8 | 0.366 | 0.366 |
| Table IVComparison of different brain regions
in local volume of brain essence between normal tension glaucoma
group and healthy controls. |
Table IV
Comparison of different brain regions
in local volume of brain essence between normal tension glaucoma
group and healthy controls.
| Brain region | Brodmann
division | MNI coordinates (x,
y, z) | Voxels (units) | t | P-value |
|---|
| Decreased volume of
gray matter in brain | | | | | |
|
Left middle
frontal gyrus | 9 | -35, 1,37 | 56 | 2.923 | <0.001 |
|
Right
superior frontal gyrus | 32 | 10, 32, 46 | 76 | 3.561 | <0.001 |
|
Right
precuneus | 7 | 9, -59, 30 | 141 | 4.833 | <0.001 |
|
Right
angular gyrus | 39 | 45, -55, 33 | 37 | 3.764 | <0.001 |
| White matter volume
reduction area | | | | | |
|
Right middle
occipital gyrus | 18 | 37, -74, 21 | 89 | 2.431 | <0.001 |
| White matter volume
enlargement area | | | | | |
|
Right
precentral gyrus | 4 | 32, -17, 56 | 117 | 4.982 | <0.001 |
Comparison of the diagnostic efficacy
of brain regions with local volume differences in the NTG
group
ROC curves for the diagnosis of NTG were drawn for
the LMFG, RPG, RMOG, RP, RAG and RSFG (Fig. 4). Each index exhibited high
diagnostic efficacy. Larger areas under the curve (AUC) denoted
higher diagnostic rates. The right middle occipital region
exhibited the highest diagnostic efficacy (AUC=0.918,
P<0.001).
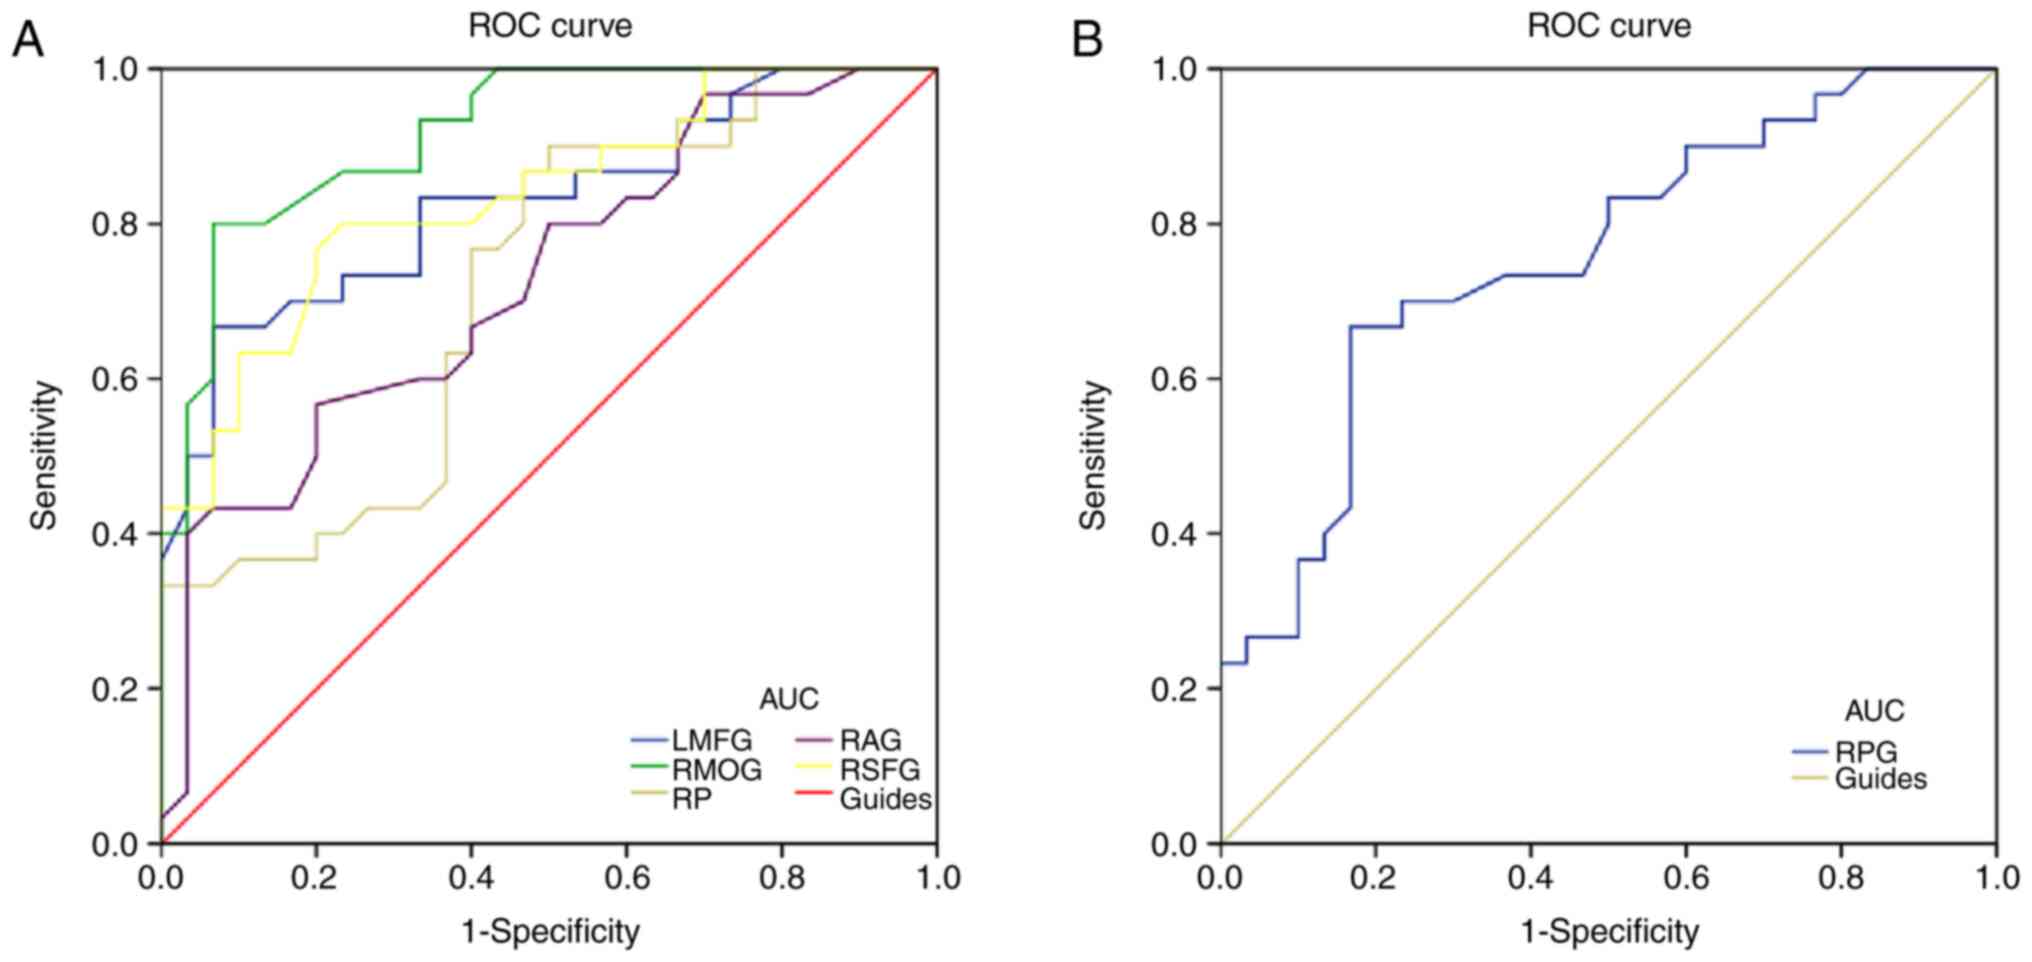 | Figure 4ROC curve analysis of the normal
tension glaucoma mean gray matter volume values for altered brain
regions. (A) AUC in brain areas with significant differences: LMFG,
0.827 (P<0.001; 95% CI: 0.722-0.932); RMOG, 0.918 (P<0.001;
95% CI: 0.851-0.985); RP, 0.718 (P=0.004; 95% CI: 0.588-0.847);
RAG, 0.726 (P=0.003; 95% CI: 0.598-0.853); and RSFG, 0.834
(P<0.001; 95% CI: 0.733-0.935). (B) The area under the ROC curve
for RPG was 0.757 (P=0.001; 95% CI: 0.635-0.879). ROC, receiver
operating characteristic; AUC, area under the ROC curve; LMFG, left
middle frontal gyrus; RMOG, right middle occipital gyrus; RP, right
precuneus; RAG, right angular gyrus; RSFG, right superior frontal
gyrus; RPG, right precentral gyrus. |
Correlation between the local volume
difference and vascular density of the optic disc area in the NTG
group
In the NTG group, the brain regions with local
volume differences in gray and white matter were correlated with
the vascular density of the optic disc region. The vascular density
of the optic disc region was positively correlated with the voxel
value of the LMFG (r=0.748, P≤0.001), RSFG (r=0.451, P≤0.001), the
RP (r=0.894, P≤0.001), the RP (r=0.367, P≤0.001) and the right
occipital middle (r=0.846, P≤0.001). Furthermore, the vascular
density of the optic disc region was negatively correlated with the
voxel value of the right central anterior gyrus (r=-0.513,
P≤0.001). Therefore, the voxel value of the RP exhibited the
strongest correlation with the vascular density of the optic disc
region (r=0.894, P≤0.001), whereas that of the RAG exhibited the
weakest correlation (r=0.367, P≤0.001; Fig. 5).
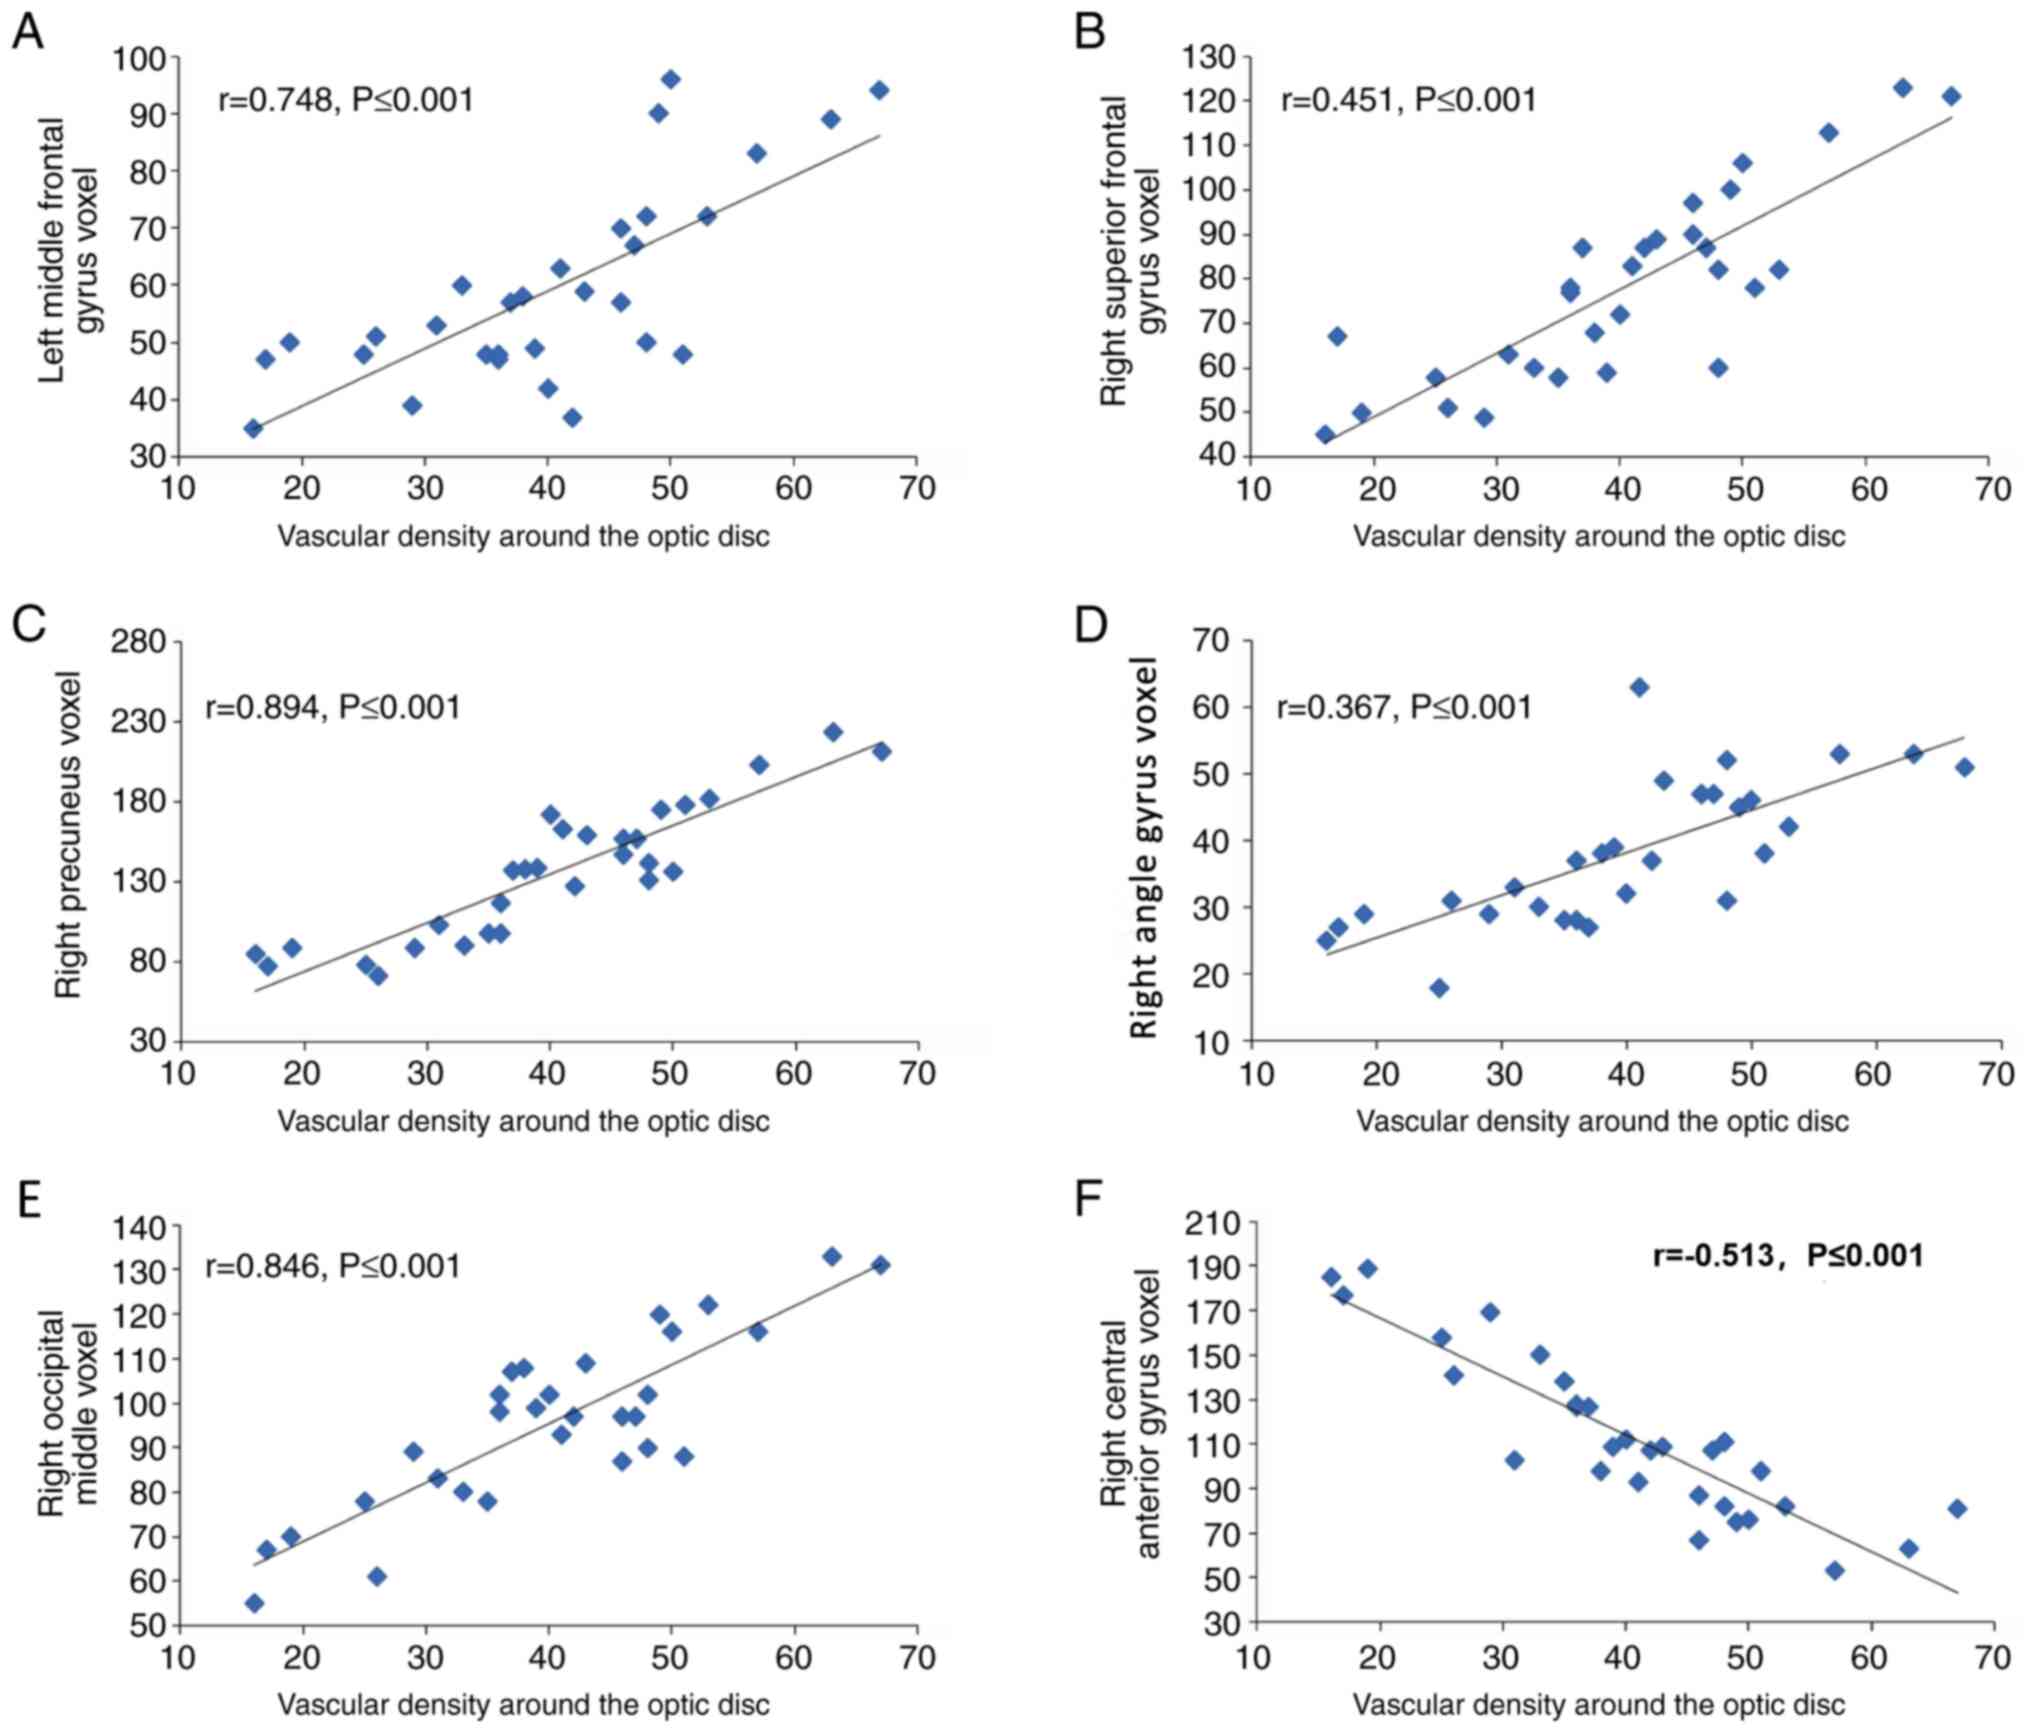 | Figure 5Correlations between the local volume
difference and the vascular density of the optic disc area in the
normal tension glaucoma group. The vascular density of the optic
disc region was positively correlated with the voxel value of the
(A) left middle frontal gyrus voxel (r=0.748, P≤0.001), (B) left
middle frontal gyrus voxel (r=0.451, P≤0.001), (C) right precuneus
(r=0.894, P≤0.001), (D) right angle (r=0.367, P≤0.001), (E) right
occipital middle (r=0.846, P≤0.001). (F) The vascular density of
the optic disc region was negatively correlated with the voxel
value of the right central anterior gyrus (r=0.513, P≤0.001). |
Discussion
NTG is a condition associated with chronic and
progressive damage to the optic nerve and is associated with high
rates of blindness. The etiology and pathogenesis of this specific
type of glaucoma remain to be fully elucidated. In the clinical
setting, it is not obvious in the early stage and is often missed
or misdiagnosed. The disease is not confirmed until the patient
presents with typical glaucoma fundus changes and visual field
defects. Due to the particularity and complexity of the clinical
manifestations, diagnosis and prognosis of NTG, effective
diagnostic methods for NTG have been frequently debated worldwide,
and there is currently no unified standard. In recent years, an
increasing number of scholars have suggested that glaucoma is not
simply an eye disease but also a central nervous system disease
(12-14).
NTG and other brain diseases may exhibit similar or partially
similar pathogeneses in the central nervous system. These
similarities are of great importance for studying the etiology and
pathogenesis of NTG. Morphological imaging using novel technologies
(i.e., OCTA and VBM-DARTEL) has attracted considerable attention
from clinicians. These technologies are used in research on
glaucoma owing to their non-invasiveness, sensitivity,
objectiveness, accuracy and reproducibility (11). Therefore, OCTA and VBM-DARTEL
technologies may be used to accurately display the subtle changes
in the morphology and structure of the eye and brain tissues, study
the characteristic structural changes of the eye and brain in NTG,
discover differences between patients with NTG and healthy
individuals and identify anatomical changes in patients with early
NTG. From these data, the correlation between the vascular density
in the optic disc region of patients with NTG and brain changes may
be examined. The local volume of gray matter and white matter and
the voxel value of each brain region were detected by using
VBM-DARTEL analysis and the vascular density of the optic disc
region was detected by OCTA. The correlation analysis indicated an
association between the measurements obtained with the two
technologies. These analyses are conducive to better understanding
the nature of the disease and may be used as an effective tool for
exploring means of early diagnosis, the disease process and
internal pathological changes of NTG. In the present study, OCTA
was used to measure the vascular density in the optic disc area of
patients with NTG as well as HC volunteers. The brain structure was
analyzed using VBM-DARTEL with a 3.0 T MRI instrument. OCTA is a
newly developed non-invasive fundus blood flow imaging technology.
It is able to rapidly obtain vascular images of the optic disc and
retina. Compared with traditional optical coherence tomography,
OCTA has a higher resolution and faster scanning speed, and offers
the advantages of real-time and non-invasive examination. It is
able to quantitatively measure the vascular density of the optic
disc and the surrounding retina using designated measurement
software. It is a novel method currently used to detect the local
microcirculation in the optic disc, allowing for early
identification of glaucoma (15-18).
The present study indicated that the vascular density in the optic
disc region of the patients with NTG was significantly decreased
compared with that in the HCs, and it increased with disease
progression. These results suggested that the vascular density
around the optic disc and in the entire region gradually decreases
with disease progression. Other studies have also suggested that
the vascular density in the deep retina decreases with disease
progression (19-23).
Therefore, the vascular density in the optic disc region has a
higher diagnostic value for NTG and provides a novel method for the
evaluation of this disease.
Processing of images with the VBM-DARTEL method
indicated that the NTG group did not exhibit any significant
differences in whole-brain gray matter, white matter or volume of
brain parenchyma compared with those of the HCs. The volume of
local gray matter areas (i.e., in the LMFG, RSFG, RP and RAG)
decreased; however, there was no increase in the gray matter area.
The volume of white matter in the RMOG decreased, whereas that in
the right anterior central gyrus increased. The AUC values of the
ROC curves for the diagnosis of NTG in these regions based on a
local volume difference were all >0.5, indicating high
diagnostic efficacy. In the NTG group, a good linear correlation
between the regional volume change in brain structure and the
vascular density of the optic disc was determined. The brain
structure and the vascular density of the optic disc were able to
provide a variety of non-invasive, reliable and reproducible
indicators for the diagnosis of NTG. It was determined that NTG may
not cause any changes in gray matter, white matter or brain
parenchymal volume of the entire brain. This result may be due to
the small number of samples included in the present study.
Therefore, multicenter research studies with larger sample sizes
are warranted.
The present study indicated that NTG is
characterized by volume changes in the local gray and white matter
in the brain, and these changes mainly involve a volume reduction.
The changes in brain structure are mainly concentrated in the
frontal lobe (LMFG, RSFG, right anterior central gyrus), occipital
lobe (RP and RMOG) and parietal lobe (RAG). The frontal lobe has a
specific role in emotional decision-making, emotional
self-regulation and inhibition of reaction. A study demonstrated
that patients with glaucoma exhibit various degrees of functional
deficits in emotional regulation, which may be closely linked to
structural damage and dysfunction of this region in the frontal
lobe (24). Similar to the results
obtained in the present study, other studies have indicated that
glaucoma is closely linked to various degenerative diseases of the
central nervous system, mainly manifested by extensive atrophy of
the brain (8,24). However, the observed increase in
volume in the right anterior central gyrus is not in accordance
with the results of the present study, and the specific mechanism
underlying this difference remains elusive.
As the visual center, the occipital lobe is mainly
involved in the functional activities of visual formation and
perception. In the present study, the reduction in the volume of
the right middle occipital gyrus in the occipital lobe region of
patients with NTG was also supported by the fact that the occipital
lobe exhibited local atrophy in such patients. The parietal lobe is
an important region that connects the somatosensory, visual and
auditory systems of the brain (24). The specific mechanism underlying the
changes in the parietal lobe caused by damage to the angular gyrus
in NTG remains elusive. However, the present evidence confirms, to
a certain extent, the close association between glaucoma and
central neuropathy. Chen et al (8), Li et al (24), Williams et al (25) and Wang et al (26) used magnetic resonance technology to
study the pathogenesis of glaucoma from multiple perspectives,
demonstrating changes in the total visual pathway from the retina
to the visual cortex. They identified lesions in numerous
associated brain regions that correlated with disease severity. In
different studies, the abnormal brain areas are not exactly the
same, but they all go beyond the visual cortex, suggesting that
glaucoma may have a wide impact on the nervous system. Hence,
damage associated with glaucoma is complex and extensive (27,28).
In conclusion, OCTA and VBM-DARTEL technologies were
used to detect a wide range of ocular and cerebral parenchymal
structural abnormalities in patients with NTG, identifying a
significant correlation between the two. These technologies are
expected to provide non-invasive diagnostic imaging support to
improve the clinical diagnosis of early NTG, therapies and
prediction of prognosis, as well as facilitate the exploration of
the pathophysiology of NTG. However, additional multicenter studies
with larger sample sizes are warranted to verify the value of these
technologies in assessing the anatomical structure and function in
patients with NTG.
Acknowledgements
Not applicable.
Funding
Funding: The present study was funded by the National Natural
Science Foundation of China (grant no. 81660163), Jiangxi
Provincial Key Research and Development Program (grant no.
20171BBG70097), Jiangxi Science and Technology Support Program
(grant no. 20161BBG70164), Jiangxi Provincial Department of
Education Science and Technology Project (grant no. GJJ150242) and
the Jiangxi Provincial Health Planning Commission Science and
Technology Project (grant nos. 20155131 and 20181032).
Availability of data and materials
The datasets used and/or analyzed during the current
study are available from the corresponding author on reasonable
request.
Authors' contributions
HLL and YS designed the study. QZ and CGP recruited
healthy controls. JJ performed MRI scanning. TP, BL and XMC
collected and analyzed the data. HLL wrote the manuscript. HLL and
YS confirm the authenticity of all the raw data. All authors read
and approved the final manuscript.
Ethics approval and consent to
participate
The methods and protocols of the study were approved
by the Medical Ethics Committee of the First Affiliated Hospital of
Nanchang University (Nanchang, China) and followed the principles
of the Declaration of Helsinki. All subjects were informed of the
objectives and content of the study and latent risks, and then
provided written informed consent to participate.
Patient consent for publication
Not applicable.
Competing interests
The authors declare that they have no competing
interests.
References
|
1
|
Glaucomatology Group, Ophthalmology
Branch, Chinese Medical Association, Editorial Committee of Chinese
Ophthalmological Journal, Chinese Medical Association. Expert
consensus on diagnosis and treatment of primary glaucoma. Chin J
Ophthalmol. 44:862–863. 2008.(In Chinese).
|
|
2
|
Anderson DR: Normal Tension Glaucoma
Study. Collaborative normal tension glaucoma study. Curr Opin
Ophthalmol. 14:86–90. 2003.PubMed/NCBI View Article : Google Scholar
|
|
3
|
Yoshida M, Okada E, Mizuki N, Kokaze A,
Sekine Y, Onari K, Uchida Y, Harada N and Takashima Y: Age-specific
prevalence of open-angle glaucoma and its relationship to
refraction among more than 60,000 asymptomatic Japanese subjects. J
Clin Epidemiol. 54:1151–1158. 2001.PubMed/NCBI View Article : Google Scholar
|
|
4
|
Kim JM, Jeoung JW, Bitrian E, Supawavej C,
Mock D, Park KH and Caprioli J: Comparison of clinical
characteristics between Korean and western normal-tension glaucoma
patients. Am J Ophthalmol. 155:852–857. 2013.PubMed/NCBI View Article : Google Scholar
|
|
5
|
Quigley HA and Broman AT: The number of
people with glaucoma worldwide in 2010 and 2020. Br J Ophthalmol.
90:262–267. 2006.PubMed/NCBI View Article : Google Scholar
|
|
6
|
Ashburner J: A fast diffeomorphic image
registration algorithm. Neuroimage. 38:95–113. 2007.PubMed/NCBI View Article : Google Scholar
|
|
7
|
Zhou K, Cai J and Xiong G: Comparison of
diagnostic value of two VBM algorithms for MRI of Alzheimer's
disease. J Guangdong Med College. 31:496–500. 2013.(In
Chinese).
|
|
8
|
Chen WW, Wang N, Cai S, Fang Z, Yu M, Wu
Q, Tang L, Guo B, Feng Y, Jonas JB, et al: Structural brain
abnormalities in patients with primary open-angle glaucoma: A study
with 3T MR Imaging. Invest Ophthalmol Vis Sci. 54:545–554.
2013.PubMed/NCBI View Article : Google Scholar
|
|
9
|
Sacca SC, Rolando M, Marletta A, Macrí A,
Cerqueti P and Ciurlo G: Fluctuations of intraocular pressureduring
the day in open-angle glaucoma, normal-tension glaucomaand normal
subjects. Ophthalmologica. 212:115–119. 1998.PubMed/NCBI View Article : Google Scholar
|
|
10
|
Landini G, Murray PI and Misson GP: Local
connected fractal dimensions and lacunarity analyses of 60 degrees
fluorescein angiograms. Invest Ophthalmol Vis Sci. 36:2749–2755.
1995.PubMed/NCBI
|
|
11
|
Gadde SG, Anegondi N, Bhanushali D,
Chidambar L, Yadav NK, Khurana A and Sinha Roy A: Aurther response:
Quantification of vessel density in retinal optical coherence
tomography angiography images using local fractal dimension. Invest
Ophthalmol Vis Sci. 57(2263)2016.PubMed/NCBI View Article : Google Scholar
|
|
12
|
Yin H, Yi L and Wang J: Detection of PCC
functional connectivity characteristics in subcortical vascular
mild cognitive impairment: A resting-state fMRI study. Alzheimers
Dementia J Alzheimers Assoc. 8:P596–P597. 2012.
|
|
13
|
Chung SD, Ho JD, Chen CH, Lin HC, Tsai MC
and Sheu JJ: Dementia is associated with open-angle glaucoma: A
population-based study. Eye (Lond). 29:1340–1346. 2015.PubMed/NCBI View Article : Google Scholar
|
|
14
|
Tamura H, Kawakami H, Kanamoto T, Kato T,
Yokoyama T, Sasaki K, Izumi Y, Matsumoto M and Mishima HK: High
frequency of open-angle glaucoma in Japanese patients with
Alzheimer's disease. J Neurol Sci. 246:79–83. 2006.PubMed/NCBI View Article : Google Scholar
|
|
15
|
Le PV, Tan O, Chopra V, Francis BA, Ragab
O, Varma R and Huang D: regional correlation among ganglion cell
complex, nerve fiber layer, and visual field loss in glaucoma.
Invest Ophthalmol Vis Sci. 54:4287–4295. 2013.PubMed/NCBI View Article : Google Scholar
|
|
16
|
Wu H, De Boer JF, Chen L and Chen TC:
Correlation of localized glaucomatous visual field defects and
spectral domain optical coherence tomography retinal nerve fiber
layer thinning using a modified structure-function map for OCT. Eye
(Lond). 29:525–533. 2015.PubMed/NCBI View Article : Google Scholar
|
|
17
|
Danthurebandara VM, Sharpe GP, Hutchison
DM, Denniss J, Nicolela MT, McKendrick AM, Turpin A and Chauhan BC:
Enhanced structure-function relationship in glaucoma with an
anatomically and geometrically accurate neuroretinal rim
measurement. Invest Ophthalmol Vis Sci. 56:98–105. 2014.PubMed/NCBI View Article : Google Scholar
|
|
18
|
Igarashi R, Ochiai S, Sakaue Y, Suetake A,
Iikawa R, Togano T, Miyamoto F, Miyamoto D and Fukuchi T: Optical
coherence tomography angiography of the peripapillary capillaries
in primary open-angle and normal-tension glaucoma. PLoS One.
12(e0184301)2017.PubMed/NCBI View Article : Google Scholar
|
|
19
|
Grieshaber MC, Mozaffarieh M and Flammer
J: What is the link between vascular dysregulation and glaucoma?
Surv Ophthalmol. 52 (Suppl 2):S144–S154. 2007.PubMed/NCBI View Article : Google Scholar
|
|
20
|
Wang X, Jiang C, Ko T, Kong X, Yu X, Min
W, Shi G and Sun X: Correlation between optic disc perfusion and
glaucomatous severity in patients with open-angle glaucoma: An
optical coherence tomography angiography study. Graefes Arch Clin
Exp Ophthalmol. 253:1557–1564. 2015.PubMed/NCBI View Article : Google Scholar
|
|
21
|
Rao HL, Pradhan ZS, Weinreb RN, Reddy HB,
Riyazuddin M, Dasari S, Palakurthy M, Puttaiah NK, Rao DA and
Webers CA: Regional comparisons of optical coherence tomography
angiography vessel density in primary open angle glaucoma. Am J
Ophthalmol. 171:75–83. 2016.PubMed/NCBI View Article : Google Scholar
|
|
22
|
Rao HL, Pradhan ZS, Weinreb RN, Reddy HB,
Riyazuddin M, Sachdeva S, Puttaiah NK, Jayadev C and Webers CAB:
Determinants of peripapillary and macular vessel densities measured
by optical coherence tomography angiography in normal eyes. J
Glaucoma. 26:491–497. 2017.PubMed/NCBI View Article : Google Scholar
|
|
23
|
Kwon J, Choi J, Shin JW, Lee J and Kook
MS: Alterations of the foveal avascular zone measured by optical
coherence tomography angiography in glaucoma patients with central
visual field defects. Invest Ophthalmol Vis Sci. 58:1637–1645.
2017.PubMed/NCBI View Article : Google Scholar
|
|
24
|
Li C, Cai P, Shi L, Lin Y, Zhang J, Liu S,
Xie B, Shi Y, Yang H, Li S, et al: Voxel-based morphometry of the
visual-related cortex in primary open angle glaucoma. Curr Eye Res.
37:794–802. 2012.PubMed/NCBI View Article : Google Scholar
|
|
25
|
Williams AL, Lackey J, Wizov SS, Chia TM,
Gatla S, Moster ML, Sergott R, Spaeth GL and Lai S: Evidence for
widespread structural brain changes in glaucoma: A preliminary
voxel-based MRI study. Invest Ophthalmol Vis Sci. 54:5880–5887.
2013.PubMed/NCBI View Article : Google Scholar
|
|
26
|
Wang J, Li T, Sabel BA, Chen Z, Wen H, Li
J, Xie X, Yang D, Chen W, Wang N, et al: Structural brain
alterations in primary open angle glaucoma: A 3T MRI study. Sci
Rep. 6(18969)2016.PubMed/NCBI View Article : Google Scholar
|
|
27
|
Ly T, Gupta N, Weinreb RN, Kaufman PL and
Yücel YH: Dendrite plasticity in the lateral geniculate nucleus in
primate glaucoma. Vision Res. 51:243–250. 2011.PubMed/NCBI View Article : Google Scholar
|
|
28
|
Lam D, Jim J, To E, Rasmussen C, Kaufman
PL and Matsubara J: Astrocyte and microglial activation in the
lateral geniculate nucleus and visual cortex of glaucomatous and
optic nerve transected primates. Mol Vis. 15:2217–2229.
2009.PubMed/NCBI
|