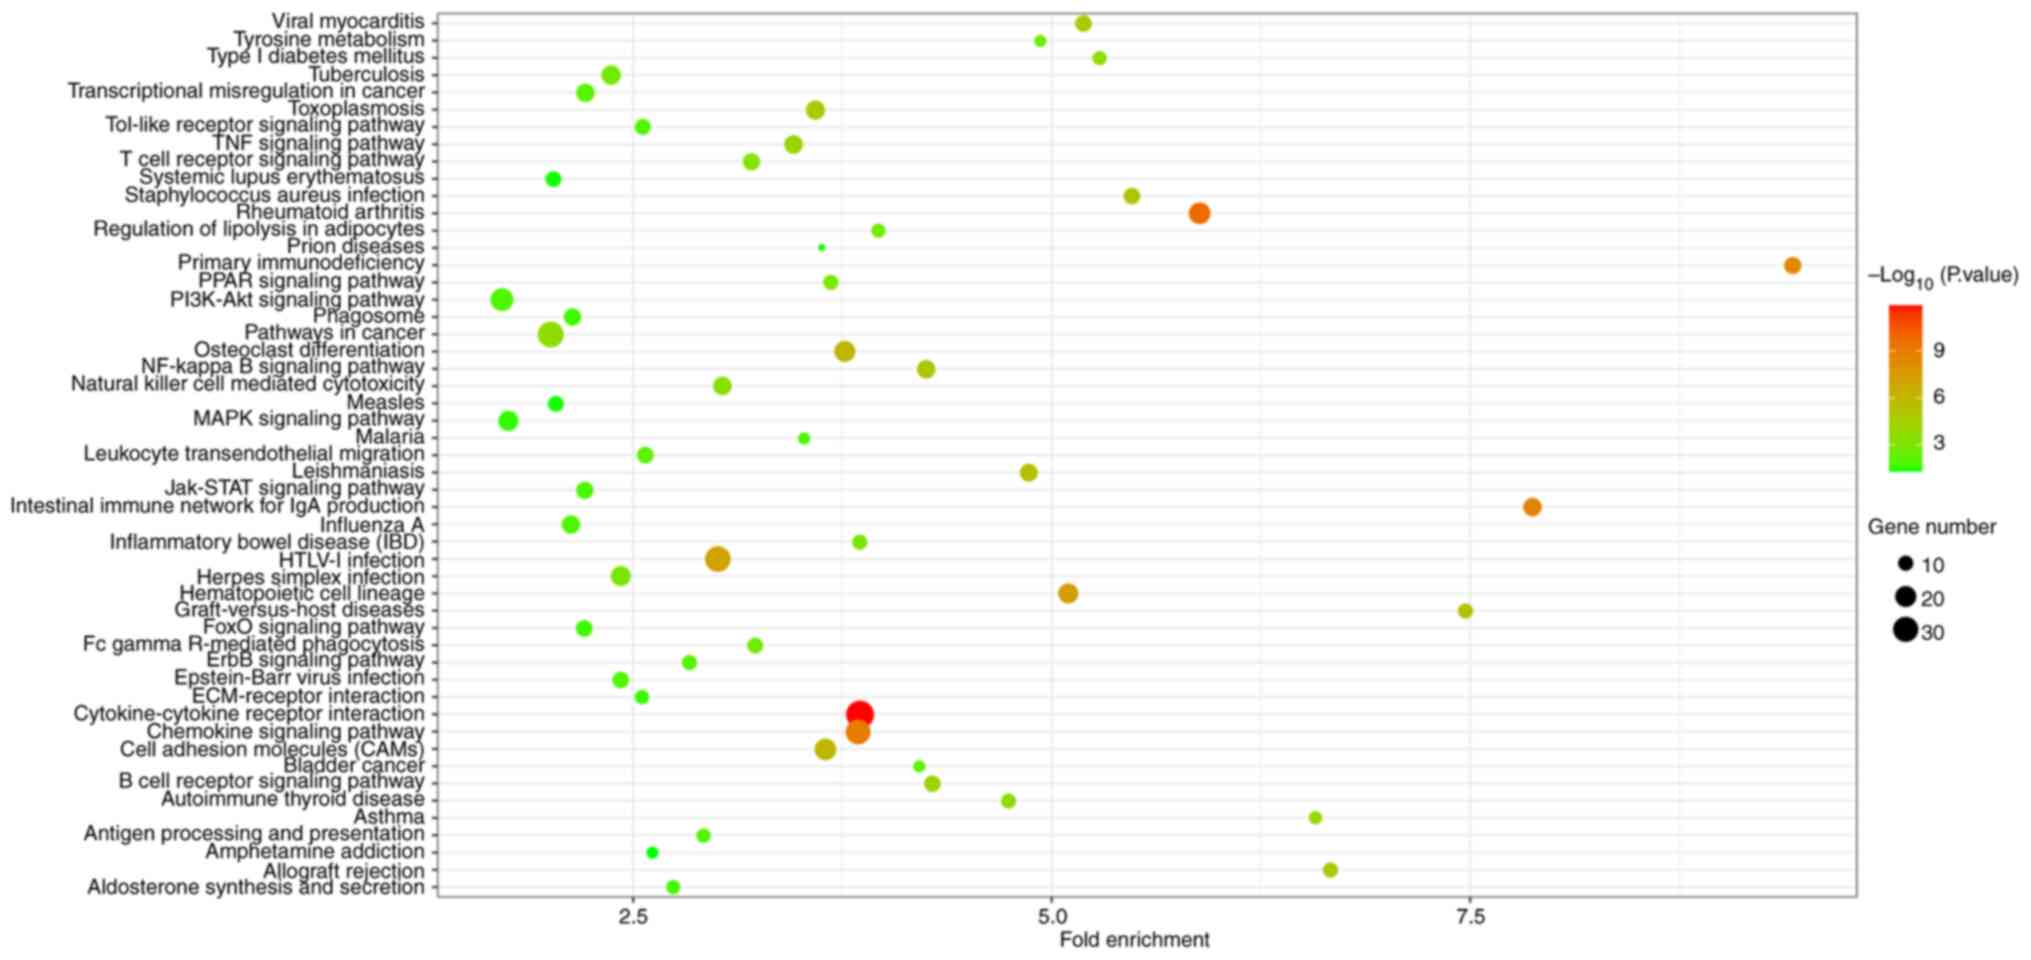
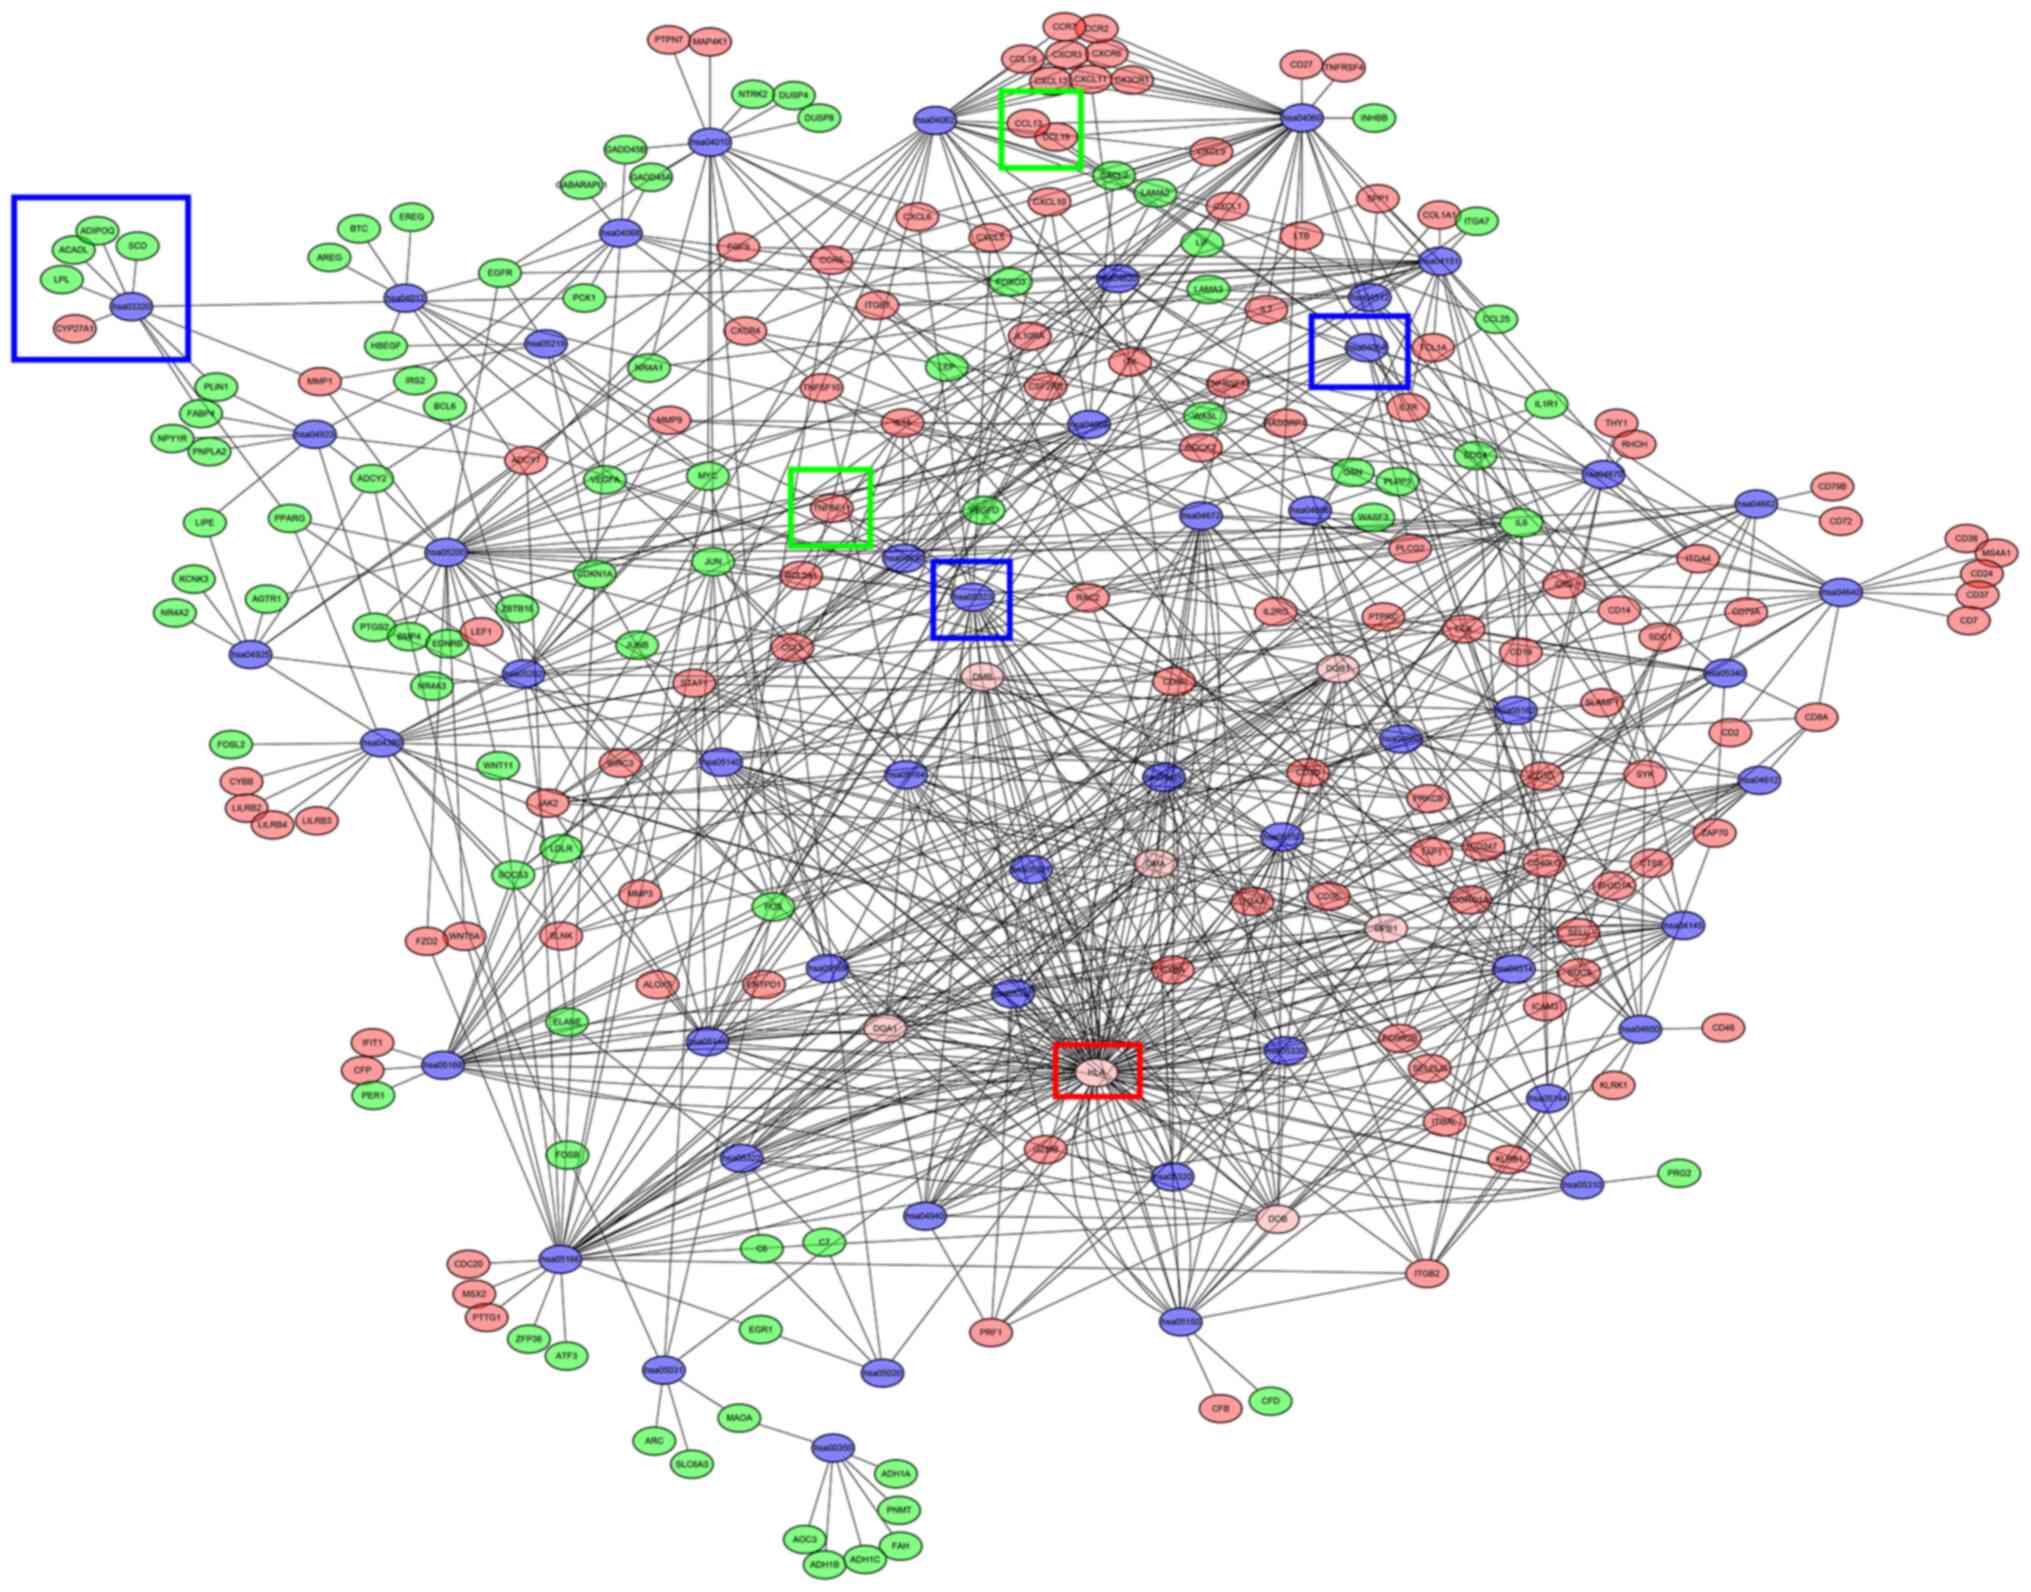
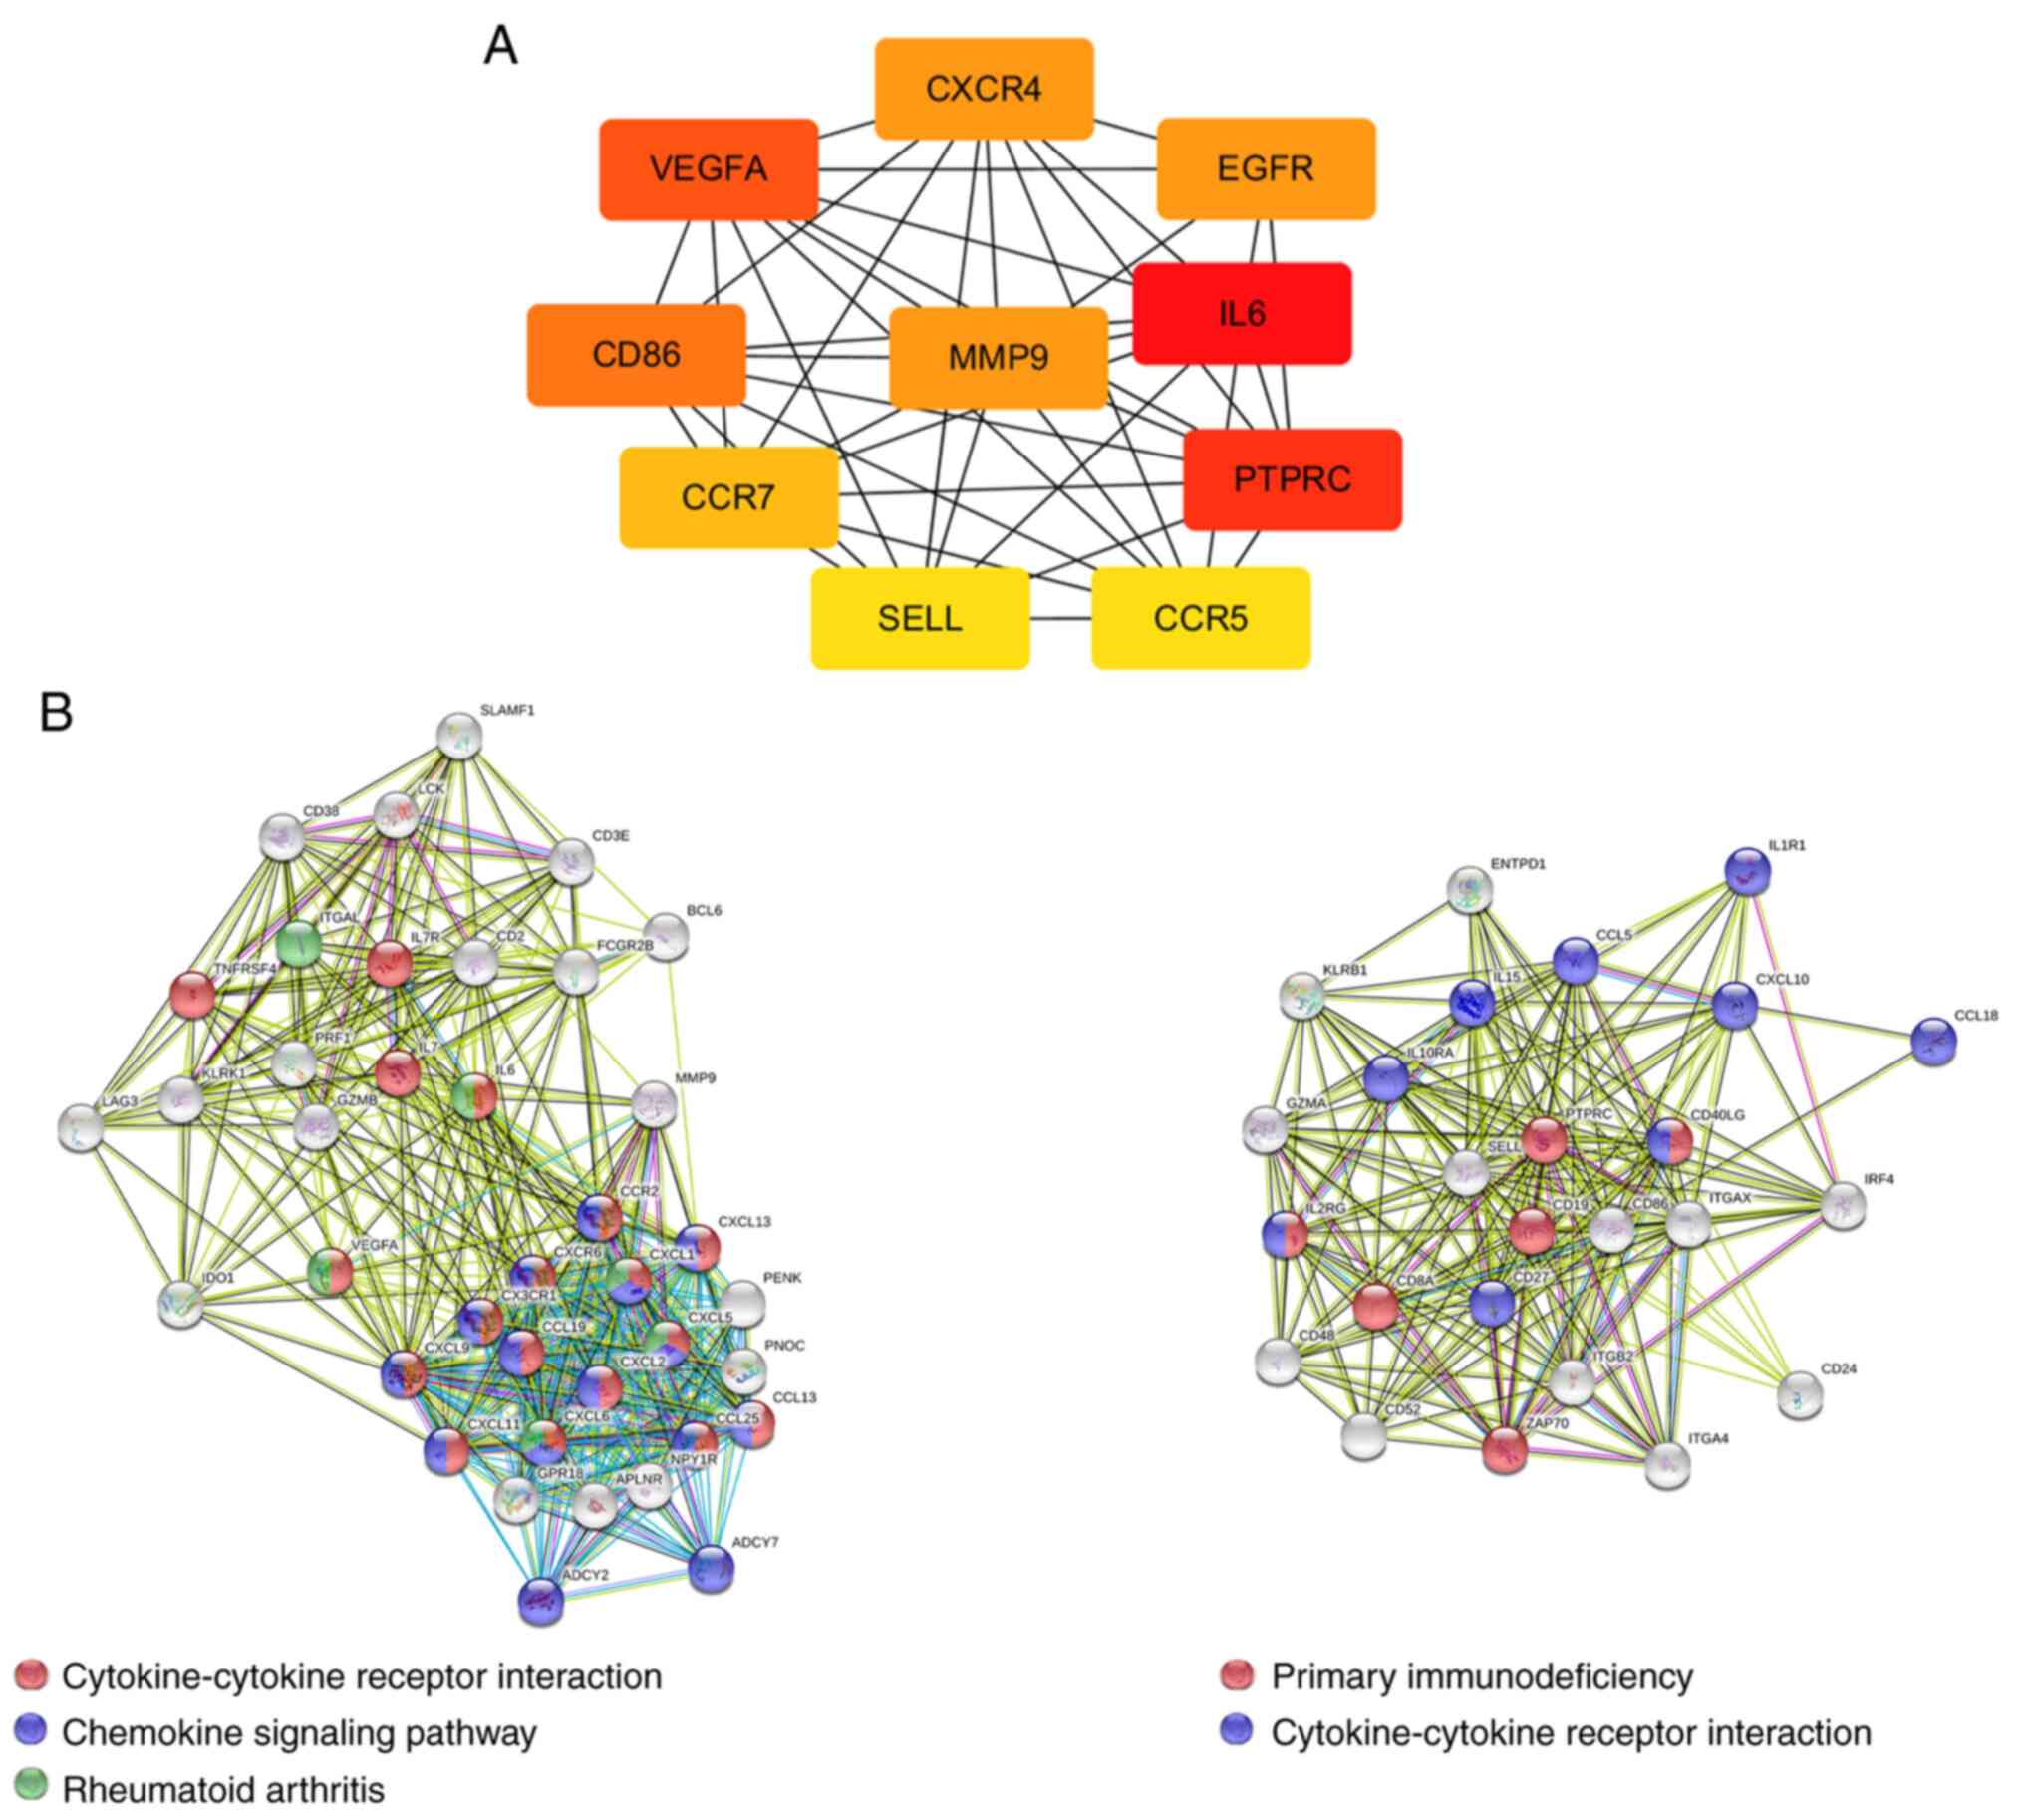
Open Access

Identification of key candidate genes and biological pathways in the synovial tissue of patients with rheumatoid arthritis

  • Authors:
    • Feng Yu
    • Guanghui Hu
    • Lei Li
    • Bo Yu
    • Rui Liu
  • View Affiliations

  • Published online on: April 4, 2022     https://doi.org/10.3892/etm.2022.11295
  • Article Number: 368
  • Copyright: © Yu et al. This is an open access article distributed under the terms of Creative Commons Attribution License.

Metrics: Total Views: 0 (Spandidos Publications: | PMC Statistics: )
Total PDF Downloads: 0 (Spandidos Publications: | PMC Statistics: )


Abstract

The aim of the present study was to identify potential key candidate genes and mechanisms associated with rheumatoid arthritis (RA). Gene expression data from GSE55235, GSE55457 and GSE1919 datasets were downloaded from the Gene Expression Omnibus database. These datasets comprised 78 tissue samples collectively, including 25 healthy synovial membrane samples and 28 RA synovial membrane samples, whilst the 25 osteoarthritis (OA) samples were not included in the analysis. The differentially expressed genes (DEGs) between the two types of samples were identified with the Linear Models for Microarray Analysis package in R. Gene Ontology (GO) functional term and Kyoto Encyclopedia of Genes and Genomes (KEGG) signaling pathway enrichment analyses were also performed. In addition, Protein‑Protein Interaction (PPI) network and module analyses were visualized using Cytoscape, and subsequent hub gene identification as well as GO and KEGG enrichment analyses of the modules was performed. Finally, reverse transcription‑quantitative PCR (RT‑qPCR) was used to validate the expression of the DEGs identified by GO and KEGG analysis in vitro. The analysis identified 491 DEGs, including 289 upregulated and 202 downregulated genes, which were mainly enriched in the following pathways: ‘Cytokine‑cytokine receptor interaction’, ‘Rheumatoid arthritis’, ‘Chemokine signaling pathway’, ‘Intestinal immune network for IgA production’ and ‘Primary immunodeficiency’. The top 10 hub genes identified from the PPI network were IL‑6, protein tyrosine phosphatase receptor type C, VEGFA, CD86, EGFR, C‑X‑C chemokine receptor type 4, matrix metalloproteinase 9, CC‑chemokine receptor type (CCR)7, CCR5 and selectin L. KEGG signaling pathway enrichment analysis of the top two modules identified from the PPI network revealed that the genes in Module 1 were mainly enriched in the ‘Cytokine‑cytokine receptor interaction’ and ‘Chemokine signaling pathway’, whereas analysis of Module 2 revealed that the genes were mainly enriched in ‘Primary immunodeficiency’ and ‘Cytokine‑cytokine receptor interaction’. Finally, the results of the RT‑qPCR and western blot analysis demonstrated that the expression levels of inflammation and NF‑κB signaling pathway‑related mRNAs were significantly upregulated following lipopolysaccharide stimulation. In conclusion, the findings of the present study identified key genes and signaling pathways associated with RA, which may improve the current understanding of the molecular mechanisms underlying its development and progression. The identified hub genes may also be used as potential targets for RA diagnosis and treatment.

Introduction

Rheumatoid arthritis (RA) is the most common type of chronic and systemic autoimmune joint disease, and is characterized by the proliferation of synoviocytes, cells that produce inflammatory cytokines and chemokines (1). As the disease progresses, the joints begin to swell, which causes pain, cartilage destruction, bone erosion and eventually, permanent disability of the bones through the progressive destruction of the cartilage and bone (2). According to data from the World Health Organization, 0.3-1% of the world’s population is affected by RA, and amongst those affected, women are three times more likely to develop RA compared with men (3). Mechanistically, RA can often be triggered by infections, as the immune defense mechanism triggers the migration of neutrophils to the site of the attack, where they begin to degrade the matrix components (4). A previous study reported that leukocyte infiltration into the synovium and the expansion of fibroblast-like synoviocytes (FLS) served an important role in the pathogenesis of RA. FLS have since been demonstrated to serve a crucial role in the pathological progression in RA; thus, investigating the role of FLS in RA has become a topic of increased interest (5,6).

Inhibitors of inflammation, such as the TNF-α inhibitor infliximab, have been shown to significantly decrease the levels of inflammation and improve tender-joint count, swollen-joint count, the level of pain and the erythrocyte sedimentation rate in patients with RA (7). However, significant pain relief and effective control of joint destruction is still not achieved in a large number of patients (8). Therefore, further research into the potential molecular mechanisms of FLS in patients with RA may help identify reliable molecular markers for the early diagnosis and the prognostic evaluation of the disease, in addition to providing novel targets for the treatment of RA.

With the development of high-throughput sequencing and bioinformatics analytical methods, DNA microarrays (also known as gene chips) have become an important means to obtain gene expression data of multiple diseases on a large-scale and in an efficient manner (9). The Gene Expression Omnibus (GEO) database is currently the world's largest and most comprehensive publicly accessible gene expression data resource, which contains gene expression data on a variety of diseases, such as several types of cancer, metabolic diseases and immune diseases. The database contains data for differentially expressed DNAs, mRNAs, single nucleotide polymorphisms and genome methylation patterns in various types of disease, in addition to data on the chemical structure of molecules (10). To date, through the integrated analysis of multiple datasets from the GEO database, several studies have identified genes and pathways that influence the occurrence and progression of RA, such as STAT1, the primary immunodeficiency pathway (9), MAPK signaling pathway (11) and lipopolysaccharide biosynthesis (12). However, the results obtained in these aforementioned studies are conflicting and demonstrate little overlap in terms of the genes and pathways identified. Therefore, further studies are required to determine and verify the key genes involved in the pathogenesis of RA.

In the present study, three original Gene Chip expression profile datasets from the GEO database were analyzed: GSE55235, GSE55457 and GSE1919 (13,14). Subsequently, the Gene Ontology (GO) functional term enrichment, Kyoto Encyclopedia of Genes and Genomes (KEGG) signaling pathway enrichment analysis and protein-protein interaction (PPI) network analysis revealed that TNF and NF-κB signaling pathways may play an important role in the pathogenesis of RA. Furthermore, the expression levels of component of the inflammation and NF-κB signaling pathways in FLS were analyzed to provide a relevant basis for further exploration of reliable molecular markers and effective therapeutic targets for RA.

Materials and methods

Microarray data information and identification of DEGs

The GEO database (https://www.ncbi.nlm.nih.gov/geo/) was searched using the keywords rheumatoid arthritis and Homo sapiens. A total of 7,343 datasets were obtained. Other inclusion criteria included the following: i) The dataset was a genome-wide mRNA transcriptome data matrix; ii) samples were from synovial tissue from patients with RA and synovial tissue from normal patients; and iii) both the original and normalized datasets were acceptable. Exclusion criteria were as follows: i) Samples were from patients' blood; and ii) datasets were from other species and not humans, such as rats and rabbits. Ultimately, three microarray datasets, GSE55235, GSE55457 and GSE1919 were selected, which used synovial tissues from patients with RA and normal healthy individuals for comparison. Based on the inclusion criteria described above, in the GSE55235 dataset [submission date, February 21, 2014; platform, GPL96 (HG-U133A) Affymetrix human genome U133A array], 10 synovial tissue from joints with RA and 10 synovial tissues from healthy joints were selected. In the GSE55457 dataset [submission date, respectively, February 28, 2014; platform, GPL96 (HG-U133A) Affymetrix Human Genome U133A array] (13), 10 normal synovial membranes from patients and 13 synovial membrane samples from patients with RA were selected. In the GSE1919 dataset, [submission date, November 2, 2004; platform, GPL91 (HG_U95A) Affymetrix Human Genome U95A array] (14), five normal donors (ND) samples and five RA samples were selected. All of the data are freely available online and the present study did not perform any experiments on humans or animals. The details of the datasets are shown in Table I. The series matrix and platform TXT files were downloaded from the GEO database. Perl language commands (https://github.com/Yufengxinkf/perl.git) were used to convert the gene probe IDs in the matrix files to gene symbols in the platform files to obtain the international standard gene name, which was performed based on the strawberry-perl software (strawberry-perl-5.32.1.1-64bit.msi). To focus on the pathogenesis of RA, the data of OA samples were omitted from analysis whilst only RA and healthy samples were used.

Table I

Details of the GEO rheumatoid arthritis data.

Table I

Details of the GEO rheumatoid arthritis data.

First author, yearSampleGEO accession nos.PlatformHealthy synovial membrane (No Disease)Rheumatoid arthritis(Refs.)
Woetzel et al, 2014Synovial tissueGSE55235 and GSE55457GPL962023(13)
Ungethuem et al, 2010Synovial tissueGSE1919GPL9155(14)

[i] GEO, Gene Expression Omnibus.

Screening for DEGs and integration of microarray data

To minimize the heterogeneity between each dataset used in the integrated analysis, normalization was performed for the raw data using the function of ‘removeBatchEffect’ of ‘limma’ package (15). The GSE55235, GSE55457 and GSE1919 datasets were subjected to log2 transformation. Subsequently, the DEGs were identified using the multiple linear regression limma package in R (16), and the ComBat function of the sva package was used to remove known batch effects from the microarray data (17). The number of gene symbols between each dataset was visualized using a Venn diagram using the VennDiagram package in R. The cut-off values for DEG selection were an adjusted P-value <0.05 and a |log2 fold change (log2 FC)|>1. The DEGs were sorted by logFC for subsequent integration analysis. The DEGs were then displayed by log2 FC and adjusted P-values in a volcano plot using the ggplot2 package in R. For the hierarchical clustering analysis, the ggplots package in R was used to construct a bidirectional hierarchical clustering heatmap.

GO functional term and KEGG signaling pathway enrichment analyses

Database for Annotation, Visualization and Integrated Discovery (DAVID) version 6.8 (david.ncifcrf.gov) (11,18), a commonly used database for gene enrichment and functional annotation analyses, was used to subject DEGs to GO functional term and KEGG signaling pathway enrichment analyses (11,19). In addition, Cytoscape version 3.6.1 software (cytoscape.org) was used to visualize the results of the KEGG analysis (20). P<0.05 was considered to indicate a statistically significant difference.

Construction of the PPI network and analysis of modules

A PPI network of the DEGs was constructed using Search Tool for the Retrieval of Interacting Genes/Proteins version 11.0 (STRING; https://string-db.org) (21). Cytoscape software version 3.7.1 (https://cytoscape.org/) was used to visualize the hub genes using the Molecular Complex Detection (MCODE) plug-in with the following parameters: Degree Cutoff = 2; Node Score Cutoff = 0.2; K-Core = 2; and Max. Depth = 100 (22,23).

In vitro experiments

Human rheumatoid arthritis synovial fibroblasts (cat. no. YS010RA) were obtained from Shanghai Yaji Biological Technology Co., Ltd. They were cultured in DMEM with 10% FBS and 1% penicillin/streptomycin. The cells were maintained in a humidified incubator with 5% CO2 at 37˚C, and the medium was changed every 3 days. After cell density reached 80%, the cells were seeded at a density of 3x10⁵/ml in 6-well plates and treated with 1 µg/ml lipopolysaccharide (LPS; Sigma-Aldrich; Merck KGaA) for 24 or 48 h.

Reverse transcription-quantitative PCR (RT-qPCR)

Fibroblasts (1x10⁶) were cultured in six-well plates. Total RNA was extracted from the fibroblasts using an OMEGA® Total RNA kit, and the 260/280 absorbance ratio was calculated to assess the RNA purity using a NanoDrop spectrophotometer (Thermo Fisher Scientific, Inc.). RNA (1 µg) was reverse transcribed into cDNA using a cDNA synthesis kit (Thermo Fisher Scientific, Inc.), according to the manufacturer's protocol. Primers (Sangon Biotech Co. Ltd.) for TNF-α, IL-1β, IL-6, NLR family pyrin domain containing 3 (NLRP3) and IκBα are listed in Table II. A total reaction volume of 15 µl was prepared before amplification, which included 1 µl cDNA, 7.5 µl 2X SYBR® Premix Ex Taq II (Takara Biotechnology Co., Ltd.), 0.5 µM of each primer and sterile distilled water. GAPDH was used as the loading control. The thermocycling conditions were as follows: Initial denaturation at 95˚C for 20 sec, followed by 40 cycles at 95˚C for 5 sec and 60˚C for 20 sec. Relative mRNA expression of selected genes was normalized to GAPDH and quantified using the 2-ΔΔCq method (24).

Table II

Primer sequences used for reverse transcription-quantitative PCR.

Table II

Primer sequences used for reverse transcription-quantitative PCR.

GenePrimer sequences (5'-3')Product size, bp
TNF-αF: CCTCTCTCTAATCAGCCCTCTG22
 R: GAGGACCTGGGAGTAGATGAG21
IL-1βF: ATGATGGCTTATTACAGTGGCAA23
 R: GTCGGAGATTCGTAGCTGGA20
IL-6F: CTGCAAGAGACTTCCATCCAG21
 R: AGTGGTATAGACAGGTCTGTTGG23
NLR family pyrinF: GATCTTCGCTGCGATCAACAG21
domain-containing 3R: CGTGCATTATCTGAACCCCAC21
IκBαF: CACTCCATCCTGAAGGCTACCAACTAC27
 R: ATCAGCACCCAAGGACACCAAA22
GAPDHF: GGTGAAGGTCGGAGTCAAC19
 R: CCATGGGTGGAATCATATTG20

[i] F, forward; R, reverse.

Western blot analysis

Fibroblasts (5x10⁶) were cultured in 60-mm dishes and lysed using RIPA lysis buffer with protease and phosphatase inhibitors (ComWin Biotech). Protein lysates were centrifuged at 14,000 x g/min at 4˚C for 30 min, and a Bradford Protein Assay kit (ComWin Biotech) was used to determine the concentration of proteins. A total of 20 µg protein was separated using 12% SDS-PAGE and transferred to PVDF membranes using a Bio-Rad transfer system (Bio-Rad Laboratories, Inc.). Subsequently, the PVDF membranes were blocked in 5% fat-free milk for 2 h at room temperature and then incubated with primary antibodies at 4˚C overnight. After incubation with the HRP-linked secondary antibody (1:2,000; cat. no. ab97051l; Abcam) at room temperature for 1 h, the membranes were washed with 0.5% TBST and the BeyoECL Plus solution (Beyotime Institute of Biotechnology) was used to visualize the bands. For signal detection, Quantity One software (version 4.6.7; Bio-Rad Laboratories, Inc.) was used for semi quantitative analysis. The primary antibodies used are as follows: TNF-α (1:10,000; cat. no. ab109322; Abcam), IL-1β (1:1,000; cat. no. ab234437; Abcam), Nlrp3 (1:1,000; cat. no. ab263899; Abcam), IκBα (1:1,000; cat. no. ab32518; Abcam) and anti-β-actin (cat. no. 4970; 1:1,000; Cell Signaling Technology, Inc.).

Statistical analysis

Calculations were performed using SPSS version 22.0 (IBM Corp.). The experimental data are presented as the mean ± SD (n=3). Statistical comparisons were performed using a one-way ANOVA followed by a Tukey's post hoc test. P<0.05 was considered to indicate a statistically significant difference.

Results

Microarray data normalization and identification of DEGs in RA

The GEO datasets, GSE55235, GSE55457 and GSE1919, were normalized using the sva package to remove the possible differences in backgrounds of each dataset (Fig. 1A). A total of 4790 DEGs were shared by all three datasets (Fig. 1B), which were used for further analysis. The DEGs were screened using the limma R package (adjusted P<0.05 and |log2 FC|>1), and a total of 491 DEGs were identified from the three datasets, including 289 upregulated and 202 downregulated genes, in the RA samples compared with the normal samples (Table SI), as shown in the volcano plot in Fig. 2A, and the cluster heatmap of the top 100 genes is shown in Fig. 2B.

GO functional term and KEGG signaling pathway enrichment analyses of DEGs

GO functional annotation of the identified DEGs was performed using the online analysis tool, DAVID, which comprised three independent categories: Biological process (BP), cellular component (CC) and molecular function (MF). The results were considered statistically significant if P<0.05. The top 15 results obtained from the GO functional term enrichment analysis of the upregulated and downregulated genes are presented in Tables III and SII. As shown in Fig. 3A and C, the upregulated genes were mainly enriched in ‘Immune response’ (ontology, BP), ‘Plasma membrane’ (ontology, CC) and ‘Protein binding’ (ontology, MF). The downregulated genes were mainly enriched in ‘RNA polymerase II promoter’ (ontology, BP), ‘Nucleus’ (ontology, CC) and ‘Growth factor activity’ (ontology, MF; Fig. 3B and D).

Table III

Top 15 enriched GO terms associated with the upregulated and downregulated genes.

Table III

Top 15 enriched GO terms associated with the upregulated and downregulated genes.

A, Top 15 enriched GO terms amongst the upregulated genes
CategoryTermCountP-value
BPImmune response60 2.78x10-38
BPSignal transduction47 1.72x10⁻⁸
BPInflammatory response40 2.23x10⁻²⁰
BPCell adhesion29 2.15x10⁻⁹
BPG-protein coupled receptor signaling pathway280.001681
CCPlasma membrane124 6.70x10⁻¹⁶
CCIntegral component of membrane116 1.81x10⁻⁶
CCCytoplasm940.044545
CCMembrane68 1.66x10⁻⁸
CCExtracellular exosome66 2.98x10⁻⁴
MFProtein binding167 9.53x10⁻⁵
MFProtein homodimerization activity24 9.99x10⁻⁴
MFReceptor activity21 1.74x10⁻¹⁰
MFTransmembrane signaling receptor activity17 2.29x10⁻⁷
MFReceptor binding17 1.27x10⁻⁴
B, Top 15 enriched GO terms amongst the downregulated genes
CategoryTermCountP-value
BPPositive regulation of transcription from RNA polymerase II promoter20 8.78x10⁻⁵
BPNegative regulation of transcription from RNA polymerase II promoter17 5.74x10⁻⁵
BPNegative regulation of apoptotic process12 2.21x10⁻⁴
BPNegative regulation of transcription, DNA-templated110.001209477
BPPositive regulation of cell proliferation100.004388
CCNucleus430.036153
CCExtracellular space41 1.79x10⁻¹³
CCExtracellular exosome400.001481
CCCytosol220.005256
CCCell surface16 4.95x10⁻⁶
MFGrowth factor activity121.16 x10-9
MFTranscriptional activator activity12 2.06x10⁻⁵
MFRNA polymerase II core promoter proximal region sequence-specific DNA binding110.002113
MFProtein homodimerization activity90.006911
MFHeparin binding8 3.40x10⁻⁴

[i] BP, biological process; CC, Cellular component; GO, Gene Ontology; MF, molecular function.

KEGG signaling pathway enrichment analysis of DEGs

KEGG signaling pathway enrichment analysis of the integrated DEGs was also performed using DAVID, and the results of the analysis are shown in Table IV and Fig. 4. The DEGs were mainly enriched in five pathways: ‘Cytokine-cytokine receptor interaction’, ‘Rheumatoid arthritis’, ‘Chemokine signaling pathway’, ‘Intestinal immune network for IgA production’ and ‘Primary immunodeficiency’. In addition, the ‘PPAR signaling pathway’ and ‘NF-kappa B signaling pathway’ were also found to serve a possible role in RA. Next, the PPI network was visualized using Cytoscape (Fig. 5). The results showed that HLA genes were associated with 21 pathways, including the PPAR signaling pathway (hsa03320) and the Rheumatoid arthritis signaling pathway (hsa05323). In addition, the NF-κB signaling pathway (hsa04064) was associated with genes, such as CCL13, CCL19 and TNFSF11.

Table IV

Kyoto Encyclopedia of Genes and Genomes pathway analysis of integrated differentially expressed genes.

Table IV

Kyoto Encyclopedia of Genes and Genomes pathway analysis of integrated differentially expressed genes.

PathwayIDGene countP-valueGenes
Cytokine-cytokine receptor interactionhsa0406038 1.28x10-12CX3CR1, CCL13, CXCL6, CXCL9, CXCR4, CSF2RB, CXCL1, CXCR6, CXCL13, IL2RG, CXCL2, CXCL5, CCL5, CXCR3, TNFSF10, TNFSF11, TNFRSF17, CCR7, CCL19, CCR5, CCL18, TNFRSF4, CCR2, CCL25, IL15, IL1R1, IL10RA, LIF, INHBB, CXCL10, CXCL11, IL6, CD40LG, IL7, LEP, CD27, LTB, IL7R
Rheumatoid arthritishsa0532321 1.77x10⁻¹⁰CD86, CXCL6, JUN, IL15, MMP1, ITGB2, MMP3, FOS, ITGAL, CXCL5, VEGFA, HLA-DMA, IL6, HLA-DMB, CCL5, HLA-DPB1, TNFSF11, LTB, HLA-DOB, HLA-DQA1, HLA-DQB1
Chemokine signaling pathwayhsa0406229 1.12x10-9CX3CR1, CCL13, CXCL6, ITK, CXCL9, CXCR4, CXCL1, ADCY2, WASL, CXCR6, CXCL13, FOXO3, CXCL2, ADCY7, CXCL5, CCL5, CXCR3, RAC2, CCR7, CCL19, JAK2, CCR5, CCL18, CCR2, CCL25, STAT1, CXCL10, CXCL11, DOCK2
Intestinal immune network for IgA productionhsa0467215 2.30x10⁻⁹CCL25, CD86, ITGA4, IL15, CXCR4, HLA-DMA, IL6, HLA-DMB, CD40LG, HLA-DPB1, TNFRSF17, ITGB7, HLA-DOB, HLA-DQA1, HLA-DQB1
Primary immunodeficiencyhsa0534013 3.71x10⁻⁹TAP1, IL2RG, CD3E, CD3D, CD79A, ZAP70, PTPRC, CD40LG, LCK, CD8A, CD19, BLNK, IL7R
Hematopoietic cell lineagehsa0464018 4.83x10⁻⁸CR2, ITGA4, IL1R1, CD3G, CD3E, CD3D, CD2, IL6, IL7, CD8A, CD19, CD7, CD38, CD37, CD14, CD24, IL7R, MS4A1
HTLV-I infectionhsa0516631 9.08x10⁻⁸CDKN1A, ITGB2, CD3G, ADCY2, CD3E, ITGAL, IL2RG, CD3D, ADCY7, CDC20, HLA-DMA, ZFP36, HLA-DMB, WNT11, PTTG1, MYC, HLA-DOB, HLA-DQA1, EGR1, JUN, FZD2, MSX2, IL15, IL1R1, WNT5A, FOS, IL6, LCK, HLA-DPB1, ATF3, HLA-DQB1
Cell adhesion molecules (CAMs)hsa0451421 8.92x10⁻⁷CD86, SELPLG, SDC4, ITGA4, SDC3, ITGB2, ICAM3, ITGAL, CD2, HLA-DMA, HLA-DMB, PTPRC, CD40LG, SELL, CD8A, HLA-DPB1, SDC1, ITGB7, HLA-DOB, HLA-DQA1, HLA-DQB1
Osteoclast differentiationhsa0438020 1.07x10⁻⁶JUN, SYK, IL1R1, STAT1, CYBB, CYBA, LILRB2, FOS, LILRB3, LILRB4, FOSL2, SOCS3, LCK, BLNK, PLCG2, FOSB, TNFSF11, PPARG, FCGR2B, JUNB
Leishmaniasishsa0514014 4.10x10⁻⁶JUN, ITGA4, STAT1, ITGB2, CYBA, FOS, PTGS2, HLA-DMA, HLA-DMB, HLA-DPB1, JAK2, HLA-DOB, HLA-DQA1, HLA-DQB1
Graft-vs. -host diseasehsa0533210 4.14x10⁻⁶CD86, IL6, HLA-DMA, HLA-DMB, HLA-DPB1, PRF1, GZMB, HLA-DOB, HLA-DQA1, HLA-DQB1
Staphylococcus aureus infectionhsa0515012 7.83x10⁻⁶CFD, HLA-DMA, SELPLG, HLA-DMB, ITGB2, HLA-DPB1, ITGAL, FCGR2B, HLA-DOB, CFB, HLA-DQA1, HLA-DQB1
NF-κB signaling pathwayhsa0406415 8.49x10⁻⁶CCL13, SYK, BCL2A1, IL1R1, PTGS2, ZAP70, CD40LG, LCK, BLNK, PLCG2, TNFSF11, CD14, LTB, CCL19, BIRC3
Allograft rejectionhsa0533010 1.16x10⁻⁵CD86, HLA-DMA, HLA-DMB, CD40LG, HLA-DPB1, PRF1, GZMB, HLA-DOB, HLA-DQA1, HLA-DQB1
Viral myocarditishsa0541612 1.35x10⁻⁵CD86, HLA-DMA, HLA-DMB, CD40LG, ITGB2, RAC2, HLA-DPB1, PRF1, ITGAL, HLA-DOB, HLA-DQA1, HLA-DQB1
Toxoplasmosishsa0514516 3.17x10⁻⁵LAMA2, STAT1, IL10RA, LAMA3, HLA-DMA, HLA-DMB, CD40LG, ALOX5, HLA-DPB1, JAK2, CCR5, HLA-DOB, LDLR, HLA-DQA1, BIRC3, HLA-DQB1
B cell receptor signaling pathwayhsa0466212 8.69x10⁻⁵CD79B, CD79A, CR2, JUN, CD72, SYK, CD19, BLNK, PLCG2, RAC2, FOS, FCGR2B
TNF signaling pathwayhsa0466815 9.23x10⁻⁵JUN, IL15, MMP3, LIF, CXCL1, FOS, PTGS2, CXCL2, MMP9, CXCL10, SOCS3, IL6, CCL5, JUNB, BIRC3
Asthmahsa053108 1.49x10⁻⁴HLA-DMA, HLA-DMB, CD40LG, PRG2, HLA-DPB1, HLA-DOB, HLA-DQA1, HLA-DQB1
Autoimmune thyroid diseasehsa0532010 2.01x10⁻⁴CD86, HLA-DMA, HLA-DMB, CD40LG, HLA-DPB1, PRF1, GZMB, HLA-DOB, HLA-DQA1, HLA-DQB1
Type I diabetes mellitushsa049409 2.29x10⁻⁴CD86, HLA-DMA, HLA-DMB, HLA-DPB1, PRF1, GZMB, HLA-DOB, HLA-DQA1, HLA-DQB1
Pathways in cancerhsa0520032 2.37x10⁻⁴CDKN1A, LAMA2, LAMA3, LEF1, CXCR4, ADCY2, PTGS2, RASGRP1, ADCY7, EGFR, EDNRB, WNT11, FGF9, MYC, PLCG2, RAC2, JUN, FZD2, PRKCB, MMP1, STAT1, ZBTB16, WNT5A, VEGFD, FOS, MMP9, VEGFA, BMP4, IL6, AGTR1, PPARG, BIRC3
Natural killer cell mediated cytotoxicityhsa0465015 3.77x10⁻⁴SYK, PRKCB, SH2D1A, ITGB2, PRF1, GZMB, ITGAL, ZAP70, KLRK1, LCK, TNFSF10, PLCG2, RAC2, CD48, CD247
T cell receptor signaling pathwayhsa0466013 6.53x10⁻⁴ITK, JUN, CD3G, FOS, CD3E, RASGRP1, CD3D, ZAP70, PTPRC, CD40LG, LCK, CD8A, CD247
Inflammatory bowel diseasehsa0532110 9.86x10⁻⁴IL6, HLA-DMA, JUN, HLA-DMB, STAT1, HLA-DPB1, IL2RG, HLA-DOB, HLA-DQA1, HLA-DQB1
Herpes simplex infectionhsa05168180.001109261JUN, IL15, STAT1, TAP1, FOS, IFIT1, CFP, PER1, SOCS3, HLA-DMA, IL6, HLA-DMB, CCL5, HLA-DPB1, JAK2, HLA-DOB, HLA-DQA1, HLA-DQB1
PPAR signaling pathwayhsa03320100.001376807CYP27A1, FABP4, ACADL, MMP1, SCD, ADIPOQ, LPL, PPARG, PLIN1, PCK1
Regulation of lipolysis in adipocyteshsa0492390.001688948LIPE, FABP4, NPY1R, IRS2, ADCY2, PLIN1, PTGS2, ADCY7, PNPLA2
Fc gamma R-mediated phagocytosishsa04666110.001936067GSN, PTPRC, SYK, PRKCB, PLCG2, RAC2, WASL, DOCK2, FCGR2B, PLPP3, WASF3
Tuberculosishsa05152170.002050272SYK, STAT1, IL10RA, ITGB2, CORO1A, CTSS, HLA-DMA, IL6, HLA-DMB, ITGAX, HLA-DPB1, CD14, FCGR2B, JAK2, HLA-DOB, HLA-DQA1, HLA-DQB1
Tyrosine metabolismhsa0035070.002490246PNMT, AOC3, ADH1C, MAOA, ADH1B, ADH1A, FAH
Bladder cancerhsa0521970.005633865CDKN1A, MMP1, MYC, MMP9, EGFR, VEGFA, HBEGF
Leukocyte transendothelial migrationhsa04670120.006560639ITK, ITGA4, PRKCB, ITGB2, PLCG2, RAC2, CXCR4, RHOH, CYBA, THY1, ITGAL, MMP9
Transcriptional misregulation in cancerhsa05202150.007463353CD86, CDKN1A, BCL2A1, ZBTB16, MMP3, GZMB, MMP9, IL6, NR4A3, BCL6, MYC, ITGB7, PPARG, CD14, ELANE
ErbB signaling pathwayhsa04012100.008189004BTC, CDKN1A, JUN, PRKCB, MYC, PLCG2, AREG, EGFR, EREG, HBEGF
Epstein-Barr virus infectionhsa05169120.010097479CDKN1A, CR2, ENTPD1, JUN, SYK, MYC, CD19, PLCG2, HLA-DPB1, ITGAL, HLA-DQA1, HLA-DQB1
Toll-like receptor signaling pathwayhsa04620110.010274377CD86, CXCL10, IL6, CXCL11, CXCL9, JUN, STAT1, CCL5, SPP1, FOS, CD14
Influenza Ahsa05164150.010556604JUN, PRKCB, STAT1, CXCL10, SOCS3, HLA-DMA, IL6, HLA-DMB, CCL5, TNFSF10, HLA-DPB1, JAK2, HLA-DOB, HLA-DQA1, HLA-DQB1
Antigen processing and presentationhsa0461290.011202712HLA-DMA, HLA-DMB, CD8A, HLA-DPB1, TAP1, HLA-DOB, CTSS, HLA-DQA1, HLA-DQB1
PI3K-Akt signaling pathwayhsa04151240.012003195CDKN1A, SYK, LAMA2, ITGA4, LAMA3, VEGFD, FOXO3, IL2RG, EGFR, VEGFA, COL1A1, NR4A1, IL6, TCL1A, FGF9, IL7, MYC, CD19, SPP1, ITGA7, ITGB7, JAK2, PCK1, IL7R
Malariahsa0514470.01339692IL6, KLRK1, CD40LG, KLRB1, ITGB2, SDC1, ITGAL
Jak-STAT signaling pathwayhsa04630130.014076056IL15, STAT1, IL10RA, LIF, CSF2RB, IL2RG, SOCS3, IL6, IL7, MYC, LEP, JAK2, IL7R
Aldosterone synthesis and secretionhsa0492590.016086366NR4A2, LIPE, NR4A1, PRKCB, AGTR1, ADCY2, ADCY7, LDLR, KCNK3
Phagosomehsa04145130.01799255ITGB2, TAP1, CYBA, CORO1A, CTSS, HLA-DMA, HLA-DMB, HLA-DPB1, CD14, FCGR2B, HLA-DOB, HLA-DQA1, HLA-DQB1
FoxO signaling pathwayhsa04068120.019364257IL6, CDKN1A, GABARAPL1, GADD45B, BCL6, GADD45A, TNFSF10, IRS2, PCK1, FOXO3, IL7R, EGFR
ECM-receptor interactionhsa0451290.023784926COL1A1, SDC4, LAMA2, ITGA4, LAMA3, SPP1, SDC1, ITGA7, ITGB7
MAPK signaling pathwayhsa04010180.02689659MAP4K1, DUSP4, NTRK2, JUN, GADD45B, IL1R1, PRKCB, GADD45A, FOS, DUSP8, RASGRP1, EGFR, NR4A1, FGF9, MYC, RAC2, CD14, PTPN7
Measleshsa05162110.042383892IL6, STAT1, SH2D1A, TNFSF10, CD3G, CD3E, FCGR2B, JAK2, IL2RG, CD3D, SLAMF1
Systemic lupus erythematosushsa05322110.044240314CD86, HLA-DMA, HLA-DMB, C6, CD40LG, C7, HLA-DPB1, HLA-DOB, ELANE, HLA-DQA1, HLA-DQB1
Prion diseaseshsa0502050.046727411EGR1, IL6, C6, C7, CCL5
Amphetamine addictionhsa0503170.049531294ARC, JUN, MAOA, PRKCB, FOSB, FOS, SLC6A3
Complement and coagulation cascadeshsa0461070.059219897CFD, CR2, SERPINA1, C6, C7, CFB, SERPINA5
AMPK signaling pathwayhsa04152100.060492183LIPE, SCD, LEP, FASN, ADIPOQ, IRS2, PPARG, PCK1, FOXO3, ACACB
Adipocytokine signaling pathwayhsa0492070.062683741SOCS3, LEP, ADIPOQ, IRS2, PCK1, JAK2, ACACB
Focal adhesionhsa04510140.073426753JUN, LAMA2, ITGA4, PRKCB, LAMA3, VEGFD, EGFR, VEGFA, COL1A1, SPP1, RAC2, ITGA7, ITGB7, BIRC3
Pertussishsa0513370.081761396CXCL6, IL6, JUN, ITGB2, FOS, CD14, CXCL5
HIF-1 signaling pathwayhsa0406680.092748632HK3, IL6, CDKN1A, PRKCB, PLCG2, EGFR, PDK1, VEGFA
PPI network and modules analyses

The STRING database was used to construct a PPI network of the 491 identified DEGs, which consisted of 845 nodes interacting with each other via 253 edges (Fig. S1). The results were visualized using Cytoscape, based on how closely the genes were linked to other genes in the network, with the degree values calculated and ranked in descending order. The top 10 hub genes identified were IL-6, protein tyrosine phosphatase receptor type C (PTPRC), VEGFA, CD86, EGFR, C-X-C chemokine receptor type 4 (CXCR4), matrix metalloproteinase 9 (MMP9), CC-chemokine receptor type (CCR)7, CCR5 and selectin L (SELL) (Fig. 6A).

In addition, 15 functional cluster modules were screened from the PPI network using the MCODE plugin in Cytoscape and the two most crucial modules were used for further KEGG signaling pathway enrichment analysis using the STRING database (Figs. 6B and S1). As shown in Fig. 6B, the results revealed that the genes in Module 1 were mainly enriched in ‘Cytokine-cytokine receptor interaction’, ‘Chemokine signaling pathway’ and ‘Rheumatoid arthritis’, whereas the genes in Module 2 were mainly enriched in the ‘Primary immunodeficiency’ and ‘Cytokine-cytokine receptor interaction’. Generally, Module 1 is associated with chemokine and Module 2 is associated with immunodeficiency.

In vitro analysis of candidate genes

Through the analysis of the DEGs, the cytokine-cytokine receptor interaction signaling pathway was indicated to serve a potential role in the pathogenesis of RA. In particular, a role for TNF-α and IL-6 was previously, such that TNF-α and IL-6 are closely associated with joint destruction during the pathogenesis of RA (25,26). In addition, previous studies have also shown that NLRP3 serves an important role in autoimmune conditions, such as systemic lupus erythematosus, RA, systemic sclerosis and inflammatory bowel disease (27). Therefore, mouse synovial fibroblasts were treated with LPS in vitro to simulate the process of RA, and the expression levels of related genes, including TNF-α, IL-1β, IL-6, NLRP3 and IκBα, were analyzed using RT-qPCR and western blotting. As shown in Fig. 7A, the results of RT-qPCR revealed that following LPS stimulation for 24 and 48 h, the expression levels of the inflammatory factors, TNF-α, IL-1β and IL-6, in fibroblasts were significantly upregulated. In addition, the expression levels of NLRP3, which has been shown to be associated with inflammatory diseases, were also significantly upregulated. Moreover, as the expression levels of the inflammatory factors increased, IκBα expression was upregulated. Similarly, the results of western blotting also showed that the protein expression levels of TNF-α, IL-1β and NLRP3 were increased after treatment with LPS (Fig. 7B and C). However, not identical to the results of KEGG, with the induction of inflammation, the expression of IκBα also increased significantly, suggesting that the NF-κB signaling pathway may be inhibited. These findings indicated that during the pathogenesis of RA, the production of inflammatory factors may serve an important role and may affect the expression levels of members of the NF-κB signaling pathway in synovial fibroblasts.

Discussion

RA is one of the most common types of inflammatory arthritis; it causes both cartilage and bone damage, in addition to disability (2). RA reportedly affects ~1% of the population and occurs in women three times more frequently than men. In addition, RA can occur at any age, but it is most common amongst those aged 40-70 years old, with its incidence rate increasing with age (28). Similar to most other autoimmune diseases, both environmental and genetic factors contribute to the development of the disease, including viral infections and the use of drugs, such as isoniazid, hydrazine, procainamide and anticonvulsants (29). Although significant insight into the cellular and molecular mechanisms involved in RA has been gained in the past decade, the pathogenesis of RA remains incompletely understood, at least to the best of our knowledge (30). Therefore, researching the mechanisms underlying RA development remains a priority.

In the present study, 491 DEGs (289 upregulated and 202 downregulated genes) were screened from the GEO datasets, GSE55235, GSE55457 and GSE1919, using a multiple linear regression limma package. The integrated DEGs were subsequently subjected to BP, CC and MF GO functional term enrichment analysis. The upregulated DEGs were mainly enriched in ‘Immune response’ (ontology, BP), ‘Plasma membrane’ (ontology, CC) and ‘Protein binding’ (ontology, MF). The downregulated genes were mainly enriched in ‘RNA polymerase II promoter’ (ontology, BP), ‘Nucleus’ (ontology, CC) and ‘Growth factor activity’ (ontology. MF). These results suggest that in synovial fibroblasts in RA, abnormalities in immune response and growth factor activation lead to an upregulated level of inflammatory response. In addition, KEGG signaling pathway enrichment analysis revealed that these integrated DEGs were mainly enriched in the following top five pathways: ‘Cytokine-cytokine receptor interaction’, ‘Rheumatoid arthritis’, ‘Chemokine signaling pathway’, ‘Intestinal immune network for IgA production’ and ‘Primary immunodeficiency’. These data indicated that the cytokine-cytokine receptor interaction pathway may be significantly activated in fibroblasts during RA.

As important contributors to the innate immune defense, cytokines serve as crucial mediators in the immune response, where they participate in immunoregulatory and inflammatory processes (31). Interestingly, KEGG signaling pathway enrichment analysis also revealed that the DEGs were enriched in ‘Primary immunodeficiency’, which suggested the important role of the breakdown in immune pathways in fibroblasts during RA. The NF-κB and TNF signaling pathways have been reported to serve a crucial role in the occurrence and development of RA, potentially through regulating the levels of inflammation (32). Peroxisome Proliferator-Activated Receptors (PPARs), including PPARα, PPARγ and PPARβ/δ, are ligand-activated transcription factors that belong to the nuclear hormone receptor family. The findings of the present study revealed that the ‘PPAR signaling pathway’ may participate in metabolic regulation in RA. A previous study demonstrated that PPARγ exhibited anti-inflammatory and anti-fibrotic effects in a number of disease models (33). Therefore, the relationship between the signaling pathways aforementioned, particularly the NF-κB signaling pathway and the inflammatory response may help to elucidate the mechanism of RA. The construction of PPI networks with the integrated DEGs identified 10 hub genes, namely IL-6, PTPRC, VEGFA, CD86, EGFR, CXCR4, MMP9, CCR7, CCR5 and SELL. These results are consistent with a previous study, which reported that the expression levels of IL-6 were strongly associated with the development of RA (34). The levels of serum VEGFA have also been found to be directly associated with RA disease activity, particularly joint swelling (35). In particular, in elderly patients, the VEGFA rs699947 C/A functional polymorphism has been reported to be associated with RA risk (36). In the present study, module analysis was also performed on the constructed PPI network and the two most important modules were selected. Subsequent KEGG signaling pathway enrichment analysis of these DEGs revealed that the genes in Module 1 were mainly enriched in ‘Cytokine-cytokine receptor interaction’, ‘Chemokine signaling pathway’ and ‘Rheumatoid arthritis’. The genes in Module 2 were mainly enriched in ‘Primary immunodeficiency’ and ‘Cytokine-cytokine receptor interaction’. These results further indicated that the inflammatory pathway may be closely related to RA.

The results obtained through bioinformatics analysis were validated using RT-qPCR and western blot analysis in vitro. According to the results obtained from the KEGG signaling pathway enrichment analysis and the construction of PPI networks of the integrated DEGs, it was hypothesized that the expression levels of inflammation and NF-κB signaling pathway-related genes may serve important roles in RA. In synovial fibroblasts, the mRNA expression levels of inflammation-related genes, TNF-α, IL-1β, IL-6 and NLRP3, were significantly upregulated following LPS stimulation. In addition, mRNAs involved in the NF-κB signaling pathway were also significantly upregulated. Piao et al (37) reported that the anti-inflammatory effect of propylene glycol methyl ether acetate was achieved through the NF-κB signaling pathway.

Lu and Li (38) previously studied the pathogenesis of RA. This previous study revealed that ‘immune response’, ‘inflammatory response’, ‘chemokine-mediated signalling pathways’, ‘response to lipopolysaccharide’ and ‘cellular response to tumour necrosis factor’ served key roles in the pathogenesis of RA. These findings are similar to those in the present study. However, in the present study, it was also found that IL-6, NF-κB signaling pathway and the PPAR signaling pathway also serve an important role in the pathogenesis of RA. Furthermore, to further validate the results of the bioinformatics analysis, mouse synovial fibroblasts were treated with LPS in vitro to mimic the onset of RA before determining the elevated expression levels of inflammatory factors, such as TNF-α, IL-1β and NLRP3. However, in contrast with the KEGG results, the increased expression levels of IκBα implied that the NF-κB signaling pathway may be inhibited. Tang et al (39) previously reported that in LPS-treated fetal lung endothelial cells, the expression of IκBα was suppressed at 5-8 h. However, after 8 h LPS treatment, the difference was significantly reduced compared with that in the control group. These results may suggest that the NF-κB signaling pathway may be activated during the early phase of LPS treatment, whilst in the late phase, possibly accompanied by the onset of apoptosis, the NF-κB signaling pathway is inhibited (39). Nevertheless, similar to the majority of bioinformatics network analysis studies of human diseases, the present study also has several limitations. For example, the sample size of this study was relatively small, and the sampling method did not eliminate the effect of sex, co-morbidity or the use of certain medicines that could alter gene expression in the rheumatoid synovium, including methotrexate or non-steroidal anti-inflammatory drugs.

The findings of the present study identified 491 DEGs between RA and healthy joints from 3 gene chip expression datasets, which were significantly enriched in several signaling pathways, such as the ‘Cytokine-cytokine receptor interaction’, ‘Chemokine signaling pathway’ and ‘NF-κB signaling pathway’. These results may improve the current understanding of the mechanism of RA. Furthermore, these candidate genes and pathways could represent potential therapeutic targets for RA. However, further molecular biology experiments are required to validate the findings of the present study.

Supplementary Material

Protein-Protein Interaction network analysis using the Search Tool for the Retrieval of Interacting Genes/Proteins database.
All the differentially expressed genes between the RA groups and OA groups of samples amongst the three datasets.
All the GO functional term from the DAVID 6.8 database.

Acknowledgements

Not applicable.

Funding

Funding: The present study was supported by The Medical Science and Technology Research Plan of Henan Province in China (grant no. 201602353).

Availability of data and materials

The datasets used and/or analyzed during the current study are available from the corresponding author on reasonable request.

Authors' contributions

FY and RL conceived and designed the experiments. GH, LL and BY performed the experiments. FY and GH analyzed the data. FY and RL confirmed the authenticity of all the raw data. All authors read and approved the final manuscript.

Ethics approval and consent to participate

Not applicable.

Patient consent for publication

Not applicable.

Competing interests

The authors declare that they have no competing interests.

References

1 

Zhang F, Wei K, Slowikowski K, Fonseka CY, Rao DA, Kelly S, Goodman SM, Tabechian D, Hughes LB, Salomon-Escoto K, et al: Defining inflammatory cell states in rheumatoid arthritis joint synovial tissues by integrating single-cell transcriptomics and mass cytometry. Nat Immunol. 20:928–942. 2019.PubMed/NCBI View Article : Google Scholar

2 

Aletaha D, Neogi T, Silman AJ, Funovits J, Felson DT, Bingham CO III, Birnbaum NS, Burmester GR, Bykerk VP, Cohen MD, et al: 2010 Rheumatoid arthritis classification criteria: An American college of rheumatology/European league against rheumatism collaborative initiative. Ann Rheum Dis. 69:1580–1588. 2010.PubMed/NCBI View Article : Google Scholar

3 

Jacob L, Rockel T and Kostev K: Depression risk in patients with rheumatoid arthritis in the United Kingdom. Rheumatol Ther. 4:195–200. 2017.PubMed/NCBI View Article : Google Scholar

4 

Kharlamova N, Jiang X, Sherina N, Potempa B, Israelsson L, Quirke AM, Eriksson K, Yucel-Lindberg T, Venables PJ, Potempa J, et al: Antibodies to porphyromonas gingivalis indicate interaction between oral infection, smoking, and risk genes in rheumatoid arthritis etiology. Arthritis Rheumatol. 68:604–613. 2016.PubMed/NCBI View Article : Google Scholar

5 

Kurowska M, Rudnicka W, Kontny E, Janicka I, Chorazy M, Kowalczewski J, Ziółkowska M, Ferrari-Lacraz S, Strom TB and Maśliński W: Fibroblast-like synoviocytes from rheumatoid arthritis patients express functional IL-15 receptor complex: Endogenous IL-15 in autocrine fashion enhances cell proliferation and expression of Bcl-x(L) and Bcl-2. J Immunol. 169:1760–1767. 2002.PubMed/NCBI View Article : Google Scholar

6 

Chen S, Yang Y, Feng H, Wang H, Zhao R and Liu H: Baicalein inhibits interleukin-1β-induced proliferation of human rheumatoid arthritis fibroblast-like synoviocytes. Inflammation. 37:163–169. 2014.PubMed/NCBI View Article : Google Scholar

7 

Lu YC, Chuang CH, Chuang KH, Chen IJ, Huang BC, Lee WH, Wang HE, Li JJ, Cheng YA, Cheng KW, et al: Specific activation of pro-Infliximab enhances selectivity and safety of rheumatoid arthritis therapy. PLoS Biol. 17(e3000286)2019.PubMed/NCBI View Article : Google Scholar

8 

Bao J, Yue T, Li T, He DY and Bao YX: Good response to infliximab in rheumatoid arthritis following failure of interleukin-1 receptor antagonist. Int J Rheum Dis. 19:370–376. 2016.PubMed/NCBI View Article : Google Scholar

9 

Zhang R, Yang X, Wang J, Han L, Yang A, Zhang J, Zhang D, Li B, Li Z and Xiong Y: Identification of potential biomarkers for differential diagnosis between rheumatoid arthritis and osteoarthritis via integrative genome-wide gene expression profiling analysis. Mol Med Rep. 19:30–40. 2019.PubMed/NCBI View Article : Google Scholar

10 

Jiang P and Liu XS: Big data mining yields novel insights on cancer. Nat Genet. 47:103–104. 2015.PubMed/NCBI View Article : Google Scholar

11 

Huang da W, Sherman BT and Lempicki RA: Systematic and integrative analysis of large gene lists using DAVID bioinformatics resources. Nat Protoc. 4:44–57. 2009.PubMed/NCBI View Article : Google Scholar

12 

Chen B, Zhao Y, Li S, Yang L, Wang H, Wang T, Shi B, Gai Z, Heng X, Zhang C, et al: Variations in oral microbiome profiles in rheumatoid arthritis and osteoarthritis with potential biomarkers for arthritis screening. Sci Rep. 8(17126)2018.PubMed/NCBI View Article : Google Scholar

13 

Woetzel D, Huber R, Kupfer P, Pohlers D, Pfaff M, Driesch D, Häupl T, Koczan D, Stiehl P, Guthke R and Kinne RW: Identification of rheumatoid arthritis and osteoarthritis patients by transcriptome-based rule set generation. Arthritis Res Ther. 16(R84)2014.PubMed/NCBI View Article : Google Scholar

14 

Ungethuem U, Haeupl T, Witt H, Koczan D, Krenn V, Huber H, von Helversen TM, Drungowski M, Seyfert C, Zacher J, et al: Molecular signatures and new candidates to target the pathogenesis of rheumatoid arthritis. Physiol Genomics. 42A:267–282. 2010.PubMed/NCBI View Article : Google Scholar

15 

Leek JT and Storey JD: Capturing heterogeneity in gene expression studies by surrogate variable analysis. PLoS Genet. 3:1724–1735. 2007.PubMed/NCBI View Article : Google Scholar

16 

Phipson B, Lee S, Majewski IJ, Alexander WS and Smyth GK: Robust hyperparmeter estimation protects against hypervariable genes and improves power to detect differential expression. Ann Appl Stat. 10:946–963. 2016.PubMed/NCBI View Article : Google Scholar

17 

Leek JT, Johnson WE, Parker HS, Jaffe AE and Storey JD: The sva package for removing batch effects and other unwanted variation in high-throughput experiments. Bioinformatics. 28:882–883. 2012.PubMed/NCBI View Article : Google Scholar

18 

Huang da W, Sherman BT and Lempicki RA: Bioinformatics enrichment tools: Paths toward the comprehensive functional analysis of large gene lists. Nucleic Acids Res. 37:1–13. 2009.PubMed/NCBI View Article : Google Scholar

19 

Dennis G Jr, Sherman BT, Hosack DA, Yang J, Gao W, Lane HC and Lempicki RA: DAVID: Database or annotation, visualization, and integrated discovery. Genome Biol. 4(P3)2003.PubMed/NCBI

20 

Shannon P, Markiel A, Ozier O, Baliga NS, Wang JT, Ramage D, Amin N, Schwikowski B and Ideker T: Cytoscape: A software environment for integrated models of biomolecular interaction networks. Genome Res. 13:2498–2504. 2003.PubMed/NCBI View Article : Google Scholar

21 

Franceschini A, Szklarczyk D, Frankild S, Kuhn M, Simonovic M, Roth A, Lin J, Minguez P, Bork P, von Mering C and Jensen LJ: STRING v9.1: Protein-protein interaction networks, with increased coverage and integration. Nucleic Acids Res. 41 (Database Issue):D808–D815. 2013.PubMed/NCBI View Article : Google Scholar

22 

Bader GD and Hogue CW: An automated method for finding molecular complexes in large protein interaction networks. BMC Bioinformatics. 4(2)2003.PubMed/NCBI View Article : Google Scholar

23 

Song E, Song W, Ren M, Xing L, Ni W, Li Y, Gong M, Zhao M, Ma X, Zhang X and An R: Identification of potential crucial genes associated with carcinogenesis of clear cell renal cell carcinoma. J Cell Biochem. 119:5163–5174. 2018.PubMed/NCBI View Article : Google Scholar

24 

Livak KJ and Schmittgen TD: Analysis of relative gene expression data using real-time quantitative PCR and the 2(-Delta Delta C(T)) method. Methods. 25:402–408. 2001.PubMed/NCBI View Article : Google Scholar

25 

Yamanaka H: TNF as a target of inflammation in rheumatoid arthritis. Endocr Metab Immune Disord Drug Targets. 15:129–134. 2015.PubMed/NCBI View Article : Google Scholar

26 

Huang CC, Chiou CH, Liu SC, Hu SL, Su CM, Tsai CH and Tang CH: Melatonin attenuates TNF-α and IL-1β expression in synovial fibroblasts and diminishes cartilage degradation: Implications for the treatment of rheumatoid arthritis. J Pineal Res. 66(e12560)2019.PubMed/NCBI View Article : Google Scholar

27 

Shen HH, Yang YX, Meng X, Luo XY, Li XM, Shuai ZW, Ye DQ and Pan HF: NLRP3: A promising therapeutic target for autoimmune diseases. Autoimmun Rev. 17:694–702. 2018.PubMed/NCBI View Article : Google Scholar

28 

Smolen JS, Aletaha D and McInnes IB: Rheumatoid arthritis. Lancet. 388:2023–2038. 2016.PubMed/NCBI View Article : Google Scholar

29 

Smatti MK, Cyprian FS, Nasrallah GK, Al Thani AA, Almishal RO and Yassine HM: Viruses and autoimmunity: A review on the potential interaction and molecular mechanisms. Viruses. 11(762)2019.PubMed/NCBI View Article : Google Scholar

30 

Smolen JS and Aletaha D: Rheumatoid arthritis therapy reappraisal: Strategies, opportunities and challenges. Nat Rev Rheumatol. 11:276–289. 2015.PubMed/NCBI View Article : Google Scholar

31 

Mackay CR: Chemokines: Immunology's high impact factors. Nat Immunol. 2:95–101. 2001.PubMed/NCBI View Article : Google Scholar

32 

Combe B, Pope RM, Fischbach M, Darnell B, Baron S and Talal N: Interleukin-2 in rheumatoid arthritis: Production of and response to interleukin-2 in rheumatoid synovial fluid, synovial tissue and peripheral blood. Clin Exp Immunol. 59:520–528. 1985.PubMed/NCBI

33 

Scheen AJ, Esser N and Paquot N: Antidiabetic agents: Potential anti-inflammatory activity beyond glucose control. Diabetes Metab. 41:183–194. 2015.PubMed/NCBI View Article : Google Scholar

34 

Ma MHY, Defranoux N, Li W, Sasso EH, Ibrahim F, Scott DL and Cope AP: A multi-biomarker disease activity score can predict sustained remission in rheumatoid arthritis. Arthritis Res Ther. 22(158)2020.PubMed/NCBI View Article : Google Scholar

35 

Lee SS, Joo YS, Kim WU, Min DJ, Min JK, Park SH, Cho CS and Kim HY: Vascular endothelial growth factor levels in the serum and synovial fluid of patients with rheumatoid arthritis. Clin Exp Rheumatol. 19:321–324. 2001.PubMed/NCBI

36 

Zhang Y, Qiu H, Zhang H, Wang L, Zhuang C and Liu R: Vascular endothelial growth factor A (VEGFA) polymorphisms in Chinese patients with rheumatoid arthritis. Scand J Rheumatol. 42:344–348. 2013.PubMed/NCBI View Article : Google Scholar

37 

Piao CH, Bui TT, Fan YJ, Nguyen TV, Shin DU, Song CH, Lee SY, Shin HS, Kim HT and Chai OH: In vivo and in vitro anti-allergic and anti-inflammatory effects of Dryopteris crassirhizoma through the modulation of the NF-ĸB signaling pathway in an ovalbumin-induced allergic asthma mouse model. Mol Med Rep. 22:3597–3606. 2020.PubMed/NCBI View Article : Google Scholar

38 

Lu W and Li G: Identification of key genes and pathways in rheumatoid arthritis gene expression profile by bioinformatics. Acta Reumatol Port. 43:109–131. 2018.PubMed/NCBI

39 

Tang JR, Michaelis KA, Nozik-Grayck E, Seedorf GJ, Hartman-Filson M, Abman SH and Wright CJ: The NF-κB inhibitory proteins IκBα and IκBβ mediate disparate responses to inflammation in fetal pulmonary endothelial cells. J Immunol. 190:2913–2923. 2013.PubMed/NCBI View Article : Google Scholar

Related Articles

Journal Cover

June-2022
Volume 23 Issue 6

Print ISSN: 1792-0981
Online ISSN:1792-1015

Sign up for eToc alerts

Recommend to Library

Copy and paste a formatted citation
x
Spandidos Publications style
Yu F, Hu G, Li L, Yu B and Liu R: Identification of key candidate genes and biological pathways in the synovial tissue of patients with rheumatoid arthritis. Exp Ther Med 23: 368, 2022
APA
Yu, F., Hu, G., Li, L., Yu, B., & Liu, R. (2022). Identification of key candidate genes and biological pathways in the synovial tissue of patients with rheumatoid arthritis. Experimental and Therapeutic Medicine, 23, 368. https://doi.org/10.3892/etm.2022.11295
MLA
Yu, F., Hu, G., Li, L., Yu, B., Liu, R."Identification of key candidate genes and biological pathways in the synovial tissue of patients with rheumatoid arthritis". Experimental and Therapeutic Medicine 23.6 (2022): 368.
Chicago
Yu, F., Hu, G., Li, L., Yu, B., Liu, R."Identification of key candidate genes and biological pathways in the synovial tissue of patients with rheumatoid arthritis". Experimental and Therapeutic Medicine 23, no. 6 (2022): 368. https://doi.org/10.3892/etm.2022.11295