Introduction
The increasing prevalence of childhood obesity in
the current century has made it an alarming worldwide health issue.
Around the world, currently more than 43 million children are
reported to be obese or overweight (1). The condition is recognizable mainly
in developed and developing countries (1,2).
The mechanisms involved in the progression of
childhood obesity and its complications are still undetermined
which hinders the timely management of these conditions (3,4).
Some obese individuals may have a significantly low risk to develop
cardiometabolic complications [metabolically healthy obesity (MHO)]
when compared with others [metabolically unhealthy obesity (MUO)]
(5,6). Blüher reported that cases with MHO
have higher insulin sensitivity and less obesity-associated
inflammation than those with MUO (6). Some other studies reported that MHO
is not a strictly cardio-metabolic benign condition, and
individuals with MHO still have an increased risk of developing
type 2 diabetes mellitus (T2DM) and atherosclerosis than healthy
lean individuals (6,7). In addition, obesity is considered an
inflammatory condition that is associated with an increase in
adipocyte-derived adipokines such as tumor necrosis factor-α
(TNF-α), interleukin-6 (IL-6), and C-reactive protein (CRP)
(8). The control of these
inflammations may slow down the progression of obesity-associated
complications (8). To understand
these inflammations and other consequences of obesity, many
previous studies have been conducted on microRNAs and other
inflammatory-related biomarkers such as Annexin A1, procalcitonin,
and IL-6 (9,10).
MicroRNAs (miRNAs/miRs) are small non-coding
ribonucleic acids that can modify the process of adipogenesis and
its related complications (9). In
this regard, miR-15b expression was reported in many previous
studies to correlate with insulin resistance and inflammatory
markers in obese individuals (10-12).
Annexin A1 (lipocortin-1, 37 kDa) is a protein that
resolves inflammations by diminishing the production of
pro-inflammatory cytokines in neutrophils (13). It can enhance the apoptosis of
neutrophils and suppress the process of adipogenesis (13,14).
Studies that have investigated the levels of Annexin A1 in obese
and/or type 2 diabetic cases have revealed contradicting results
(14-16).
Procalcitonin is secreted mainly by thyroid C cells
and adipose tissues and is considered a marker for systemic
inflammation (17). Obese
individuals were reported to have high procalcitonin levels that
were correlated with body mass index (BMI) and insulin resistance
(17,18).
IL-6 controls diverse immune, inflammatory, and
metabolic processes through a complex pathway that requires
incorporation between a variety of cells and tissues. Its levels
were reported by many studies to be higher in obese individuals
than in non-obese controls (19-21).
Since the current differentiation of patients with
MUO from those with MHO depends on the development of major
clinical signs (22), which is
considered late, the objectives of the present study were to
measure serum miR-15b, Annexin A1, procalcitonin, and IL-6 levels
in children with MHO and MUO and to compare them to those of a
non-obese healthy control group. The study also tested the ability
of each of these parameters to early differentiate children with
MUO from those with MHO which may help the timely management of
these cases and their accompanying complications.
Patients and methods
The present work was conducted in three primary
health care centers in Unaizah, Qassim area, Saudi Arabia after
being reviewed and approved by the Qassim University Medical Ethics
Board (approval # mduc-2019-2-2-I-5441). All procedures performed
were in accordance with the 1964 Helsinki declaration and its later
amendments or comparable ethical standards. Informed written
consents were obtained from all children's guardians.
Calculation of sample size
The formula (n)=(r+1/r) (ơ2)
(Zβ+Zα/2)2/(difference)2 was used
to calculate the sample size (r is the ratio of healthy non-obese
children to obese children; σ is the estimated standard deviation;
Zβ is the desired power (typically 0.84 for 80% power);
and Zα/2 is the desired statistical significance level (1.96). The
difference was set at 5. Thus, a sample size of at least 171
participants in each arm was used.
Participants
This case-control study included 620 consecutive
children [434 males (70%) and 186 females (30%)] who visited the
primary health care centers in Unaizah governorate, Qassim area,
Saudi Arabia between January 2019 and October 2021. Their ages
ranged between 9 and 15 years (mean age, 12.6±1.5). Medical
histories were collected, and examinations were conducted for all
children. The children's waist circumference (WC) percentile and
body mass index (BMI) percentile were calculated, and a child was
considered obese when his/her WC was ≥90th percentile and BMI was
≥95 percentile for age and sex (1). Children were considered to have MUO
when their WC was ≥90th percentile and presented with one or more
of the following findings (22):
a) Serum triacylglycerol (TAG) ≥150 mg/dl; b) serum high-density
cholesterol (HDL-c) (<40 mg/dl); c) blood pressure ≥90th
percentile (age, sex, and height) or systolic blood pressure ≥130
mm Hg or diastolic blood pressure ≥85 mm Hg when the age was
between 10 and 16 years; d) fasting blood glucose ≥100 mg/dl.
Exclusion criteria included children with T2DM,
T1DM, genetic or endocrinal disorders, inflammatory, or any other
general acute or chronic illness (3,4).
The eligible children were divided into a healthy
non-obese control group [G1, n=200 (32.3%)] and obese group [n=420
(67.7%)]. According to the classification of international diabetes
federation (IDF) (22); the obese
group was further subdivided into 2 subgroups; G2 [children with
MHO, n=246 (39.7%)] and G3 [children with MUO, n=174 (28.0%)].
Sampling and laboratory analysis
Blood (5 ml) was withdrawn from the antecubital vein
of all of the children after overnight fasting. One milliliter was
used to measure glycosylated hemoglobin percentage (HbA1c%) in the
whole blood immunoturbidimetrically by an autoanalyzer (COBAS
INTEGRA 400, Roche Diagnostic). The remaining portion was left to
be clotted and then centrifuged for 10 min at 3,000 x g, and the
sera were collected in aliquots and stored at -80˚C until assay.
Fasting serum glucose was measured by glucose oxidase activity
high-density assay kit (ab219924; Abcam). Serum total cholesterol
(TC), high density lipoprotein-cholesterol (HDL-c), and
triacylglycerol (TAG) were measured calorimetrically by
corresponding kits (-Spectrum Diagnostics; cat. nos. 230003,
266002t and 314003 respectively). Low density
lipoprotein-cholesterol (LDL-c) was calculated by the Friedewald
equation (LDL-c equals . Insulin levels were measured using an
insulin assay kit (cat. no. INS31-K01; Eagle Biosciences, Inc.),
and serum CRP was assayed using the Human C-Peptide ELISA kit (cat.
no. EZHCP-20K; Sigma-Adrich; Merck KGaA). The homeostasis model of
insulin resistance (HOMA-IR) was calculated as described by
Matthews et al (23). The
case was considered as being insulin-sensitive when HOMA-IR was
>1.9, early insulin resistant when HOMA-IR was 1.9 to >2.9,
and significant insulin resistance when HOMA-IR was ≥2.9(23).
Serum Annexin A1 levels were measured using the
Human Annexin A1 ELISA (cat. no. ELH-ANXA1-1; RayBiotech Life) with
detection range 1.64-400 ng/ml, and coefficient of variation 4.0
and 5.3% for intraassay and interassay, respectively, according to
the manufacturer's protocols. Serum levels of procalcitonin were
assayed using the human procalcitonin ELISA kit (cat no. ab100630;
Abcam) and coefficient of variation 5.0 and 6.0% for intraassay and
interassay, respectively. Human IL-6 Quantikine HS ELISA Kit
(R&D Systems, Inc.) was used to measure serum IL-6 levels with
assay range 0.2-10 pg/ml and coefficient of variation 3.4 and 5.2%
for intraassay and interassay, respectively.
RNA extraction
Serum miRNAs were extracted and purified by the
miRNeasy kit (Ambion® miRNA Isolation Kit, cat. no.
K157001; Thermo Fisher Scientific, Inc.). The serum was transferred
into a spine cartridge with a collection tube, centrifuged for 1
min at 12,000 x g and then 700 µl of 96-100% ethanol was added and
mixed well by vertexing. An amount 700 µl of the mixed sample was
then transferred to a new spin cartridge and centrifuged again for
1 min at 12,000 x g. Wash buffer (500 µl) was used to wash the spin
cartridge with centrifugation at 12,000 x g for 1 min (this step
was repeated twice). Next, 50-100 µl of RNase-free water was added
and the sample was incubated for 1 min before being centrifuged for
1 min at the maximum velocity. The spine cartridge was then removed
and discarded, and the purified RNA was left in the recovery tube,
stored at -80˚C until being utilized.
Reverse transcription
For this step, High-Capacity cDNA Reverse
Transcription Kit was used (Applied Biosystems, cat. no. 4368814;
Thermo Fisher Scientific, Inc.) according to the manufacturer
protocol. Ten microliters of 2X reverse transcription master mix
was pipetted into the reaction plate wells; 10 µl of RNA sample was
added into each well and pipetted up and down to mix them. The
plate was then sealed and centrifuged to spin down the contents and
to get rid of the air bubbles. The plate was put on ice until being
loaded to the thermal cycler (Applied Biosystems; Thermo Fisher
Scientific, Inc.) under conditions that were optimized for the
high-capacity cDNA RT kits (25˚C for 10 min, 37˚C for 120 min and
85˚C for 5 min).
RT-qPCR
RT-qPCR was conducted using TaqMan®
MicroRNA RT Kit (Applied Biosystems; Thermo Fisher Scientific,
Inc.). miR-24 was used as an internal control [stem-loop RT primer
sequence: 5'-GTCGTATCCAGTGCAGGGTCCGAGGTATTCGCACTGGATACGACCTTCTG-3',
forward primer: 5'-GCGGCGGTGGCTCAGTACAGC-3' for miR-24, and
(universal) reverse primer: 5'-GTGCAGGGTCCGAGGT-3'] during the
quantification using specific stem-loop primers for miR-15b
(stem-loop RT primer sequence:
5'-GTCGTATCCAGTGCGTGTCGTGGAGTCGGCAATTGCACTGGATACGACTGTAAACC-3';
forward primer: 5'-ATCCAGTGCGTGTCGTG-3', and reverse primer:
5'-TGCTTAGCAGCACATCATG-3') to normalize it as follows:
∆Ct=∆CtmiR-∆CtmiR-24(24). The
analysis of the results was performed using Sequence Detection
Software version 2.3 (Applied Biosystems; Thermo Fisher Scientific,
Inc.). The difference in the miR-15b relative expression levels
between samples was calculated using the 2-ΔΔCq method
(25).
Statistical analysis
The collected data were analyzed by SPSS software
(v.26) (IBM Corp). The normality of the quantitative data was
tested. Kruskal-Wallis one-way-ANOVA was used to compare data among
the three studied groups and the Dunn's post hoc test was conducted
for pairwise comparisons after Kruskal-Wallis ANOVA. The
correlations between the different studied continuous variable
levels were tested by Spearman's correlations coefficient. The
receiver operating characteristic curve (ROC) was conducted to test
the variable's ability to differentiate children with MUO from
those with MHO. P-values ≤0.05 were considered to indicate a
significant difference.
Results
Comparison of the different studied
variables in G1, G2, and G3
The three groups were age and sex-matched (Table I). There were significantly higher
serum miR-15b, procalcitonin, and IL-6 levels while significant
lower serum Annexin A1 levels in the children with MHO (G2) and MUO
(G3) when compared with the healthy non-obese control group (G1);
and children with MUO (G3) when compared with levels in the
children with MHO (G2) (Table I).
In addition, significantly higher values of BMI and WC percentiles
and serum levels of TAG, glucose, HbA1c%, insulin, and CRP were
found in children with MHO (G2) and with MUO (G3) when compared
with these in the healthy non-obese control group (G1); and in
children with MUO (G3) when compared with levels in the children
with MHO (G2) (Table I). The
percentages of cases with insulin resistance (early and
significant) were higher in G3 than G2 and G1 and G2 than G1
(Table I). The systolic and
diastolic pressure for all participants were less than 90th
percentile (normotensive; data not shown).
 | Table IComparison of different variables
among the healthy non-obese control (G1), children with MHO (G2)
and children with MUO (G3). |
Table I
Comparison of different variables
among the healthy non-obese control (G1), children with MHO (G2)
and children with MUO (G3).
| | P-values |
|---|
| Variables | Healthy non-obese
control (G1; n=200) | Children with MHO
(G2; n=246) | Children with MUO
(G3; n=174) | G1 vs. G2 vs.
G3 | G1 vs. G2 | G1 vs. G3 | G2 vs. G3 |
|---|
| Sex, n
(%)a | | | | | | | |
|
Male | 139 (69.5%) | 173 (70.3%) | 122 (70.1%) | 0.982 | 0.803 | 0.871 | 0.991 |
|
Female | 61 (30.5%) | 73 (29.7%) | 52 (29.9%) | | | | |
| Age, mean
(years) | 12.6±1.3 | 12.5±1.6 | 12.6±1.5 | 0.688 | 0.380 | 0.911 | 0.432 |
| BMI percentile | 77.5±7.1 | 95.9±0.9 | 97.1±1.5 |
<0.001b |
<0.001b |
<0.001b |
<0.001b |
| WC percentile | 79.2±5.4 | 93.5±2.1 | 95.2±2.1 |
<0.001b |
<0.001b |
<0.001b |
<0.001b |
| HDL-c (mg/dl) | 41.2±2.2 | 41.3±3.7 | 29.4±7.7 |
<0.001b | 0.975 |
<0.001b |
<0.001b |
| LDL-c (mg/dl) | 99.1±20.4 | 105.3±27.0 | 110.4±19.1 |
<0.001b | 0.002b |
<0.001b | 0.435 |
| TAG (mg/dl) | 107.8±19.6 | 112.7±21.3 | 142.4±37.1 |
<0.001b |
<0.001b |
<0.001b |
<0.001b |
| Cholesterol
(mg/dl) | 164.4±21.2 | 172.4.4±30.7 | 177.2±21.1 |
<0.001b |
<0.001b |
<0.001b | 0.361 |
| Glucose
(mg/dl) | 86.5±11.5 | 90.1±18.2 | 109.9±11.7 |
<0.001b | 0.006 |
<0.001b |
<0.001b |
| HbA1c (%) | 4.6±0.6 | 5.1±0.9 | 5.5±0.4 |
<0.001b |
<0.001b |
<0.001b | 0.009b |
| Insulin
(µg/ml) | 7.7±1.4 | 9.0±0.7 | 10.5±0.8 |
<0.001b |
<0.001b |
<0.001b |
<0.001b |
| CRP (ng/ml) | 2.8±0.8 | 2.9±0.3 | 3.0±0.2 |
<0.001b | 0.041b |
<0.001b | 0.014b |
| HOMA-IR | 1.6±0.4 | 2.4±0.5 | 2.6±0.5 |
<0.001b |
<0.001b |
<0.001b |
<0.001b |
| Degree of IS, n
(%)a | | | | | | | |
|
IS (HOMA-IR
<1.9) | 138 (69%) | 84 (34.1%) | 6 (3.4%) |
<0.001b |
<0.001b |
<0.001b |
<0.001b |
|
Early IR
(1.9< HOMA-IR <2.9) | 62 (31%) | 114 (46.4%) | 114 (65.5%) | | | | |
|
Significant
IR (HOMA-IR ≥2.9) | 0 (0%) | 48 (19.5%) | 54 (31.1%) | | | | |
| miR-15bR | 3.5±0.6 | 4.0±0.5 | 4.4±0.5 |
<0.001b | 0.012b |
<0.001b | 0.009b |
| Annexin A1
(ng/ml) | 177.7±14.5 | 146.7±54.4 | 132.8±52.7 |
<0.001b | 0.002b |
<0.001b | 0.016b |
| Procalcitonin
(ng/ml) | 0.033±0.019 | 0.051±0.013 | 0.065±0.011 |
<0.001b |
<0.001b |
<0.001b | 0.018b |
| IL-6 (pg/ml) | 1.9±0.4 | 2.3±0.8 | 2.6±1.0 |
<0.001b | 0.037b |
<0.001b | 0.032b |
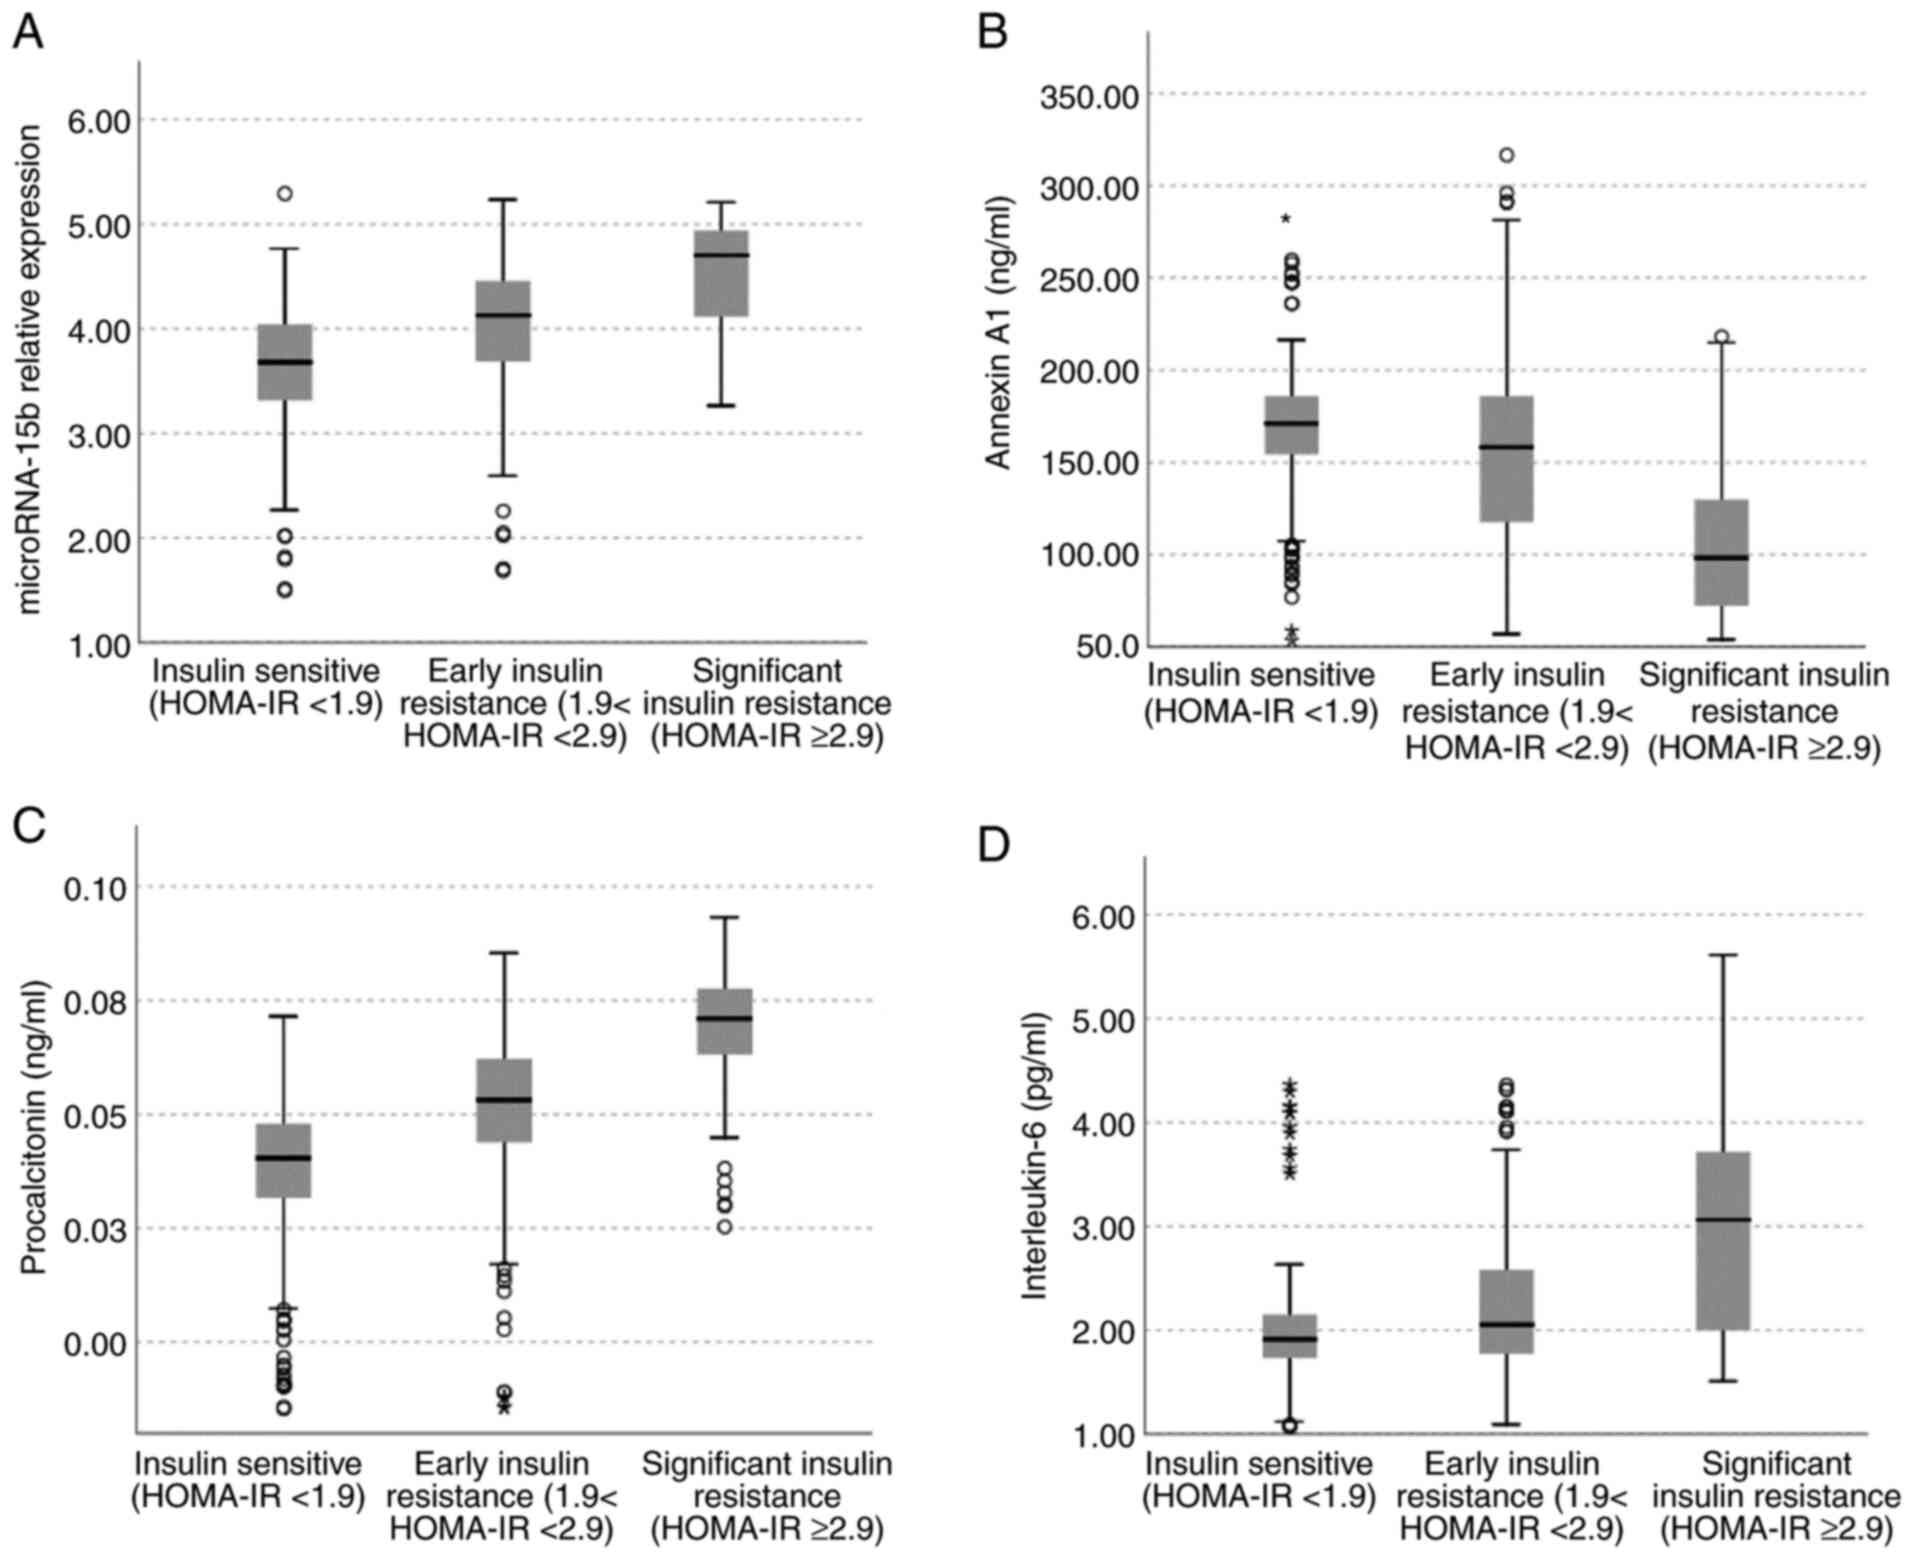
Comparison of serum levels of miR-15b,
Annexin A1, procalcitonin, and IL-6 in the whole study sample
according to the degree of their insulin sensitivity
The participants in the present study were insulin
sensitive [n=228 (36.8%)], early insulin resistant [n=290 (46.8%)],
and significant insulin resistant [n=102 (16.5%)]. Significant high
serum levels of miR-15b, procalcitonin, and IL-6 and low levels of
Annexin A1 were found in children with early and significant
insulin resistance compared to those who were insulin sensitive;
and in children with significant insulin resistance compared to
those with early insulin resistance (P<0.001 for all) (Fig. 1A-D).
Correlations of serum miR-15b, Annexin
A1, procalcitonin, and IL-6 levels in the whole study sample
The serum levels of miR-15b, procalcitonin, and IL-6
were positively correlated (while the serum levels of Annexin A1
were negatively correlated) with BMI and WC percentiles and with
serum levels of LDL-c, TAG, cholesterol, glucose, HbA1c%, insulin,
and CRP and with HOMA-IR (Table
II). The serum levels of miR-15b, procalcitonin, and IL-6
levels were negatively correlated with serum levels of HDL-c, while
Annexin A1 levels were positively correlated with serum levels of
HDL-c (Table II).
| Table IICorrelations of serum miR-15b,
Annexin A1, procalcitonin and IL-6 levels with anthropometric and
metabolic parameters in the whole study sample. |
Table II
Correlations of serum miR-15b,
Annexin A1, procalcitonin and IL-6 levels with anthropometric and
metabolic parameters in the whole study sample.
| Variables | Correlation/
significance | BMI percentile | WC percentile | HDL-c (mg/dl) | LDL-c (mg/dl) | TAG (mg/dl) | Cholesterol
(mg/dl) | Glucose
(mg/dl) | HbA1c (%) | Insulin
(µg/ml) | CRP (ng/ml) | HOMA-IR |
|---|
| miR-15bR | rs | 0.686 | 0.558 | -0.653 | 0.345 | 0.450 | 0.335 | 0.516 | 0.486 | 0.484 | 0.287 | 0.540 |
| | P-value | <0.001 |
<0.001a |
<0.001a |
<0.001a |
<0.001a |
<0.001a |
<0.001a |
<0.001a |
<0.001a |
<0.001a |
<0.001a |
| Annexina1
(ng/ml) | rs | -0.498 | -0.575 | 0.311 | -0.280 | -0.306 | -0.250 | -0.381 | -0.402 | -0.473 | -0.317 | -0.475 |
| | P-value | <0.001 |
<0.001a |
<0.001a |
<0.001a |
<0.001a |
<0.001a |
<0.001a |
<0.001a |
<0.001a |
<0.001a |
<0.001a |
| Procalcitonin
(ng/ml) | rs | 0.708 | 0.672 | -0.638 | 0.368 | 0.516 | 0.360 | 0.608 | 0.521 | 0.659 | 0.385 | 0.666 |
| | P-value | <0.001 |
<0.001a |
<0.001a |
<0.001a |
<0.001a |
<0.001a |
<0.001a |
<0.001a |
<0.001a |
<0.001a |
<0.001a |
| IL-6 (pg/ml) | rs | 0.400 | 0.402 | -0.304 | 0.280 | 0.273 | 0.235 | 0.384 | 0.339 | 0.337 | 0.308 | 0.405 |
| | P-value | <0.001 |
<0.001a |
<0.001a |
<0.001a |
<0.001a |
<0.001a |
<0.001a |
<0.001a |
<0.001a |
<0.001a |
<0.001a |
The serum miR-15b levels were positively correlated
with serum levels of procalcitonin (0.544, P<0.001), and IL-6
(0.261, P<0.001) while negatively correlated with serum Annexin
A1 levels (-0.265, P<0.001) (data not shown).
The serum Annexin A1 levels were negatively
correlated with serum levels of procalcitonin (-0.477, P<0.001)
and IL-6 (-0.331, P<0.001) (data not shown).
Serum procalcitonin levels were positively
correlated with serum IL-6 levels (0.441, P<0.001) (data not
shown).
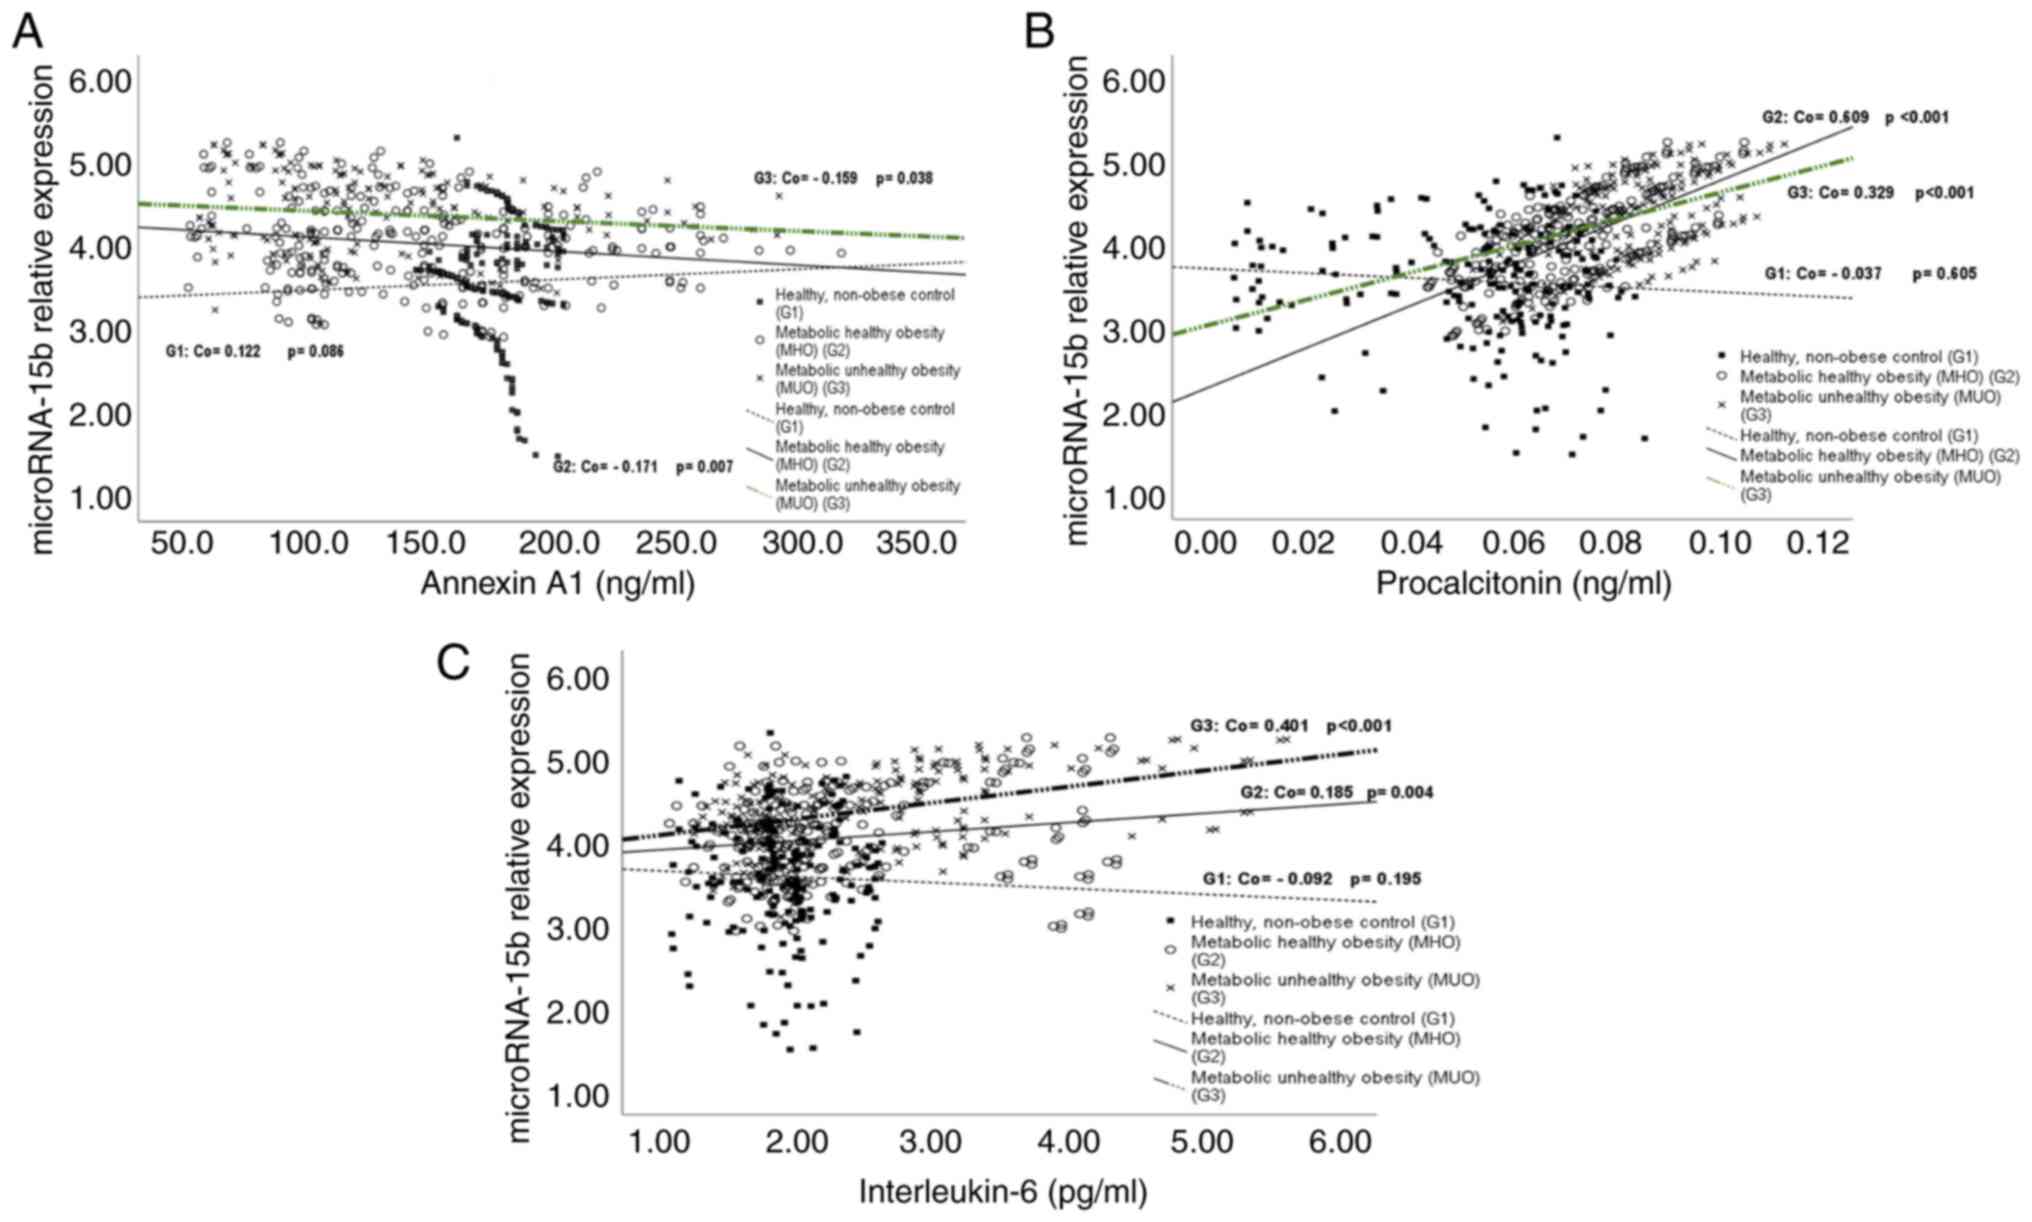
Correlations of serum miR-15b, Annexin
A1, procalcitonin, and IL-6 levels in the three studied groups
Serum miR-15b levels in the healthy control group (G1)
Serum miR-15b levels in the healthy control group
(G1) were positively correlated with BMI and WC percentiles and
with serum levels of LDL-c, TAG, TC, glucose, and HbA1C% and were
negatively correlated with HDL-c (Table III). Its correlations with serum
levels of Annexin A1, procalcitonin, and IL-6 were non-significant
(Fig. 2A-C).
| Table IIICorrelations of serum miR-15b,
Annexin A1, procalcitonin and IL-6 levels with anthropometric and
metabolic parameters in healthy non-obese control (G1), children
with MHO (G2) and children with MUO (G3). |
Table III
Correlations of serum miR-15b,
Annexin A1, procalcitonin and IL-6 levels with anthropometric and
metabolic parameters in healthy non-obese control (G1), children
with MHO (G2) and children with MUO (G3).
| Groups | Variables | Correlation/
significance | BMI percentile | WC percentile | HDL-c (mg/dl) | LDL-c (mg/dl) | TAG (mg/dl) | Cholesterol
(mg/dl) | Glucose
(mg/dl) | HbA1c (%) | Insulin
(µg/ml) | CRP (ng/ml) | HOMA-IR |
|---|
| Healthy, non-obese
control (G1, n=100) | miR-15bR | rs | 0.296 | 0.319 | -0.179 | 0.201 | 0.177 | 0.207 | 0.297 | 0.183 | -0.073 | -0.048 | 0.069 |
| | | P-value |
<0.001a |
<0.001a | 0.011a | 0.004a | 0.012a | 0.003a |
<0.001a | 0.009a | 0.307 | 0.501 | 0.331 |
| | Annexin A1 | rs | 0.026 | 0.000 | -0.014 | 0.022 | -0.085 | 0.004 | -0.032 | -0.052 | -0.004 | -0.002 | -0.033 |
| | (ng/ml) | P-value | 0.719 | 0.995 | 0.845 | 0.757 | 0.231 | 0.955 | 0.656 | 0.461 | 0.951 | 0.980 | 0.638 |
| | Procalcitonin | rs | 0.090 | 0.103 | -0.238 | 0.210 | 0.203 | 0.200 | 0.273 | 0.216 | 0.067 | 0.030 | 0.140 |
| | (ng/ml) | P-value | 0.205 | 0.146 | 0.001a | 0.003a | 0.004a | 0.004a |
<0.001a | 0.002a | 0.346 | 0.670 | 0.048a |
| | IL-6 (pg/ml) | rs | <0.001 | 0.021 | 0.027 | 0.122 | 0.188 | 0.168 | 0.032 | 0.171 | -0.097 | -0.050 | -0.002 |
| | | P-value | 0.995 | 0.767 | 0.704 | 0.085 | 0.008 | 0.017 | 0.652 | 0.015 | 0.173 | 0.486 | 0.974 |
| Metabolic healthy
obesity (MHO) (G2, n=41) | miR-15bR | rs | 0.994 | 0.387 | -0.985 | 0.446 | 0.282 | 0.431 | 0.458 | 0.433 | 0.369 | 0.382 | 0.469 |
| | | P-value |
<0.001a |
<0.001a |
<0.001a |
<0.001a |
<0.001a |
<0.001a |
<0.001a |
<0.001a |
<0.001a |
<0.001a |
<0.001a |
| | Annexin A1 | rs | -0.156 | -0.479 | 0.167 | -0.293 | -0.117 | -0.277 | -0.272 | -0.279 | -0.293 | -0.286 | -0.291 |
| | (ng/ml) | P-value | 0.014a |
<0.001a | 0.009a |
<0.001a | 0.066 |
<0.001a |
<0.001a |
<0.001a |
<0.001a |
<0.001a |
<0.001a |
| | Procalcitonin | rs | 0.591 | 0.431 | -0.607 | 0.461 | 0.230 | 0.439 | 0.466 | 0.417 | 0.430 | 0.471 | 0.479 |
| | (ng/ml) | P-value |
<0.001a |
<0.001a |
<0.001a |
<0.001a |
<0.001a |
<0.001a |
<0.001a |
<0.001a |
<0.001a |
<0.001a |
<0.001a |
| | IL-6 (pg/ml) | rs | 0.191 | 0.280 | -0.184 | 0.303 | 0.279 | 0.056 | 0.270 | 0.245 | 0.283 | 0.259 | 0.299 |
| | | P-value | 0.003a |
<0.001a |
<0.001a |
<0.001a |
<0.001a | 0.380 |
<0.001a |
<0.001a |
<0.001a |
<0.001a |
<0.001a |
| Metabolic unhealthy
obesity (MUO) (G3, n=29) | miR-15bR | rs | 0.487 | 0.452 | -0.427 | 0.269 | 0.265 | 0.089 | 0.429 | 0.426 | 0.363 | 0.403 | 0.414 |
| | | P-value |
<0.001a |
<0.001a |
<0.001a |
<0.001a |
<0.001a | 0.245 |
<0.001a |
<0.001a |
<0.001a |
<0.001a |
<0.001a |
| | Annexin A1 | rs | -0.532 | -0.547 | 0.391 | -0.393 | -0.174 | -0.227 | -0.486 | -0.526 | -0.564 | -0.530 | -0.550 |
| | (ng/ml) | P-value |
<0.001a |
<0.001a |
<0.001a |
<0.001a | 0.022a | 0.003a |
<0.001a |
<0.001a |
<0.001a |
<0.001a |
<0.001a |
| | Procalcitonin | rs | 0.598 | 0.544 | -0.498 | 0.332 | 0.324 | 0.452 | 0.558 | 0.520 | 0.443 | 0.569 | 0.527 |
| | (ng/ml) | P-value |
<0.001a |
<0.001a |
<0.001a |
<0.001a |
<0.001a |
<0.001a |
<0.001a |
<0.001a |
<0.001a |
<0.001a |
<0.001a |
| | IL-6 (pg/ml) | rs | 0.761 | 0.640 | -0.654 | 0.386 | 0.324 | 0.131 | 0.616 | 0.585 | 0.571 | 0.689 | 0.646 |
| | | P-value |
<0.001a |
<0.001a |
<0.001a |
<0.001a |
<0.001a | 0.084 |
<0.001a |
<0.001a |
<0.001a |
<0.001a |
<0.001a |
Serum miR-15b levels in children with
MHO (G2) and MUO (G3)
Serum miR-15b levels in children with MHO (G2) and
MUO (G3) were positively correlated with BMI and WC percentiles and
serum levels of LDL-c, TAG, TC, glucose, HbA1c%, insulin, and CRP
and with HOMA-IR while correlated negatively with HDL-c (Table III). In addition, serum miR-15b
levels were positively correlated with serum levels of
procalcitonin and IL-6 (Fig. 2B
and C). In contrast, they were
negatively correlated with serum Annexin A1 levels (Fig. 2A).
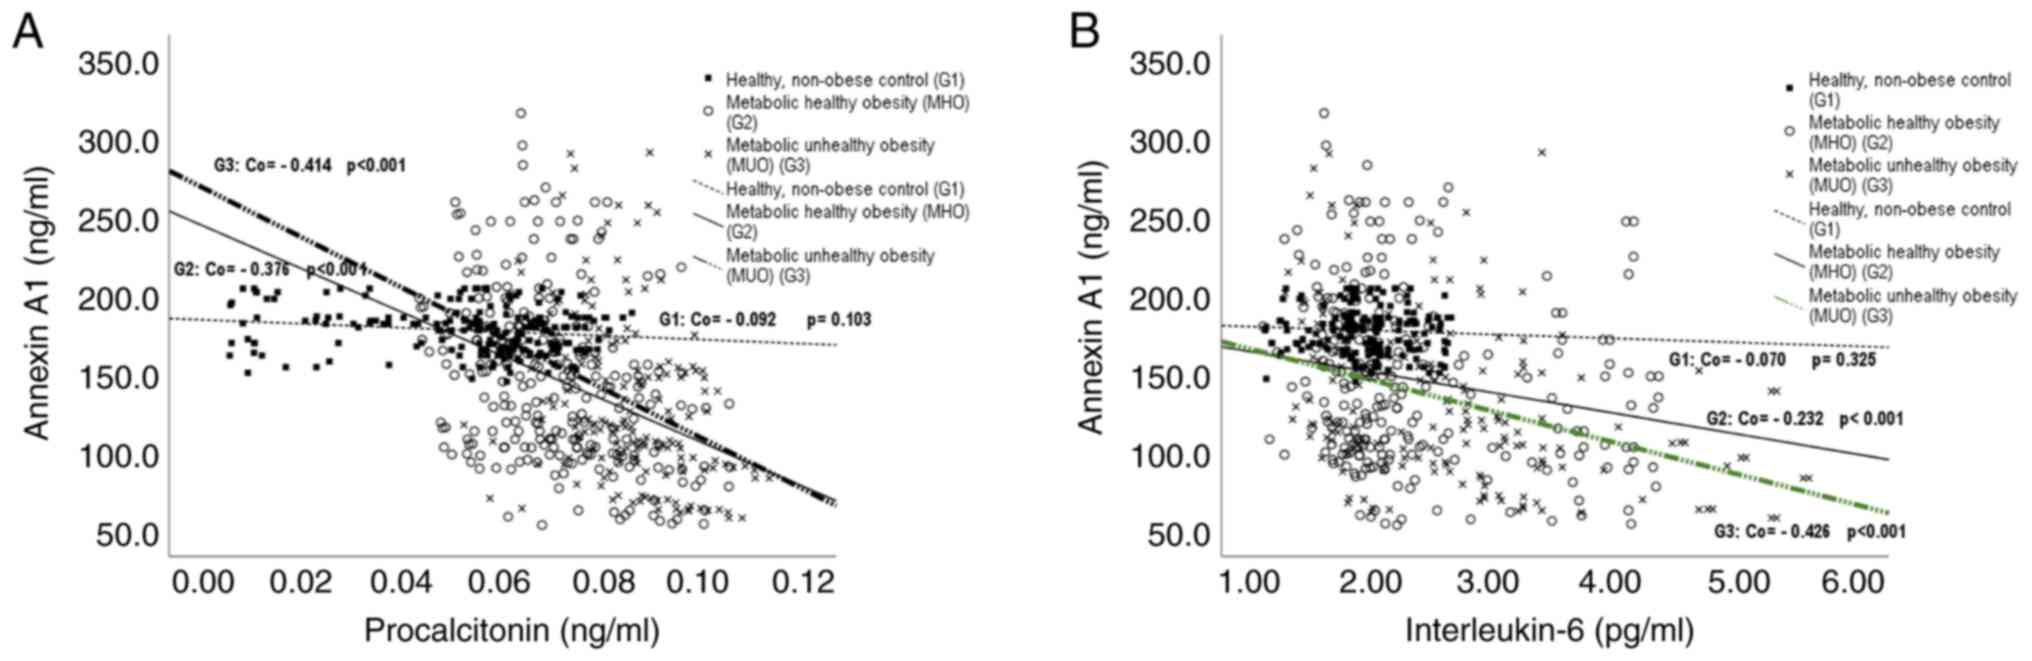
Serum Annexin A1 levels in the healthy
control group (G1)
Serum Annexin A1 levels in the healthy control group
(G1) showed non-significant correlations with all studied metabolic
and anthropometric parameters (Table
III) and, with serum levels of procalcitonin and IL-6 (Fig. 3A and B).
Serum Annexin A1 levels in children
with MHO (G2) and MUO (G3)
Serum Annexin A1 levels in children with MHO (G2)
and MUO (G3) were negatively correlated with BMI and WC percentiles
and with serum levels of LDL-c, TC, glucose, HbA1c%, insulin, and
CRP and with HOMA-IR (Table III)
and with serum levels of procalcitonin and IL-6 (Fig. 3A and B). They were also negatively correlated
with TAG in G3 (Table III). On
the other hand, Annexin A1 levels were correlated positively with
serum HDL-c levels in both groups (Table III).
Serum procalcitonin levels in the
healthy control group (G1)
Serum procalcitonin levels in the healthy control
group (G1) were positively correlated with serum levels of LDL-c,
TAG, TC, glucose, and HbA1c% and with HOMA-IR (Table III).
Serum procalcitonin levels in children
with MHO (G2) and MUO (G3)
Serum procalcitonin levels in children with MHO (G2)
and MUO (G3) were positively correlated with BMI and WC percentiles
and serum levels of LDL-c, TAG, TC, glucose, HbA1c%, insulin, and
CRP and with HOMA-IR while negatively correlated with HDL-c
(Table III). In addition, they
were positively correlated with serum levels of IL-6 (G2; 0.432,
P<0.001and G3; 0.862, P<0.001). On the other hand, serum
procalcitonin levels were negatively correlated with serum HDL-c
levels (Table III).
Serum levels of IL-6 in the healthy
control group (G1)
Serum levels of IL-6 in the healthy control group
(G1) were positively correlated with serum levels of TAG and HbA1C%
(Table III).
Serum levels of IL-6 in children with
MHO (G2) and MUO (G3)
Serum levels of IL-6 in children with MHO (G2) and
MUO (G3) were positively correlated with BMI and WC percentiles and
serum levels of LDL-c, TAG, glucose, HbA1c%, insulin, and CRP and
with HOMA-IR while serum levels of IL-6 in children with MHO (G2)
and MUO (G3) were negatively correlated with serum HDL-c levels
(Table III).
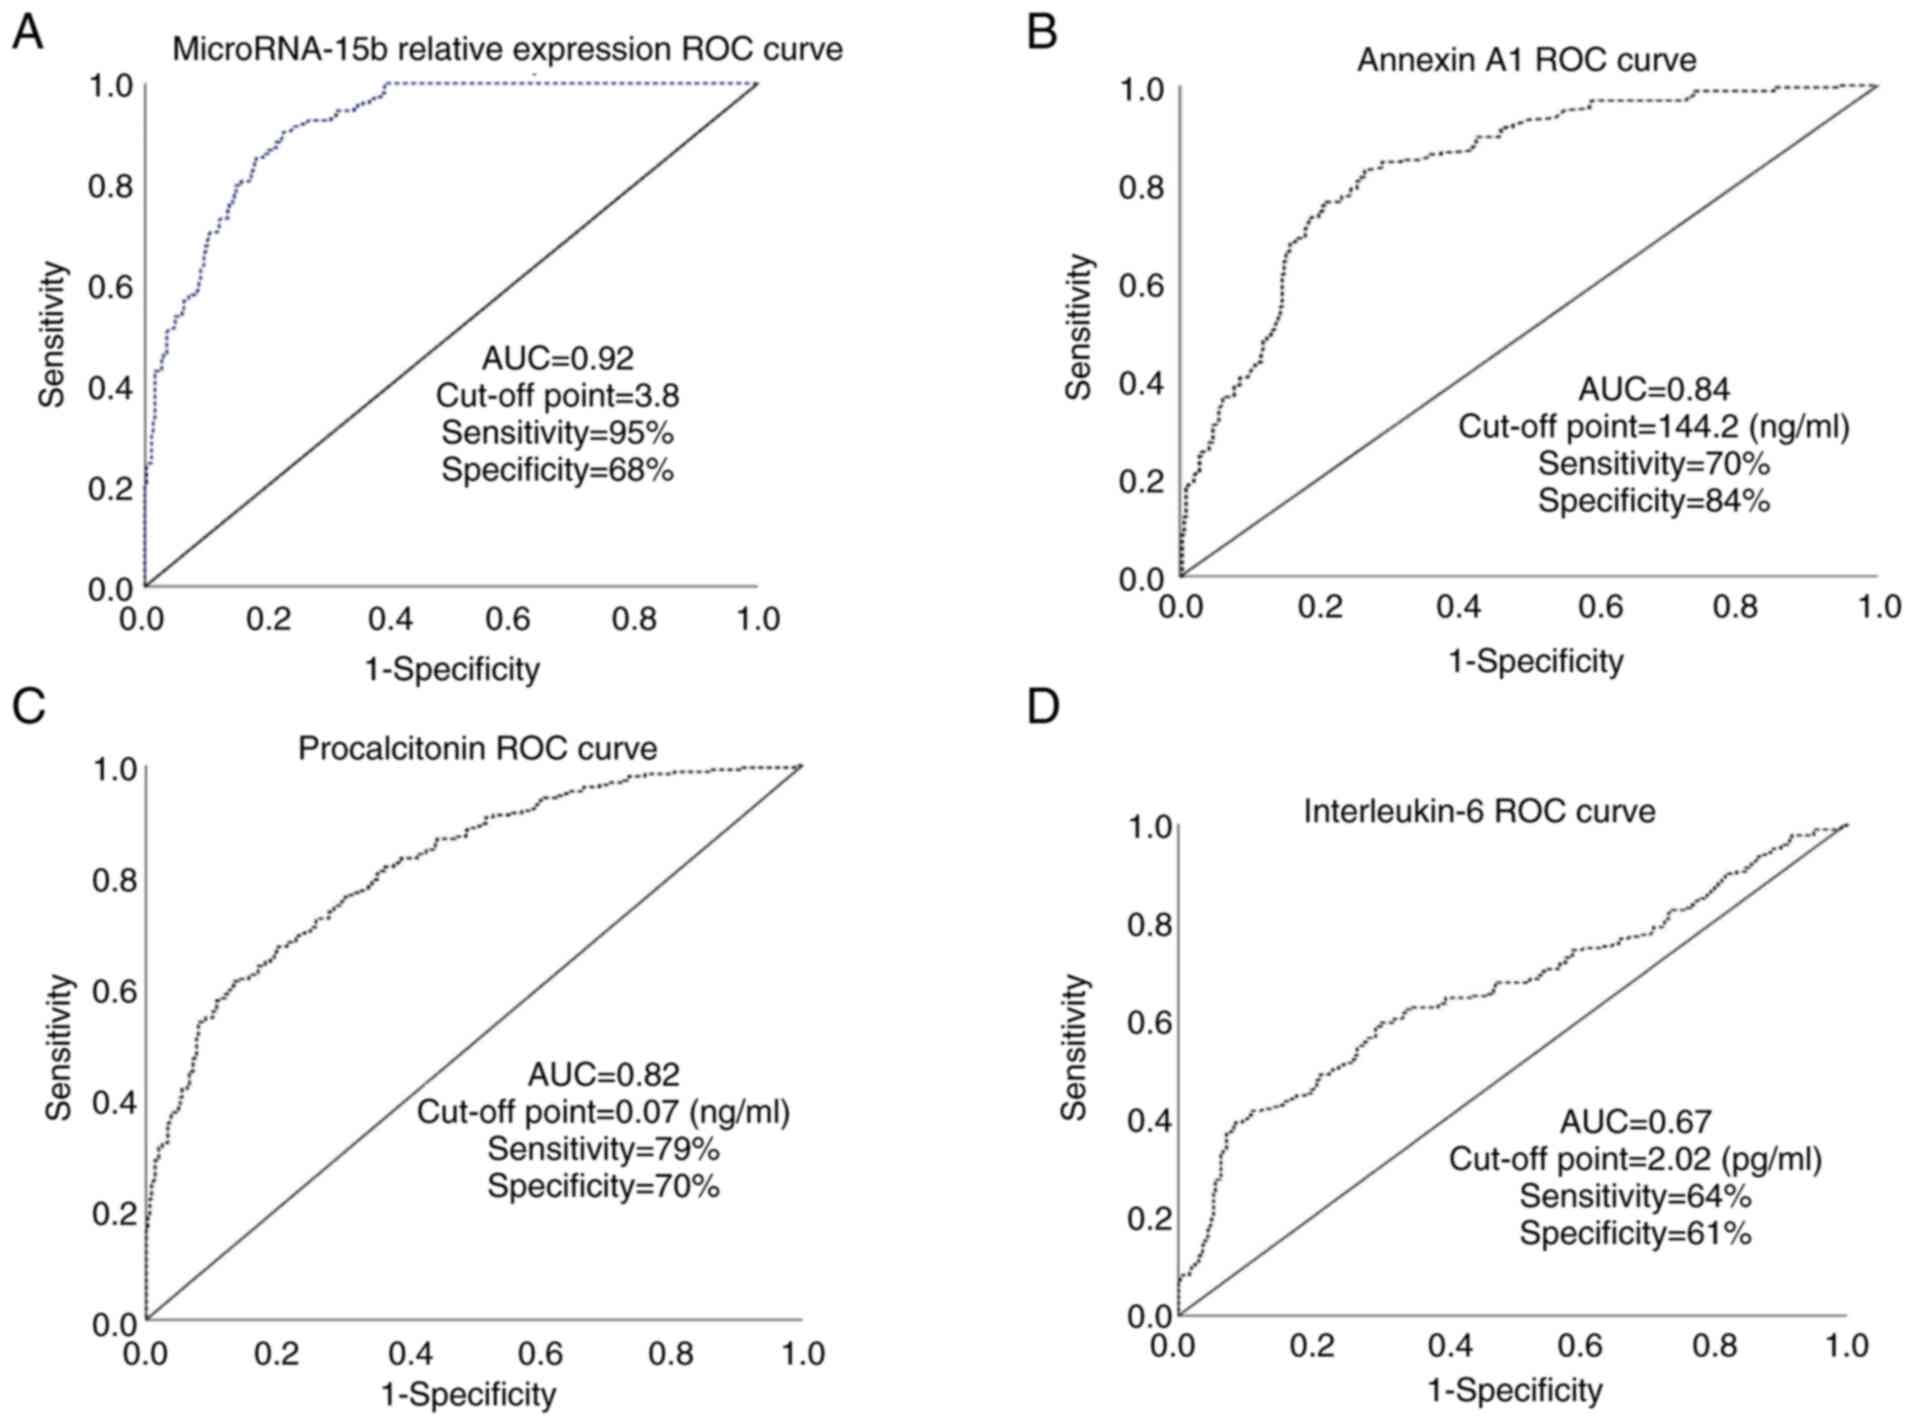
ROC curve results
The areas under the ROC curve (AUC) for the ability
of serum levels of miR-15b, Annexin A1, procalcitonin, and IL-6 to
differentiate children with MUO from those with MHO were (0.92,
0.84, 0.82, and 0.67, respectively) (Fig. 4A-D). While AUCs for other studied
parameters were 0.27 (BMI percentile), 0.28 (waist circumference
percentile), 0.11 (serum cholesterol), 0.48 (LDL-c), 0.15 (TAG),
0.58 (serum cholesterol), 019 (serum glucose), 0.50 (serum
insulin), and 0.42 (serum CRP) (data not shown).
Discussion
The increased serum levels of miR-15b,
procalcitonin, and interleukin (IL)-6 and the decreased levels of
Annexin A1, that were found in the present study, emphasize the
status of low inflammation that accompanies obesity (8). The accumulated fat in adipocytes
activates immune cells in adipose tissues to initiate an
immune-inflammatory process that results in unfavorable metabolic
consequences (8,12).
Several existing obesity management protocols
(diagnosis and treatment) are based on a body mass index (BMI) ≥30
kg/m2 (26). Yet,
research has revealed the incapability of BMI to correctly predict
obesity-associated complications (27). According to the IDF classification,
some obese individuals have a high risk to develop cardiometabolic
complications and are called as presenting with metabolically
unhealthy obesity (MUO), while those with lower risk present with
what is termed metabolically healthy obesity (MHO) (22). The criteria to differentiate
between both types were previously discussed in the Patients and
methods section (5,6). Some research has reported that MHO is
a strictly cardiometabolic benign condition (28) while other studies did not agree
(6). The present study aimed to
find new biomarkers that can differentiate between these two types
to allow timely management.
MicroRNAs play important roles in the development
and functions of the immune system and their abnormal expression
levels have been reported in obesity and its accompanying
complications (4,12). They fine-tune and regulate the
production of many inflammatory cytokines by regulating expression
of their genes (10). Of these
microRNAs, the overexpression of miR-15b was found to enhance the
inflammatory process, induced by certain viruses, by targeting the
ring finger protein 125 (RNF-125). This leads to the induction of
retinoic acid-inducible gene I and excess production of
pro-inflammatory cytokines (29).
In addition, miR-15b binds to the 3'untranslated ends of the
insulin receptor substrate 1 mRNAs to repress them. This results in
decreasing glucose uptake by cells and ultimately, insulin
resistance (11).
The findings of the present study are in accordance
with the results reported by many previous studies. Yang et
al (11) revealed an increase
in serum miR-15b levels in mice fed a high-fat diet (obese) and
these levels were associated with insulin resistance in
hepatocytes. Cui et al (3)
reported high circulating miR-15b in obese children and adults with
T2DM. They revealed that miR-15b and miR-146b could suppress
insulin secretion in response to high glucose levels and concluded
that circulating miR-15b levels could predict the future risk of
developing T2DM in obese children (3). Mohany et al (4) found an increase in serum miR-15b
levels in obese children especially those with T2DM. They also
revealed significant positive correlations between these levels and
BMI percentile, serum levels of glucose, and HbA1c% (4).
Annexin A1 is an anti-inflammatory protein that acts
through formyl-peptide-receptor-2 (FPR-2) in many cellular
functions. It diminishes the production of pro-inflammatory
cytokines by neutrophils and enhances the apoptosis of neutrophils,
inhibits phospholipase A2 and consequently dampens the eicosanoid
biosynthesis, and suppresses the process of adipogenesis (13,14,30).
The biosynthesis of Annexin A1 is regulated by
glucocorticoids, the finding that was emphasized by the decreased
anti-inflammatory response to glucocorticoids in Annexin
A1-deficient mice (16).
The results of the present study agree with the
findings of Kosicka et al (16) who found a reduction in plasma
Annexin A1 levels in obese individuals and these levels were
correlated negatively with BMI, total body fat, plasma levels of
CRP, and leptin. They concluded that the decrease in Annexin A1
(anti-inflammatory protein) that occurred concurrently with the
increase in body fat is strongly associated with obesity-related
inflammation and cardiometabolic complications (16). In addition, the findings of the
present study agree with Sajid et al (30) who concluded that Annexin A1 could
decrease the accumulation of fat in adipocytes and suppress the
process of adipogenesis. They also suggested a therapeutic role for
Annexin A1/FPR2 to eliminate obesity accompanying inflammation
(30).
By contrast, Aguilera et al (15) found overexpression of the Annexin
A1 gene in the adipose tissues of obese children. Pietrani et
al (14) detected a
non-significant difference in the serum Annexin A1 levels between
patients with T2DM and non-diabetic controls. When they classified
the participants according to their BMI, the authors found higher
serum levels of Annexin A1 in obese patients with T2DM than in
normal-weight healthy individuals (14). These increased serum levels of
Annexin A1 were assumed as an attempt by the body to counteract the
systemic inflammatory process in obese subjects with/without T2DM.
Unfortunately, these high serum levels of Annexin A1 were not
effective to dampen the inflammatory cascades due to their cleavage
in the adipose tissues (14).
Procalcitonin is produced by numerous tissues all
over the body including the adipose tissue. The exact role of
procalcitonin is still undetermined and is under investigation
(31). Its secretion is increased
in response to bacterial (but not viral) infections and other
inflammatory stimuli and has been considered as a marker for
systemic inflammations (32).
Serum levels of procalcitonin have been used as a supportive test
for diagnosis of sepsis; levels ≥ 0.1 ng/ml suggest bacterial
infection that indicates antibacterial therapy and levels ≥0.5
ng/ml suggest severe sepsis (31,33).
The findings of the present study are in accordance
with the results of Linscheid et al (34) and Van Gaal et al (35) who reported that the secretion of
procalcitonin from the adipose tissue is induced by activation of
the resident macrophages and is proportionate to the amount of
accumulated fats. In addition, Abbasi et al (17) and Ghanem and Khalid (36) found an association between serum
levels of procalcitonin and obesity and insulin resistance, and
these levels were found to be correlated with HOMA-IR and serum
levels of CRP. Moreover, El Kassas et al (18) revealed significantly high serum
procalcitonin levels in obese children compared to non-obese
controls (P<0.001), and these levels were positively correlated
with BMI, HOMA-IR, and serum levels of insulin, cholesterol, TAG,
and CRP. In contrast, Boursier et al (37) found non-significant correlations
between plasma calcitonin levels and insulin resistance.
Regarding IL-6, the results of the present study are
in accordance with Khaodhiar et al (19) who found significantly increased
levels of serum IL-6 in obese and morbidly obese individuals
compared to normal-weight individuals, and these levels were
positively correlated with BMI. They concluded that adipose
tissue-derived IL-6 was proportionate to the degree of fat
accumulations, especially in the abdominal region (19). Moreover, Ellulu et al
(8) concluded that obesity is
associated with increased serum levels of inflammatory markers such
as TNF-α, IL-6, and CRP. Moreover, El-Mikkawy et al
(21) reported high levels of
serum IL-6 in obese and overweight individuals compared to
normal-weight individuals (P<0.001), and these levels were found
to be positively correlated with BMI and negatively with
HDL-cholesterol. They concluded that levels of serum IL-6 were good
indicators of obesity-associated low-grade inflammation (21).
Despite finding high serum levels of IL-6 in obese
compared to non-obese subjects in the study conducted by
Takumansang et al (20),
they found no association between these levels and insulin
resistance which is contrary to the findings of the present study.
In addition, contrary to the present study, Neeland et al
(27) reported a normal hormonal,
inflammation, and immune profile in children with MHO.
To the best of our knowledge, the present study was
the first to test the ability of serum levels of miR-15b, Annexin
A1, procalcitonin, and IL-6 to differentiate children with MUO from
those with MHO. In this regard, the present work revealed that
serum levels of miR-15b (relative expression), Annexin A1 and
procalcitonin are good biomarkers in this regard (when compared to
the classically used parameters) with cut-off points=3.8, 144
ng/ml, 0.07 ng/ml and AUCs=0.92, 0.84, and 0.82, respectively.
One potential limitation of the present study was
that the participants in the study groups were not sexually
maturation matched.
In conclusion, high serum levels of miR-15b,
procalcitonin, and IL-6, and low levels of Annexin A1 were found in
obese children especially those with MUO. Measuring these levels
could differentiate children with MUO from those with MHO which
could help the early management of these cases and their
accompanying complications. Future studies on a large-sized
population are recommended to emphasize these findings.
Acknowledgements
Not applicable.
Funding
Funding: This study was funded and acknowledged by Qassim
University, represented by the deanship of scientific research
(grant no. 2019-2-2-I-5441).
Availability of data and materials
The datasets used and/or analyzed during the current
study are available from the corresponding author on reasonable
request.
Authors' contributions
KMM was responsible for the conception and design of
the study, the acquisition of the data, analysis of the data and
interpretation of the data. This author also drafted the manuscript
and substantially revised it. OAR was responsible for the
conception and design of the study. This author also drafted the
manuscript and substantially revised it. OAW was responsible for
the conception of the study and substantially revised the
manuscript. MA was responsible for the conception of the study and
substantially revised the manuscript. AAN was responsible for the
conception and design of the work, the acquisition of the data and
substantially revised the manuscript. KMM, OAR and OAW confirm the
authenticity of all the raw data. All authors read and approved the
manuscript and agree to be accountable for all aspects of the
research in ensuring that the accuracy or integrity of any part of
the work (including data) are appropriately investigated and
resolved.
Ethics approval and consent to
participate
The present work was conducted in three primary
health care centers in Unaizah, Qassim area, Saudi Arabia after
being reviewed and approved by the Qassim University Medical Ethics
Board (approval no. mduc-2019-2-2-I-5441). All procedures performed
were in accordance with the 1964 Helsinki declaration and its later
amendments or comparable ethical standards. Informed written
consents were obtained from all children's guardians.
Patient consent for publication
Not applicable.
Competing interests
The authors declare that they have no competing
interests.
References
|
1
|
World Health Organization: Report of the
commission on ending childhood obesity. Implementation plan:
Executive summary. Geneva: World Health Organization, 2017.
|
|
2
|
Al Dhaifallah A, Mwanri L and Aljoudi A:
Childhood obesity in Saudi Arabia: Opportunities and challenge.
Saudi J Obesity. 3:2–7. 2015.
|
|
3
|
Cui X, You L, Zhu L, Wang X, Zhou Y, Li Y,
Wen J, Xia Y, Wang X, Ji C and Guo X: Change in circulating
microRNA profile of obese children indicates future risk of adult
diabetes. Metab Clin Exp. 78:95–105. 2018.PubMed/NCBI View Article : Google Scholar
|
|
4
|
Mohany KM, Al Rugaie O, Al-wutayd O,
Al-Nafeesah A and Saleem TH: Association between circulating
microRNAs 486, 146b and 15b and serum betatrophin levels in obese;
type 2 diabetic and non-diabetic children. BMC Endocr Disord.
20(145)2020.PubMed/NCBI View Article : Google Scholar
|
|
5
|
Eckel N, Li Y, Kuxhaus O, Stefan N, Hu FB
and Schulze MB: Transition from metabolic healthy to unhealthy
phenotypes and association with cardiovascular disease risk across
BMI categories in 90 257 women (the Nurses' Health Study): 30 Year
follow-up from a prospective cohort study. Lancet Diabetes
Endocrinol. 6:714–724. 2018.PubMed/NCBI View Article : Google Scholar
|
|
6
|
Blüher M: Metabolically healthy obesity.
Endocr Rev. 41(bnaa004)2020.PubMed/NCBI View Article : Google Scholar
|
|
7
|
Caleyachetty R, Thomas GN, Toulis KA,
Mohammed N, Gokhale KM, Balachandran K and Nirantharakumar K:
Metabolically healthy obese and incident cardiovascular disease
events among 3.5 million men and women. J Am Coll Cardiol.
70:1429–1437. 2017.PubMed/NCBI View Article : Google Scholar
|
|
8
|
Ellulu MS, Patimah I, Khaza'ai H, Rahmat A
and Abed Y: Obesity and inflammation: The linking mechanism and the
complications. Arch Med Sci. 13:851–863. 2017.PubMed/NCBI View Article : Google Scholar
|
|
9
|
Iacomino G and Siani A: Role of microRNAs
in obesity and obesity-related diseases. Genes Nutr.
12(23)2017.PubMed/NCBI View Article : Google Scholar
|
|
10
|
Marques-Rocha JL, Samblas M, Milagro FI,
Bressan J, Martínez JA and Marti A: Noncoding RNAs, cytokines, and
inflammation-related diseases. FASEB J. 29:3595–3611.
2015.PubMed/NCBI View Article : Google Scholar
|
|
11
|
Yang WM, Jeong HJ, Park SW and Lee W:
Obesity-induced miR-15b is linked causally to the development of
insulin resistance through the repression of the insulin receptor
in hepatocytes. Mol Nutr Food Res. 59:2303–2314. 2015.PubMed/NCBI View Article : Google Scholar
|
|
12
|
Zhong H, Ma M, Liang T and Guo L: Role of
MicroRNAs in obesity-induced metabolic disorder and immune
response. J Immunol Res. 2018(2835761)2018.PubMed/NCBI View Article : Google Scholar
|
|
13
|
Sugimoto MA, Vago JP, Teixeira MM and
Sousa LP: Annexin A1 and the resolution of inflammation: Modulation
of neutrophil recruitment, apoptosis, and clearance. J Immunol Res.
2016(8239258)2016.PubMed/NCBI View Article : Google Scholar
|
|
14
|
Pietrani NT, Ferreira CN, Rodrigues KF,
Perucci LO, Carneiro FS, Bosco AA, Oliveira MC, Pereira SS,
Teixeira AL, Alvarez-Leite JI, et al: Proresolving protein Annexin
A1: The role in type 2 diabetes mellitus and obesity. Biomed
Pharmacother. 103:482–489. 2018.PubMed/NCBI View Article : Google Scholar
|
|
15
|
Aguilera CM, Gomez-Llorente C, Tofe I,
Gil-Campos M, Cañete R and Gil Á: Genome-wide expression in
visceral adipose tissue from obese prepubertal children. Int J Mol
Sci. 16:7723–7737. 2015.PubMed/NCBI View Article : Google Scholar
|
|
16
|
Kosicka A, Cunliffe AD, Mackenzie R,
Zariwala MG, Perretti M, Flower RJ and Renshaw D: Attenuation of
plasma Annexin A1 in human obesity. FASEB J. 27:368–378.
2013.PubMed/NCBI View Article : Google Scholar
|
|
17
|
Abbasi A, Corpeleijn E, Postmus D,
Gansevoort RT, de Jong PE, Gans RO, Struck J, Hillege HL, Stolk RP,
Navis G and Bakker SJ: Plasma procalcitonin is associated with
obesity, insulin resistance, and the metabolic syndrome. J Clin
Endocrinol Metab. 95:E26–E31. 2010.PubMed/NCBI View Article : Google Scholar
|
|
18
|
El Kassas GM, Shehata MA, El Wakeel MA,
Amer AF, Elzaree FA, Darwish MK and Amer MF: Role of procalcitonin
as an inflammatory marker in a sample of Egyptian children with
simple obesity. Open Access Maced J Med Sci. 6:1349–1353.
2018.PubMed/NCBI View Article : Google Scholar
|
|
19
|
Khaodhiar L, Ling PR, Blackburn GL and
Bistrian BR: Serum levels of interleukin-6 and C-reactive protein
correlate with body mass index across the broad range of obesity.
JPEN J Parenter Enteral Nutr. 28:410–415. 2004.PubMed/NCBI View Article : Google Scholar
|
|
20
|
Takumansang R, Warouw SM and Lestari H:
Interleukin-6 and insulin resistance in obese adolescents. Paediatr
Indones. 53:268–272. 2013.
|
|
21
|
El-Mikkawy DM, EL-Sadek MA, EL-Badawy MA
and Samaha D: Circulating level of interleukin-6 in relation to
body mass indices and lipid profile in Egyptian adults with
overweight and obesity. Egypt Rheumatol Rehabil. 47(7)2020.
|
|
22
|
Zimmet P, Alberti KG, Kaufman F, Tajima N,
Silink M, Arslanian S, Wong G, Bennett P, Shaw J and Caprio S: IDF
Consensus Group. The metabolic syndrome in children and
adolescents-an IDF consensus report. Pediatr Diabetes. 8:299–306.
2007.PubMed/NCBI View Article : Google Scholar
|
|
23
|
Matthews DR, Hosker JP, Rudenski AS,
Naylor BA, Treacher DF and Turner RC: Homeostasis model assessment:
Insulin resistance and beta-cell function from fasting plasma
glucose and insulin concentrations in man. Diabetologia.
28:412–419. 1985.PubMed/NCBI View Article : Google Scholar
|
|
24
|
Ivo D'Urso P, Fernando D'Urso O, Damiano
Gianfreda C, Mezzolla V, Storelli C and Marsigliante S: miR-15b and
miR-21 as circulating biomarkers for diagnosis of glioma. Curr
Genomics. 16:304–311. 2015.PubMed/NCBI View Article : Google Scholar
|
|
25
|
Livak KJ and Schmittgen TD: Analysis of
relative gene expression data using real-time quantitative PCR and
the 2(-Delta Delta C(T)) method. Methods. 25:402–408.
2001.PubMed/NCBI View Article : Google Scholar
|
|
26
|
Garvey WT, Mechanick JI, Brett EM, Garber
AJ, Hurley DL, Jastreboff AM, Nadolsky K, Pessah-Pollack R and
Plodkowski R: Reviewers of the AACE/ACE Obesity Clinical Practice
Guidelines. American association of clinical endocrinologists and
American college of endocrinology comprehensive clinical practice
guidelines for medical care of patients with obesity. Endocr Pract.
22 (Suppl 3):S1–S203. 2016.PubMed/NCBI View Article : Google Scholar
|
|
27
|
Neeland IJ, Ross R, Després JP, Matsuzawa
Y, Yamashita S, Shai I, Seidell J, Magni P, Santos RD, Arsenault B,
et al: Visceral and ectopic fat, atherosclerosis, and
cardiometabolic disease: A position statement. Lancet Diabetes
Endocrinol. 7:715–725. 2019.PubMed/NCBI View Article : Google Scholar
|
|
28
|
Vukovic R, Dos Santos TJ, Ybarra M and
Atar M: Children with metabolically healthy obesity: A review.
Front Endocrinol (Lausanne). 10(865)2019.PubMed/NCBI View Article : Google Scholar
|
|
29
|
Li Y and Shi X: MicroRNAs in the
regulation of TLR and RIG-I pathways. Cell Mol Immunol. 10:65–71.
2013.PubMed/NCBI View Article : Google Scholar
|
|
30
|
Sajid S, Renshaw D, Burke B and Mee C:
Investigating the role of Annexin A1 in adipogenesis and its
ability to dampen obesity associated inflammation. Endocr Abstr.
50(335)2017.
|
|
31
|
Becker KL, Snider R and Nylen ES:
Procalcitonin in sepsis and systemic inflammation: A harmful
biomarker and a therapeutic target. Br J pharmacol. 159:253–264.
2010.PubMed/NCBI View Article : Google Scholar
|
|
32
|
Briel M, Schuetz P, Mueller B, Young J,
Schild U, Nusbaumer C, Périat P, Bucher HC and Christ-Crain M:
Procalcitonin-guided antibiotic use vs a standard approach for
acute respiratory tract infections in primary care. Arch Intern
Med. 168:2000–2008. 2008.PubMed/NCBI View Article : Google Scholar
|
|
33
|
Mehanic S and Baljic R: The importance of
serum procalcitonin in diagnosis and treatment of serious bacterial
infections and sepsis. Mater Sociomed. 25:277–281. 2013.PubMed/NCBI View Article : Google Scholar
|
|
34
|
Linscheid P, Seboek D, Schaer DJ, Zulewski
H, Keller U and Müller B: Expression and secretion of procalcitonin
and calcitonin gene-related peptide by adherent monocytes and by
macrophage-activated adipocytes. Crit Care Med. 32:1715–1721.
2004.PubMed/NCBI View Article : Google Scholar
|
|
35
|
Van Gaal LF, Mertens IL and De Block CE:
Mechanisms linking obesity with cardiovascular disease. Nature.
444:875–880. 2006.PubMed/NCBI View Article : Google Scholar
|
|
36
|
Ghanem AI and Khalid M: Association of
serum procalcitonin (PCT) and high-sensitivity C-reactive protein
(hs-CRP) levels with insulin resistance and obesity in type 2
Egyptian diabetic patients. Med J Cairo Univ. 84:1165–1171.
2016.
|
|
37
|
Boursier G, Avignon A, Kuster N, Boegner
C, Leprieur E, Picandet M, Bargnoux AS, Badiou S, Dupuy AM, Cristol
JP and Sultan A: Procalcitonin, an independent marker of abdominal
fat accumulation in obese patients. Clin Lab. 62:435–441.
2016.PubMed/NCBI View Article : Google Scholar
|