Introduction
Radix Wikstroemia indica (L.) C.A. Mey. (RWI)
is a toxic Chinese herbal medicine (CHM) that functions by clearing
away toxic material (such as anti-respiratory syncytial virus)
(1), reducing swelling and exerting
an analgesic effect (2). The
primary chemical ingredients of RWI are coumarin, lignans,
flavonoids, anthraquinone, steroids, saponins, terpenoids, amides,
polysaccharides and volatile oils (3-12).
Research has shown that RWI has antibacterial, anti-inflammatory,
anti-viral and anti-tumorigenic effects (13-17).
In Traditional Chinese Medicine (TCM), it is primarily used to
treat acute tonsillitis, chronic bronchitis, hepatitis, liver
cirrhosis, nephritis, limb pain and cancer (2). However, research on RWI has primarily
focused on the separation of the chemical components to address
their individual biological activities, with less of a focus on
metabolism, the mechanisms of toxicity or reducing the toxicity of
RWI. There are no clear definitions for a suitable treatment dose,
and what dose would be considered to exert toxic effects if used
clinically (18).
RWI was excluded from the China Pharmacopeia due to
its toxic side effects (19).
Studies have confirmed that RWI is hepatotoxic and nephrotoxic
product (20). The aim of
processing is to improve the efficacy of CHMs, or weaken or
eliminate their toxicity. RWI is a medicine that is primarily used
by people of Miao descent. Therefore, it is not included in the
current Chinese Pharmacopoeia (21), but it is included in the quality
standard of Traditional Chinese Medicine in the Guizhou Province.
‘Sweat-soaking’ is a special processing method commonly used in
ethnic minority areas and believed to reduce the toxicity and
improve the safety of TCM products. Analyses of active ingredients
(22,23), pharmacodynamics (24) and toxicology (25,26)
provide evidence supporting the use of this method to significantly
reduce the toxicity of RWI, whilst preserving its pharmacological
properties. Indeed, three highly toxic components (YH-10, YH-12 and
YH-15) have been identified in RWI, and their levels were
significantly reduced after sweat soaking (27). Nevertheless, there is a lack of
studies on the endogenous metabolites of the raw and processed RWI,
and the detoxification mechanism of processing RWI using the
sweat-soaking method remains uncertain.
The aim of the present study was to explore the
endogenous metabolic alterations and potential mechanisms of
detoxification of RWI using the sweat-soaking method based on
proton nuclear magnetic resonance (1H-NMR) metabolomic
analysis. The urine metabolism spectrum was monitored using 600-MHz
high-resolution 1H-NMR after intragastric administration
of raw and processed RWI ethanol extracts to clarify the mechanism
underlying the detoxification of RWI after sweat-soaking. The
findings may provide a basis for the clinical application of
processed RWI, as well as a novel method of the evaluation for this
processing method.
Materials and methods
Instruments
A Unity-Inova 600 Superconducting Nuclear Magnetic
Resonance Spectrometer (Varian, Inc.), Ultrasonic instrument
(Kunshan Ultrasonic Instrument Co., Ltd.); FA2004 Electronic
analytical balance (Hengping Instrument Factory), Eppendorf
MiniSpin Plus centrifuge (Eppendorf); nitrogen-blowing instrument
(Yi Yao Instrument Technology Development Co., Ltd.); Targin VX-02
Multi-tube Vortex oscillator (Tadjin Technology Co., Ltd.), BJ 1
stainless steel metabolic cage (Changsha Tianqin Biotechnology Co.,
Ltd.), and 202-3AB drying oven (TaiSite Instrument Co., Ltd.) were
used in the present study.
Drugs and reagents
RWI was collected from Guangxi Yinfeng International
(lot no. 20160115). The raw and processed RWI ethanol extract was
produced by the Pharmaceutical Preparation Laboratory of Guizhou
University of Traditional Chinese Medicine (lot nos. YC20160410 and
PZ20160420). 3-Trimethylsilyl-2,2,3,3-d4 acid sodium salt (TSP)
(Merck Company, German), sodium pentobarbital (Sigma-Aldrich; Merck
KGaA; lot no. 922L0310), acetonitrile (chromatographic grade; Fluca
Company) and deuterated deuterium oxide (D2O; Cambridge
Isotope Laboratories, Inc.) were used in the present study. All
other reagents mentioned were of analytical grade.
Animals and administration
Specific pathogen-free Sprague-Dawley rats (weight,
200±20; age, 6 weeks), were purchased from Changsha Tianqin
Biotechnology Co., Ltd. (animal license no. 43000200002163).
Animals were provided ad libitum access to standard food and
water under a 12-h light/dark cycle in a maintained environment
(temperature, 25±1˚C; relative humidity, 50±10%). All animal care
and experimental operations were implemented under the Animal
Management Rules of the Ministry of Health of the People's Republic
of China.
A total of male SD rats were randomly divided into a
control group, a raw RWI group and a processed RWI group. After 1
week of adaptive feeding in a metabolic cage, the two experimental
groups were given orally with raw and processed RWI (0.3175
g/kg),respectively, at 9:00 am everyday (7 days in total), whereas
the control group was administrated with an equivalent volume of 1%
CMC-Na for 7 days. The urine of the rats was collected in the
metabolic cage for 24 h at 0, 1, 3, 5 and 7 days. Urine was thawed
before use over a 0.22-µm microporous membrane. These samples were
centrifuged at 12,100 x g for 10 min at 4˚C, and the supernatant
was collected and stored at -20˚C. During administration of RWI,
food and water were provided as normal. The rats were euthanized on
the 8th day by intraperitoneal injection of 200 mg/kg sodium
pentobarbital, and death was confirmed by cessation of breathing
and heartbeat. The animal experiments were reviewed and approved by
the Ethics Review Committee for Experimental Animals of Guizhou
University of Traditional Chinese Medicine and met the relevant
requirements for animal welfare.
Preparation of ‘artificial sweat’ and
‘sweat-soaking’ of RWI
To prepare artificial sweat, histidine HCL (0.5
g/l), NaH2PO4.2H2O (2.2 g/l) and
NaCl (5.0 g/l) were dissolved in ultrapure water. The pH was
adjusted to 5.5 using NaOH (0.05 mol/l). For sweat-soaking, the raw
RWI root was sliced and sprayed with artificial sweat evenly. A
total of 100 kg raw RWI root consumed 30 kg ‘artificial sweat’.
Then the mixtures were placed in an oven for 24 h (37.0±0.5˚C in
the light for 12 h, and then at room temperature in the dark for 12
h). The procedure was repeated 14 times as described previously
(27).
Preparation of raw and processed RWI
ethanol extracts
The preparation of RWI ethanol extracts was
performed as previously described (27). Briefly, the raw and processed RWI
samples were percolated with 70% ethanol solvent (volume of 70%
ethanol is 14 times that of medicinal materials) at a seepage rate
of 5 ml/min/kg. The infiltrate was concentrated on a rotary
evaporator under negative pressure, and finally dried using a
lyophilizer to obtain the freeze-dried power. The powder was stored
at -20˚C until required.
Urine sample preparation and
1H-NMR spectra acquisition
A total of 350 µl urine was mixed with 350 µl PBS
(0.2 M; pH 7.4), then centrifuged at 12,100 x g for 10 min at 4˚C.
The supernatant (600 µl) was transferred to NMR tubes (5 mm)
containing 30 µl TSP/D2O solutions (1 mg/ml), and the
mixtures were immediately stored at -4˚C until required.
The urine spectra were captured on a Varian Unity
INOVA 600 MHz spectrometer. A standard one-dimensional NOESY
presaturation pulse sequence of pre-saturation was used with the
following parameters: Spectral width, 8,000 Hz; sampling points, 64
k, and 64 scans. The water peak was suppressed by means of
pre-saturation on relaxation delay, and the spectrometer bias was
set at the position of the water peak. The free induction decay
signal was transformed into NMR spectra by Fourier transform, and
the phase was corrected. TSP was used as the chemical shift
reference peak, defined as δ0.
Data processing and statistical
analysis
The data were corrected by exporting the detection
data table. The data filling principle was used to retain all
detected ppm chemical shifts, in which the null value was filled
with the minimum value. The smoothing data filtering conditions
were: A robust estimate, such as the interquartile range; <250
variables, 5% was filtered; 250-500 variables, 10% was filtered;
500-1,000 variables, 25% was filtered; >1,000 variables, 40% was
filtered; sample standardization was based on normalization using
the total integral strength, and data normalization was based on
the mean, centered and divided by the standard deviation of each
variable.
Each 1H-NMR spectrum was phase-adjusted
and baseline-corrected manually. For cpmgpr1d (CPMG) data,
segmentation of 0.4-4.4 spectra was performed using 0.04 ppm per
segment. For ledbpgppr2s1d (LED) data, the 0.1-6.0 ppm spectra were
segmented to 0.04 ppm per segment. Residual water (δ 4.6-δ 5.0) was
excluded from the analysis. The remaining integral was then
normalized to the sum of the spectral integrals using Microsoft
Excel 2020 (Microsoft Corporation).
Multivariate statistical analysis was implemented
using Metabo Analyst 3.0 software (Umetrics Corporation). After
mean-centering and scaling the 1H-NMR datasets to
default unit variance, principal component analysis (PCA) was
performed to identify intrinsic clusters and determine obvious
outlier values. Partial Least Squares Discriminant Analysis
(PLS-DA) was further performed as a supervised pattern recognition
analysis, to strengthen the difference between groups and
identification variables responsible for separation. Orthogonal
(O)PLS-DA was also used for predictive classification. The results
of the analysis are expressed in the form of scores plot. The
variable importance in projection weight variable importance in
projection (VIP) was obtained, which is a value denoting the
variable importance factor. Generally, a VIP value >1 can be
considered as different, and the greater the VIP value, the more
obvious the difference is (28).
The reliability of the PCA, PLS-DA and OPLS-DA model was verified
using a paired Student's t-test, and the differences between the
variables were screened. Metabolic pathway mapping was established
based on all identified endogenous metabolites, and the biological
relevance was examined using Kyoto Encyclopedia of Genes and
Genomes (KEGG) (29) annotation.
Finally, metabolites were searched for and identified using Q1 data
(the common databases were KEGG compound database, Massbank
database, Lipidmaps database, Human Metabonomics database, Metlin
database and Pubchem compound database).
Results
1H-NMR spectroscopic
analysis of urine samples
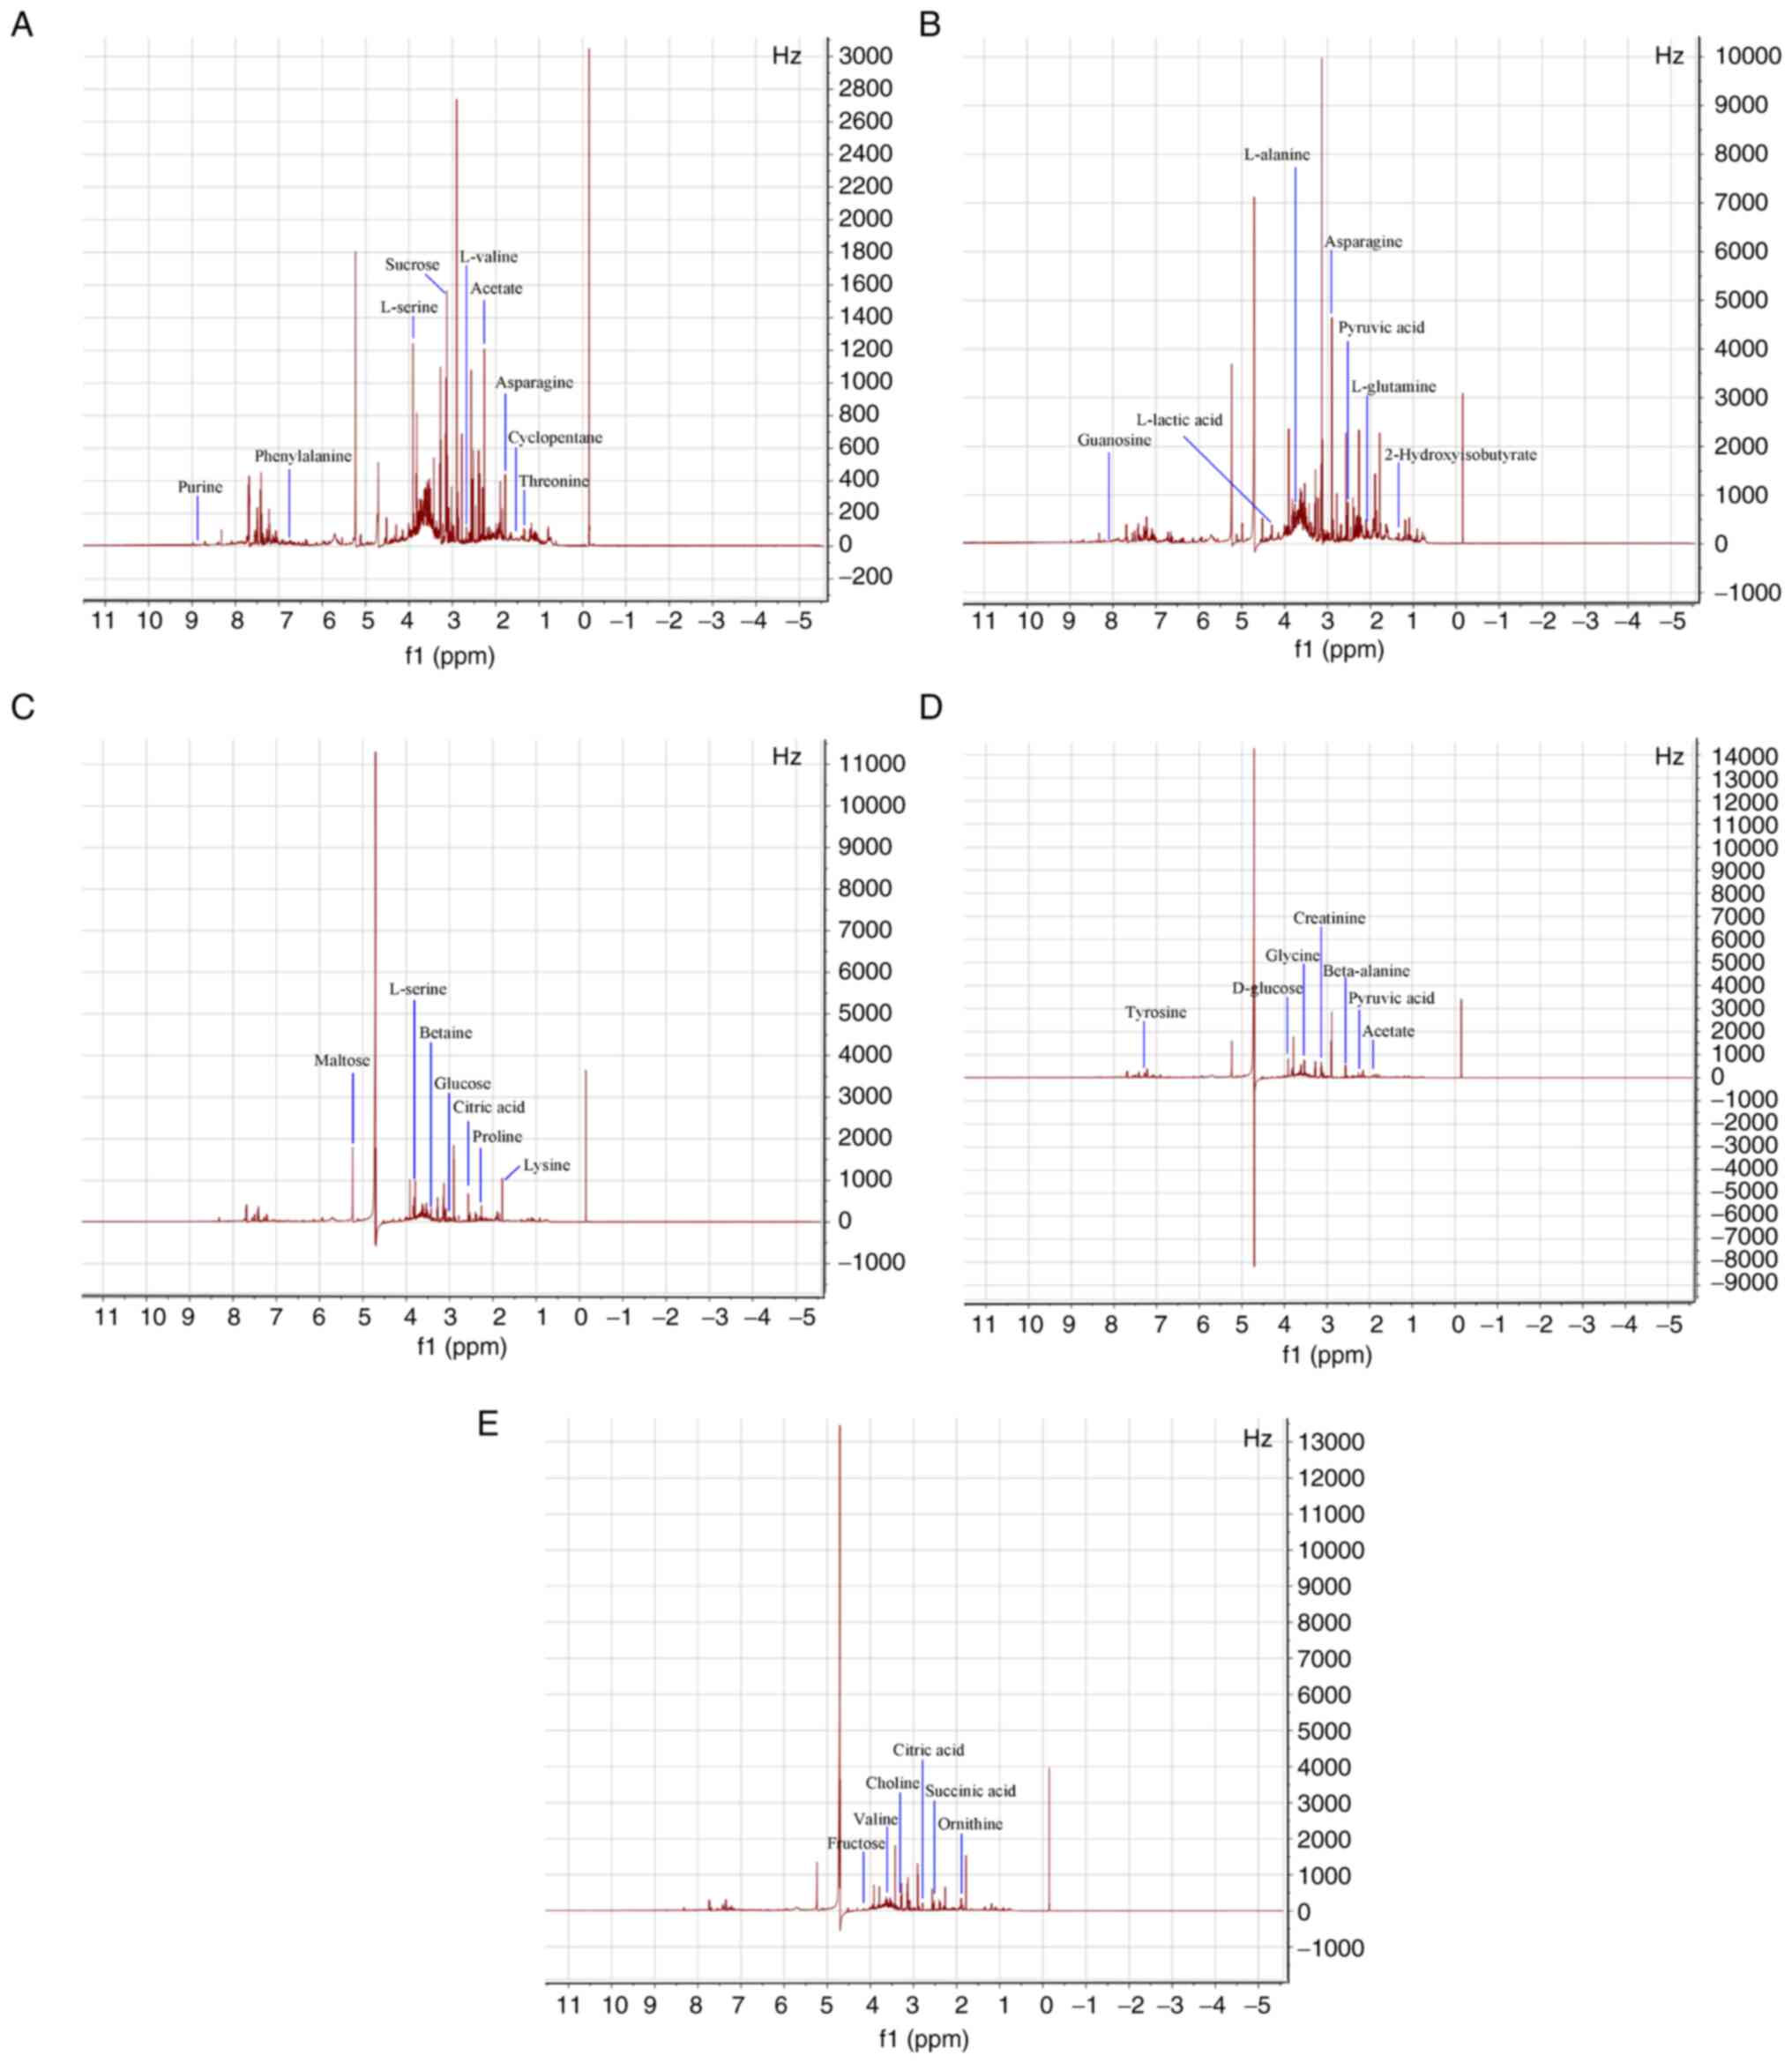
As shown in Fig. 1,
compared with the control group (Fig.
1A), the peak intensities of the 1H-NMR spectrum of
urine on day 1 (Fig. 1B), day 3
(Fig. 1C), day 5 (Fig. 1D) and day 7 (Fig. 1E) day after administration in the
raw RWI group were reduced, especially with the extension of
administration time, the decrease of peak intensity became more
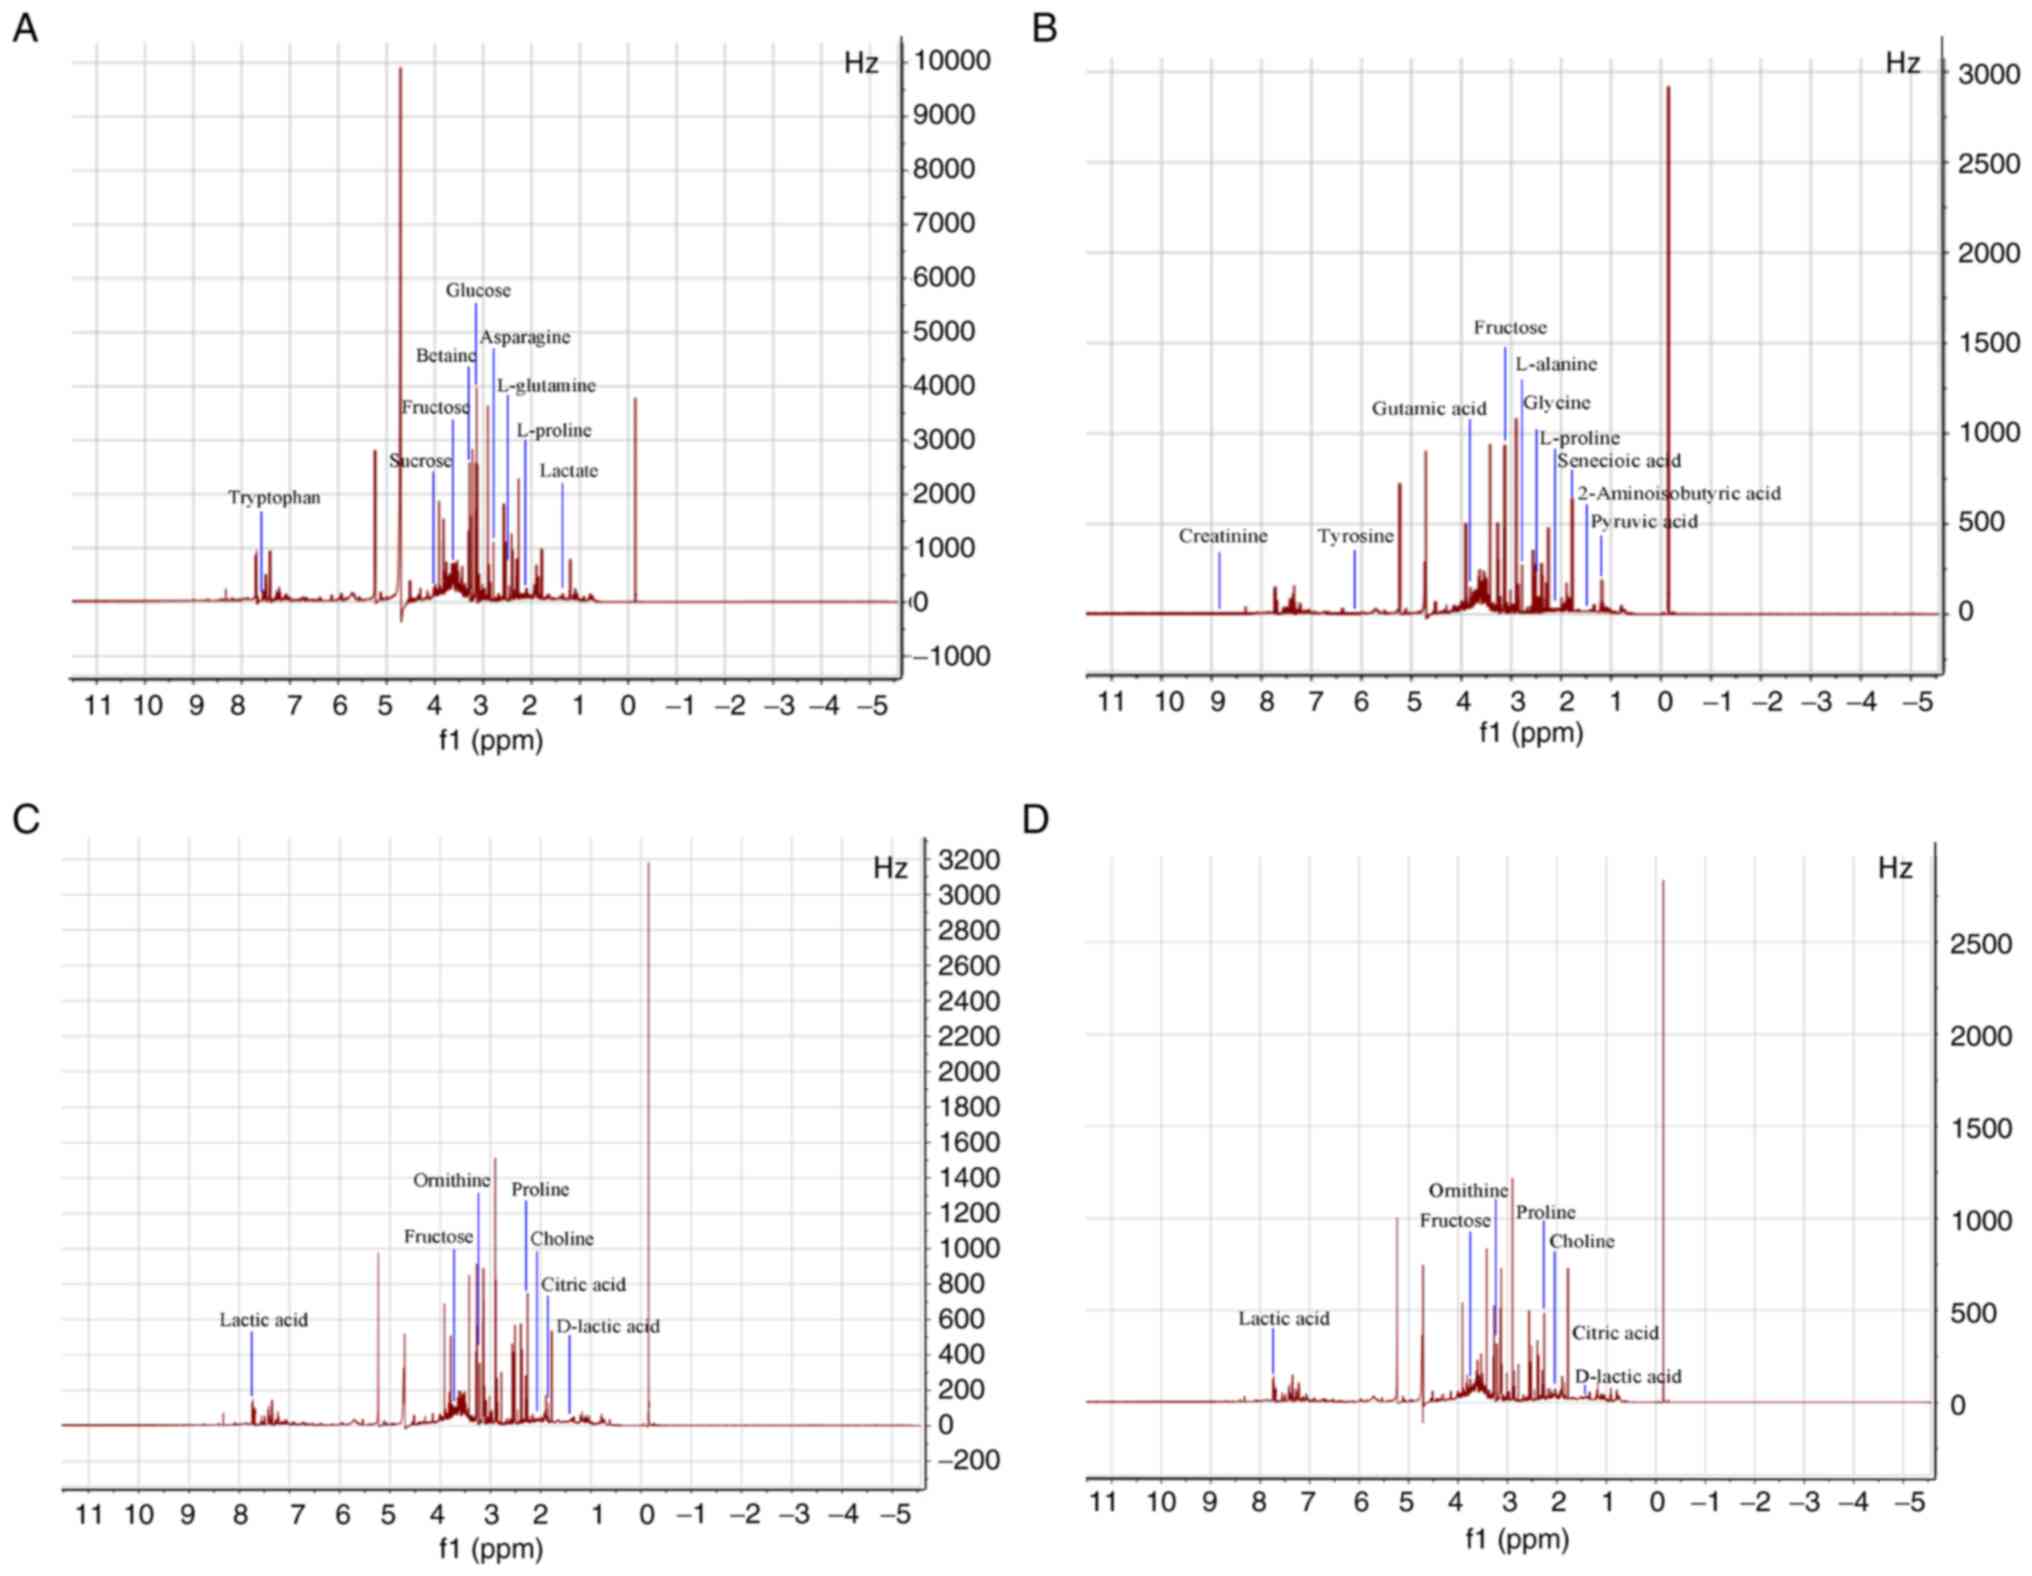
obvious. However, some peaks also increased in intensity. Fig. 2 shows the 1H-NMR spectra
of urine from the processed group on day 1 (Fig. 2A), day 3 (Fig. 2B), day 5 (Fig. 2C) and day 7 (Fig. 2D) after administration. Compared
with the control group, the 1H-NMR spectra of processed
urine group were altered. The majority of peaks increased in
intensity, although the changes intensity were not as marked as
those of the raw product group.
The toxicity of raw products has a great impact on
their metabolism. Combined with map analysis, the metabolites
corresponding to each peak, as well as the differences between the
metabolites of the processed and raw RWI group were identified. The
1H-NMR spectrum of urine had strong signals primarily
from amino acids, energy substrates and carbohydrates;
additionally, organic acids, choline, creatinine, betaine and
guanosine metabolites, as evidenced by the Q1 Data. The major
metabolites were marked in the spectrum. A number of alterations in
endogenous metabolites in the 1H-NMR spectra of urine
from the raw and processed RWI groups were observed. In total, 34
metabolites in the urine of rats treated with raw RWI (Table I) and 32 metabolites in the rats
treated with the processed RWI (Table
II) were identified. Compared with the control group, visual
analysis of the spectra indicated the raw RWI group displayed an
increase in lysine, proline, L-Alanine, tyrosine, phenylalanine,
tryptophan, lactic acid, citric acid, succinic acid, fructose,
sucrose, glucose, creatinine and choline, and the decreases in
betaine, alanine, β-alanine, asparagine, glycine, ornithine,
L-proline, valine and L-serine. Compared with the raw RWI group,
the type, concentration and relative proportion of endogenous
metabolites in the urine of the processed RWI group markedly
changed. Relative to the control group, the majority of metabolites
that increased in the raw RWI group, such as creatinine, D-glucose,
fructose, phenylalanine, L-alanine and asparagine; however, acetic
acid, lactic acid, citric acid, L-lactic acid and pyruvic acid,
were increased in the processed RWI group. In addition, unique
endogenous metabolites were also produced in the processed RWI
group, such as glutamic acid, L-proline, glutamic acid, threonine,
leucine, methotrexate, isoamylene and cyclopentane. This indicated
that the chemical ingredients of RWI were altered quantitatively
and/or qualitatively after processing with artificial sweat and/or
by the heating process, which may result in reduced toxicity of RWI
and enhanced the pharmacological actions.
 | Table IIdentification of endogenous
compounds in the urine of rats treated with raw RWI. |
Table I
Identification of endogenous
compounds in the urine of rats treated with raw RWI.
| Chemical shift
(ppm) | f.value | P-value |
-Log10(P-value) | FDR | Identified
compounds |
|---|
| 1.33 | 3.7897 | 0.0398 | 1.4000 | 0.87312 | Lactate |
| 1.34 | 4.5927 | 0.0231 | 1.6372 | 0.87312 |
2-Hydroxyisobutyrate |
| 1.73 | 3.8113 | 0.0392 | 1.4067 | 0.87312 | Lysine |
| 1.91 | 3.5528 | 0.0473 | 1.3251 | 0.87312 | Acetate |
| 1.98 | 4.5496 | 0.0237 | 1.6251 | 0.87312 | Ornithine |
| 2.02 | 6.2679 | 0.0086 | 2.0644 | 0.81534 | L-proline |
| 2.33 | 3.8748 | 0.0375 | 1.4263 | 0.87312 | Proline |
| 2.41 | 4.1354 | 0.0313 | 1.5051 | 0.87312 | Succinic acid |
| 2.44 | 5.2052 | 0.0157 | 1.8030 | 0.81534 | L-glutamine |
| 2.46 | 4.6101 | 0.0228 | 1.6421 | 0.87312 | Pyruvic acid |
| 2.53 | 4.3524 | 0.0270 | 1.5688 | 0.87312 | Citric acid |
| 2.54 | 4.2634 | 0.0287 | 1.5429 | 0.87312 | β-alanine |
| 2.76 | 4.2561 | 0.0288 | 1.5408 | 0.87312 | Citrate |
| 2.84 | 3.8594 | 0.0379 | 1.4216 | 0.87312 | Asparagine |
| 2.94 | 4.7835 | 0.0204 | 1.6902 | 0.87312 | Asparagine |
| 3.02 | 6.1216 | 0.0093 | 2.0302 | 0.87312 | Glucose |
| 3.10 | 8.9168 | 0.0025 | 2.6074 | 0.87312 | Creatinine |
| 3.19 | 3.5353 | 0.0479 | 1.3195 | 0.81534 | Choline |
| 3.20 | 4.4520 | 0.0253 | 1.5974 | 0.64726 | Glucose |
| 3.25 | 3.5767 | 0.0465 | 1.3328 | 0.87312 | Betaine |
| 3.56 | 3.6898 | 0.0428 | 1.3688 | 0.87312 | Glycine |
| 3.60 | 3.5101 | 0.0488 | 1.3114 | 0.87312 | L-valine |
| 3.68 | 5.9241 | 0.0104 | 1.9831 | 0.87312 | Fructose |
| 3.76 | 3.7921 | 0.0397 | 1.4008 | 0.87312 | L-alanine |
| 3.84 | 3.9119 | 0.0365 | 1.4377 | 0.87312 | L-serine |
| 3.91 | 5.5599 | 0.0128 | 1.8937 | 0.84073 | D-glucose |
| 4.01 | 4.3134 | 0.0277 | 1.5575 | 0.87312 | Fructose |
| 4.05 | 3.6775 | 0.0432 | 1.3649 | 0.87312 | Sucrose |
| 4.29 | 6.9312 | 0.0061 | 2.2134 | 0.87312 | L-lactic acid |
| 5.25 | 5.1374 | 0.0164 | 1.7852 | 0.87312 | Maltose |
| 7.20 | 6.2130 | 0.0089 | 2.0517 | 0.87312 | Tyrosine |
| 7.34 | 3.5071 | 0.0489 | 1.3104 | 0.81534 | Phenylalanine |
| 7.55 | 3.8559 | 0.0380 | 1.4205 | 0.87312 | Tryptophan |
| 8.02 | 3.6479 | 0.0441 | 1.3555 | 0.81534 | Guanosine |
| Table IIIdentification of endogenous
compounds in the urine of rats treated with processed RWI. |
Table II
Identification of endogenous
compounds in the urine of rats treated with processed RWI.
| Chemical shift
(ppm) | f.value | P-value |
Log10(P-value) | FDR | Identified
compounds |
|---|
| 0.94 | 14.790 | 0.0013 | 2.9012 | 0.0587 | Leucine |
| 1.16 | 4.1944 | 0.0466 | 1.3319 | 0.2122 | Proline |
| 1.21 | 6.0518 | 0.0187 | 1.7279 | 0.1581 | Pyruvic acid |
| 1.32 | 5.2584 | 0.0270 | 1.5694 | 0.1759 | Threonine |
| 1.40 | 7.4677 | 0.0105 | 1.9797 | 0.1302 | D-lactic acid |
| 1.48 | 11.867 | 0.0026 | 2.589 | 0.0842 | 2-Aminoisobutyric
acid |
| 1.51 | 7.9331 | 0.0088 | 2.0552 | 0.1302 | Cyclopentane |
| 1.52 | 4.2532 | 0.0451 | 1.3459 | 0.2086 | β-alanine |
| 1.7 | 4.6149 | 0.0372 | 1.4296 | 0.1963 | Citrate |
| 1.77 | 14.718 | 0.0013 | 2.8942 | 0.0587 | Senecioic acid |
| 1.86 | 8.4776 | 0.0073 | 2.1395 | 0.1240 | Asparagine |
| 1.90 | 6.0531 | 0.0187 | 1.7282 | 0.1581 | Creatinine |
| 2.07 | 5.9621 | 0.0195 | 1.7107 | 0.1589 | Choline |
| 2.08 | 8.4082 | 0.0074 | 2.1290 | 0.1240 | L-proline |
| 2.22 | 11.663 | 0.0027 | 2.5651 | 0.0864 | Acetate |
| 2.28 | 9.4745 | 0.0052 | 2.2841 | 0.1147 | 4-Aminbutyrate |
| 2.52 | 5.1081 | 0.0290 | 1.5377 | 0.1792 | L-Valine |
| 2.54 | 6.7094 | 0.0141 | 1.8494 | 0.1457 | Beta-alanine |
| 2.61 | 5.2581 | 0.0270 | 1.5694 | 0.1759 | Fructose |
| 2.69 | 10.686 | 0.0036 | 2.4452 | 0.1008 | L-alanine |
| 2.79 | 4.5526 | 0.0384 | 1.4154 | 0.1990 | Aspartate |
| 2.89 | 4.9909 | 0.0307 | 1.5126 | 0.1818 | D-glucose |
| 3.05 | 5.4644 | 0.0244 | 1.6120 | 0.1714 | Ornithine |
| 3.20 | 6.4374 | 0.0158 | 1.8001 | 0.1500 | Sucrose |
| 3.76 | 17.902 | 0.0007 | 3.1817 | 0.0528 | Glutamic acid |
| 3.98 | 9.8598 | 0.0046 | 2.3370 | 0.1077 | L-serine |
| 4.27 | 7.0147 | 0.0125 | 1.9030 | 0.1405 | L-lactic acid |
| 6.07 | 13.313 | 0.0018 | 2.7504 | 0.0667 | Tyrosine |
| 6.67 | 4.9699 | 0.0310 | 1.5081 | 0.1822 | Phenylalanine |
| 7.28 | 9.0751 | 0.0059 | 2.2276 | 0.1192 | Tryptophan |
| 7.81 | 8.3600 | 0.0076 | 2.1216 | 0.1246 | Lactate |
| 8.86 | 11.241 | 0.0031 | 2.5143 | 0.0888 | Purine |
Data analysis of metabolic
biomarkers
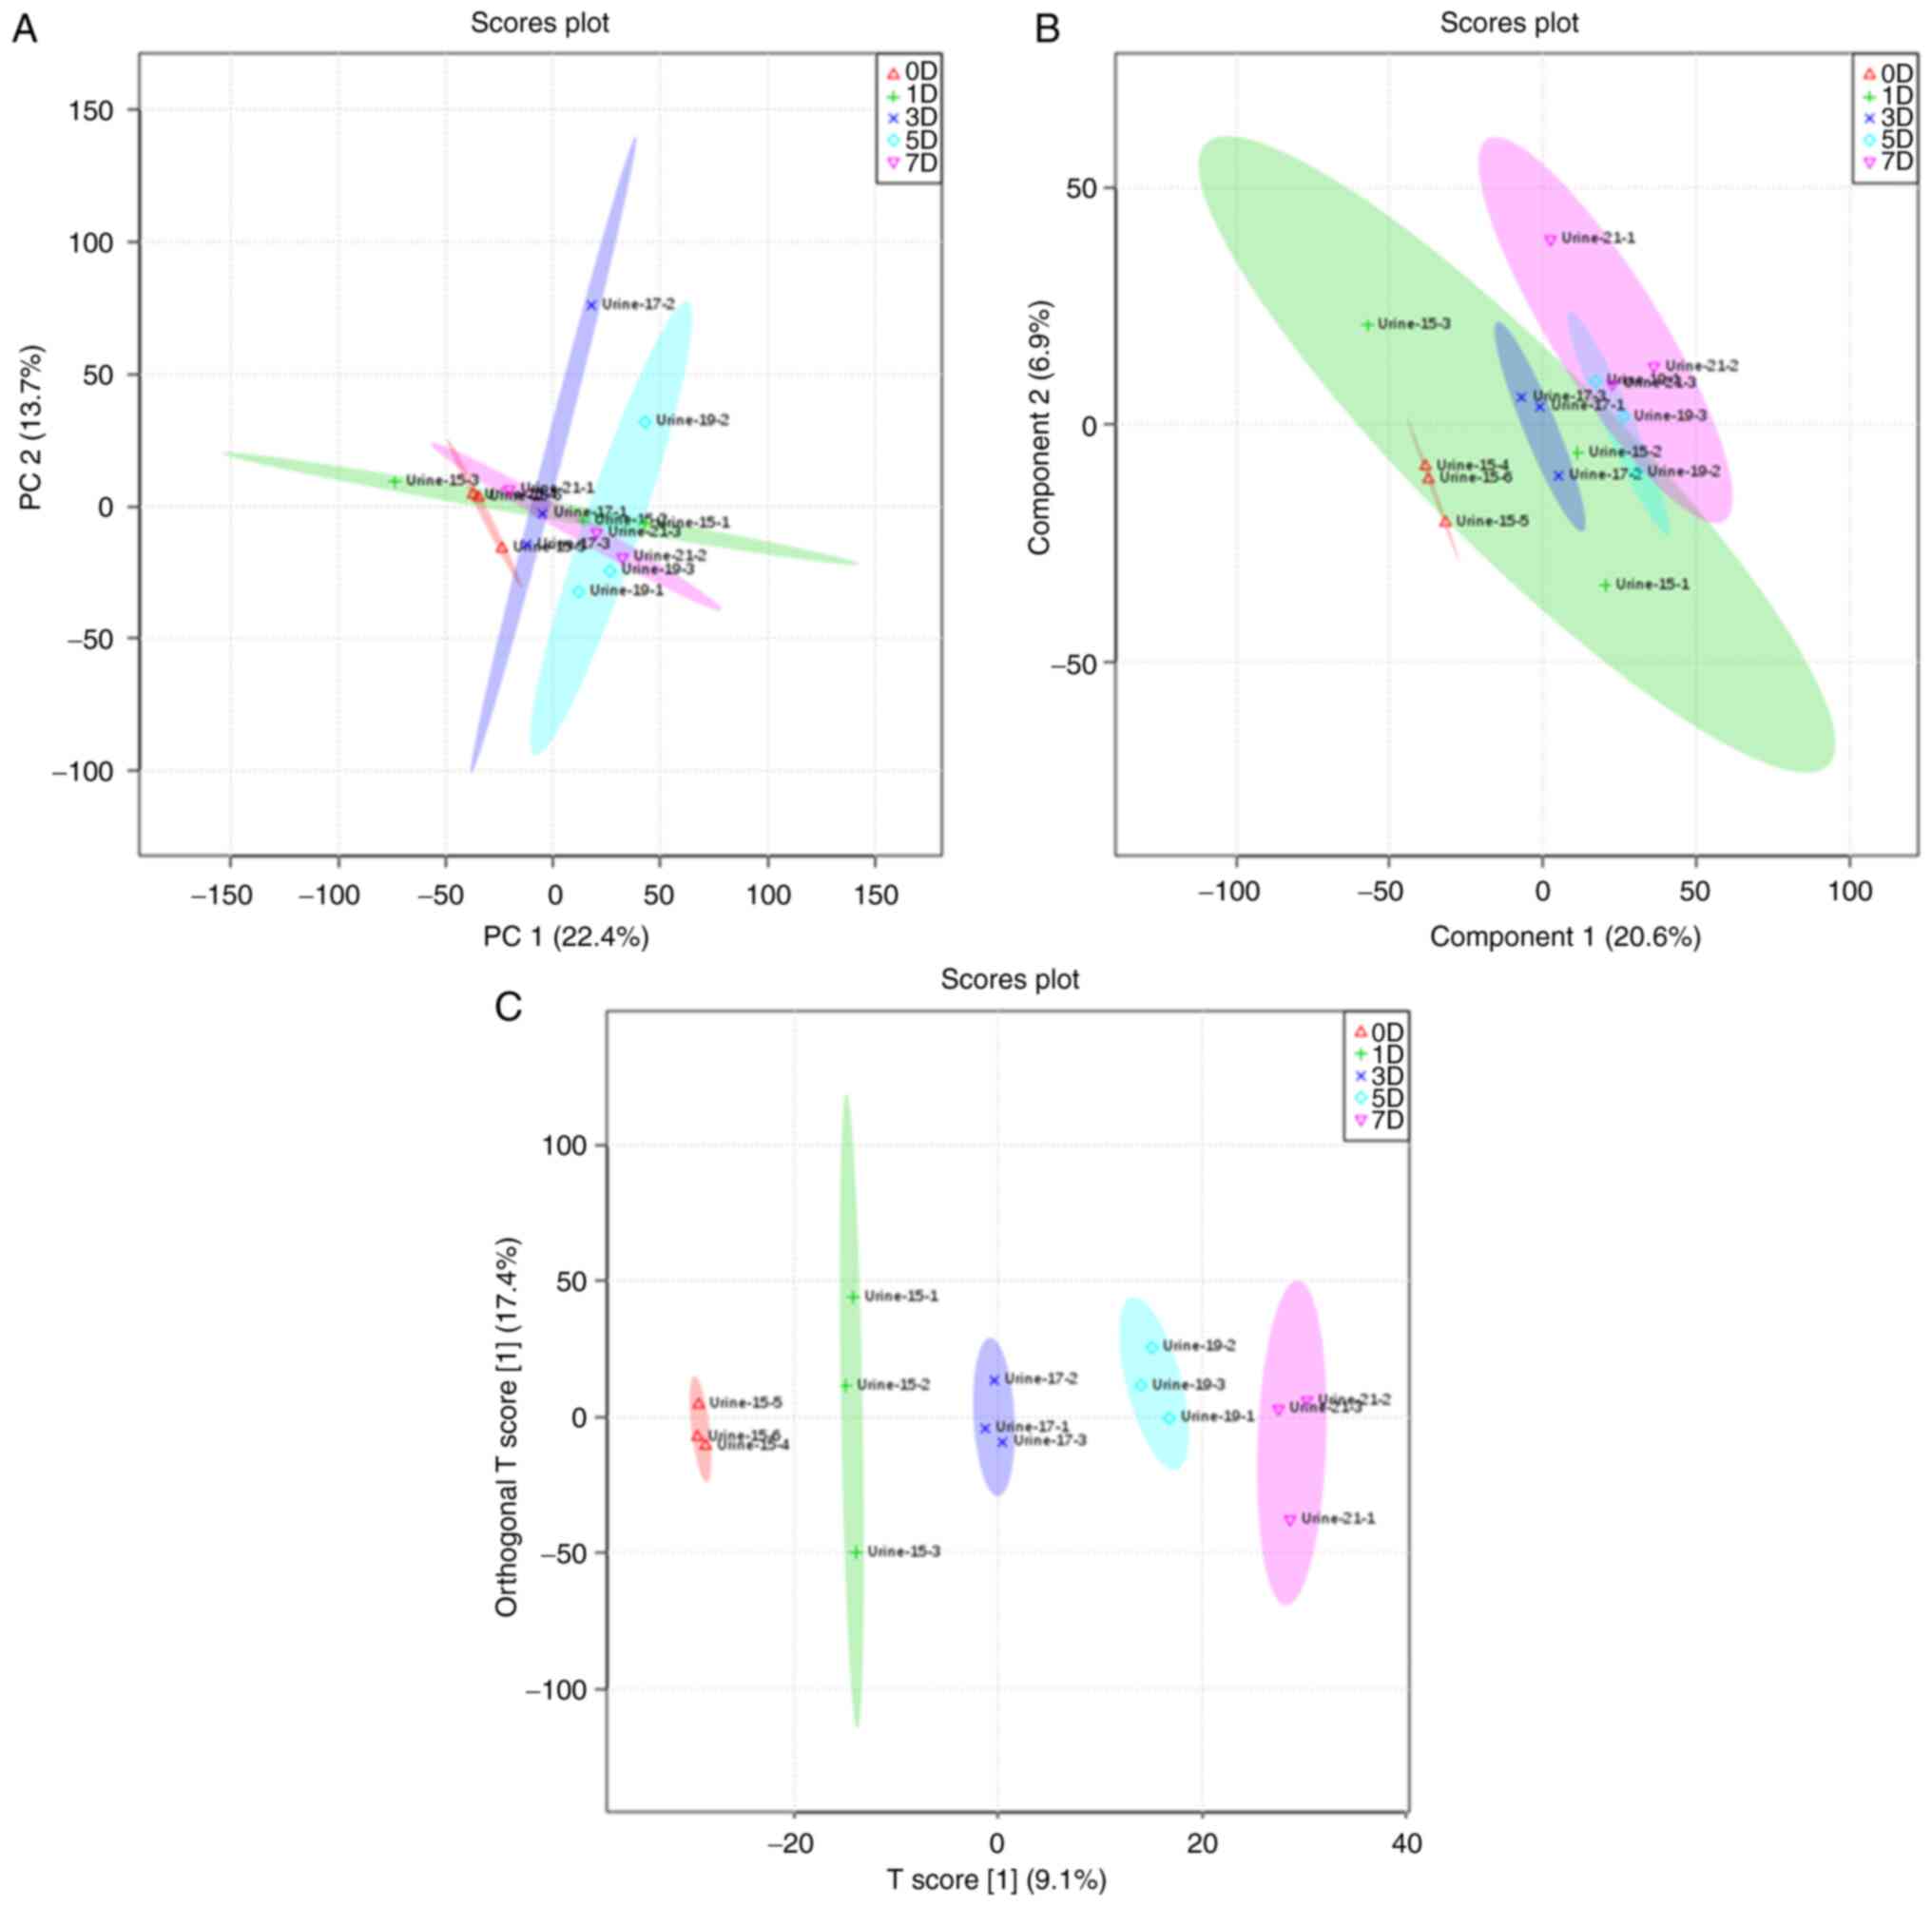
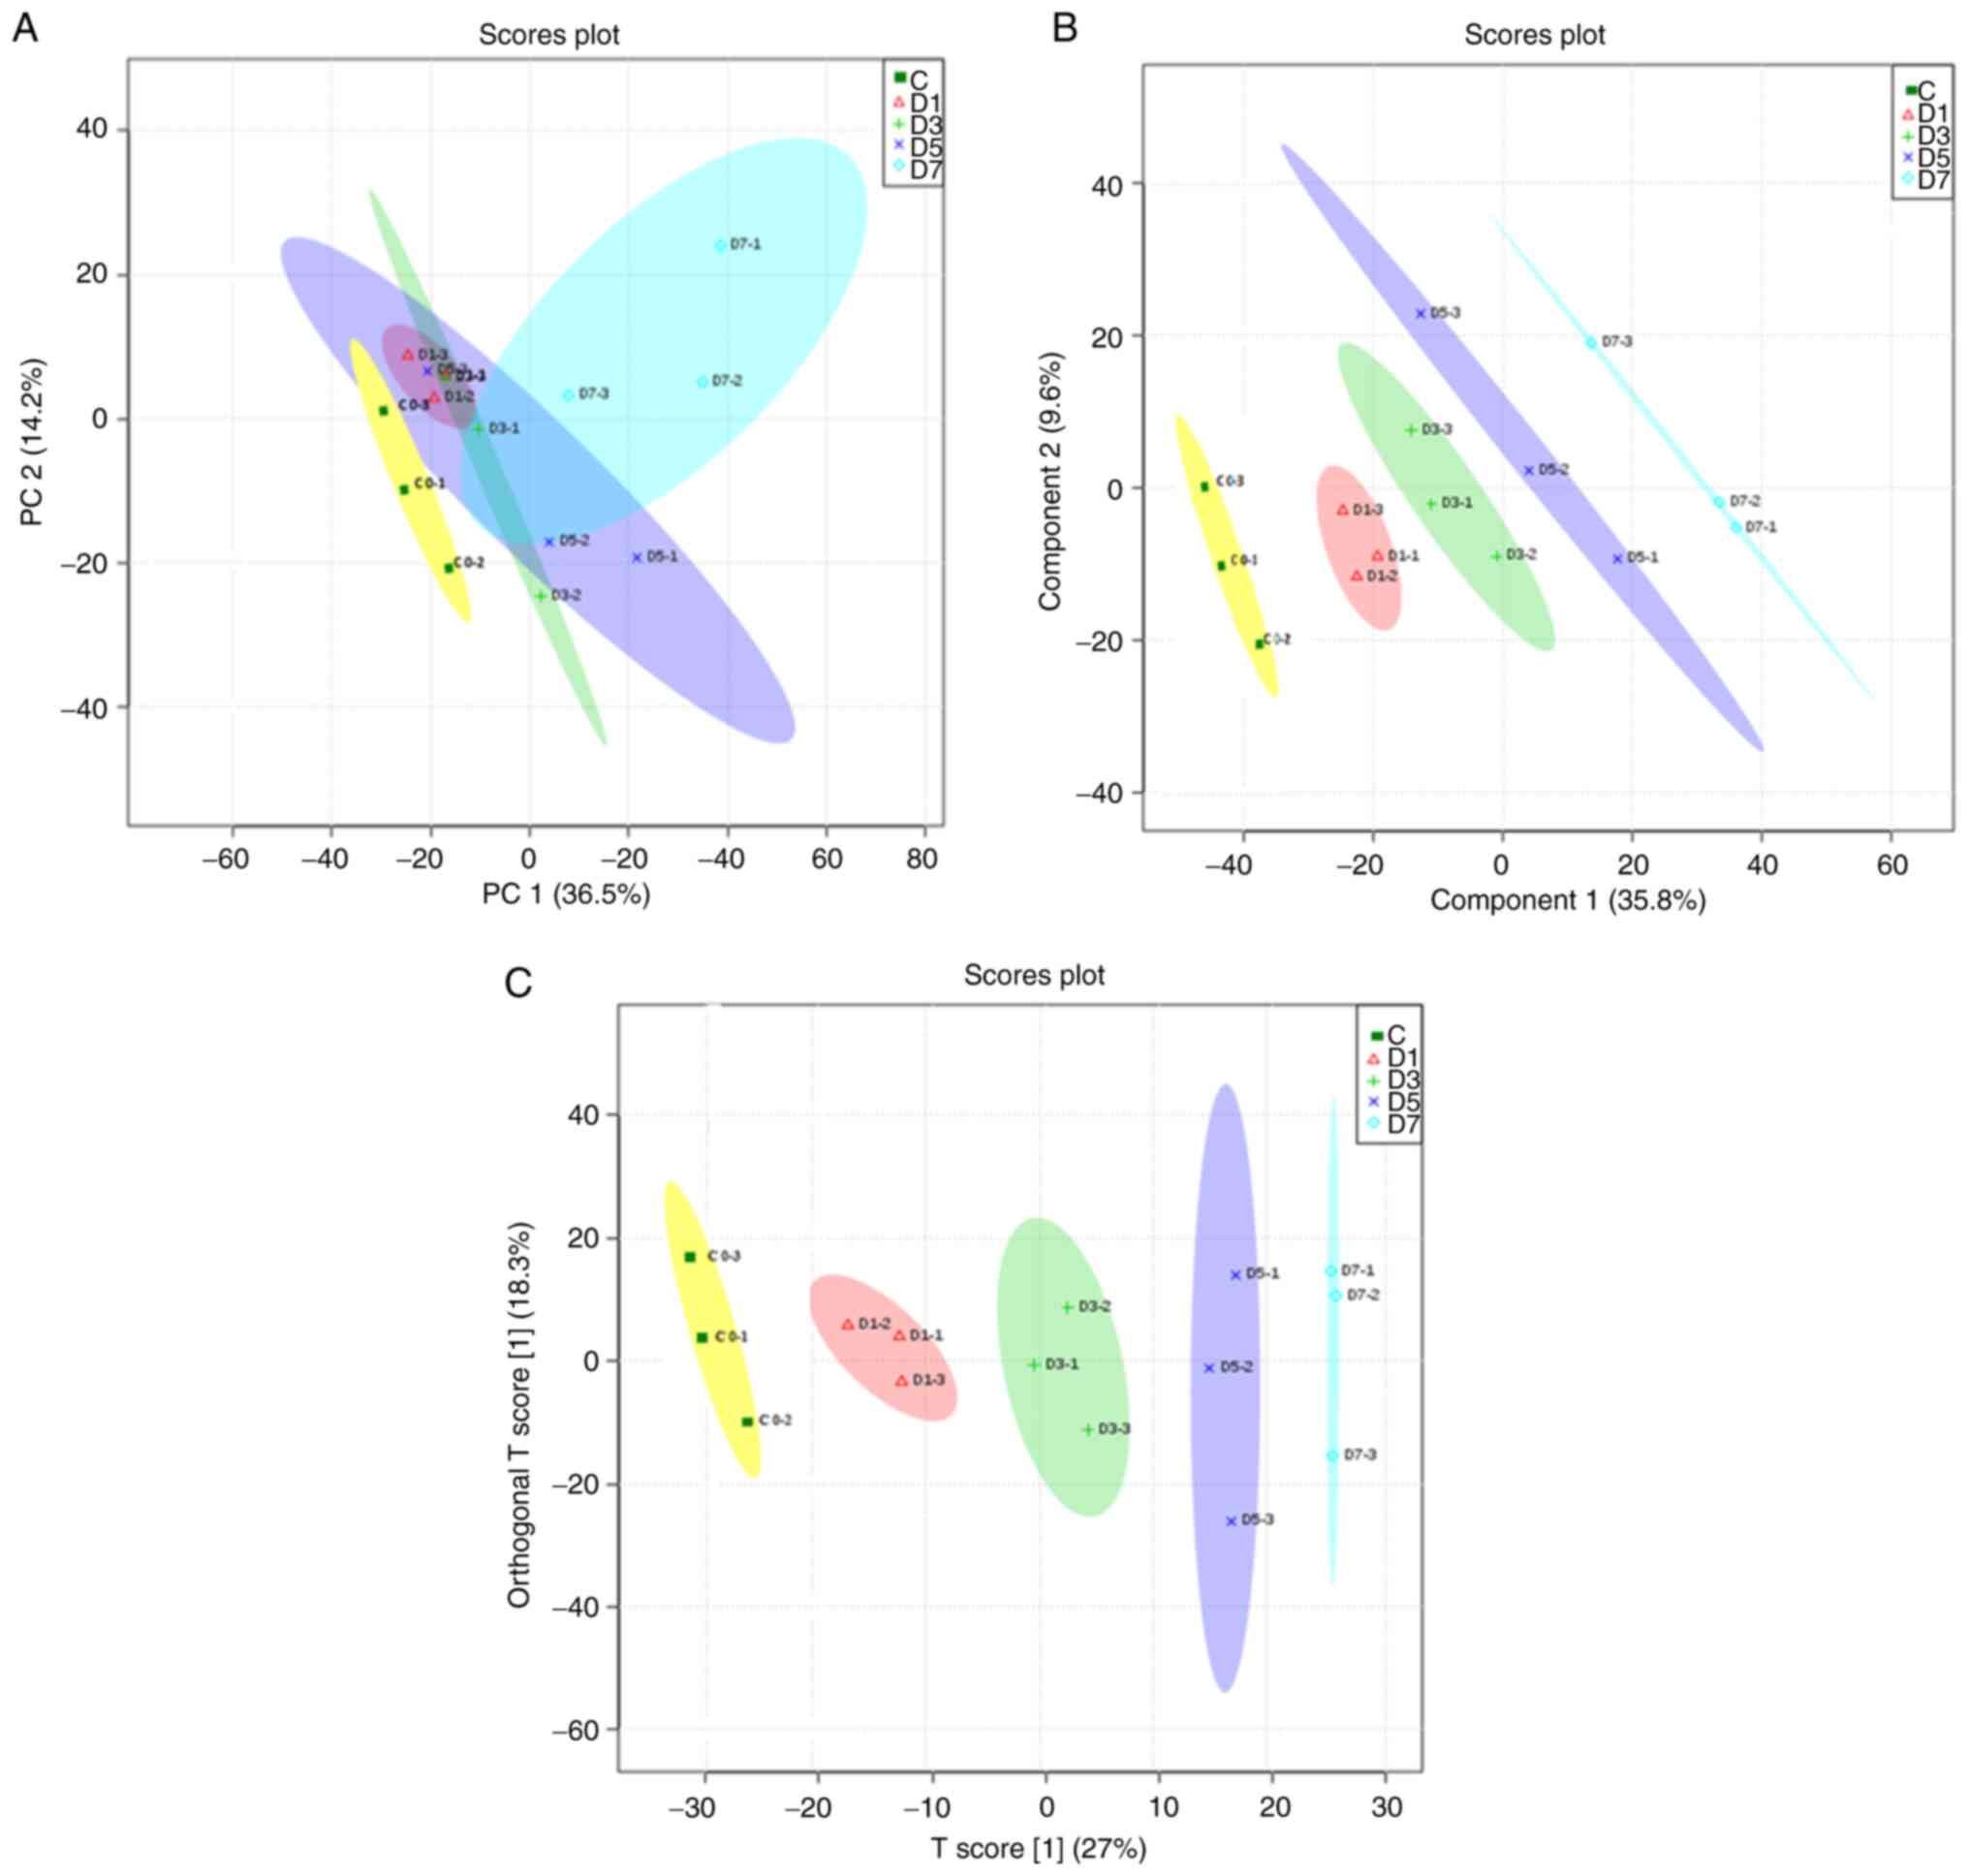
PCA, PLS-DA and OPLS-DA were used to analyze the
general clustering trends and the metabolic profiles of the urine
of the control and experimental groups. Unsupervised PCA was
initially used on the normalized 1H-NMR spectral data,
and score plots of PCA on the data did not show obvious clustering
between the control and raw RWI groups when compared by day.
Similarly, the PCA score plots showed there was no obvious trend
for clustering between the processed RWI group (when compared by
day) and the control group, but the patterns of these samples on
the 7th day did differ compared with the control group. As the
clustering trend of raw products and processed products were
different, this showed that the chemical composition of RWI had
changed after processing using the sweat soaking method; therefore,
the resulting difference in interference with the endogenous
metabolites also differed. In order to further separate the groups
and identify discriminatory metabolites, PLS-DA, a supervised
projection model, was used to identify the changes in the
metabolite biomarkers. The control group and rats treated with the
raw RWI at different time points could be separated; however, some
of the 95% confidence intervals still overlapped, which was also
true of the processed group. A high percentage of similarity in the
treated groups on days 1, 3, 5 and 7 (in both the raw and processed
RWI groups, respectively) was observed, based on the close
proximity observed in the PLS-DA score plots. In order to minimize
the possible contributions of intergroup variability and to further
improve the separation, OPLS-DA was used. Using OPLS-DA, the
control and raw groups could be separated into distinct clusters
(Fig. 3). Likewise, the control
group and processed group could also be separated (Fig. 4). As the duration of administration
increased, the spectrum of metabolites in rats changed more notably
(Figs. 5 and 6). Moreover, the plots of the raw RWI
groups and processed RWI groups also differed, which once again
suggested that the chemical composition of RWI was altered
following sweat-soaking.
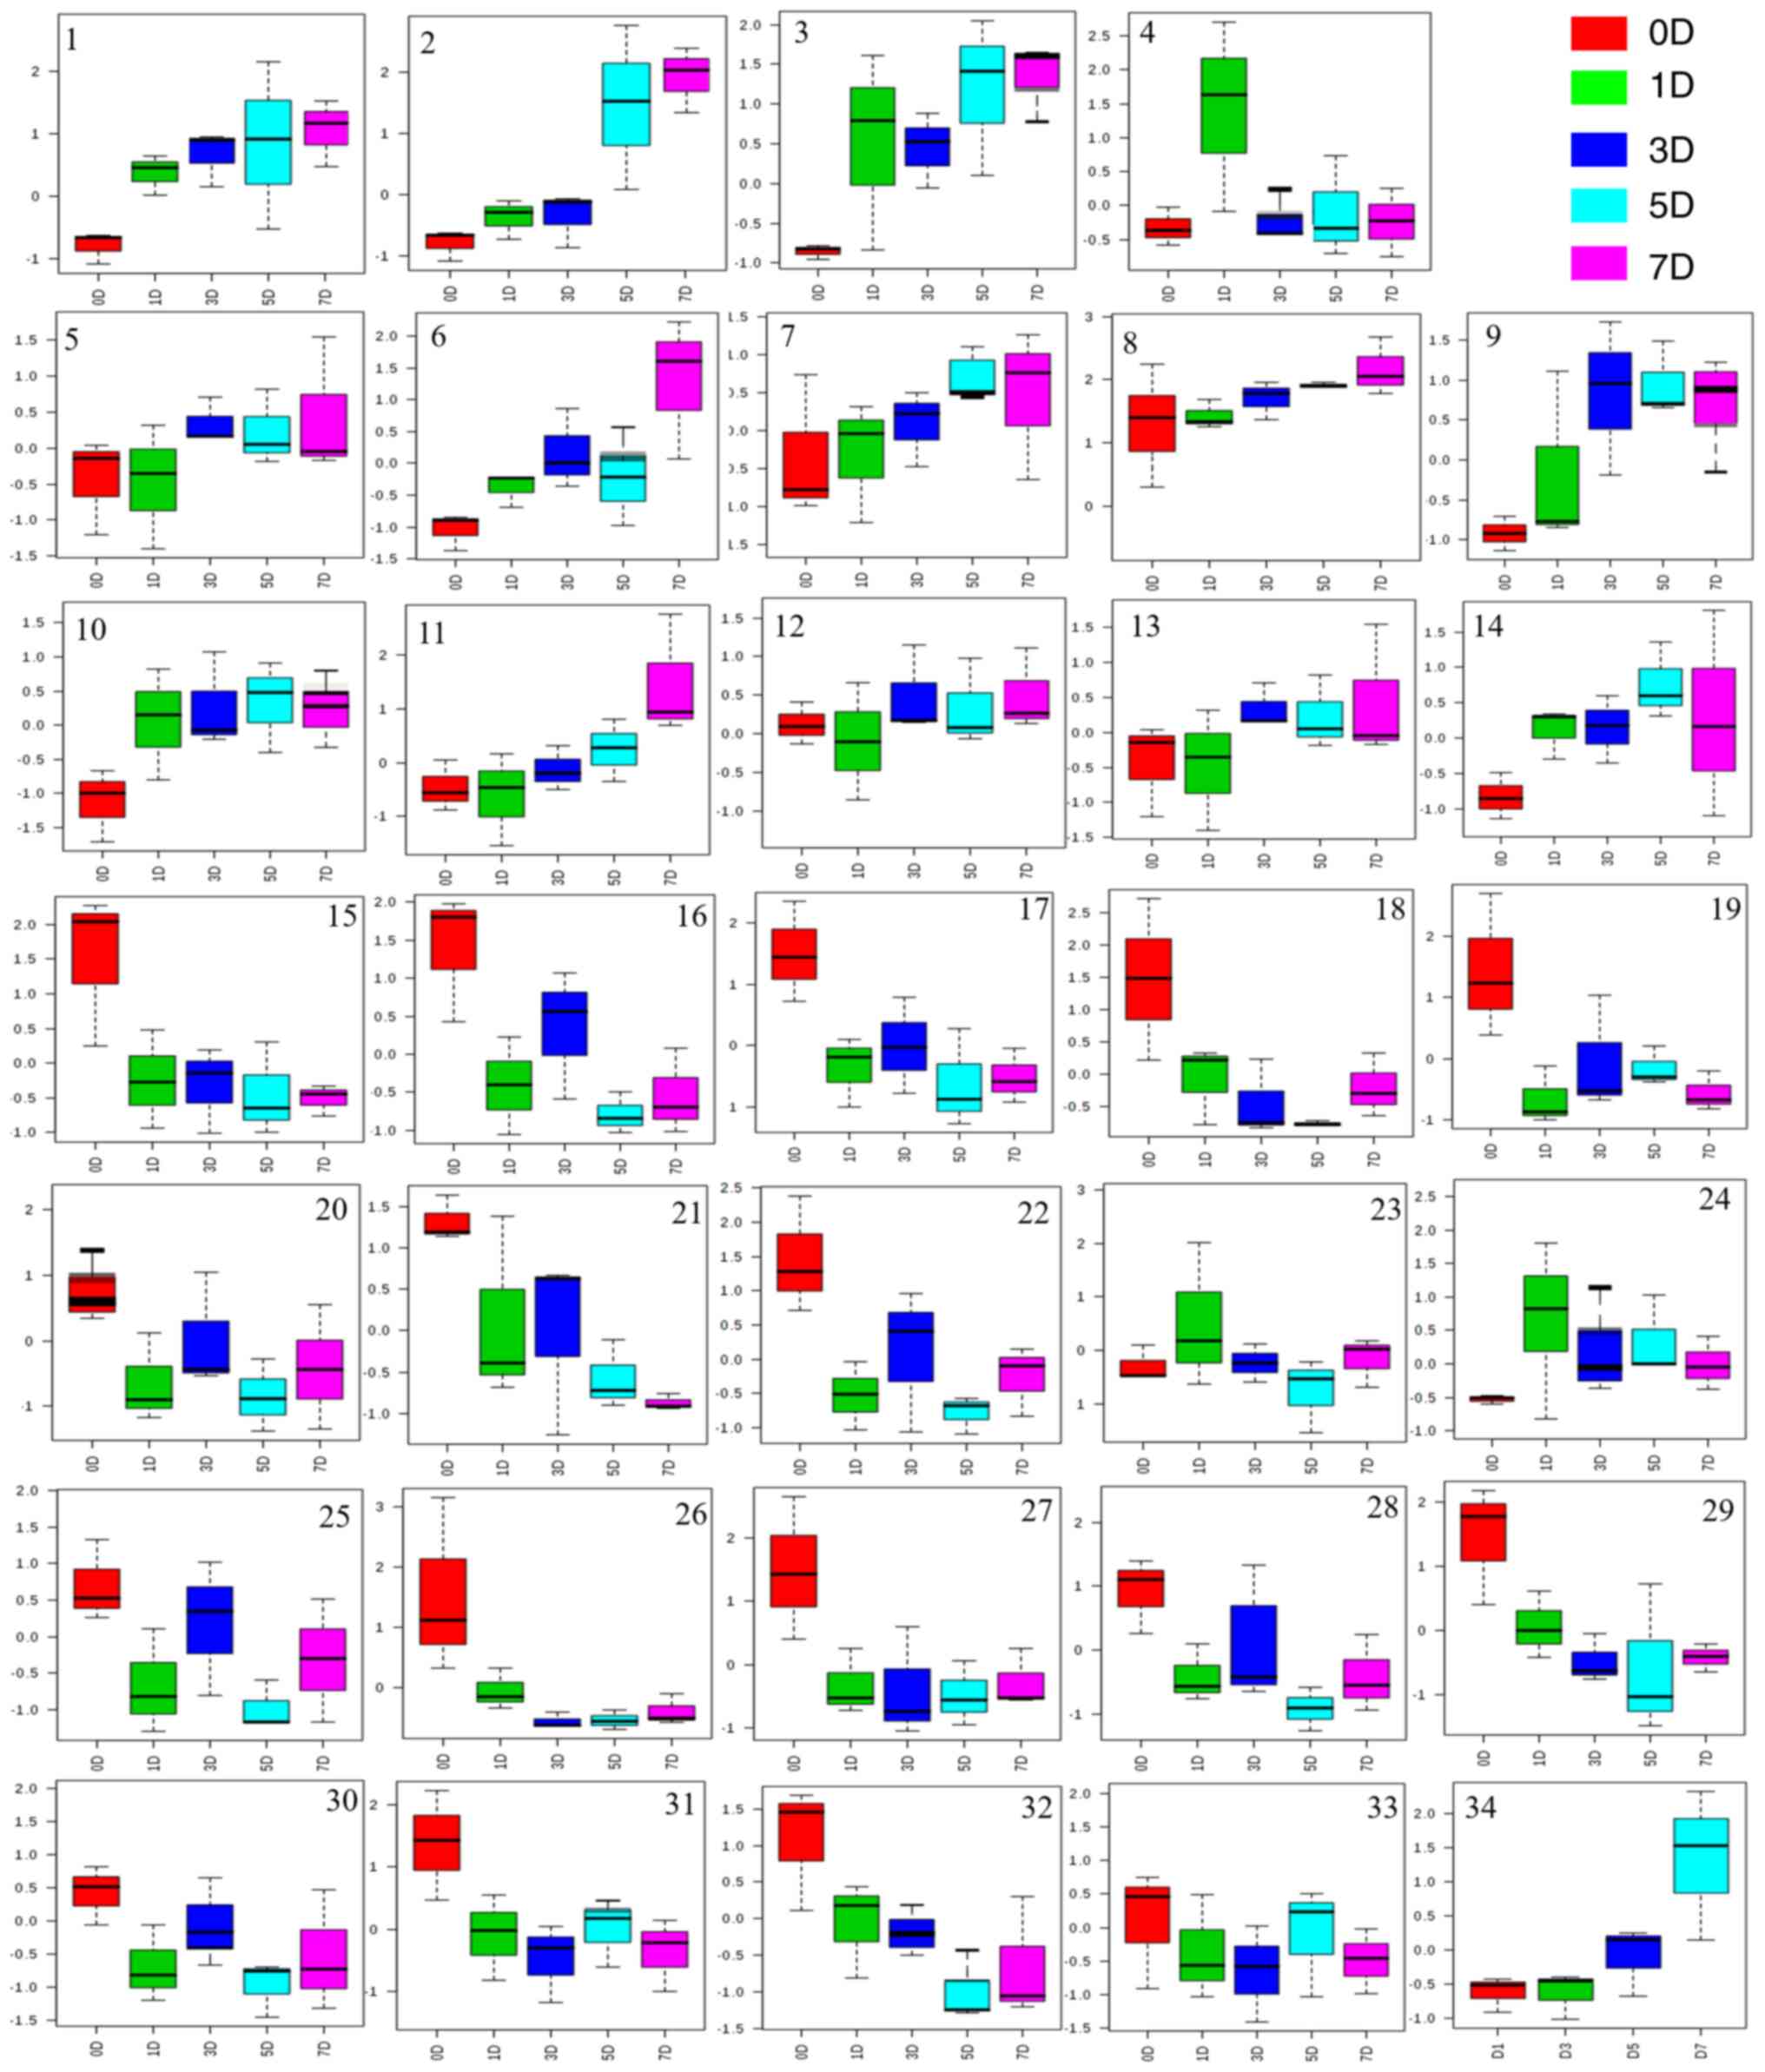 | Figure 5Analysis of endogenous metabolites in
the urine of rats treated with raw Radix Wikstroemia indica
(L.) C.A. Mey. 1, Lactate (δ1.33); 2, 2-Hydroxyisobutyrate (δ1.34);
3, Lysine (δ1.73); 4, Acetate (δ1.91); 5, Lactose (δ3.02); 6,
L-fructose (δ3.68); 7, L-Alanine (δ3.76); 8, D-glucose (δ3.91); 9,
D-fructose (δ4.01); 10, Tyrosine (δ7.200); 11, Tryptophan (δ7.55);
12, Creatinine (δ3.10); 13, Glucose (δ3.20); 14, Sucrose (δ4.05);
15, Succinic acid (δ2.41); 16, L-glutamine (δ2.44); 17, Pyruvic
acid (δ2.46); 18, Citric acid (δ2.53); 19, β-Alanine (δ2.54); 20,
Citate (δ2.76); 21, Asparagine (δ2.84); 22, Asparagine (δ2.94); 23,
Proline (δ2.33); 24, Phenylalanine (δ7.34); 25, Ornithine (δ1.98);
26, Betaine (δ3.25); 27, Glycine (δ3.56); 28, L-Valine (δ3.60); 29,
L-Serine (δ3.84); 30, L-lactic acid (δ4.29); 31, Maltose (δ5.25);
32, L-proline (δ2.02); 33, Guanosine (δ8.02); 34, Choline
(δ3.19). |
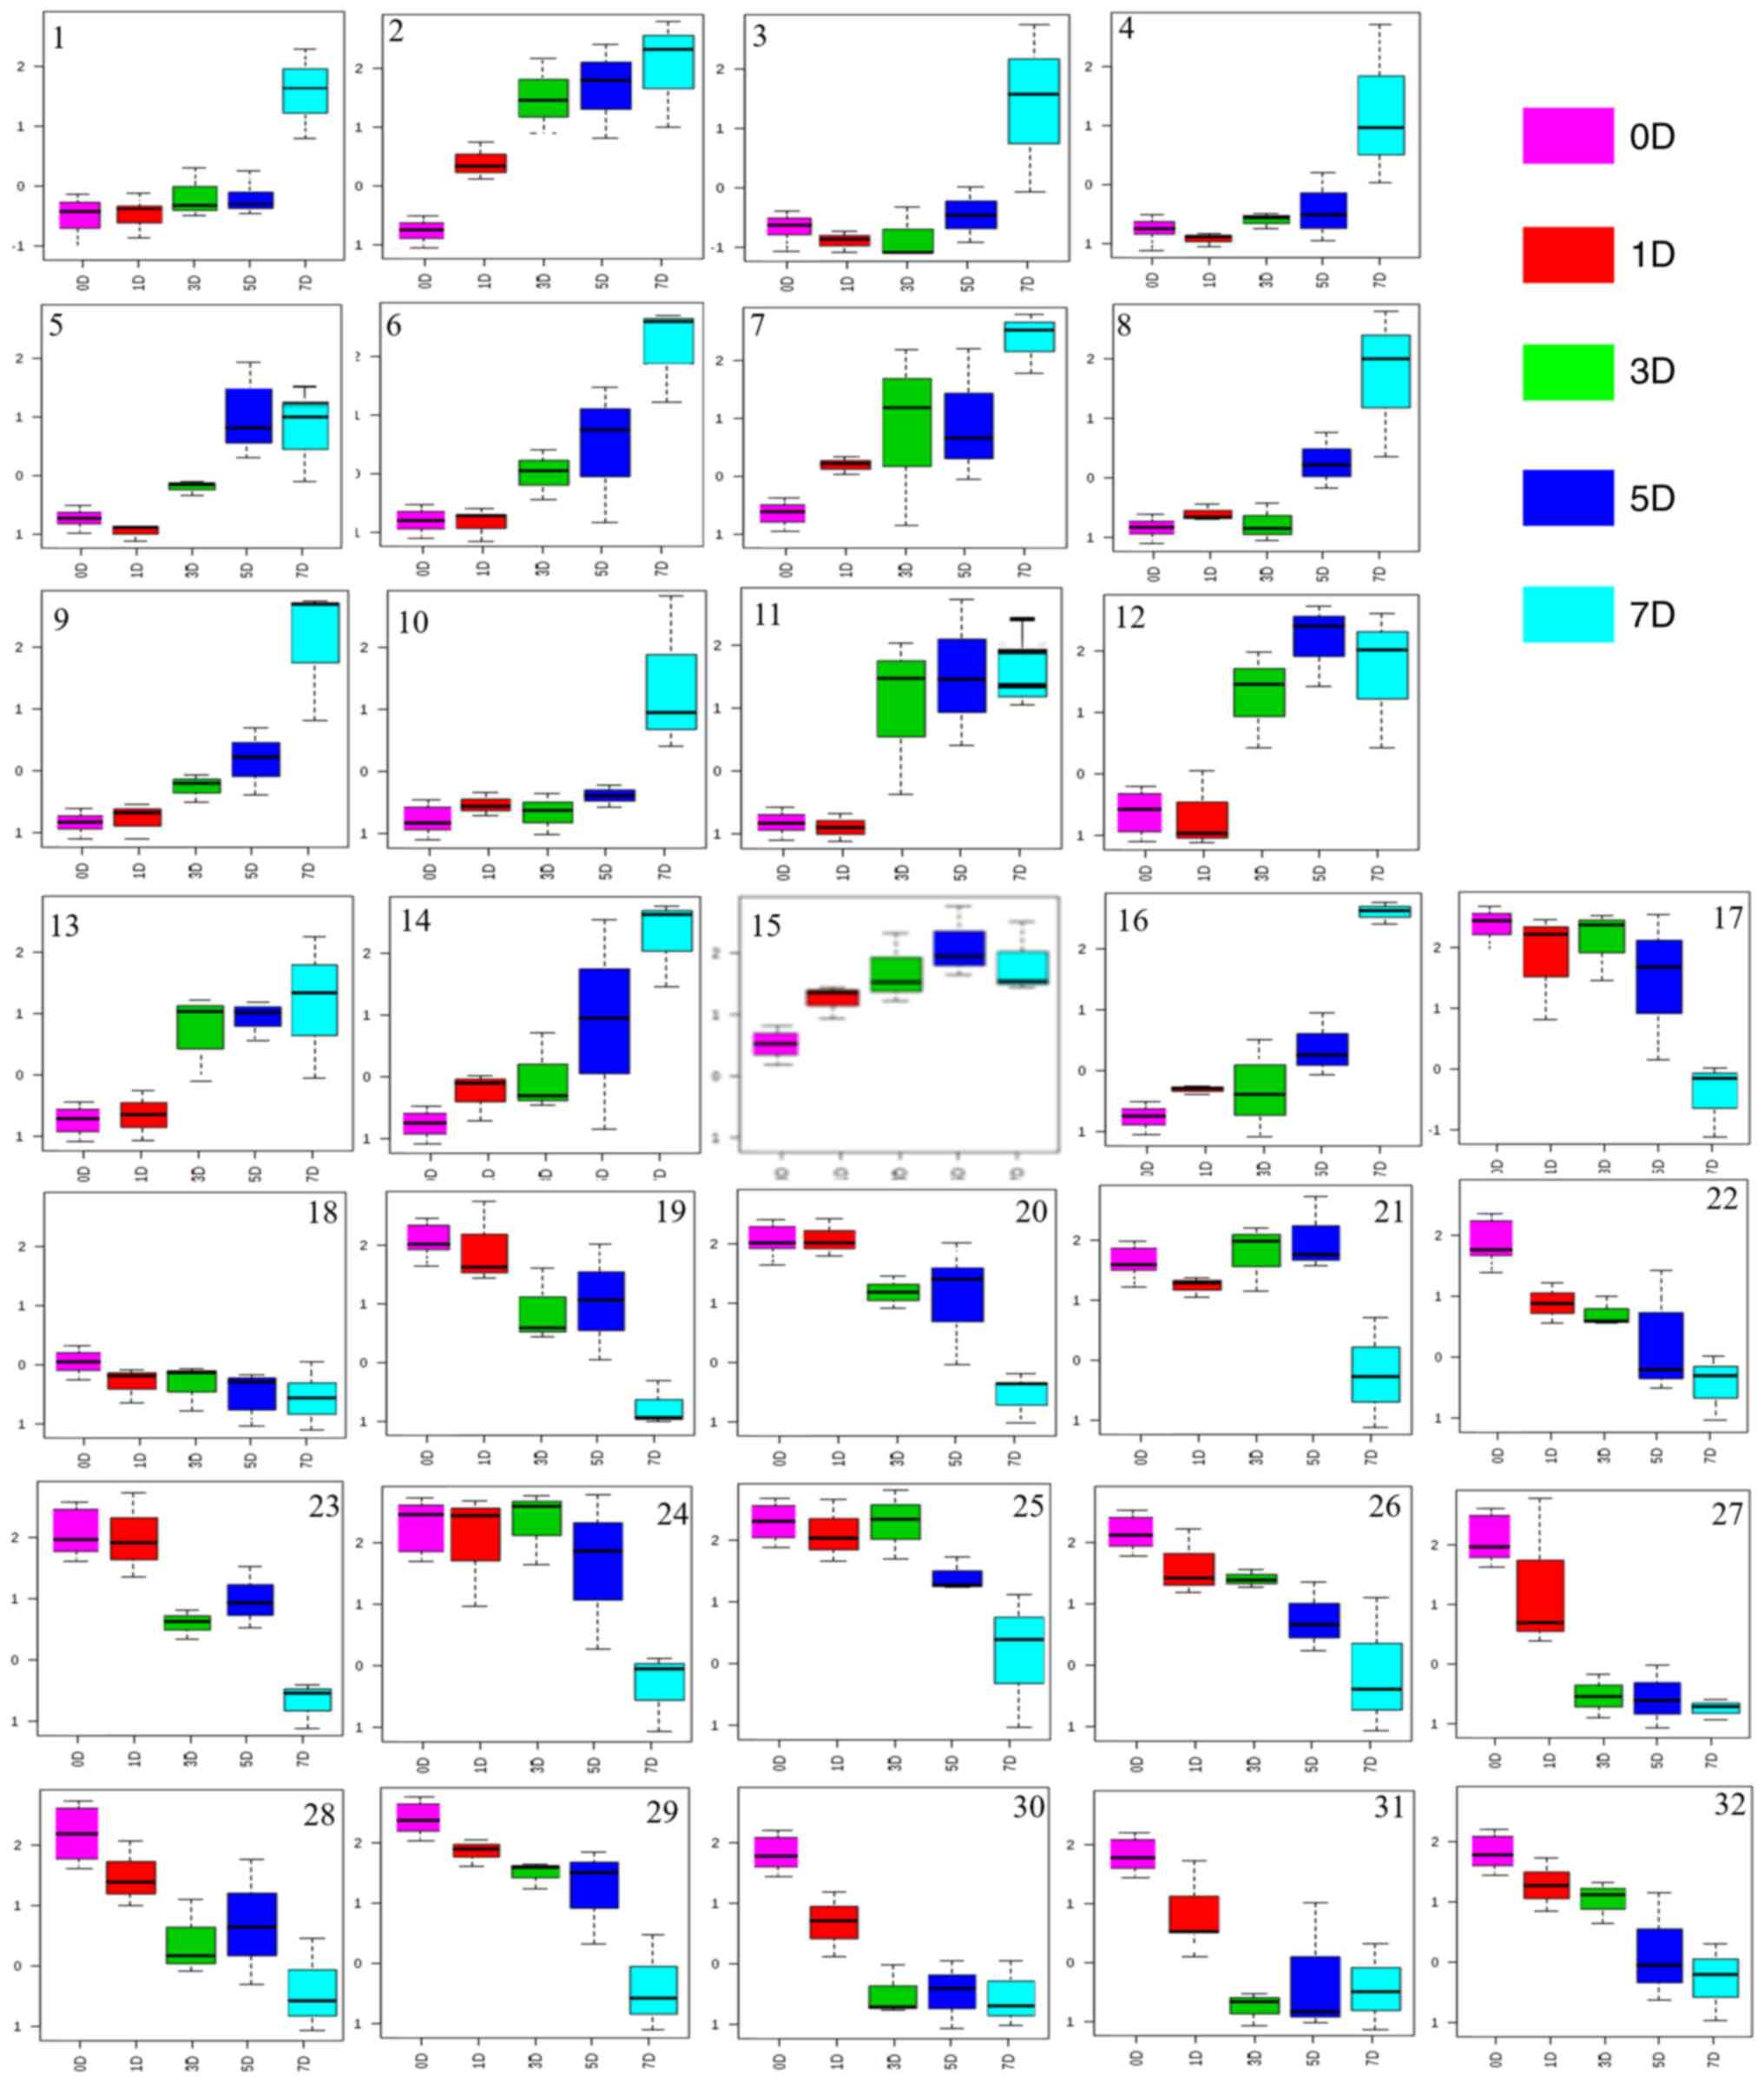 | Figure 6Analysis of endogenous metabolites in
the urine of rats treated with processed Radix Wikstroemia
indica (L.) C.A. Mey. 1, Leucine (δ0.94); 2, L-serine (δ3.98);
3, Pyruvic acid (δ1.21); 4, Threonine (δ1.32); 5, Citrate (δ1.70);
6, Asparagine (δ1.86); 7, Phenylalanine (δ6.7); 8, L-proline
(δ2.08); 9, Acetate (δ2.22); 10, 4-4-Aminbutyrate (δ2.28); 11,
L-Valine (δ2.52); 12, β-Alanine (δ2.54); 13, L-Alanine (δ2.69); 14,
Aspartate (δ2.79); 15, Sucrose (δ3.20); 16, Glutamic acid (δ3.76);
17, Proline (δ1.16); 18, Choline (δ2.07); 19, D-Lactic acid
(δ1.40); 20, 2-Aminoisobutyric acid (δ1.48); 21, Cyclopentane
(δ1.51); 22, β-Alanine (δ1.52); 23, Senecioic acid (δ1.77); 24,
Creatinine (δ1.90); 25, Fructose (δ2.61); 26, D-glucose (δ2.89);
27, Ornithine (δ3.05); 28, L-lactic acid (δ4.27); 29, Tyrosine
(δ6.07); 30, Tryptophan (δ7.28); 31, Lactate (δ7.81); 32, Purine
(δ8.86). |
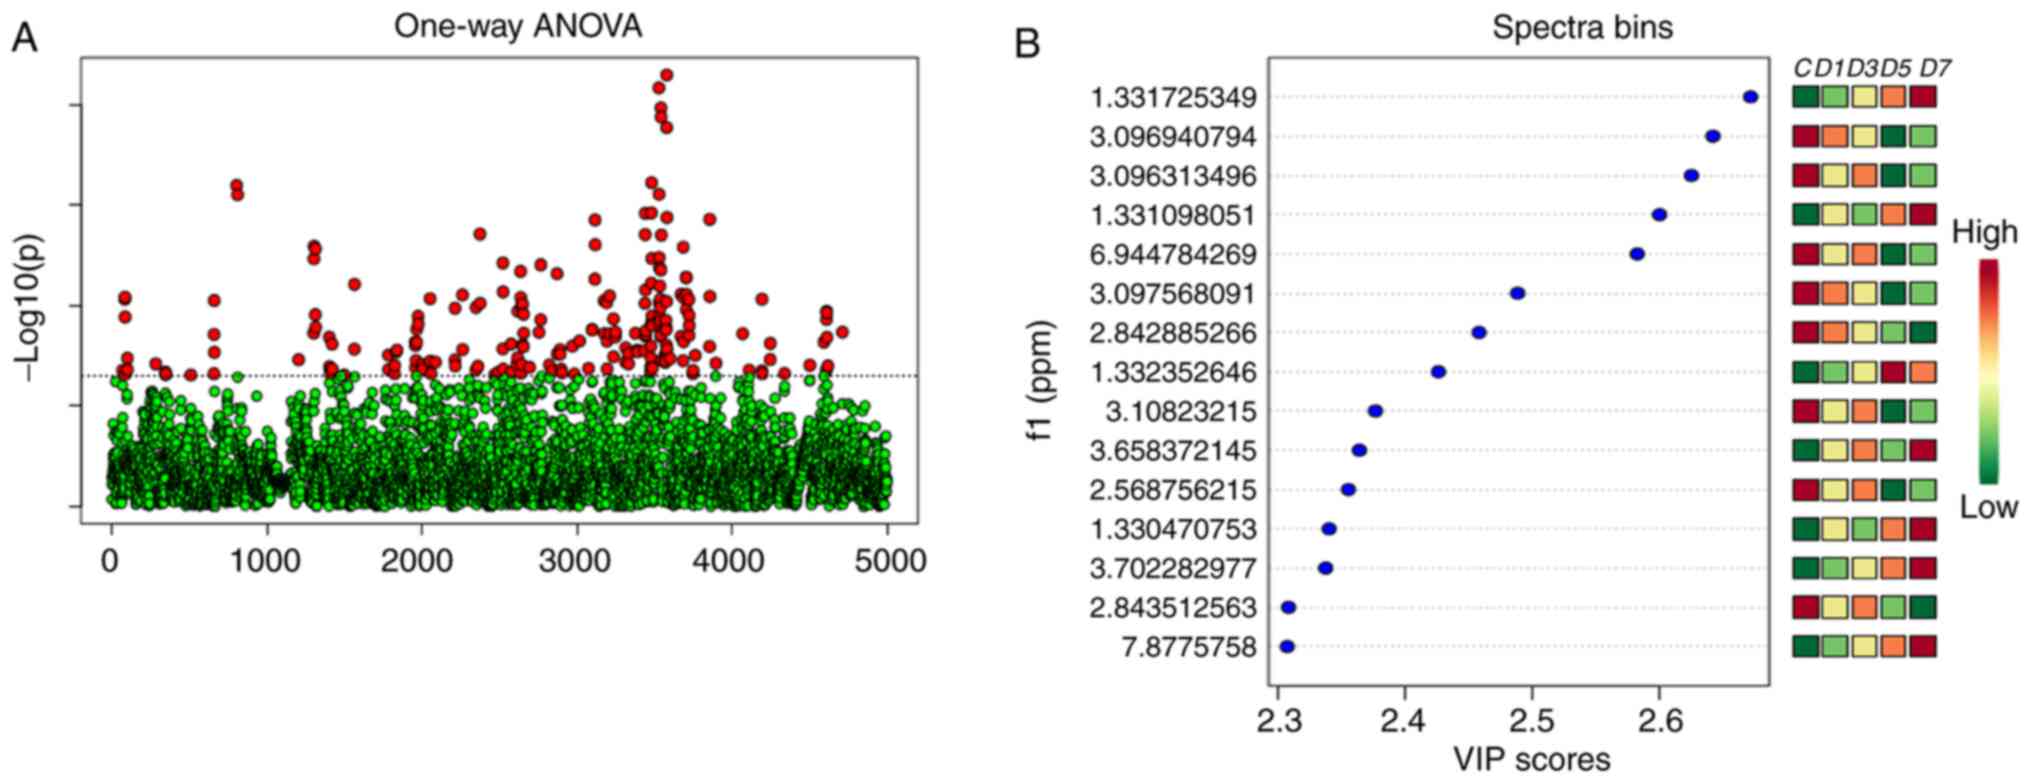
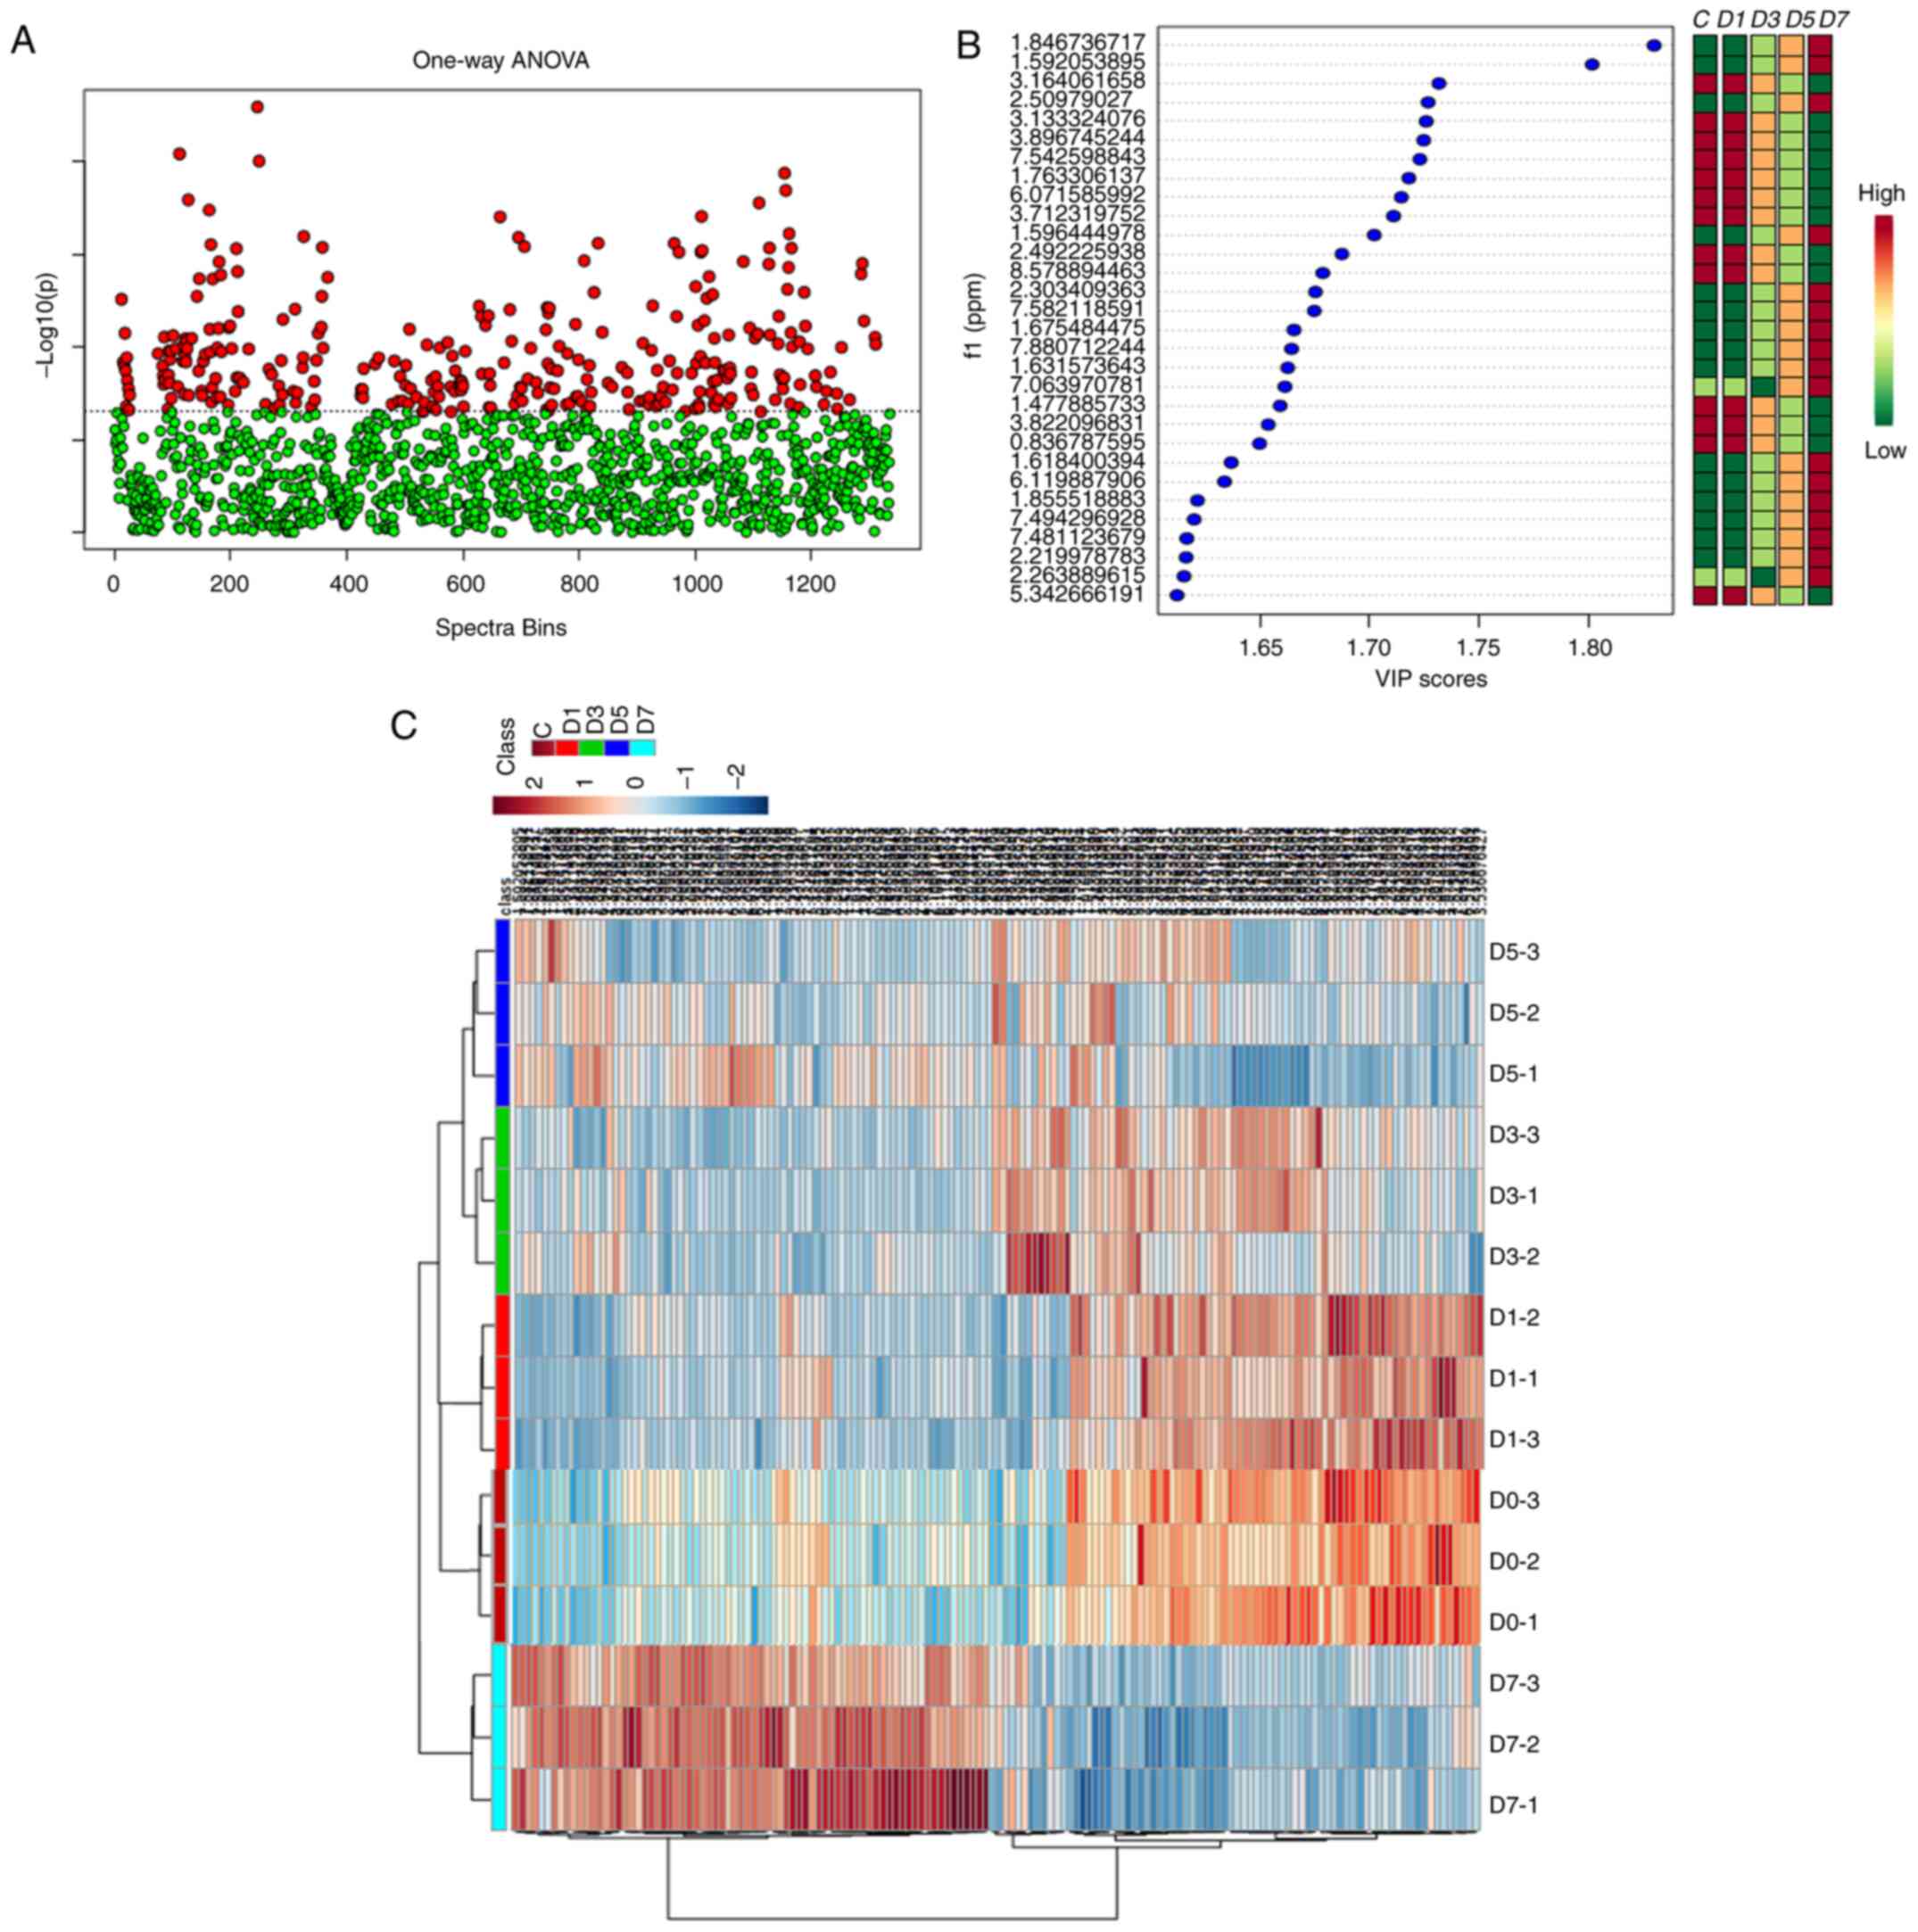
The VIP value of each peak was used to identify its
role in classification. Univariate statistical methods were used to
further analyze the identified metabolites. Finally, 34 urinary
metabolites in the original RWI and 32 metabolites in the processed
RWI groups were identified, based on a VIP value >1, and a
Student's t-test significant difference threshold of P<0.05. The
results of the analysis are shown in Figs. 7 and 8.
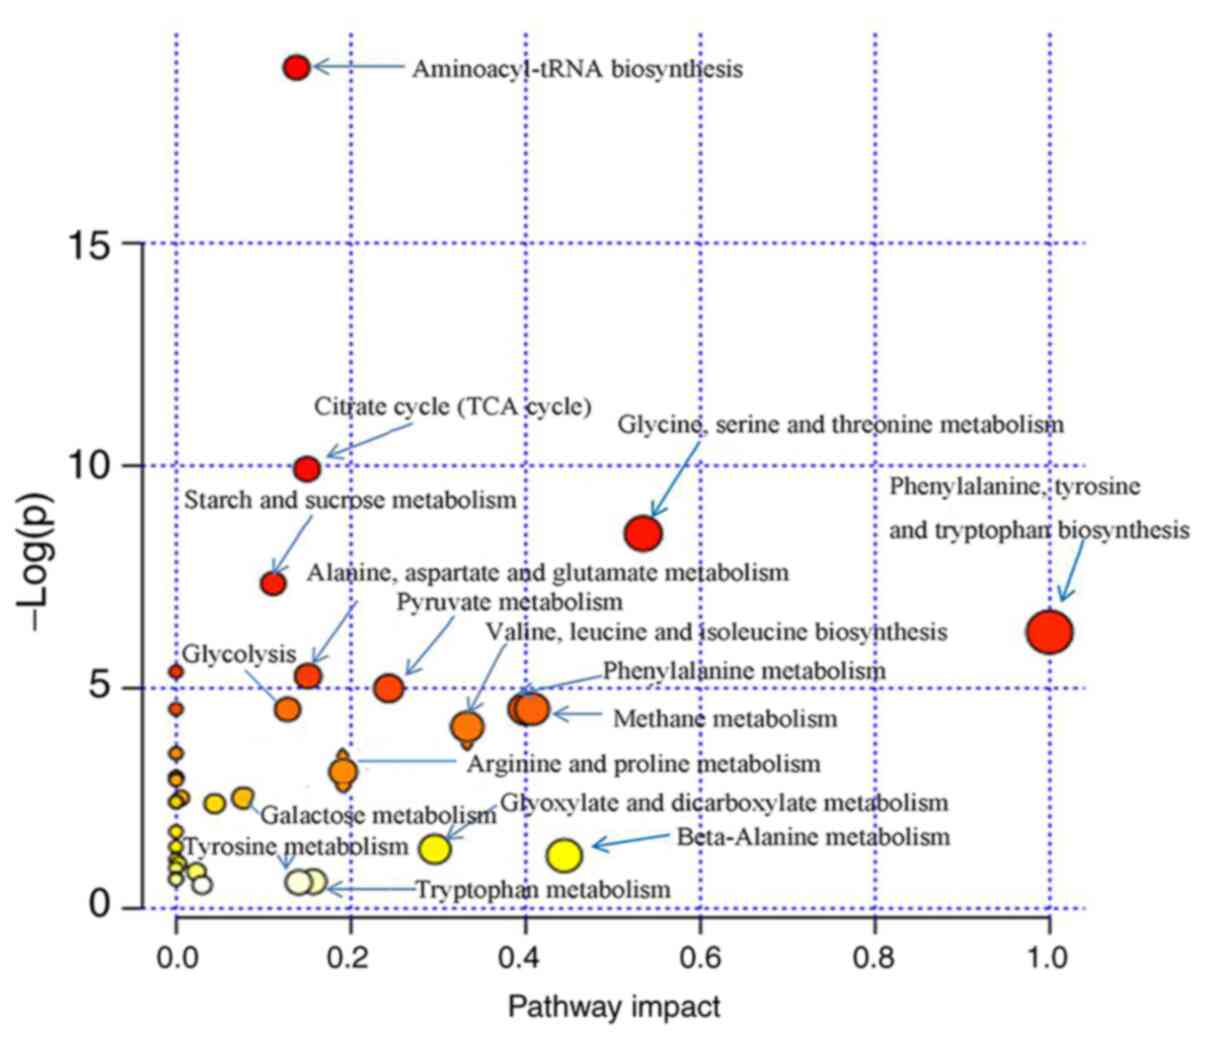
Pathway analysis
In total, 36 metabolic pathways in the raw RWI group
and 22 metabolic pathways in the processed RWI group were altered.
Using KEGG metabolic pathway enrichment analysis, 20 metabolic
pathways (VIP>1.0, P<0.05) were found to have the greatest
impact on the identified urine metabolites in the raw RWI group
(Fig. 9). Out of the 20 metabolic
pathways, the primary metabolic pathways with the greatest effect
were amino acid metabolism (including ‘Glycine, serine and
threonine metabolism’, ‘Phenylalanine, tyrosine and tryptophan
biosynthesis’, ‘Alanine, aspartate and glutamate metabolism’,
‘Valine, leucine and isoleucine biosynthesis’ and ‘Phenylalanine
metabolism’), carbohydrate metabolism [including ‘Citrate cycle
(TCA cycle)’, ‘Pyruvate metabolism’ and ‘Starch and sucrose
metabolism’] and energy metabolism (mainly ‘Methane metabolism’).
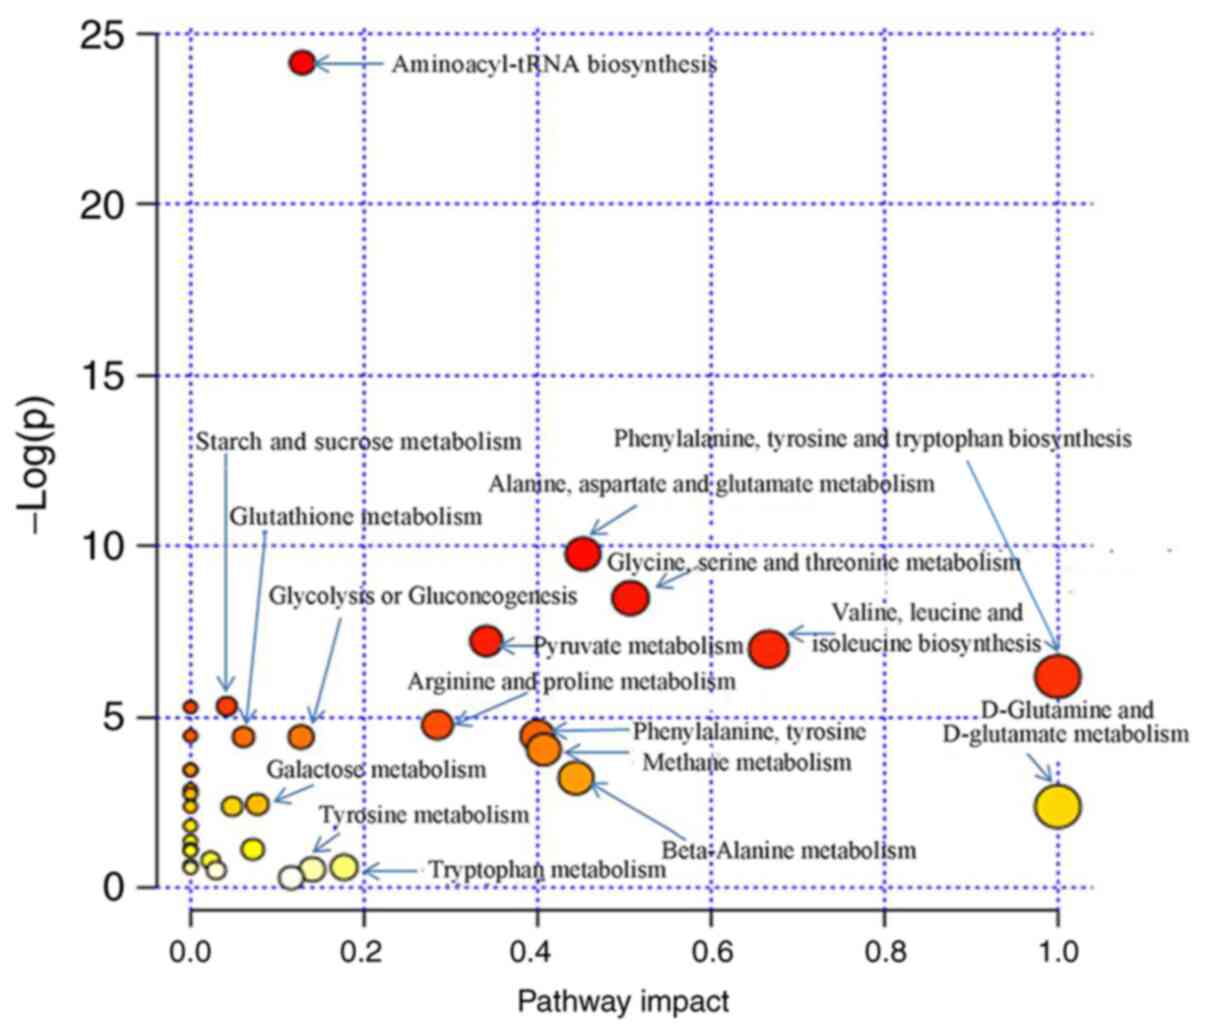
Additionally, 13 metabolic pathways in the processed RWI group with
the most influence (VIP>1.0, P<0.05; Fig. 10), exhibited a general map of
primary metabolic pathways that were similar to the raw RWI group,
although the significance of the influences on the metabolic
pathways differed. For example, compared with the raw RWI group,
the ‘Citrate cycle (TCA cycle)’ was not involved. In addition, by
comparing the metabolic pathway diagrams of raw materials and
processed products, it could be seen that where the metabolic
pathways of ‘alanine, aspartate and glutamate metabolism’ and
‘valine, leucine and isoleucine biosynthesis’ corresponded with the
abscissa and ordinate values in the processed group had increased,
which showed that there was an increased contribution of the two
metabolic pathways to the processed group.
Discussion
Our previous study demonstrated that the
seat-soaking method could reduce the toxicity of RWI. After
processing, the toxic component YH-10 was converted into YH-10 +
OH, the content of YH-10 decreased by 48%, and the contents of the
other toxic components YH-12 and YH-15 also decreased by 44 and 65%
respectively (25). The present
study primarily focused on the effect of sweat-soaking on the
effect of RWI in terms of metabolic markers and metabolic
pathways.
In the present study, it was noted that several
amino acids were perturbed in the urine from rats treated with raw
RWI. The levels of lysine, proline, L-alanine, tyrosine,
phenylalanine and tryptophan were increased, whereas those of
alanine, β-alanine, asparagine, glycine, ornithine, valine and
metabolites were reduced. Disruption of amino acid metabolism in
raw products may be caused by hepatic injury, as the liver is the
primary site of amino acid catabolism (30). In addition, alanine is a
non-essential amino acid, and as a major energy source, can be
metabolized by pyruvate and released from muscles (31).
Fat, sugar and protein, as the major energy sources
in our body, are mainly metabolized in liver mitochondria (32). When liver mitochondria are damaged,
energy metabolism decreases, and the usage of materials for energy
generation increases (33).
Increasing the supply of small molecular compounds as a source of
energy, such as glucose, fructose and lactic acid, may be due to a
decrease in energy metabolism in the body (34). Increased excretion of glucose and
amino acids in the urine is a typical biomarker of renal proximal
tubule injury and renal toxicity (35). In the present study, the raw RWI had
a significant effect on energy metabolism and the levels of
metabolites, such as fructose, sucrose and D-glucose, as their
levels were increased in the urine, which may be a result of liver
and kidney injury and obstruction of starch glucose metabolism.
Moreover, when liver mitochondria are injured, the TCA cycle is
blocked, which induces citric acid, 2-ketoglutaric acid and
succinic acid, and the production of ATP is decreased (36). Glycolysis is increased to compensate
for the reduction in ATP production, leading to an increase in
lactic acid levels (37). After
administration of raw RWI, the levels of metabolites, such as
citric acid and succinic acid decreased, but those of lactic acid
increased. This may be caused by TCA cycle inhibition and liver
injury. Furthermore, liver injury can lead to impaired energy
metabolism and thus promote creatinine production (38). Elevated levels of creatinine and
acetic acid can be used as a marker for nephrotoxicity (39). Glucose, lactic acid,
hydroxybutyrate, equine, creatinine and ketoglutaric acid in urine
can be used as biomarkers of renal tubular injury (40). Increased creatinine levels in the
urine in animals treated with raw RWI was indicative of kidney
damage in these rats.
Hepatic and nephritic injury can lead to an increase
in the levels of choline and a decrease in the levels of
metabolites. Choline can be used to synthesize phosphatidylcholine,
acetylcholine and oxidized to betaine in mammals. Choline is
oxidized to betaine primarily in the mitochondria of the liver
(41). When the liver is injured,
choline metabolism is blocked, which results in increased choline
levels and reduced levels of its metabolite, betaine (42). In the present study, the levels of
choline were elevated, and those of betaine were reduced in the
urine after treatment with raw RWI. While in the rats treated with
the processed RWI, choline levels in the urine were increased only
slightly, whereas betaine levels did not exhibit a difference. This
demonstrated that the toxicity of the processed RWI was lower
compared with that of the raw RWI.
Compared with the raw RWI, the processed form
resulted in the opposite effects, reducing interference in amino
acid levels, as well as the emergence of new metabolites. For
example, the increased lysine, proline, L-Alanine and tyrosine
levels observed in the rats treated with the RWI product was
decreased in the rats treated with the processed RWI. Similarly,
the decreased β-alanine, asparagine, ornithine, L-proline, L-valine
and L-serine levels were upregulated in rats treated with processed
RWI. Thus, processing of RWI may reduce liver injury to RWI.
The changes in the products of the TCA cycle
revealed a disturbance of anaerobic glycolysis in raw RWI treated
rats. Increasing compensatory anaerobic glycolysis leads to higher
levels of lactate (37). An
increase in the lactate levels was observed in the urine of rats
treated with raw RWI (Table I),
suggesting increased glycolysis. In the processed RWI group, the
levels of citrate increased and lactate levels decreased, whereas
succinate levels did not differ (Table
II). This indicated that the sweat soaking method reduced the
toxicity of RWI, thereby reducing liver mitochondrial injury. In
addition, liver mitochondria injury can result in decreases in
energy metabolism and an increase in carbohydrate levels, such as
saccharides (43). The levels of
energy-supply materials, including D-glucose and fructose,
decreased in the rats treated with the processed RWI product,
showing a reversal in the effects observed with the raw RWI.
When the mitochondria of the liver are damaged, the
TCA cycle is blocked, and thus, citric acid, 2-keto-glutaric acid
and succinic acid levels, as well as ATP production are reduced,
and a compensatory increase in glycolysis is observed, thus
increasing lactic acid levels (36). In the rats treated with raw RWI, the
mitochondria of the liver were damaged, the TCA cycle was blocked,
and the levels of products, such as citric acid and succinic acid
were significantly decreased, whereas that of lactic acid was
increased. In the rats treated with the processed RWI, the levels
of citric acid were increased, lactic acid levels were reduced and
succinic acid levels did not differ, suggesting that the
sweat-soaking method could reduce injury to liver mitochondria
caused by raw RWI. In addition, the damage to liver mitochondria
can lead to a decrease from energy metabolism and an increase in
the use of carbohydrate, such as saccharides instead. D-glucose and
fructose levels decreased in the urine in the rats treated with the
processed RWI, compared with the rats treated with raw RWI.
The creatinine levels were increased in the rats
treated with the raw RWI and decreased in those treated with the
processed form, which indicated that the administration of the
processed product resulted in less injury to the liver and kidney
than raw RWI.
In conclusion, intragastric administration of raw
RWI induced apparent systemic metabolic changes based on analysis
of the urine samples of rats using 1H-NMR-based
metabolomics. The metabolomics analysis demonstrated that raw RWI
perturbed the metabolism of amino acids, choline metabolism, energy
substrates and carbohydrates. However, compared with the raw
product, the processed RWI had the opposite effect, or reduced
interference to amino acid metabolism, choline metabolism, energy
substrates and carbohydrate metabolism. This study revealed the
toxic effects of RWI, and confirmed that the sweat-soaking method
could reduce the toxicity of RWI, thus highlighting its potential
for detoxification of TCM products to improve their potential
clinical value.
Acknowledgements
Not applicable.
Funding
Funding: This work was supported by the National Natural
Sciences Foundation of China (grant no. 81760766), the National
Natural Sciences Foundation of China (grant no. 82060767), the
Guizhou Province Science and Technology Foundation Project [grant
no. Guizhou Scientific Basis (2017) 1007], the Guiyang College of
TCM Doctor Startup Fund Project [grant no. Guizhongyi Doctor Fund
(2017) 1], the National training program for innovative backbone
talents for TCM [grant no. Zjjh (2019) 128], the ‘Thousand’ level
Innovative Talents Project in Guizhou Province [grant no. Qrlf
(2020) 4], and the Fund project of Guizhou administration of
traditional Chinese Medicine (grant no. QZYY-2020-083).
Availability of data and materials
The datasets used and/or analyzed during the current
study are available from the corresponding author on reasonable
request.
Authors' contributions
ZRZ and GF performed the experiments, including
collection of the plant material, preparation of the raw and
processed RWI ethanol extracts, interpretation of the experimental
data, and writing of the manuscript. WL and LLL contributed to
analysis of the metabonomic data. GF conceived and designed the
study. ZGW, CQZ, QX, CCR and LZP all participated in the
experiments. All authors have read and approved the final
manuscript. ZRZ and GF confirm the authenticity of all the raw
data.
Ethics approval and consent to
participate
The animal experiments were reviewed and approved by
the Ethics Review Committee for Experimental Animals of Guizhou
University of Traditional Chinese Medicine and met the relevant
requirements for animal welfare.
Patient consent for publication
Not applicable.
Competing interests
The authors declare that they have no competing
interests.
References
|
1
|
Ho WS, Xue JY, Sun SM, Ooi VE and Li YL:
Antiviral activity of daphnoretin isolated from Wikstroemia indica.
Phytother Res. 24:657–661. 2010.PubMed/NCBI View
Article : Google Scholar
|
|
2
|
Zhang QR and Xia GC: Colored illustrated
book of poisonous chinese herbal medicine. Tianjin Science and
Technology Translation Publishing Company. 131:2006.
|
|
3
|
Kato M, He YM, Dibwe DF, Li F, Awale S,
Kadota S and Tezuka Y: New guaian-type sesquiterpene from
Wikstroemia indica. Nat Prod Commun. 9:1–2. 2014.PubMed/NCBI
|
|
4
|
Tong LJ, Sun LX, Sun LX, LU XF and XU CL:
Isolation and structural identification of the chemical
constituents from the rhizomes of Wikstroemia indica. Chin J Med
Chemistry. 25:50–53. 2015.
|
|
5
|
Chang H, Wang YW, Gao X, Song Z, Awale S,
Han N, Liu Z and Yin J: Lignans from the root of Wikstroemia indica
and their cytotoxic activity against PANC-1 human pancreatic cancer
cells. Fitoterapia. 121:31–37. 2017.PubMed/NCBI View Article : Google Scholar
|
|
6
|
Wang GC, Zhang XL, Wang YF, Li GQ, Ye WC
and Li YL: Four new dilignans from the roots of Wikstroemia indica.
Chem Pharm Bull (Tokyo). 60:920–923. 2012.PubMed/NCBI View Article : Google Scholar
|
|
7
|
Shao M, Huang XJ, Liu JS, Han WL, Cai HB,
Tang QF and Fan Q: A new cytotoxic biflavonoid from the rhizome of
Wikstroemia indica. Nat Prod Res. 30:1417–1422. 2016.PubMed/NCBI View Article : Google Scholar
|
|
8
|
Huang WH, Zhou GX, Wang GC, Chung HY, Ye
WC and Li YL: A new biflavonoid with antiviral activity from the
roots of Wikstroemia indica. J Asian Nat Prod Res. 14:401–406.
2012.PubMed/NCBI View Article : Google Scholar
|
|
9
|
Li J, Lu LY, Zeng LH, Zhang C, Hu JL and
Li XR: A new C-3/C-3'-biflavanone from the roots of Wikstroemia
indica. Molecules. 17:7792–7797. 2012.PubMed/NCBI View Article : Google Scholar
|
|
10
|
Shao M, Huang XJ, Sun XG, Wang Y, Yang Y,
Wang QR, Fan Q and Ye WC: Phenolic constituents from rhizome of
Wikstroemia indica and their anti-tumor activity. Nat Prod Res Dev.
26:851–855. 2014.
|
|
11
|
Guo GM, Li W and Wang Y: Sterol compounds
from Wikstroemia indica (L.) C.A.May. J Mt Agric Biol. 31:77–79.
2012.
|
|
12
|
Guo GM, Wang Y, Li W and Hao XJ: Study on
the chemical constituents from the light petroleum extracts of
Wikstroemia indica. Sci Technol Eng. 14:188–190. 2014.
|
|
13
|
Chen C, Qu F, Wang J, Xia X, Wang J, Chen
Z, Ma X, Wei S, Zhang Y, Li JY, et al: Antibacterial effects of
different extracts from Wikstroemia indica on Escherichiacoli based
on microcalorimetry coupled with agar dilution method. J Therm Anal
Calorim. 123:1583–1590. 2016.
|
|
14
|
Lu CL, Zhu L, Piao JH and Jiang JG:
Chemical compositions extracted from Wikstroemia indica and their
multiple activities. Pharm Biol. 50:225–231. 2012.PubMed/NCBI View Article : Google Scholar
|
|
15
|
Ho WS, Li YL, Sun SS, Ooi VE and Xue JY:
Antiviral activity of daphnoretin isolated from Wikstroemia indica.
Phytother Res. 24:657–661. 2010.PubMed/NCBI View
Article : Google Scholar
|
|
16
|
Yang ZY, Kan JT, Cheng ZY, Wang XL, Zhu YZ
and Guo W: Daphnoretin-induced apoptosis in HeLa cells: A possible
mitochondria-dependent pathway. Cytotechnology. 66:51–61.
2014.PubMed/NCBI View Article : Google Scholar
|
|
17
|
Jiang HF, Wu Z, Bai X, Zhang Y and He P:
Effect of daphnoretin on the proliferation and apoptosis of A549
lung cancer cells in vitro. Oncol Lett. 8:1139–1142.
2014.PubMed/NCBI View Article : Google Scholar
|
|
18
|
Liu MX, Chen YG, Luo J, Wang JL, Sun H and
Chen J: One case of severe erythema multiform drug eruption
accompanied by drug-induced liver injury induced by wikstroemiae
indicae radix tablets. Chin J Pharmacovigilance. 15:314–315, 317.
2018.
|
|
19
|
National Pharmacopoeia Committee:
Pharmacopoeia of People's Republic of China. Part 1. People's
Health Publishing House, Beijing, p16, 1978.
|
|
20
|
Feng G, Li W, He X, Li ZQ, Wang JK, Zheng
CQ, Tian XF and Leng AB: Effects of different extracts of Miao
medicine Wikstroemia indica root on hepatotoxicity in normal rats.
Chinese J Exp Traditional Med Formulae. 23:96–102. 2017.
|
|
21
|
National Pharmacopoeia Commission:
Pharmacopoeia of the People's Republic of China. Part 1. China
Medical Science and Technology Press, Beijing, p248, 2015.
|
|
22
|
Wang JK, Li W, Guo JM, Gao YM, Zhang LY
and Yang R: Influence of different processing methods on the total
flavonoids content of Wikstroemia indica. J Guiyang Coll
Traditional Chin Med. 33:17–19. 2011.
|
|
23
|
Shen MF, Li W, Wang JK, Lin C, Guo JM,
Yang CF and Yang Y: The content of daphnoretin in different
medicinal parts of Wikstroemia indica was determined by HPLC. J Med
Pharm Chin Minorities. 18:65–67. 2012.
|
|
24
|
Zhang JJ, Xiong Y, Li W, Wang JK, Lin C,
Wu N and Yang Q: Comparison of antibacterial and anti-inflammatory
effect of unprocessed and processed products of indian stringbush
root. Lishizhen Med Materia Med Res. 26:1118–1120. 2015.
|
|
25
|
Feng G, Li W, He X, Zheng C, Leng A and
Tian X: Comparison of acute toxicity effects of ethanol extract
from different processed products of Miao Medi-cine Wikstroemia
indica on mice. China Pharmacy. 28:3536–3540. 2017.
|
|
26
|
Zhang J, Li W, Wang J, Lin C and Liu Y:
Comparison of acute toxicity of extract of unprocessed indian
atringbush root and its two different processed products. Zhongguo
Zhong Yao Za Zhi. 36:1172–1174. 2011.PubMed/NCBI(In Chinese).
|
|
27
|
Feng G, Chen YL, Li W, Li LL, Wu ZG, Wu
ZJ, Hai Y, Zhang SC, Zheng CQ, Liu CX and He X: Exploring the
Q-marker of ‘sweat soaking method’ processed radix Wikstroemia
indica: Based on the ‘effect-toxicity-chemicals’ study.
Phytomedicine. 45:49–58. 2018.PubMed/NCBI View Article : Google Scholar
|
|
28
|
Zhang Z, Wang X, Wang J, Jia Z, Liu Y, Xie
X, Wang C and Jia W: Metabonomics approach to assessing the
metabolism variation and endoexogenous metabolic interaction of
ginsenosides in cold stress rats. J Proteome Res. 15:1842–1852.
2016.PubMed/NCBI View Article : Google Scholar
|
|
29
|
Kanehisa M, Araki M, Goto S, Hattori M,
Hirakawa M, Itoh M, Katayama T, Kawashima S, Okuda S, Tokimatsu T
and Yamanishi Y: KEGG for linking genomes to life and the
environment. Nucleic Acids Res. 36:D480–D484. 2008.PubMed/NCBI View Article : Google Scholar
|
|
30
|
West TP: Pyrimidine bases catabolism in
Pseudomonas putida biotype B. Antonie Van Leeuwenhoek. 80:163–167.
2001.PubMed/NCBI View Article : Google Scholar
|
|
31
|
Guo PP, Wang J, Dong G, Wei D, Li M, Yang
M and Kong L: NMR-based metabolomics approach to study the chronic
toxicity of crude ricin from castor bean kernels on rats. Mol
Biosyst. 10:2426–2440. 2014.PubMed/NCBI View Article : Google Scholar
|
|
32
|
Araujo TT, Barbosa Silva Pereira HA,
Dionizio A, Sanchez CD, de Souza Carvalho T, de Silva Fernandes M
and Rabelo Buzalaf MA: Changes in energy metabolism induced by
fluoride: Insights from inside the mitochondria. Chemosphere.
236(124357)2019.PubMed/NCBI View Article : Google Scholar
|
|
33
|
Xu F, Liu Y, Zhao H, Yu K, Song M, Zhu Y
and Li Y: Aluminum chloride caused liver dysfunction and
mitochondrial energy metabolism disorder in rat. J Inorg Biochem.
174:55–62. 2017.PubMed/NCBI View Article : Google Scholar
|
|
34
|
Venediktova NI, Mashchenko OV, Talanov EY,
Belosludtseva NV and Mironova GD: Energy metabolism and oxidative
status of rat liver mitochondria in conditions of experimentally
induced hyperthyroidism. Mitochondrion. 52:190–196. 2020.PubMed/NCBI View Article : Google Scholar
|
|
35
|
Buckalew VM Jr: Nephrolithiasis in renal
tubular acidosis. J Urol. 141:731–737. 1989.PubMed/NCBI View Article : Google Scholar
|
|
36
|
Zhang H, Chen Y, Li Y and Wang T:
Protective effect of polydatin on jejunal mucosal integrity, redox
status, inflammatory response, and mitochondrial function in
intrauterine growth-retarded weanling piglets. Oxid Med Cell
Longev. 7178123:2020.PubMed/NCBI View Article : Google Scholar
|
|
37
|
Tasci I, Mas N, Mas MR, Tuncer M and
Comert B: Ultrastructural changes in hepatocytes after taurine
treatment in CCl4 induced liver injury. World J
Gastroenterol. 14:4897–4902. 2008.PubMed/NCBI View Article : Google Scholar
|
|
38
|
Romano TG, Schmidtbauer I, Silva FM,
Pompilio CE, D'Albuquerque LA and Macedo E: Role of MELD score and
serum creatinine as prognostic tools for the development of acute
kidney injury after liver transplantation. PLoS One.
8(e64089)2013.PubMed/NCBI View Article : Google Scholar
|
|
39
|
Gartland KP, Bonner FW, Timbrell JA and
Nicholson JK: Biochemical characterisation of
para-aminophenol-induced nephrotoxic lesions in the F344 rat. Arch
Toxicol. 63:97–106. 1989.PubMed/NCBI View Article : Google Scholar
|
|
40
|
Holmes E, Nicholson JK, Nicholls AW,
Lindon JC, Connor SC, Polley S and Connelly J: The identification
of novel biomarkers of renal toxicity using automatic data
reduction techniques and PCA of proton NMR spectra of urine.
Chemometr Intell Lab Syst. 44:245–255. 1998.
|
|
41
|
Buchman AL: The addition of choline to
parenteral nutrition. Gastroenterology. 137:119–128.
2009.PubMed/NCBI View Article : Google Scholar
|
|
42
|
Griffin JL, Mann CJ, Scott J, Shoulders CC
and Nicholson JK: Choline containing metabolites during cell
transfection: An insight into magnetic resonance spectroscopy
detectable changes. FEBS Lett. 509:263–266. 2001.PubMed/NCBI View Article : Google Scholar
|
|
43
|
Oliveira DT, Chaves-Filho AB, Yoshinaga
MY, Paiva NC, Carneiro CM, Miyamoto S, Festuccia WT and Guerra-Sá
R: Liver lipidome signature and metabolic pathways in nonalcoholic
fatty liver disease induced by a high-sugar diet. J Nut
Biochemistry. 87(108519)2021.PubMed/NCBI View Article : Google Scholar
|