Introduction
Gestational diabetes mellitus (GDM) is a metabolic
complication of pregnancy that is defined by the development of
glucose intolerance, which is first recognized during pregnancy
(1). The prevalence of GDM has
been reported to be at ~20% of all pregnancies worldwide (2), but it is increasing due to the
epidemic nature of obesity among women during reproductive age
(2). Maternal genetic
predisposition, fetoplacental and environmental factors have all
been proposed to initiate vascular damage events that result in
long term complications at the level of the heart, kidneys and
nerves and are becoming a serious public heath burden (2). Individuals with a personal history of
GDM and her offspring both have an increased risk of developing
type 2 diabetes, obesity, cardiovascular diseases and metabolic
syndrome (3). Therefore, it is
critical to understand the physiopathology of GDM, since it
generates a transgenerational vicious circle of various metabolic
diseases. Risk factors for GDM, such as advanced maternal age,
overweight, obesity, high parity, previous delivery of a macrosomic
infant, are associated with impaired β-cell function and insulin
resistance (IR), which are essential components in the pathogenesis
of GDM (3). Early prevention of
adverse pregnancy outcomes, such as excessive fetal growth,
jaundice, neonatal hypoglycaemia, stillbirth, polyhydramnios,
hypertensive disorders of pregnancy and fetal growth restriction,
may improve the quality of life and health care efficiency
(3).
β-cell dysfunction occurs when β-cells lose their
capacity to respond correctly to blood glucose changes, resulting
in insufficient insulin secretion (4). IR aggravates β-cell dysfunction by
excessively stimulating insulin production in response to chronic
hyperglycaemia (4). This mechanism
is defined as glucotoxicity which, over time β-cell dysfunction
leads to a vicious cycle starting with hyperglycaemia and followed
by insulin resistance, eventually β-cell apoptosis (5). Malfunction of β-cells can typically
appear at different levels: Pro-insulin synthesis or
post-translational modifications, secretory vesicle storage and
exocytosis, or sensing of blood glucose concentrations (5). Proinsulin is the precursor molecule
of insulin that is produced by pancreatic cells and incorporates
the A and B chains of insulin connected between amino acid residues
31 and 65 by the C-peptide (5). In
normal conditions, all proinsulin is cleaved to produce C-peptide
and insulin, whilst a small amount of intact proinsulin may also be
released into the circulation (5).
In response to IR, pancreatic β-cell function is affected, which
results in an increased release of both intact and split forms of
proinsulin (5).
Physiological IR during pregnancy is necessary for
fetal growth and when insulin secretion fails to compensate for IR,
hyperglycaemia and GDM develops (6). Specifically, IR is a state in which
normal levels of insulin cannot initiate a response in target cells
to uptake glucose from the circulation (7). It is this lack of response that
stimulates the pancreas to secrete more insulin (7). Other factors involved in the
development of IR during pregnancy are adipocyte-derived hormones,
such as adiponectin and leptin (8). Adiponectin regulates insulin action
and glucose homeostasis, the serum levels of which decrease during
pregnancy (8). During the third
trimester of pregnancy, when the severity of maternal IR is at its
highest, circulating adiponectin reaches its lowest level (9). Hypoadiponectinemia during pregnancy
has several effects leading to GDM: It increases IR in skeletal
muscles and reduces glucose uptake; increase pancreatic β-cell
dysfunction; and induction of hyperglycaemia (9). Maternal adiponectin was previously
found to be higher in healthy pregnant individuals compared with
that in pregnant individuals complicated with GDM (10). Another hormone secreted by
adipocytes is leptin. A previous study has reported that leptin
levels are increased during GDM, which are associated with
increased sizes of the fetus (11). In addition, higher plasma leptin
concentrations have been reported in obese individuals, due to the
associated inflammation (12).
A previous study has suggested that IR in GDM can
result in differential pregnancy outcomes, such as macrosomia
(7). Fetal macrosomia is defined
as an infant birth weight of ≥4,000 g, which affects 15-45% of all
new-borns from women with GDM (13).
A previous study showed that non-alcoholic fatty
liver disease (NAFLD) during pregnancy increases the risk of GDM
whilst the presence of GDM also increases the risk of NAFLD
(14). This association is
bidirectional though the mechanism remains unclear. NAFLD is
characterized by elevated levels of transaminases and leads to
hepatic IR (14). Hepatic IR
increases glycogen breakdown and free fatty acid secretion due to
increased lipolysis, which contributes to macrosomia (15). To the best of our knowledge, there
are insufficient data regarding the impact of maternal NAFLD on
macrosomia in GDM.
Results of a 2005 clinical trial led to the
recommendation of controlling maternal hyperglycaemia and
gestational weight gain, in order to prevent macrosomia (16). However, there are also data showing
that insulin levels are elevated in the blood sampled from the
umbilical cord of macrosomic infants from non-diabetic mothers
(17). This suggests that there
are other risk factors for macrosomia apart from pre-existing
maternal diabetes and uncontrolled GDM. Therefore, further analyses
on macrosomic GDM pregnancy are required to identify these other
factors and their relationship with IR during the second half of
pregnancy.
The aims of the present study were: i) To identify
the factors involved in the pathophysiology of GDM complicated with
or without macrosomia; and ii) to reveal the association between
these factors and anthropometric, clinical and paraclinical
parameters of the patient.
Materials and methods
Study population
A case-control study was conducted on 36 pregnant
women who presented in the Second Department of Diabetes ‘N.
Paulescu’ National Institute of Diabetes, Nutrition and Metabolic
Diseases (Bucharest, Romania) between Jan 2018 and Nov 2021. The
inclusion criteria were as follows: i) Women aged 18-40 years; ii)
24 to 32 weeks of gestation; and iii) if their fasting glucose
levels exceed the cut-off levels [fasting (OGTT 0-h) ≥92 mg/dl;
after 1 h of fasting (OGTT 1-h) ≥180 mg/dl; and after 2 h of
fasting (OGTT 2-h) ≥153 mg/dl]. The present study was approved by
the Ethics Committee of the ‘N. Paulescu’ National Institute of
Diabetes, Nutrition and Metabolic Diseases, Bucharest, Romania
(approval no. 1680/01.11.2017). Each patient involved in the study
signed the written informed consent form as specified in the
Declaration of Helsinki and agreed to the use of their samples for
scientific research.
The patients with GDM and non-diabetic individuals
were divided into the following three groups: i) Gestational
healthy control group (GC; n=8; age, 26±2.33 years); ii)
gestational diabetes mellitus group (GDM) with normal offspring
(GDM-N; birth weight of child <4,000 g; n=23; age, 31.52±3.80
years); and iii) GDM with macrosomia (GDM-M; birth weight of child
≥4,000 g; n=5; age, 32.00±6.67 years).
The exclusion criteria were: Aged <18 or >40
years; hypertension; preeclampsia; retinopathy; nephropathy; and
psychiatric treatment. A total of 28 patients with GDM maintained
normoglycemia with medical nutrition therapy from the moment of GDM
diagnosis (24-32 weeks of gestation). Specifically, an
individualized nutrition plan was enacted to provide an adequate
caloric intake, optimal glycemic levels and maternal weight gain
according to the 2009 Institute of Medicine (US) and National
Research Council (US) Committee recommendations (18). They received recommendations for
≥175 g carbohydrates, ≥71 g proteins and 28 g fibres. In addition,
at GDM diagnosis, 10 ml blood samples were collected from all
patients and sera were isolated for biochemical and immunological
testing as detailed below (Fig.
1). A baby's Apgar score was calculated using heart rate,
respiratory effort, muscle tone, skin color and reflex irritability
(19).
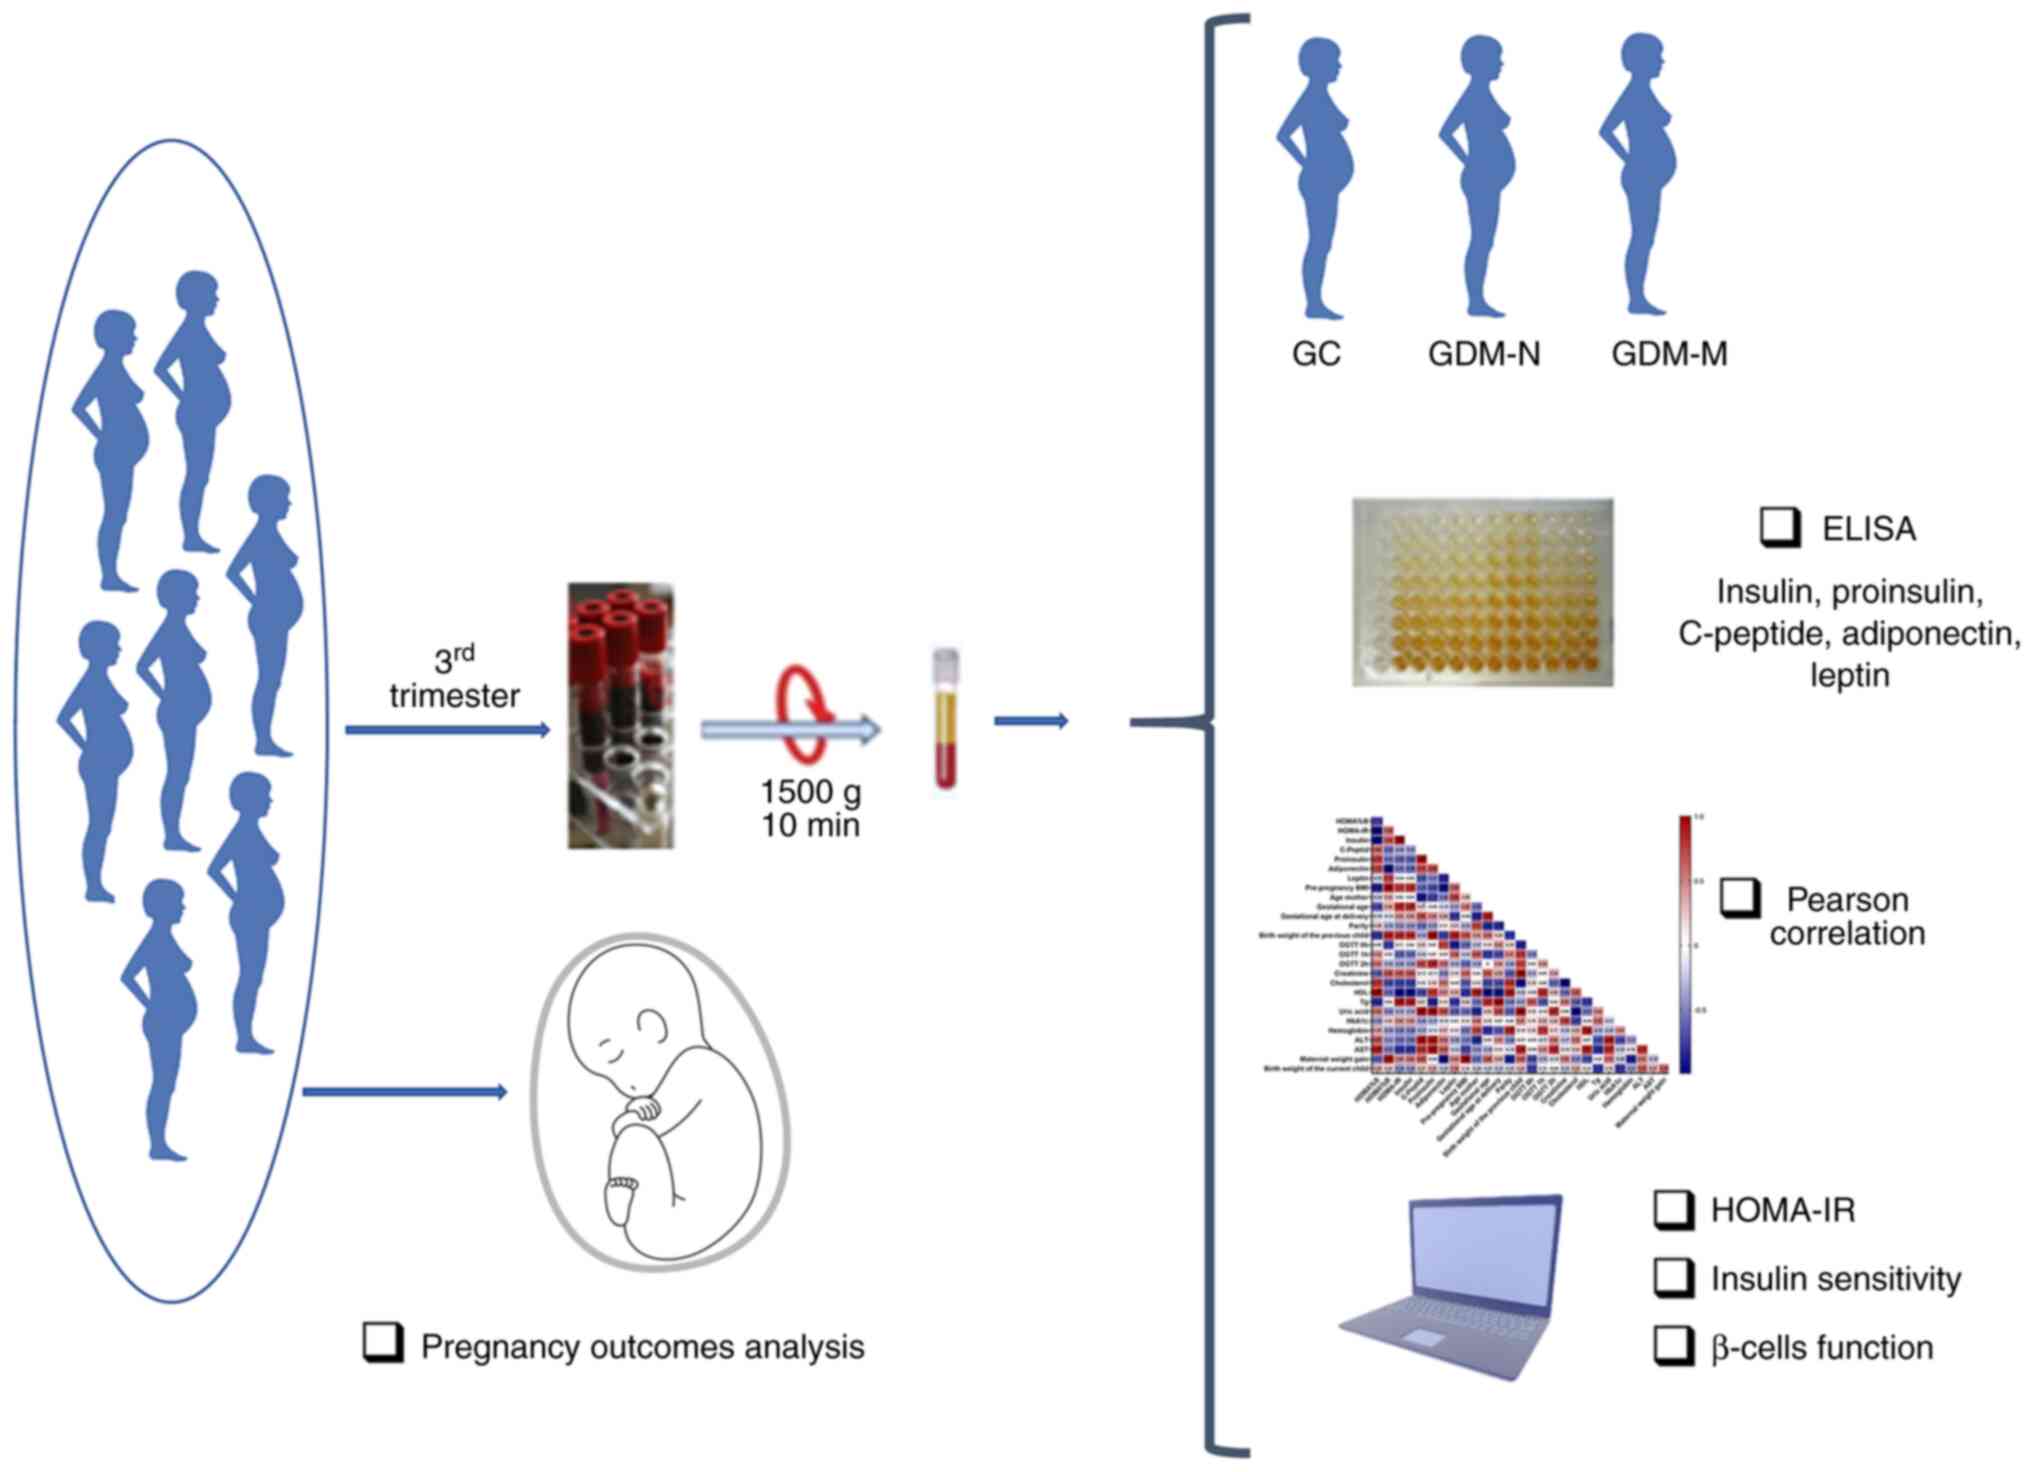 | Figure 1Experimental protocol of the present
case-control study design and methodological approaches. The
selected subjects were divided into three groups based on oral
glucose tolerance test at 0, 1 and 2 h on the third trimester of
pregnancy and the baby's weight at birth. Among the patients, 8
were with normal pregnancy, 23 had GDM with normal birth weight of
the child, whilst 5 had GDM with macrosomia. The serum was
adequately prepared for biochemical and immunological analysis.
Homeostatic model assessment of insulin resistance, insulin
sensitivity and β-cell function were calculated followed by Pearson
correlation analysis were performed on the clinical and
paraclinical variables. GC, gestational healthy control group; GDM,
gestational diabetes mellitus; GDM-N, GDM group with normal
offspring; GDM-M, GDM group with macrosomia; HOMA-IR, homeostatic
model assessment of insulin resistance. |
Definition of glucose tolerance
The screening test for the diagnosis of GDM is based
on 75-g oral glucose tolerance test (OGTT) at 2 h after
administration (recommendations of National Institute for Health
and Care Excellence, American Diabetes Association) (20). Diagnosis of GDM would be confirmed
if ≥1 values of glucose levels exceed the cut-off levels: Fasting
(OGTT 0-h) ≥92 mg/dl; after 1 h of fasting (OGTT 1-h) ≥180 mg/dl;
and after 2 h of fasting (OGTT 2-h) ≥153 mg/dl.
Biochemical tests
Blood samples were collected to establish the
diagnosis of GDM during the third trimester of pregnancy. The
samples were harvested after ≥8 h of fasting and blood samples were
centrifuged at 1,000 x g for 15 min at room temperature and stored
at -80˚C. According to the manufacturer's protocols (DRG
Instruments GmbH), specific ELISA kits were used to measure the
concentration of human serum adiponectin (cat. no. EIA-4177),
C-peptide (cat. no. EIA-1293), insulin (cat. no. EIA-2935), leptin
(cat. no. EIA-2395) and proinsulin (cat. no. EIA-1560).
Commercial kits from DIALAB GmbH were used to
measure the serum cholesterol (cat. no. D95116), high-density
lipoprotein cholesterol (HDL; cat. no. F03100), triglycerides (Tg;
cat. no. DK0740), creatinine (cat. no. D06450), uric acid (cat. no
D00720), alanine aminotransferase (ALT; cat. no. D98625) and
aspartate aminotransferase (AST; cat. no D98617) levels, according
to the manufacturer's protocols. Fasting plasma glucose was
determined using the glucose oxidase method using a glucose
analyser (AU480 Clinical Chemistry System; Beckman Coulter, Inc.).
Plasma HbA1c levels were determined using the Variant II Turbo
HbA1c analyser (Bio-Rad Laboratories, Inc.) and the Variant II
Turbo HbA1c kit (cat. no. 12000447; Bio-Rad Laboratories, Inc.),
which uses cation exchange high-performance liquid chromatography,
according to the manufacturer's protocols.
Assessment of IR and β-cell
function
The homeostasis model assessment (HOMA-IR) is a
validated method for quantifying IR and β-cell function (21). It is calculated based on the plasma
levels of fasting glucose and insulin and it is a mathematical
assessment that yields an estimate of an individual's degree of
insulin sensitivity (HOMA%S) and the level of steady-state β-cell
function (HOMA%B) (21). The
following formulas were used: HOMA-IR=[fasting insulin (mU/l) x
fasting glucose (mmol/l)]/22.5; HOMA%B=[20x fasting insulin
(mU/l)]/ [fasting glucose (mmol/l)-3.5]; and HOMA of insulin
sensitivity (HOMA%S)=1/HOMA-IR x100.
Sociodemographic data
Sociodemographic data of the subjects, including
maternal age, parity, smoking status, family history of diabetes,
family medical history, socioeconomic status, were obtained by
anamnesis. Anthropometric measurements, including height, present
body weight, pre-pregnancy body weight, BMI and blood pressure,
were also measured.
Statistical analysis
Data obtained are expressed as the mean ± standard
deviation. Statistical analyses were performed using GraphPad Prism
5.0 software (GraphPad Software, Inc.) using unpaired Student's
t-test or one-way ANOVA followed by Tukey's post-hoc test.
Pearson's correlation analysis was performed on serum level
parameters and patient characteristics associated with GDM.
P<0.05 was considered to indicate a statistically significant
difference.
Results
Maternal characteristics
The serum samples collected from the patients used
to establish the diagnosis of GDM were collected at the third
trimester of pregnancy for which these subjects were treated only
by dietary modulation. A summary of the study patient groups
characteristics is shown in Table
I.
 | Table ICharacteristics of the individuals
included in the present study. |
Table I
Characteristics of the individuals
included in the present study.
|
Characteristics | Gestational healthy
control (n=8) | GDM-N (n=27) | GDM-M (n=5) |
|---|
| Age, years | 26.00±2.33 |
31.52±3.80c |
32.00±6.67a |
| Pre-pregnancy BMI,
kg/m2 | 24.21±5.13 | 26.00±5.26 | 32.50±0.14 |
| BMI at gestational
age, kg/m2 | 27.69±5.29 | 29.41±5.56 |
32.45±2.00a |
| Gestational age at
diagnosis, weeks | 25.88±1.55 |
29.29±2.77b |
30.00±3.81b |
| Gestational age at
delivery, weeks | 38.50±0.71 | 37.93±8.22 | 38.40±0.55 |
| Parity (number of
gestations) | 1.13±1.13 | 1.31±1.25 | 1.80±2.05 |
| OGTT 0-h,
mg/dl | 75.25±7.21 |
92.87±13.49b |
99.70±13.30b |
| OGTT 1-h,
mg/dl | 115.17±19.86 |
185.70±36.23c |
198.80±39.70c |
| OGTT 2-h,
mg/dl | 81.81±23.32 |
150.34±29.43c |
168.98±36.84c |
| Creatinine,
mg/dl | 0.45±0.14 | 0.47±0.08 | 0.47±0.08 |
| Cholesterol,
mg/dl | 253.73±43.9 | 239.28±41.90 | 271.77±17.85 |
| High-density
lipoprotein cholesterol, mg/dl | 75.83±23.67 | 72.08±18.27 | 77.90±17.95 |
| Triglycerides,
mg/dl | 146.29±29.10 |
237.2±74.36a | 207.66±84.97 |
| Uric acid,
mg/dl | 3.26±0.75 | 3.57±1.04 | 4.57±2.18 |
| Glycated
haemoglobin, % | 5.2±0.17 | 5.49±0.41 | 5.42±0.37 |
| Hemoglobin,
g/dl | 11.13±0.82 | 11.12±1.02 | 10.7±0.66 |
| Alanine
aminotransferase, Ui/l | 28.85±34.23 | 16.88±13.03 | 12.84±11.89 |
| Aspartate
aminotransferase, Ui/l | 19.49±9.63 | 16.07±6.80 | 13.13±3.07 |
It was observed that patient age, a well-known risk
factor for GDM development (3),
was significantly higher in the GDM-N (1.21-fold; P<0.001) and
in the GDM-M (P<0.05; 1.23-fold) groups compared with that in
the GC group. In addition, GDM-M women had higher BMI at
gestational age at diagnosis (1.17-fold) compared with that in the
GC group (P<0.05).
Diabetes was confirmed by OGTT, for which both the
GDM-N and GDM-N groups were exhibiting significantly higher levels
compared with those in the GC group at 0, 1 and 2 h (P<0.01)
(Table I). The serum Tg levels
were also higher in the GDM-N group (1.62-fold; P≤0.05) compared
with those in the GC group. However, GDM did not significantly
alter the gestational age at delivery, parity or serum levels of
creatinine, cholesterol, HDL, uric acid, HbA1c, haemoglobin, ALT or
AST.
Adverse outcomes induced by GDM
The adverse outcomes induced by GDM, despite the
diet introduced during the third trimester of pregnancy, were
analysed to achieve optimal glucose levels (Table II).
| Table IIPregnancy outcomes of patients with
GDM included in the present study. |
Table II
Pregnancy outcomes of patients with
GDM included in the present study.
| A, Child |
|---|
| Outcomes | GDM-N (n=23), N
(%) | GDM-M (n=5), N
(%) | P-value |
|---|
| Birth weight | | | |
|
Infants
<4,000 g | 23(100) | 0 (0) | 0.0001 |
|
Infants
>4,000 g | 0 (0) | 5(100) | |
| Neonatal
hypoglycaemia | 1 (4.34) | 1(20) | 0.07 |
| Jaundice | 2 (8.69) | 0 (0) | 0.2560 |
| Apgar score | | | |
|
≤8 | 4 (17.39) | 1(20) | 0.24 |
|
>8 | 19 (82.6) | 4(80) | |
| B, Mother |
| Outcomes | GDM-N (n=23), N
(%) | GDM-M (n=5), N
(%) | P-value |
| Hypertension in
pregnancy | 3 (13.04) | 0 (0) | 0.33 |
| Edema | 2 (8.69) | 1(20) | 0.24 |
| Delivery | | | |
|
Natural | 7 (30.43) | 0 (0) | 0.08 |
|
Caesarean
section | 16 (69.56) | 5(100) | |
There were five offspring weighing >4,000 g
(macrosomia) born from women with a controlled diet regulating the
serum blood glucose levels during pregnancy. There were no
significant differences in terms of neonatal hypoglycaemia,
jaundice, Apgar score, hypertension, edema or the type of delivery
(natural or Caesarean section) between the GDM-N and GDM-M
groups.
Altered β-cell homeostasis is an
essential component in the pathogenesis of GDM
The primary function of β-cells is to produce and
release insulin. Based on fasting insulin and glucose serum
concentrations, HOMA%B, HOMA%S and HOMA-IR were calculated
(Fig. 2A-D).
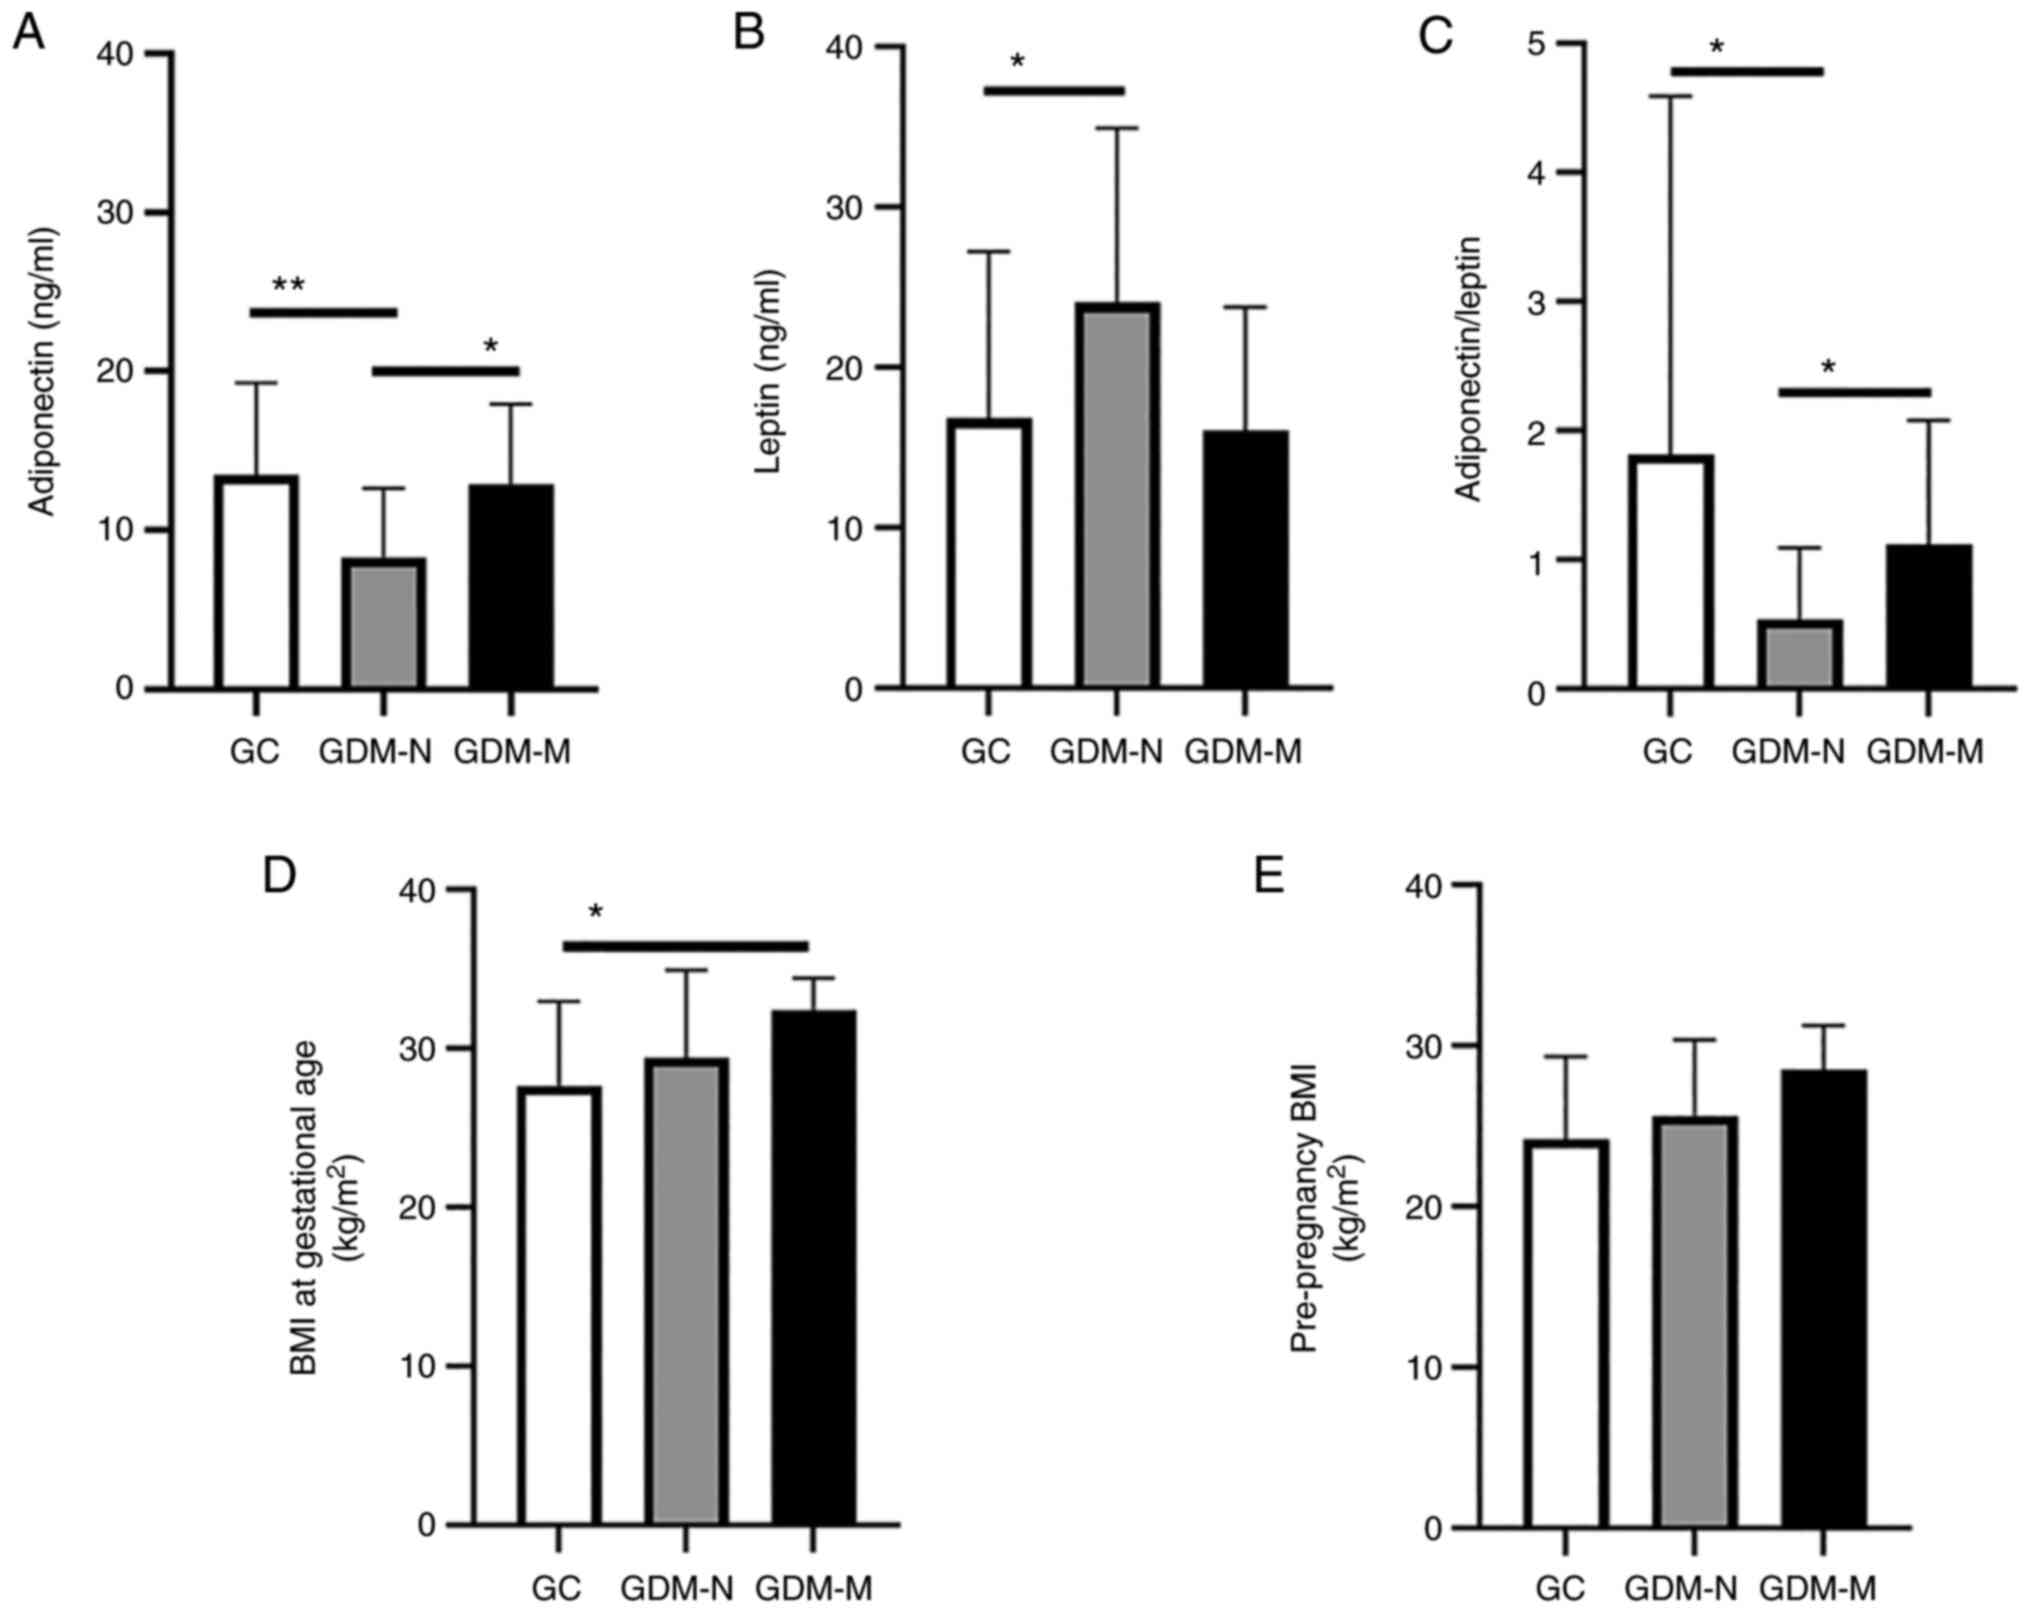
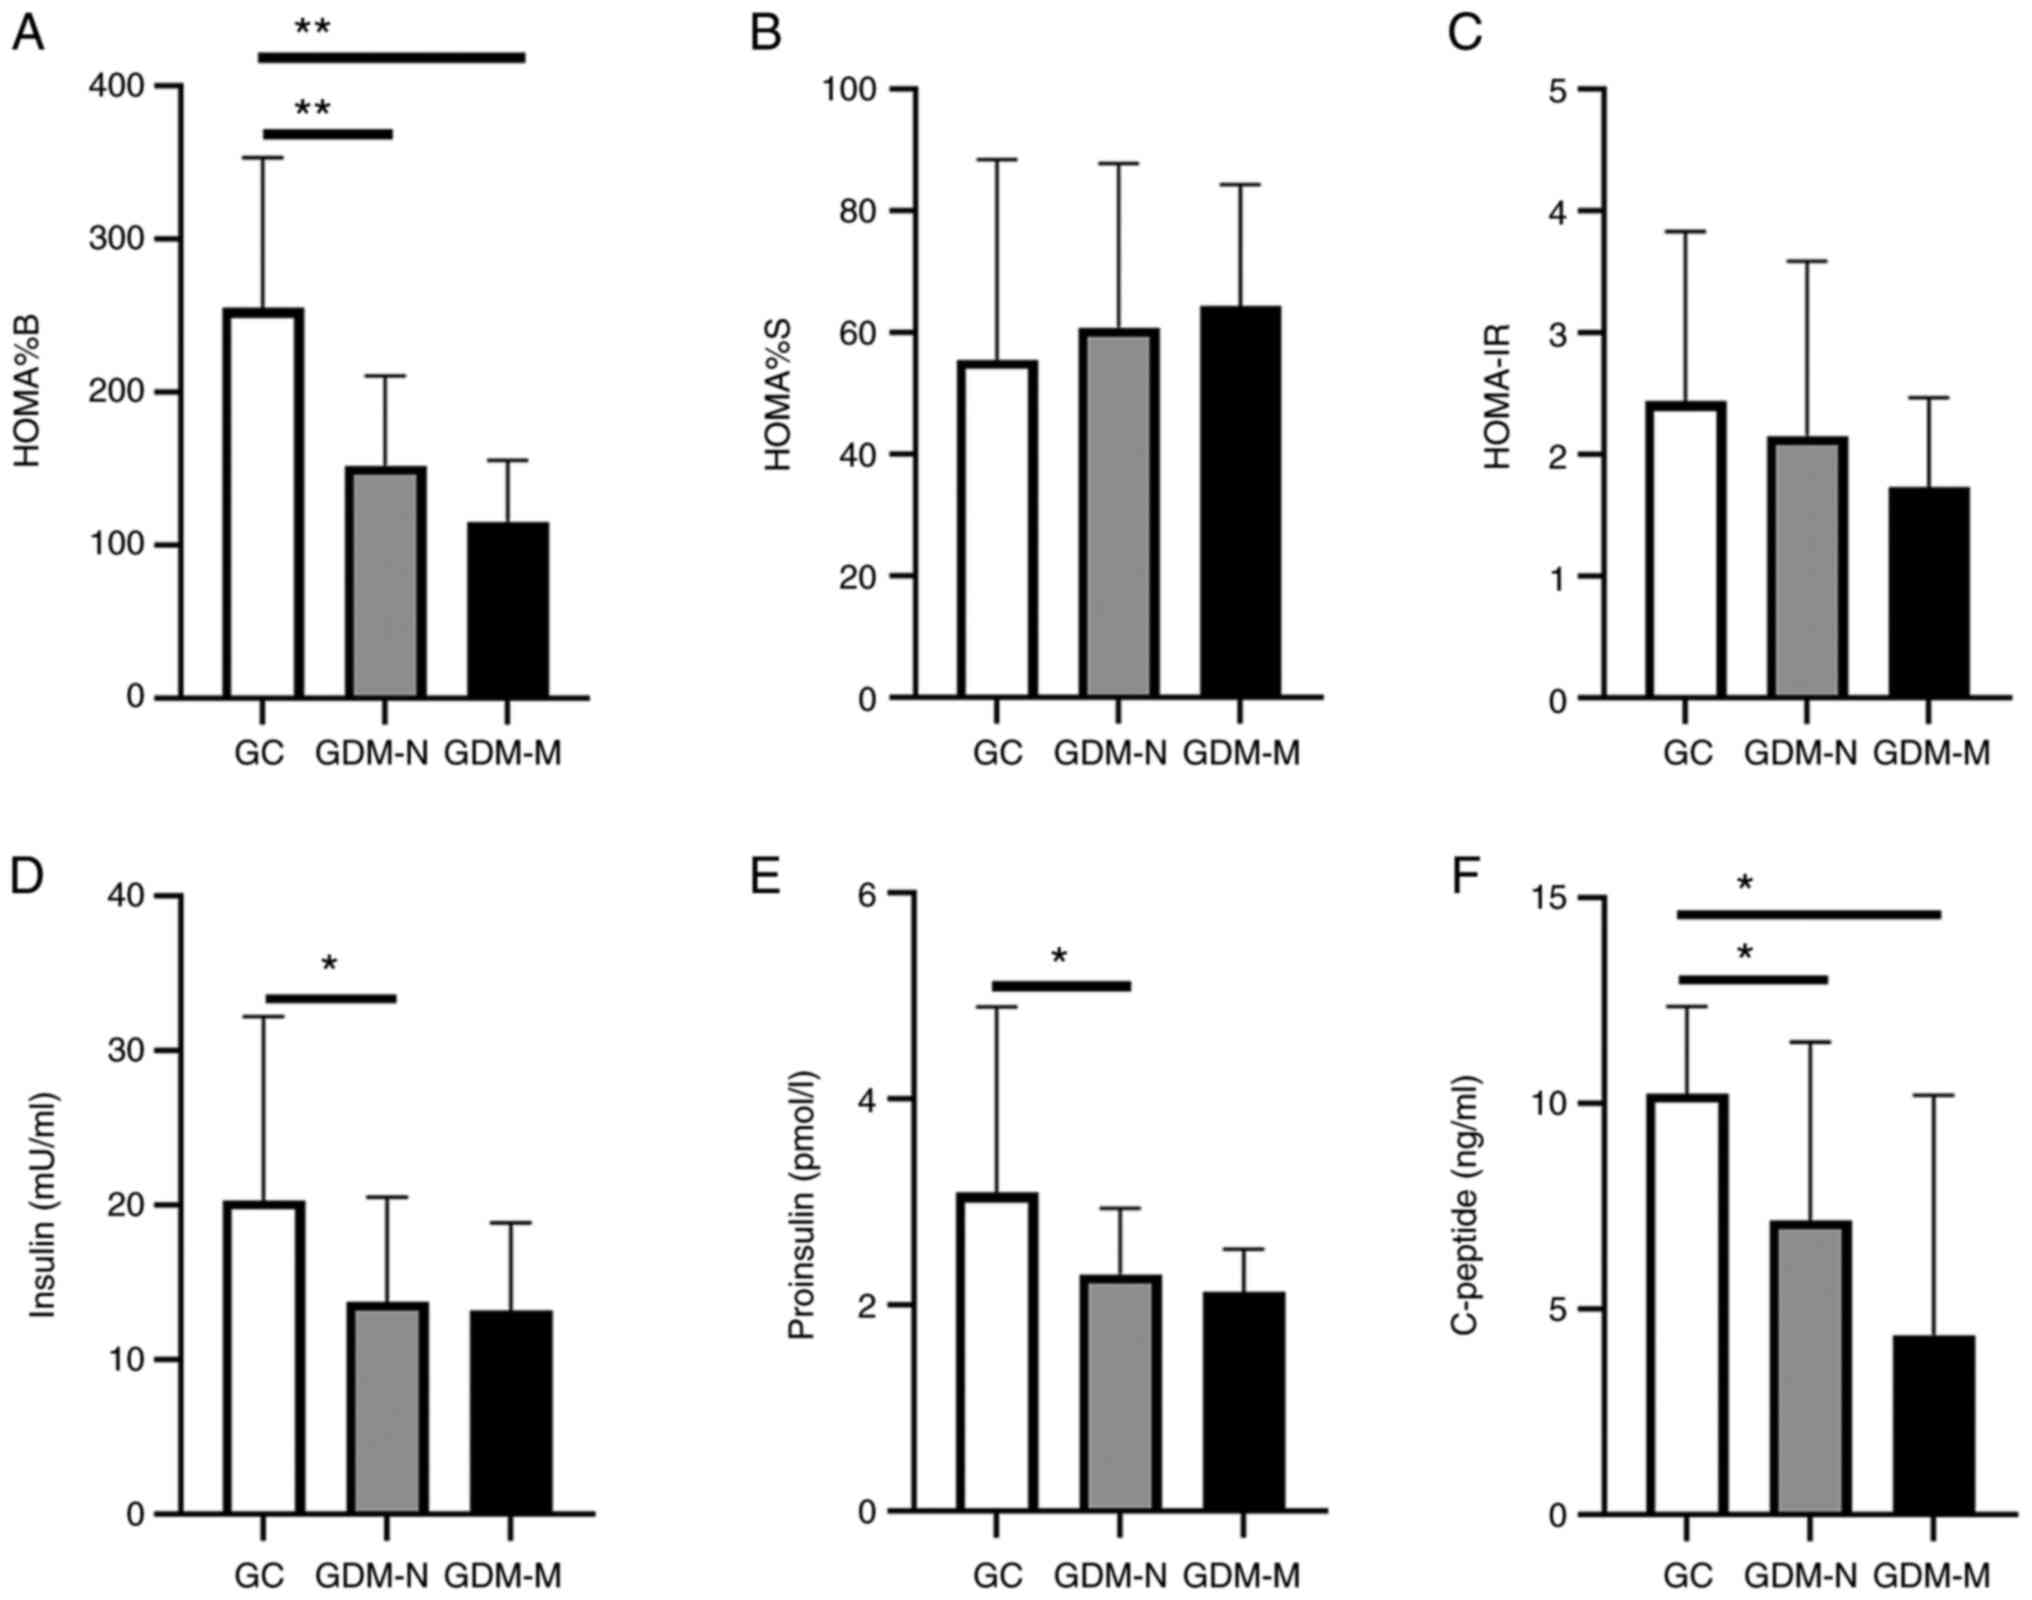 | Figure 2Altered β-cell homeostasis during the
third pregnancy trimester. Histograms showing (A) steady state
β-cell function, (B) insulin sensitivity, (C) homeostatic model
assessment of insulin resistance calculated from serum level of
fasting glucose. (D) Insulin, (E) proinsulin and (F) C-peptide
levels were measured in serum collected at the third trimester of
pregnancy from the GC, GDM-N and GDM-M groups. Data represent the
means ± standard deviation; *P<0.05 and
**P<0.01. HOMA%B, steady-state β-cell function;
HOMA%S, insulin sensitivity; HOMA-IR, homeostatic model assessment
of insulin resistance; GC, gestational healthy control group; GDM,
gestational diabetes mellitus; GDM-N, GDM group with normal
offspring; GDM-M, GDM group with macrosomia. |
In the GDM-N group, a significant decrease in HOMA%B
(1.67-fold; P<0.01), serum insulin (1.47-fold; P<0.05),
proinsulin (1.34-fold; P<0.05) and C-peptide (1.43-fold;
P<0.05) were observed compared with those in the GC group
(Fig. 2A and D-F).
Pancreatic dysfunction was verified by the observed
decrease in HOMA%B (2.2-fold; P<0.01) and in serum C-peptide
concentration (2.34-fold; P<0.05) in the GDM-M group compared
with that in the GC group (Fig. 2A
and F). The insulin and proinsulin
levels did not show a significant difference between the patients
with GDM-M and those in the GC group (Fig. 2D and E). In addition, no significant
differences in HOMA%S and HOMA-IR were observed between the GDM-M
and GDM-N groups (Fig. 2B and
C). Serum concentrations of
insulin, proinsulin, C-peptide, the HOMA%B, HOMA%S and HOMA-IR also
did not show a significant difference between the GDM-M and GDM-N
groups.
Insulin resistance is an important
component of GDM
Insulin resistance in gestational diabetes can also
be caused by the alterations in hormones produced during pregnancy,
such as adiponectin and leptin, which can render the secreted
insulin less effective (10).
Serum collected from patients in the GDM-N group
presented a significantly decreased level of adiponectin
(1.62-fold; P<0.01) and a significantly increased level of
leptin (1.42-fold; P<0.05) compared with those in the GC group
(Fig. 3A and B). This meant that the GDM-N group
exhibited a significantly decreased ratio of adiponectin/leptin
(3.34-fold; P<0.05) compared with that in GC (Fig. 3C). However, in the GDM-M group the
change in the calculated ratio is not statistically significant
compared with the GC group. In addition, the GDM-M group showed a
significantly increase in the adiponectin level (1.55-fold;
P<0.05) and a significantly increased ratio of
adiponectin/leptin (2.01-fold; P<0.05) compared with those in
the GDM-N group (Fig. 3A and
C).
The patients with GDM-M, specifically in their third
trimester of pregnancy when GDM was diagnosed, had a mean BMI at
gestational age of 32±2 kg/m2 (Fig. 3D), which was 1.17-fold higher
compared with that of GC (P<0.05). By contrast, there was no
difference in the pre-pregnancy BMI between the GDM-M and GDM-N
groups (Fig. 3E).
Correlation between clinical and
paraclinical characteristic of GDM patients
The Pearson R statistical test and Pearson
correlation matrices were used to measure the strength of the
correlation between the different parameters of women with GDM-N
(Fig. 4A). In addition,
correlation matrices between the clinical and paraclinical
parameters in women with GDM who have given birth to children with
macrosomia (birth weight of child >4,000 g) were shown, which
were compared with GDM-N (Fig. 4A
and B).
 | Figure 4Graphical representation of the
Pearson correlation analyses in GDM groups. Correlation matrix
plots were presented with Pearson correlation coefficients and
significance levels between all clinical and paraclinical
parameters measured in women from (A) GDM group with normal
offspring (GDM-N) and (B) GDM group with macrosomia (GDM-M). The
intensity of ted and blue colours represent the strength of
positive (r>0.4) and negative (r<-0.4) correlations between
any two parameters tested. Characteristics included in this Pearson
correlation analysis were: Insulin sensitivity; β-cell function;
serum levels of insulin, C-Peptide, proinsulin, adiponectin and
leptin; pre-pregnancy BMI; mother age; gestational age; gestational
age at delivery; parity (number of gestations); birth weight of the
previous child; oral glucose tolerance test at 0, 1 and 2 h; serum
levels of creatinine, cholesterol, high-density lipoprotein,
triglycerides, glycated haemoglobin, haemoglobin, alanine
aminotransferase and aspartate aminotransferase in the third
trimester; maternal weight gain and birth weight of the current
child. *P<0.05, **P<0.01 and
***P<0.001. HOMA%B, steady state β-cell function;
HOMA%S, insulin sensitivity; HOMA-IR, homeostatic model assessment
of insulin resistance; OGTT, oral glucose tolerance test; BMI, body
mass index; OGTT, oral glucose tolerance test; ALT, alanine
aminotransferase; AST, aspartate aminotransferase; HDL, high
density lipoprotein cholesterol; Tg, triglycerides; HbA1c, glycated
haemoglobin; GDM, gestational diabetes mellitus. |
In the entire GDM-N and GDM-M groups, several
significant Pearson's correlations were identified between the
principal factors involved in the pathophysiology of GDM. The
following factors are associated with β-cell dysfunction in GDM:
HOMA%B; HOMA%S; HOMA-IR; insulin; proinsulin; and C-peptide serum
levels.
In GDM-N, there was a significant correlation
between HOMA%B and HOMA%S (r=-0.73; P<0.001), HOMA-IR (r=0.78;
P<0.001), insulin (r=0.73; P<0.001), leptin (r=-0.435;
P<0.05) and pre-pregnancy BMI (r=0.371; P=0.04). By contrast,
HOMA%B in the GDM-M group presented a strong correlation with
pre-pregnancy BMI (r=0.95; P<0.05) and specifically for this
group, with maternal weight gain (r=0.94; P<0.03) and
adiponectin (r=-0.96; P<0.01).
It was observed that HOMA%S presented a correlation
with HOMA%B (r=-0.73; P<0.001), creatinine (r=0.43; P<0.05),
pre-pregnancy BMI (r=-0.40; P<0.05) and C-peptide (r=-0.36;
P<0.05) in the GDM-N group. Additionally, the correlations
between HOMA%S and serum levels of HDL (r=0.97; P<0.05), AST
(r=0.87; P<0.05) and pre-pregnancy BMI (r=-0.86; P<0.05) are
specific to GDM-M.
The present study found that in the GDM-N group the
calculated HOMA-IR was significantly correlated with HOMA%B
(r=0.78; P<0.001), pre-pregnancy BMI (r=0.57; P<0.01) and
serum creatinine levels (r=-0.46; P<0.05). By contrast, in the
GDM-M group, HOMA-IR was not correlated with HOMA%B or creatinine
concentration, but was strongly correlated (P<0.05) with serum
levels of HDL (r=-0.96), Tg (r=0.89) and gestational age at which
diabetes was diagnosed (r=0.81).
Maternal insulin level was positively correlated
with HOMA%B (r=0.73; P<0.001) and C-peptide (r=0.379; P<0.05)
in the GDM-N group. By contrast, in the GDM-M group a specific and
strong correlation (P<0.05) was found between insulin level with
HDL (r=-0.97) and gestational age at which GDM was diagnosed
(r=0.80).
Additionally, the Pearson analysis showed a positive
correlation (P<0.05) in proinsulin with HbA1c (r=0.76) and
OGTT1h (r=0.42) in GDM-N. Compared with these findings, in GDM-M,
proinsulin levels presented a strong positive correlation with
C-peptide (r=0.95; P< 0.05), with uric acid (r=0.96; P<0.05),
AST (r=0.93; P=0.01), ALT (r=0.91; P<0.05), birth weight of
previous child (r=0.99; P<0.05) and OGTT 2-h (r=0.8;
P<0.05).
The C-peptide serum level in the GDM-N individuals
showed a significant positive correlation with proinsulin (r=0.41;
P=0.01) and haemoglobin (r=0.5; P<0.05). However, in the GDM-M
group, C-peptide serum levels were more strongly correlated with
proinsulin (r=0.95; P=0.01), uric acid (r=0.97; P<0.05), ALT
(r=0. 93; P=0.01) and age mother (r=-0.89; P<0.05).
In pregnancies with GDM, insulin resistance was
associated with HOMA%S, serum levels of adiponectin, leptin and
maternal weight gain (8). In
GDM-N, maternal adiponectin levels were correlated with OGTT 0-h
(r=-0.57; P<0.01), OGTT 1-h (r=-0.42; P<0.05) and AST
(r=0.43; P<0.05). A defining characteristic of GDM-M is the
negative correlation between maternal adiponectin serum level and
HOMA%B (r=-0.96; P<0.001), pre-pregnancy BMI (r=-0.95; P=0.01),
maternal weight gain (r=-0.96; P<0.05) and leptin (r=-0.82;
P<0.05).
Furthermore, in the GDM-N group, there was a
correlation (P<0.05) between serum leptin concentration and
HOMA%B (r=-0.435), OGTT 0-h (r=0.431) and HbA1c (r=0.52). In the
GDM-M group, leptin levels presented both strong negative
correlations (P<0.05) with OGTT 0-h (r=-0.87) and adiponectin
(r=-0.82). In GDM-N, maternal weight gain was correlated
(P<0.05) with the gestational age at which GDM was diagnosed
(r=0.57), AST (r=0.52), birth weight of current child (r=0.46) and
parity (r=-0.45). Unlike the GDM-N group, maternal weight gain in
the GDM-M was correlated specifically and strongly with
pre-pregnancy BMI (r=0.98; P=0.01), maternal adiponectin serum
level (r=-0.96; P<0.05) and HOMA%B (r=0.94; P<0.05).
Discussion
During pregnancy, maternal metabolism undergoes
various changes facilitate fetal growth (3). The present study compared the
principal factors involved in the pathophysiology of GDM, namely
β-cell dysfunction and insulin resistance, whilst also examining
their potential impact on the onset of macrosomia in new-borns. The
present study included 36 patients that were followed up from the
third trimester of pregnancy until birth. Risk factors for GDM,
such as advanced maternal age, overweight, obesity, high parity,
previous delivery of a macrosomic infant, are associated with
impaired β-cell function and insulin resistance (3). However, there remains a great deal of
complexity involved in the interaction between β-cell dysfunction
and insulin resistance during GDM.
β-cell function was analysed in patients with GDM by
measuring fasting serum insulin, C-peptide and proinsulin levels,
where their correlations with other anthropometric, clinical and
paraclinical parameters were also analysed.
The data showed that insulin levels decreased in GDM
compare with those in the GC group, but significant difference was
only observed in the GDM-N group. Several studies previously
reported contradictory results regarding the regulation trend of
insulin secretion in GDM when defects in β-cell function are
present (22,23). In comparison with the GC group, the
present study analysed the insulin levels in GDM-M and found no
significant difference but, the GDM-M group revealed a negative
correlation between maternal serum insulin level and HDL level. In
the case of insulin deficiency or peripheral IR, the HDL level
decreases (24). The present study
could not find significant differences in HDL levels in the GC
group compared with those in the GDM-M or GDM-N groups. Other
previous studies have also failed to find any associations between
HDL and macrosomia in GDM pregnancies (24,25).
In addition, information regarding the association of insulin
level, HDL and macrosomia with GDM remain inconsistent. Compared
with the present results, another previous study showed that GDM
group (300 women with gestational diabetes mellitus) resulted in
lower HDL concentrations throughout pregnancy compared with GC
group (1,283 healthy pregnant women) (26). This inconsistency may be due to the
different study populations and sample size. Therefore, there is a
demand for improving the knowledge regarding changes in the
maternal lipid profile in GDM and their association with
macrosomia.
In the present study, C-peptide levels were
decreased in both GDM groups, with significant differences compared
with GC. A previous study showed that in the third trimester of GDM
pregnancy, C-peptide levels were increased until delivery,
suggesting a b cell dysfunction as possible cause of IR (27). However, these authors analysed a
slightly different experimental setting by evaluating changes in
plasma C-peptide levels in patients with GDM, gestational impaired
glucose tolerance and in normal pregnant women (27).
In GDM-N individuals, the C-peptide serum level
correlated positively with proinsulin level. However, in GDM-M
individuals, a strong and positive correlation of C-peptide serum
level with proinsulin and ALT was registered. Over the past decade,
the prevalence of NAFLD during pregnancy has nearly tripled and has
been found to be independently associated with pregnancy and
postpartum complications, such as preeclampsia, disorders, preterm
birth and postpartum haemorrhage (28). This previous study (28) also showed that patients with NAFLD
during pregnancy experienced GDM more frequently. In the general
population, C-peptide was found to be an independent risk factor
for NAFLD and a surrogate marker for monitoring IR during NAFLD
(29). In the present study,
patients with GDM-M had a strong positive correlation between
C-peptide levels and ALT levels, which was not observed in the
GDM-N group. However, a conclusion cannot be drawn because the
present study enrolled patients that were not screened for NAFLD.
Therefore, one of the possible future directions could be
evaluating the relationship between NAFLD, C-peptide levels and ALT
in GDM and the risk of macrosomia.
Proinsulin levels in GDM have been previously
documented, although with contradictory results (5,30).
The present study registered a decrease in maternal serum
proinsulin levels in the GDM-N group and not in the GDM-M group
compared with those in the GC group. However, no significant
difference in the proinsulin levels between GDM and healthy
controls could be found in previous studies, although they did not
divide the GDM group by baby birth weight (30).
Although the bidirectional association between NAFLD
and GDM has been extensively documented (31), the subjects were not screened for
NAFLD or hepatic steatosis in the present study. In GDM-M,
proinsulin levels presented a strong and positive correlation with
ALT and AST levels. Several studies previously reported a
significant correlation between NAFLD and proinsulin
concentrations, where high proinsulin levels can increase the risk
of developing hepatic steatosis (32,33).
These studies concluded with the significant association among
hepatic steatosis, proinsulin and ALT concentration. Existing data
regarding the correlation between birth weight of the child and
liver enzymes are also controversial. A previous study revealed
that elevated ALT levels during the first trimester conferred a
4-fold increase in the risk of giving birth to a child with high
birth weight, but without an explanation (15). However, to the best of our
knowledge, scant data regarding the impact of maternal NAFLD on
macrosomia in GDM exist, such that the association among ALT levels
during third trimester, proinsulin and macrosomia remain
unexplored.
During pregnancy, alterations in glucose metabolism
induce IR, which progressively accentuates in parallel with
gestation (5). This form of IR is
influenced by several factors, such as adipokines (leptin and
adiponectin), maternal weight gain and pre-pregnancy BMI (5). Adipokines are secreted by the adipose
tissue and are one of the most important regulators of
neurohormonal metabolism (34,35).
In the GDM-N group, adiponectin levels were decreased compared with
those in the GC group. In GDM-N, maternal adiponectin levels in the
third trimester of pregnancy were positively correlated with AST
levels whilst being negatively correlated with OGTT 0-h and 1-h. By
contrast, in the GDM-M group adiponectin level increased compared
with that in the GDM-N group, to that comparable to the GC group.
In addition, adiponectin levels presented strong negative
correlations with HOMA%B, leptin, pre-pregnancy BMI and maternal
weight gain. Consistent with the present study, previous studies
(36,37) showed that maternal adiponectin
levels between 24 and 31 weeks of gestation in women with GDM were
significantly lower compared with those in the control group.
The liver is a major site of insulin action and
clearance, serving an important role in maintaining glucose and
insulin homeostasis (38).
Therefore, it is predisposed to IR-induced injury and other
metabolic diseases (38). Liver
enzymes ALT and AST are associated with different cardiometabolic
diseases, including type 2 diabetes (39-41).
Therefore, their levels are useful and cost-effective tools for the
routine diagnosis of liver diseases. However, data on the effects
of pregnancy on serum ALT and AST levels are contradictory. The
present study found that ALT and AST levels decreased
non-significantly in both of the GDM groups examined. In several
previous studies, serum ALT and AST values did not change during
pregnancy or remain within the normal range compared with women who
are not pregnant (38,42). A previous report analysing the
association between GDM and the ratio of ALT/AST showed that
ALT/AST was higher in the GDM group compared with that in the
control group (43). The
relationship between transaminases and macrosomia has also been
analysed previously, where a positive correlation between infant
birth weight and ALT levels in macrosomic babies has been observed
(44). This study showed that
asymptomatically elevated ALT values measured during the first
trimester can be used to predict a macrosomia foetus. To the best
of our knowledge, the present study is the first to analyse the
differences in transaminase levels during the third trimester of
pregnancy in GDM.
Adiponectin serum level is also known to predict
type 2 diabetes (9). The
association between liver markers and adiponectin has been reported
and investigated in previous studies. To the best of our knowledge,
there are no published data regarding the correlation between
adiponectin and AST levels in GDM. Studies have been performed
either on non-pregnant subjects or on male subjects, which showed a
negative correlation between ALT and adiponectin levels (45,46).
In another previous study, which analysed serum adiponectin levels
and enzyme markers of liver dysfunction in both type 2 diabetic and
non-diabetic Caribbean non-pregnant women, it did not identify any
significant correlation between adiponectin and ALT in either group
of patients (22). In the present
analysis, only in the GDM-N group did the adiponectin levels in the
third trimester correlate positively with AST, whilst maternal
serum levels of AST and ALT were not modified by the GDM status
with or without macrosomia. Future studies are necessary to
elucidate this relationship.
Leptin is a satiety signal protein and regulates
energy balance (11). If target
organs are resistant to leptin's effects, which occurs during
diabetes, leptin would be secreted in excess. Increased leptin
levels are also associated with high BMI and IR (11). The present results are generally
consistent with other previous studies that also assessed maternal
plasma leptin concentrations in pregnancies complicated with GDM in
the GDM-N (47,48). Previously, maternal serum leptin
levels in women with GDM have been shown to be significantly higher
compared with those in women with uncomplicated pregnancies
(47). The present study observed
that the gestational diabetes status in the GDM-N group resulted in
a decreased ratio of adiponectin/leptin by 2.82-fold compared with
that in the GC group, consistent with results from another similar
study (48).
The association between leptin levels and fasting
plasma glucose has been analysed in several studies that enrolled
either diabetic non-pregnant female subjects or pregnant women with
GDM (11,44,47,49).
In the present study, GDM-N showed a positive correlation between
leptin levels and OGTT 0-h, whilst in the GDM-M group this
correlation was negative. Vitoratos et al (47) previously investigated the changes
in leptin levels and their relationship with plasma glucose in
pregnant women with gestational-onset diabetes at 29 and 33 weeks
of gestation. They identified a positive correlation between
maternal leptin concentrations and OGTT 1-h in women with GDM
(47). By contrast, another
previous study found a positive correlation between leptin levels
and OGTT 0-h in patients with GDM (49). Future studies are necessary to
explain these differences. The relationship between serum leptin
level and risk of macrosomia was also previously analysed, where a
statistically significant correlation between plasma leptin levels
and birth child weight was found (44). In addition, this previous study
suggested that leptin levels are strongly associated with the level
of body fat tissue in the macrosomic offspring (44). To the best of our knowledge, no
correlation analysis among maternal leptin levels, OGTT 0-h, OGTT
1-h and macrosomia have been performed, which is warranted.
The present study found that in the GDM-N group
maternal weight gain was negatively correlated with parity whilst
being positively correlated with AST and child birth weight. By
contrast, in the GDM-M group, maternal weight gain presented strong
positive correlations with HOMA%B, pre-pregnancy BMI but negative
correlation with adiponectin. Existing data are contradictory
regarding the influence of maternal weight gain on birth child
weight in GDM, were no correlation was found regardless of the
pre-pregnancy BMI of the mother with GDM (50,51).
It was suggested that the increased IR underlying GDM deviates the
substances from maternal to fetal circulations, where the excessive
supply of nutrients in women with diabetes decreases the influence
of maternal weight gain on birth weight (50). In the present study, correlation
between maternal weight gain and child birth weight could not be
found in the GDM-N group, whilst a strong positive correlation was
found between these two parameters in the GDM-M group. The present
result concurs with a previous systematic review and meta-analysis
of the association between pre-pregnancy body mass index and
gestational weight gain on the perinatal outcomes in GDM subjects,
which showed that excessive maternal weight gain increases the
incidence of infant macrosomia (51). Compared with the present study,
which enrolled only nulliparous women complicated with GDM, it also
enrolled multiparous women. Data regarding the role of parity in
gestational weight gain is less clear, because both positive and
negative relationships have been reported in previous studies
(52,53). The present analysis found that only
in the GDM-N group did the maternal weight gain correlate
negatively with parity. By contrast, Harris et al (53) reported that parity is independently
associated with maternal BMI and gestational weight gain.
In the present study, a positive correlation between
maternal weight gain and AST was observed in the GDM-N group.
During normal pregnancy, compared with their non-pregnant
counterparts, ALT levels decrease whereas AST levels remain
unchanged (54). In both GDM
groups, AST and ALT levels remained unchanged when compared with
GC. Understanding the correlation between AST and ALT levels during
GDM pregnancy and modifiable factors, such as maternal weight gain,
may facilitate the early recognition, diagnosis and prevention of
impaired liver function in GDM. In addition, pregnancy
complications that affect liver transaminases, such as
preeclampsia, can also be recognised more easily. Further studies
are necessary to elucidate the mechanism underlying maternal weight
gain, GDM, liver enzymes and macrosomia. To the best of our
knowledge, no studies have previously analysed the correlation
between AST during the third trimester of GDM pregnancy and
maternal weight gain, or differences between pregnancies with and
without macrosomia.
HOMA-IR is a simplified measure of IR and is
strongly associated with BMI (55,56).
In the present study, in the GDM-N group, calculated HOMA-IR
correlated positively with pre-pregnancy BMI. The results of the
present analysis agree with the results from Lin et al
(55), which showed in a
retrospective study on 710 women diagnosed with GDM, that greater
pre-pregnancy BMI values were associated with a higher risk of IR
during the second trimester (56).
In another prospective study, VanWiden et al (57) previously analysed the use of
HOMA-IR measurements in pregnancies with and without GDM as an
indicator of the degree of IR and as a potential tool for
evaluating the improvement of insulin sensitivity after therapeutic
interventions. They showed that HOMA-IR was significantly greater
in the GDM group compared with that in non-GDM healthy controls. In
comparison with this previous study, the present study divided the
GDM group into subgroups with or without macrosomia, but did not
find any significant differences in HOMA-IR levels between GC and
GDM groups. It is known that HOMA-IR is an indicator of liver IR
that can also be used to reflect the relationship between the liver
and pancreas (58). In addition,
it is also an indicator of insulin sensitivity that occurs in
pregnancy (55). The present
analysis found that HOMA-IR positively correlated with Tg levels
but negatively with HDL only in the GDM-M group. Over the last
decade, the relationship between lipid metabolism and IR has been
the objective of various studies (24-26).
Although IR and the levels of lipid parameters change during GDM,
this correlation hasn't been elucidated. The present results are
consistent with another study, where Tg was found to be associated
with IR in GDM during the second trimester of pregnancy (56), since the present analysis found
this correlation, but only in the GDM-M group. Another previous
study analysed the relationship between IR and various risk factors
for atherosclerosis in a large group of male and women subjects,
which found similar results (59).
However, the mechanisms beyond these correlations remains
unclear.
In conclusion, the present study adds to the current
knowledge of the associations among factors involved in the
physiology of GDM and macrosomia, which highlights novel
correlations that could aid future studies to elucidate the
mechanism underlying this pathology. In addition, it found
different correlations of transaminases and lipid profiles with
markers of IR or β-cell dysfunction in both of the GDM groups
tested. However, further studies are warranted to establish their
involvement in the evolution to macrosomia in GDM. The present
analysis has drawn future directions to evaluate the relationship
between NAFLD, C-peptide, proinsulin levels and transaminases in
GDM and the risk of macrosomia.
Acknowledgements
Not applicable.
Funding
Funding: The present study was supported by the Romanian Academy
PhD fellowship and grants from the Ministry of Research, Innovation
and Digitization (grant nos. CNCS-UEFISCDI,
PN-III-P1-1.1-TE-2021-1161 and PN-III-P4-PCE-2021-1344 within PNCDI
III).
Availability of data and materials
The datasets used and/or analysed during the current
study are available from the corresponding author on reasonable
request.
Authors' contributions
EGB and EU have equal contribution in performing the
analysis of the data. FA designed the experiments, data acquisition
and interpretation. EGB, DAM and IC confirm the authenticity of all
the raw data. DAM and IC contributed to the enrolment of patients,
collection of the biological samples and data acquisition. EGB, EU,
VIS, LI and CIT performed analysis and interpretation of data. VIS,
LI and CIT helped in the revision of the manuscript. All authors
read and approved the final version of the manuscript.
Ethics approval and consent to
participate
The present study was approved by the Ethics
Committee of the ‘N. Paulescu’ National Institute of Diabetes,
Nutrition and Metabolic Diseases, Bucharest, Romania (approval no.
1680/01.11.2017). Each patient involved in the study signed the
written informed consent form as specified in the Declaration of
Helsinki and agreed to the use of their samples for scientific
research.
Patient consent for publication
Not applicable.
Competing interests
The authors declare that they have no competing
interests.
References
|
1
|
American Diabetes Association Professional
Practice Committee. Draznin B, Aroda VR, Bakris G, Benson G, Brown
FM, Freeman R, Green J, Huang E, Isaacs D, et al: 15. Management of
diabetes in pregnancy: Standards of medical care in diabetes-2022.
Diabetes Care. 45 (Suppl 1):S232–S243. 2022.PubMed/NCBI View Article : Google Scholar
|
|
2
|
Cho NH, Shaw JE, Karuranga S, Huang Y, da
Rocha Fernandes JD, Ohlrogge AW and Malanda B: IDF diabetes atlas:
Global estimates of diabetes prevalence for 2017 and projections
for 2045. Diabetes Res Clin Pract. 138:271–281. 2018.PubMed/NCBI View Article : Google Scholar
|
|
3
|
Buchanan TA, Xiang AH and Page KA:
Gestational diabetes mellitus: Risks and management during and
after pregnancy. Nat Rev Endocrinol. 8:639–649. 2012.PubMed/NCBI View Article : Google Scholar
|
|
4
|
Catalano PM: Trying to understand
gestational diabetes. Diabet Med. 31:273–281. 2014.PubMed/NCBI View Article : Google Scholar
|
|
5
|
Van Assche FA, Aerts L and De Prins F: A
morphological study of the endocrine pancreas in human pregnancy.
Br J Obstet Gynaecol. 85:818–820. 1978.PubMed/NCBI View Article : Google Scholar
|
|
6
|
Plows JF, Stanley JL, Baker PN, Reynolds
CM and Vickers MH: The pathophysiology of gestational diabetes
mellitus. Int J Mol Sci. 19(3342)2018.PubMed/NCBI View Article : Google Scholar
|
|
7
|
Barbour LA, McCurdy CE, Hernandez TL,
Kirwan JP, Catalano PM and Friedman JE: Cellular mechanisms for
insulin resistance in normal pregnancy and gestational diabetes.
Diabetes Care. 30 (Suppl 2):S112–S119. 2007.PubMed/NCBI View Article : Google Scholar
|
|
8
|
Paganoti CF, da Costa RA, Oliveira AMDSS,
Hoshida MS and Francisco RPV: Adiponectin does not improve the
prediction of insulin need in pregnant women with gestational
diabetes mellitus. Endocrine and Metabolic Science.
3(100095)2021.
|
|
9
|
Lihn AS, Pedersen SB and Richelsen B:
Adiponectin: Action, regulation and association to insulin
sensitivity. Obes Rev. 6:13–21. 2005.PubMed/NCBI View Article : Google Scholar
|
|
10
|
Zavalza-Gómez AB, Anaya-Prado R,
Rincón-Sánchez AR and Mora-Martínez JM: Adipokines and insulin
resistance during pregnancy. Diabetes Res Clin Pract. 80:8–15.
2008.PubMed/NCBI View Article : Google Scholar
|
|
11
|
Powe CE, Allard C, Battista MC, Doyon M,
Bouchard L, Ecker JL, Perron P, Florez JC, Thadhani R and Hivert
MF: Heterogeneous contribution of insulin sensitivity and secretion
defects to gestational diabetes mellitus. Diabetes Care.
39:1052–1055. 2016.PubMed/NCBI View Article : Google Scholar
|
|
12
|
Iikuni N, Lam QL, Lu L, Matarese G and La
Cava A: Leptin and inflammation. Curr Immunol Rev. 4:70–79.
2008.PubMed/NCBI View Article : Google Scholar
|
|
13
|
Kc K, Shakya S and Zhang H: Gestational
diabetes mellitus and macrosomia: A literature review. Ann Nutr
Metab. 66 (Suppl 2):S14–S20. 2015.PubMed/NCBI View Article : Google Scholar
|
|
14
|
Herath RP, Siriwardana SR, Ekanayake CD,
Abeysekara V, Kodithuwakku SUA and Herath HP: Non-alcoholic fatty
liver disease and pregnancy complications among Sri Lankan women: A
cross sectional analytical study. PLoS One.
14(e0215326)2019.PubMed/NCBI View Article : Google Scholar
|
|
15
|
Yarrington CD, Cantonwine DE, Seely EW,
McElrath TF and Zera CA: The association of early unexplained
elevated alanine aminotransferase with large-for-gestational-age
birthweight. Am J Obstet Gynecol. 215:e471–e475. 2016.PubMed/NCBI View Article : Google Scholar
|
|
16
|
Crowther CA, Hiller JE, Moss JR, McPhee
AJ, Jeffries WS and Robinson JS: Effect of treatment of gestational
diabetes mellitus on pregnancy outcomes. N Engl J Med.
352:2477–2486. 2005.PubMed/NCBI View Article : Google Scholar
|
|
17
|
Hoegsberg B, Gruppuso PA and Coustan DR:
Hyperinsulinemia in macrosomic infants of nondiabetic mothers.
Diabetes Care. 16:32–36. 1993.PubMed/NCBI View Article : Google Scholar
|
|
18
|
Institute of Medicine (US) and National
Research Council (US) Committee to Reexamine IOM Pregnancy Weight
Guidelines: Weight gain during pregnancy: Reexamining the
guidelines. Rasmussen KM and Yaktine AL (eds). National Academies
Press (US), Washington, DC, 2009.
|
|
19
|
APGAR V: A proposal for a new method of
evaluation of the newborn infant. Curr Res Anesth Analg.
32:260–267. 1953.PubMed/NCBI
|
|
20
|
National Institute for Health and Care
Excellence: Guidelines. National Institute for Health and Care
Excellence (NICE), London, 2003.
|
|
21
|
Wallace TM, Levy JC and Matthews DR: Use
and abuse of HOMA modelling. Diabetes Care. 27:1487–1495.
2004.PubMed/NCBI View Article : Google Scholar
|
|
22
|
Ezenwaka CE, Kalloo R, Uhlig M, Schwenk R
and Eckel J: Serum adiponectin levels and enzyme markers of liver
dysfunction in diabetic and non-diabetic caribbean subjects. Br J
Biomed Sci. 63:117–122. 2006.PubMed/NCBI View Article : Google Scholar
|
|
23
|
Antwi J, Proulx W, Sullivan S, Lavin R and
Bellavia M: Serum Leptin is associated with fasting plasma glucose
and serum insulin levels independent of PI in Haitian Americans
with type 2 diabetes. FASEB J. 32(670.9)2018.
|
|
24
|
Jin WY, Lin SL, Hou RL, Chen XY, Han T,
Jin Y, Tang L, Zhu ZW and Zhao ZY: Associations between maternal
lipid profile and pregnancy complications and perinatal outcomes: A
population-based study from China. BMC Pregnancy Childbirth.
16(60)2016.PubMed/NCBI View Article : Google Scholar
|
|
25
|
Retnakaran R, Ye C, Hanley AJ, Connelly
PW, Sermer M, Zinman B and Hamilton JK: Effect of maternal weight,
adipokines, glucose intolerance and lipids on infant birth weight
among women without gestational diabetes mellitus. CMAJ.
184:1353–1360. 2012.PubMed/NCBI View Article : Google Scholar
|
|
26
|
Wang J, Li Z and Lin L: Maternal lipid
profiles in women with and without gestational diabetes mellitus.
Medicine (Baltimore). 98(e15320)2019.PubMed/NCBI View Article : Google Scholar
|
|
27
|
Liu D, Wu L and Gao X: Changes of insulin
and C-peptide in pregnancy of gestational diabetes mellitus.
Zhonghua Fu Chan Ke Za Zhi. 34:717–719. 1999.PubMed/NCBI(In Chinese).
|
|
28
|
Sarkar M, Grab J, Dodge JL, Gunderson EP,
Rubin J, Irani RA, Cedars M and Terrault N: Non-alcoholic fatty
liver disease in pregnancy is associated with adverse maternal and
perinatal outcomes. J Hepatol. 73:516–522. 2020.PubMed/NCBI View Article : Google Scholar
|
|
29
|
Atsawarungruangkit A, Chenbhanich J and
Dickstein C: C-peptide as a key risk factor for non-alcoholic fatty
liver disease in the United States population. World J
Gastroenterol. 24:3663–3670. 2018.PubMed/NCBI View Article : Google Scholar
|
|
30
|
Festa A, Shnawa N, Schernthaner G and
Haffner SM: Proinsulin in pregnant women with normal glucose
tolerance or mild gestational diabetes mellitus. Exp Clin
Endocrinol Diabetes. 107:447–452. 1999.PubMed/NCBI View Article : Google Scholar
|
|
31
|
Ardigo D, Numeroso F, Valtuena S, Franzini
L, Piatti PM, Monti L, Delsignore R, Reaven GM and Zavaroni I:
Hyperinsulinemia predicts hepatic fat content in healthy
individuals with normal transaminase concentrations. Metabolism.
54:1566–1570. 2005.PubMed/NCBI View Article : Google Scholar
|
|
32
|
Caballeria L, Pera G, Auladell MA, Toran
P, Munoz L, Miranda D, Aluma A, Casas JD, Sanchez C, Gil D, et al:
Prevalence and factors associated with the presence of nonalcoholic
fatty liver disease in an adult population in Spain. Eur J
Gastroenterol Hepatol. 22:24–32. 2010.PubMed/NCBI View Article : Google Scholar
|
|
33
|
Bajaj S, Nigam P, Luthra A, Pandey RM,
Kondal D, Bhatt SP, Wasir JS and Misra A: A case-control study on
insulin resistance, metabolic co-variates & prediction score in
non-alcoholic fatty liver disease. Indian J Med Res. 129:285–292.
2009.PubMed/NCBI
|
|
34
|
Morton GJ, Cummings DE, Baskin DG, Barsh
GS and Schwartz MW: Central nervous system control of food intake
and body weight. Nature. 443:289–295. 2006.PubMed/NCBI View Article : Google Scholar
|
|
35
|
Thorens B, Guillam MT, Beermann F,
Burcelin R and Jaquet M: Transgenic reexpression of GLUT1 or GLUT2
in pancreatic β cells rescues GLUT2-null mice from early death and
restores normal glucose-stimulated insulin secretion. J Biol Chem.
275:23751–23758. 2000.PubMed/NCBI View Article : Google Scholar
|
|
36
|
Tsai PJ, Yu CH, Hsu SP, Lee YH, Huang IT,
Ho SC and Chu CH: Maternal plasma adiponectin concentrations at 24
to 31 weeks of gestation: Negative association with gestational
diabetes mellitus. Nutrition. 21:1095–1099. 2005.PubMed/NCBI View Article : Google Scholar
|
|
37
|
Cseh K, Baranyi E, Melczer Z, Kaszás E,
Palik E and Winkler G: Plasma adiponectin and pregnancy-induced
insulin resistance. Diabetes Care. 27:274–275. 2004.PubMed/NCBI View Article : Google Scholar
|
|
38
|
Zhu Y, Hedderson MM, Quesenberry CP, Feng
J and Ferrara A: Liver enzymes in early to mid-pregnancy, insulin
resistance, and gestational diabetes risk: A longitudinal analysis.
Front Endocrinol (Lausanne). 9(581)2018.PubMed/NCBI View Article : Google Scholar
|
|
39
|
Fraser A, Harris R, Sattar N, Ebrahim S,
Smith GD and Lawlor DA: Alanine aminotransferase,
gamma-glutamyltransferase and incident diabetes: The british
Women's heart and health study and meta-analysis. Diabetes Care.
32:741–750. 2009.PubMed/NCBI View Article : Google Scholar
|
|
40
|
Ruhl CE and Everhart JE: Elevated serum
alanine aminotransferase and gamma-glutamyltransferase and
mortality in the United States population. Gastroenterology.
136:477–485.e11. 2009.PubMed/NCBI View Article : Google Scholar
|
|
41
|
Kunutsor SK, Apekey TA and Walley J: Liver
aminotransferases and risk of incident type 2 diabetes: a
systematic review and meta-analysis. Am J Epidemiol. 178:159–171.
2013.PubMed/NCBI View Article : Google Scholar
|
|
42
|
Bacq Y: The liver in normal pregnancy. In:
Madame Curie Bioscience Database. Landes Bioscience, Austin, TX,
2000-2013.
|
|
43
|
Song S, Zhang Y, Qiao X, Duo Y, Xu J, Peng
Z, Zhang J, Chen Y, Nie X, Sun Q, et al: ALT/AST as an independent
risk factor of gestational diabetes mellitus compared with
TG/HDL-C. Int J Gen Med. 15:115–121. 2022.PubMed/NCBI View Article : Google Scholar
|
|
44
|
Wiznitzer A, Furman B, Zuili I, Shany S,
Reece EA and Mazor M: Cord leptin level and fetal macrosomia.
Obstet Gynecol. 96:707–713. 2000.PubMed/NCBI View Article : Google Scholar
|
|
45
|
Lee YS, Cho YK, Pae JC, Oh SY, Kang MS,
Park JH, Kim HJ, Park DI, Sohn CI, Jeon WK, et al: The relationship
between serum adiponectin level and serum alanine aminotransferase
elevation in Korean male with nonalcoholic fatty liver disease.
Korean J Hepatol. 12:221–229. 2006.PubMed/NCBI(In Ko).
|
|
46
|
Kazumi T, Kawaguchi A, Hirano T and
Yoshino G: Serum alanine aminotransferase is associated with serum
adiponectin, C-reactive protein and apolipoprotein B in young
healthy men. Horm Metab Res. 38:119–124. 2006.PubMed/NCBI View Article : Google Scholar
|
|
47
|
Vitoratos N, Salamalekis E, Kassanos D,
Loghis C, Panayotopoulos N, Kouskouni E and Creatsas G: Maternal
plasma leptin levels and their relationship to insulin and glucose
in gestational-onset diabetes. Gynecol Obstet Invest. 51:17–21.
2001.PubMed/NCBI View Article : Google Scholar
|
|
48
|
Thagaard IN, Krebs L, Holm JC, Lange T,
Larsen T and Christiansen M: Adiponectin and leptin as first
trimester markers for gestational diabetes mellitus: A cohort
study. Clin Chem Lab Med. 55:1805–1812. 2017.PubMed/NCBI View Article : Google Scholar
|
|
49
|
Kautzky-Willer A, Pacini G, Tura A,
Bieglmayer C, Schneider B, Ludvik B, Prager R and Waldhäusl W:
Increased plasma leptin in gestational diabetes. Diabetologia.
44:164–172. 2001.PubMed/NCBI View Article : Google Scholar
|
|
50
|
Sacks DA: Etiology, detection and
management of fetal macrosomia in pregnancies complicated by
diabetes mellitus. Clin Obstet Gynecol. 50:980–989. 2007.PubMed/NCBI View Article : Google Scholar
|
|
51
|
Miao M, Dai M, Zhang Y, Sun F, Guo X and
Sun G: Influence of maternal overweight, obesity and gestational
weight gain on the perinatal outcomes in women with gestational
diabetes mellitus. Sci Rep. 7(305)2017.PubMed/NCBI View Article : Google Scholar
|
|
52
|
Hill B, Bergmeier H, McPhie S,
Fuller-Tyszkiewicz M, Teede H, Forster D, Spiliotis BE, Hills AP
and Skouteris H: Is parity a risk factor for excessive weight gain
during pregnancy and postpartum weight retention? A systematic
review and meta-analysis. Obes Rev. 18:755–764. 2017.PubMed/NCBI View Article : Google Scholar
|
|
53
|
Harris HE, Ellison GT and Holliday M: Is
there an independent association between parity and maternal weight
gain? Ann Hum Biol. 24:507–519. 1997.PubMed/NCBI View Article : Google Scholar
|
|
54
|
Ushida T, Kotani T, Kinoshita F, Imai K,
Nakano-Kobayashi T, Nakamura N, Moriyama Y, Yoshida S, Yamashita M
and Kajiyama H: Liver transaminase levels during pregnancy: A
Japanese multicenter study. J Matern Fetal Neonatal Med. 28:1–7.
2021.PubMed/NCBI View Article : Google Scholar
|
|
55
|
Lin J, Jin H and Chen L: Associations
between insulin resistance and adverse pregnancy outcomes in women
with gestational diabetes mellitus: A retrospective study. BMC
Pregnancy Childbirth. 21(526)2021.PubMed/NCBI View Article : Google Scholar
|
|
56
|
Catalano PM, Kirwan JP, Haugel-de Mouzon S
and King J: Gestational diabetes and insulin resistance: Role in
short- and long-term implications for mother and fetus. J Nutr. 133
(5 Suppl 2):1674S–1683S. 2003.PubMed/NCBI View Article : Google Scholar
|
|
57
|
VanWiden K, Montoro M, Korst LM and
Ouzounian JG: A homeostatic model assessment of insulin resistance
(HOMA-IR) relates to gestational diabetes, glycemic control. Obstet
Gynecol. 129(112S)2017.
|
|
58
|
Cacho J, Sevillano J, de Castro J, Herrera
E and Ramos MP: Validation of simple indexes to assess insulin
sensitivity during pregnancy in Wistar and Sprague-Dawley rats. Am
J Physiol Endocrinol Metab. 295:1269–1276. 2008.PubMed/NCBI View Article : Google Scholar
|
|
59
|
Knopp RH, Chapman M, Bergelin RO, Wahl PW,
Warth MR and Irvine S: Relationship of lipoprotein lipids to mild
fasting hyperglycemia and diabetes in pregnancy. Diabetes Care.
3:416–420. 1980.PubMed/NCBI View Article : Google Scholar
|