Introduction
Plain radiographs, computed tomography (CT), and
magnetic resonance imaging (MRI) are routinely used in orthopedic
imaging. Although there is some exposure to X-rays, plain
radiographs are frequently used in daily clinical practice because
of their low exposure dose, short time, and simplicity. CT is a
three-dimensional imaging examination of the body's X-ray
permeability and is used for the three-dimensional understanding
and diagnosis of low permeability bone lesions, and although it
involves a certain amount of X-ray exposure, it is used for the
diagnosis of bone lesions and postoperative observation because it
provides detailed three-dimensional information. MRI is an
examination that uses magnetic force to produce three-dimensional
images of information obtained from hydrogen atoms in the body.
Compared to CT, MRI provides detailed qualitative diagnostic
information of soft tissues and is used to diagnose lesions such as
inflammation and tumors. Since there is no exposure to x-rays, MRI
can be used repeatedly and for follow-up (1).
In the field of orthopedic surgery, plain
radiographs are the most commonly used imaging technique because of
their simplicity, but they are two-dimensional images with little
information, and the state of the soft tissues surrounding the
bones cannot be grasped (1). Plain
radiographs and CT have the advantage of superior bone diagnosis,
but have the disadvantage of exposure to X-rays. MRI has the
advantage of being superior in diagnosing periosteal inflammation
and tumors (2), but has the
disadvantage of being inferior to CT in diagnosing the bone itself.
Besides, the disadvantage of MRI is the distortion and potent
artifacts caused by the presence of metal in the body (3).
The advantage of MRI compared with X-ray and CT
images (2) is the high contrast of
the normal structures in soft tissues and lesions, such as those
observed during inflammation and tumor formation. However, a
disadvantage of MRI compared with other imaging techniques is the
distortion and evident artifacts caused by the presence of metal in
the body (3).
In recent years, the surgical demand for spinal
compression fractures has increased due to an aging population, and
therefore orthopedic lumbar implants have become increasingly
popular. Following the insertion of a metal implant, it is
necessary to accurately ascertain the state of the insertion.
Currently, CT, which has less distortion in general, is used more
frequently than MRI for 3D imaging. However, infections and
hematoma may occur at the insertion site following implantation
(3). MR images are more useful
than radiographs or CT images for evaluations of infections and
hematoma (4,5). Therefore, MRI methods are
continuously developed to reduce artifacts from metallic implants,
as these are considered to hinder certain diagnoses.
One of these MRI methods is the multiacquisition
variable-resonance image combination (MAVRIC). MAVRIC is a method
of synthesizing off-resonant frequency information in the metallic
environment by acquiring various high-frequency offsets. MAVRIC
selective (MAVRIC SL) is a combination of MAVRIC and slice-encoding
for metal artifact correction (SEMAC) (3,6).
SEMAC is a method for correcting in-plane distortions by applying
the view-angle-tilting (3,7,8)
technique, in which the acquisition slice selection gradient is
corrected by the readout gradient (9). A limited number of reports have
investigated the ability of MAVRIC SL to accurately measure metal
implants without distortion (10).
Most of the reports on the reduction of the metal artifacts with
the MAVRIC SL are based on visual and qualitative methods, and only
a limited number of reports have investigated the quantitative
methods (10).
Therefore, the present study aimed to quantitatively
evaluate the effectiveness of MAVRIC SL (11) in reducing the distortion and metal
artifacts of lumbar implants. The present study is also fairly
novel in its use of phantom experiments to clarify the useful
application of MAVRIC SL.
Materials and methods
Preparation of implant-embedded
phantom
An agar phantom (Fig.
1A) with a titanium implant was prepared. A plastic implant
support was placed inside a 280x190x145 mm plastic container. A
titanium alloy lumbar implant (5.5/6.0 mm CD Horizon™ Solera™ with
a 7.5x40 mm Cannulated Multi-Axial Screw; Medtronic Sofamor Danek,
Co., Ltd.) was placed on the support base. Three screws were fixed
to one rod. The minor diameter, which is the diameter of the screw
excluding the threads, was 5.5 mm, whereas the nominal diameter,
which is the diameter including the threads, was 7.5 mm. The two
rods were placed in parallel. The vessel was filled with agar,
which was used at a final concentration of 0.8% (w/w), and
dissolved in 0.9% saline.
Imaging, post-processing and CT
imaging
A 64 multi-row detector CT (Sensation 64; Siemens
AG) was used. The imaging parameters were as follows: Tube voltage
140 kVp, automated tube current modulation, collimation 0.6x64 mm,
and helical pitch 32. A coronal section image of the phantom was
reconstructed with a reconstruction matrix of 512x512 and a slice
thickness of 2 mm.
MRI
3.0 T SIGNA Architect ver. 26.1, Posterior Array
Coil and Anterior Array Coil (GE) were used. MAVRIC SL, CUBE and
magnetic image compilation (MAGiC) were used as a metal artifact
reduction sequence, a 3D fast spin-echo sequence and a synthetic
MRI sequence, respectively. The coronal section images of the
phantom were obtained using the imaging parameters in Table I.
 | Table IMR sequences. |
Table I
MR sequences.
| Parameters | MAGiC | CUBE | MAVRIC SL |
|---|
| TR/TE, msec |
4,000-5,600/23-95 | 3,000/13 | 3,000/6.3 |
| FOV, mm | 300x300 | 300x300 | 300x300 |
| Matrix size | 320x192 | 320x320 | 256x256 |
| Slice thickness,
mm | 1.8 | 0.9 | 1.4 |
| Number of
slices | 32 | 76 | 38 |
| Flip angle, ° | NA | NA | 60 |
| ARC | Phase: 2.25 | Phase: 2.5 | Phase: 3.0 |
| | | Slice: 2.0 | Slice: 2.0 |
| ETL | 16 | 60 | 20 |
| Phase
direction | L/R | L/R | L/R |
| Frequency
direction | S/I | S/I | S/I |
| Echo spacing,
msec | 10.0 | 4.7 | 6.3 |
| Band width,
Hz/pixel | 156.2 | 488.3 | 976.6 |
| Scan time,
min:sec | 4:51 | 5:10 | 5:06 |
Unification of image resolution
The different resolutions of CT and MRI images were
included using the image analysis software MATLAB 2020a (MathWorks
Inc.). The resolution of each MRI image was converted to 512x512 to
match the maximum resolution of the CT without altering the pixel
signal values.
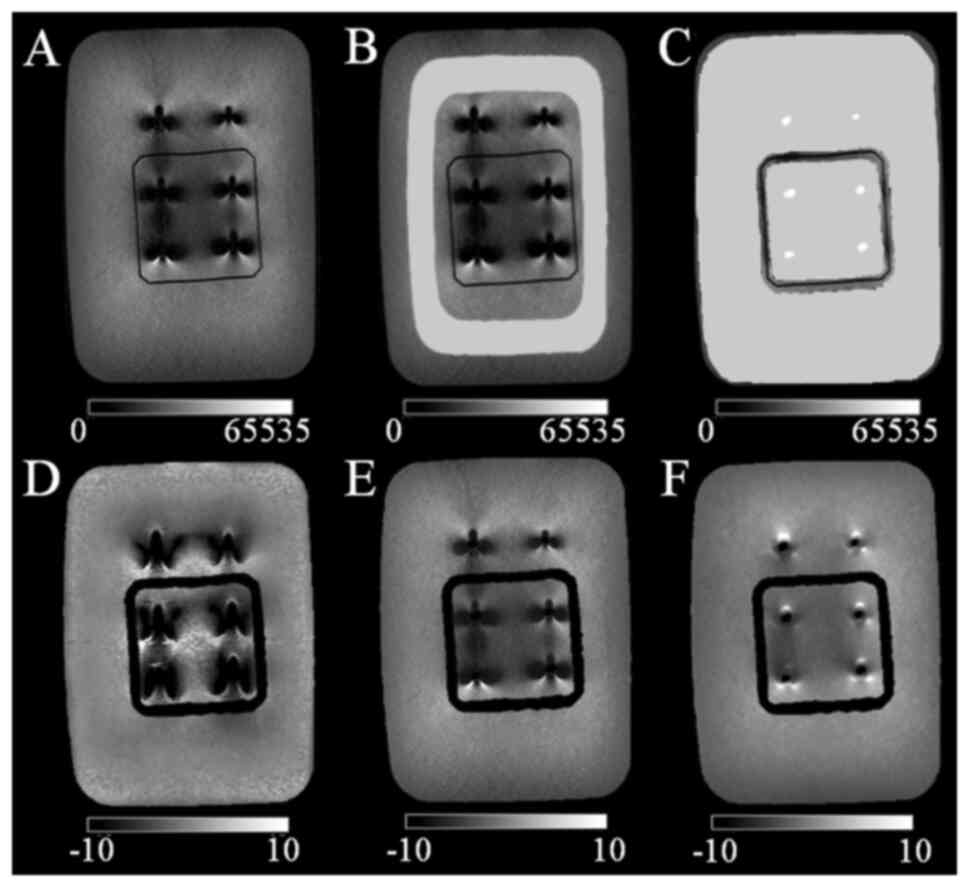
Quantitative measurement of screws and
evaluation methods Measurement of the screw diameter (SCD) and the
distance between the screws (DBSC)
Concerning the methodology for the evaluation of SCD
and DBSC, using the image in which the screws are depicted, a
straight line overlapping the screws was drawn, and a profile curve
of the signal value on the line was obtained. The constant changing
part of the signal value in the profile curve was defined as the
screw part, and SCD and DBSC were quantitatively measured. More
specifically, SCD and DBSC were measured and evaluated as a
distortion using MATLAB; the CT and MR images of the coronal
sections were estimated as shown in Fig. 1B. Five slices with the same depth
in the CT and MR images were selected for each measurement. The
measurement directions are the horizontal directions shown in
columns a, b and c and the vertical directions are those indicated
in columns d and e (Fig. 1C). The
horizontal and vertical directions correspond to the phase and
frequency directions in the MRI method, respectively. Fig. 1D indicates the measurement of
column d (Fig. 1C) in the CT
image. Column d with 1L, 2L and 3L screws was selected. A profile
curve was plotted with the signal value of column d on the vertical
axis and the pixel number of column d on the horizontal axis. The
diameters of the 1L, 2L, and 3L screws were quantitatively measured
as the full width at half maximum (FWHM) of the mountainous spread
of the signal values. DBSC was quantitatively measured as the
distance between two FWHM values. These parameters were also
measured in the same way using MR images. Two separate
investigators measured a total of nine locations for each of the
five slices, six screws and three DBSCs for the horizontal
direction. With regard to the vertical direction, six locations
were measured for each of the four screws (2L, 3L, 2R and 3R) and
the two DBSCs were measured to avoid the influence of the implant
support. Two investigators repeated these measurements three times
each, one week apart.
Evaluation of SCD and DBSC
The enlargement index of SCDs and DBSC in the images
of the three MR sequences were compared with those measured in the
CT images. The assessment was performed using the magnification
ratio as indicated in equation 1:
Magnification ratio=Measurements in MRI/Measurements
in CT
The magnification ratio of SCD was measured for each
screw. In the phase direction, a total of 180 magnification ratios
were calculated (six screws and five slices, each measured thrice
by two investigators). In the frequency direction, a total of 120
magnification ratios were calculated (four screws and five slices,
each measured thrice by two investigators). Subsequently, the
median, lower quartile (q1) and upper quartile (q3) of each
magnification ratio were calculated.
The magnification ratio of each DBSC was also
measured. In the phase direction, a total of 90 magnification
ratios were calculated (three DBSCs and five slices, each measured
thrice by two investigators). In the frequency direction, a total
of 60 magnification ratios were calculated (two DBSCs and five
slices, each measured thrice by two investigators). Then, the
median, q1 and q3 of each of these magnification ratios were also
calculated.
Evaluation of measurement bias between
the investigators performing the measurements
Concerning the evaluation of measurement of bias
between the investigators performing the measurements, the fixed
and proportional biases were used (12,13).
The fixed biases are errors that are biased in a certain direction,
regardless of the true value. The proportional biases are errors
that are in a certain direction in proportion to the true value.
The fixed biases were evaluated statistically using the difference
between the two investigators. The proportional biases were
evaluated by the Bland-Altman plot, using the mean and difference
between the two investigators. Specifically, the fixed and
proportional biases of the measurements performed between the two
investigators were evaluated. The fixed bias of SCDs and the
difference between SCDs measured by the two investigators were
calculated for each screw. In the phase direction, a total of 90
differences were calculated for six screws, five slices and three
measurements. In the frequency direction, a total of 60 differences
were calculated for four screws, five slices and three
measurements. Subsequently, the median, q1 and q3 of each
difference were calculated.
The fixed bias of DBSC was assessed as follows: The
difference between DBSC was measured by the two investigators (one
for each DBSC). In the phase direction, a total of 45 differences
were calculated for three DBSCs, five slices and three
measurements. In the frequency direction, a total of 30 differences
were calculated for two DBSCs, five slices and three measurements.
Subsequently, the median, q1 and q3 of each difference were
calculated.
Bland-Altman plots were used to determine the
proportional bias. The presence or absence of a correlation between
the difference and the mean in SCDs, as well as DBSC, between the
two investigators was examined (12,13).
Quantitative evaluation of artifacts
in MR images (Fig. 2)
Selection of slices for
evaluation
RadiAnt DICOM Viewer (64-bit; XLsoft Corporation)
was used. For image analysis, one slice at the central level of the
depth of the phantom was extracted from the coronal section MR
images of each sequence. This slice was selected since SCD was
constant and suitable for analysis at this level.
Competing interests
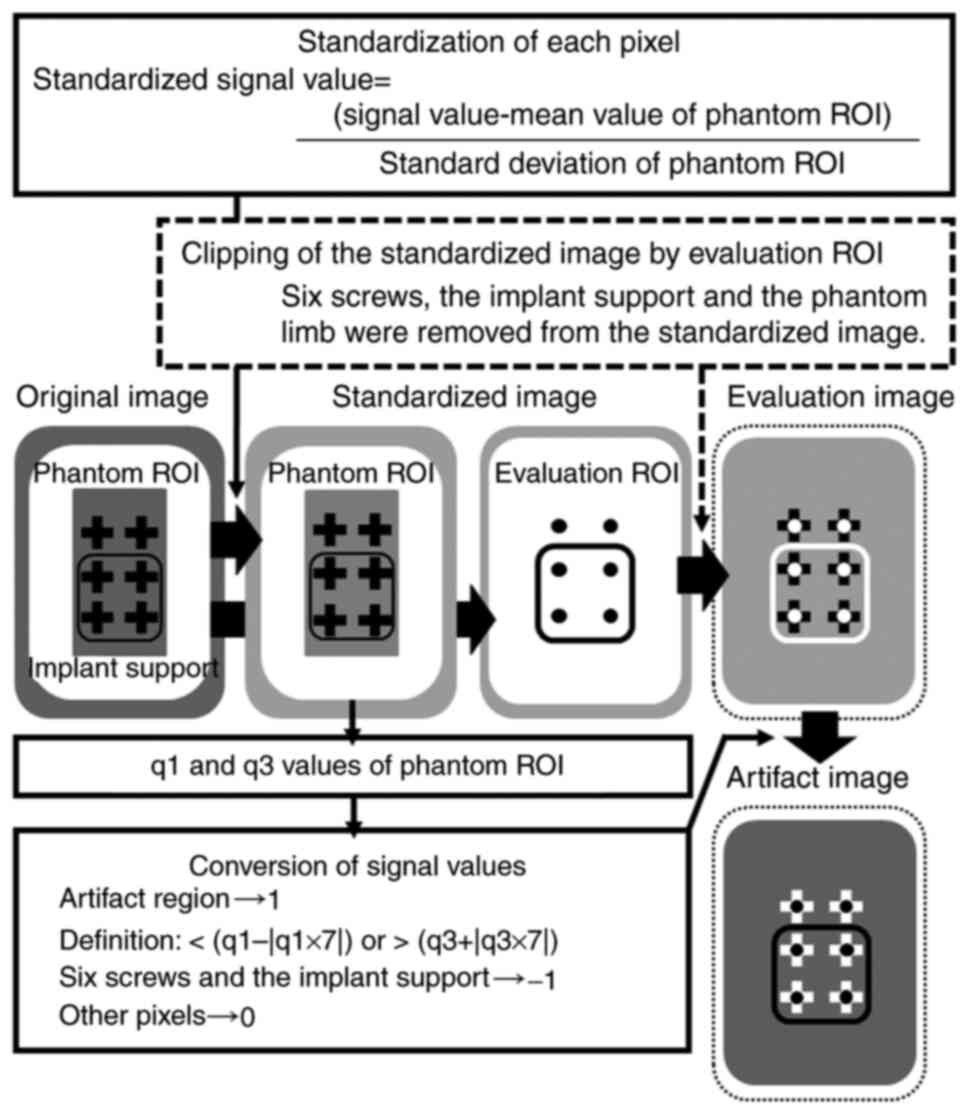
Creation of standardized images
(Fig. 2)
Standardization is a preprocessing method for
comparing different data (Data transformation; https://www.kdnuggets.com/2020/04/data-transformation-standardization-normalization.html).
In this study, standardized images were created to compare images
taken in three different sequences (Fig. 3). The standardized images show how
far the signal value of each image is from the average value of
each image. Standardization was performed only for MR images and
not for CT images. Concretely, for the MR image of each sequence,
the signal value of each pixel of the entire slice was standardized
using the signal value of the phantom in the artifact-free region.
The image created using the standardized signal values was defined
as the standardized image. A phantom region of interest (ROI;
Fig. 3B) was used to extract the
artifact-free region in the phantom image. The phantom ROI is the
region from which the central portion and the phantom edges are
removed from the entire phantom. The central portion is the part
where the metal artifacts are noted around the six screws and the
phantom edges are the parts where the signal values are unstable.
The mean, standard deviation of the signal values within the
phantom ROI, and the following equation (equation 2) were used to
calculate the standardized signal values:
Standardized signal value=(signal value-mean value
of phantom ROI)/standard deviation of phantom ROI
The purpose of establishing standardized images is
to quantitatively compare the differences in the signal values of
the artifact region in the MR images of each sequence with the same
distribution of signal values in the phantom of the artifact-free
regions.
Competing interests
Generation of evaluation images
(Fig. 2)
To quantitatively evaluate the regions of the metal
artifacts, an evaluation image (Fig.
3D-F) was constructed using standardized images from each
sequence. The evaluation image was defined as the image from which
the region of the phantom evaluation ROI (Fig. 3C) was extracted from the
standardized image. The phantom evaluation ROI is the region from
which the regions of six screws and the implant support are removed
from the entire phantom. The regions of the six screws were
determined using the CT image with little or no metal artifact.
Competing interests
Quantitative evaluation of artifact
regions in the images (Fig. 2)
Regions of signal values that deviated from a
certain signal value based on standardized images were defined as
artifact regions (Fig. 3). More
specifically, the artifact region in the evaluation image was
defined using the q1 and q3 of the signal values of all pixels in
the phantom ROI of the standardized image. An artifact region was
defined as a region where the signal value was <(q1-|q1x7|) or
>(q3+|q3x7|). In general, outliers were defined as the range
where the signal value was <(q1-|q1xX|) or the range where the
signal value was >(q3+|q3xX|). In the present study, the
constant ‘X’ was determined as the value at which the defined
artifact region visually matched the artifact region in the
standardized image (data not shown).
Competing interests
Construction of artifact images
(Fig. 2)
Artifact images were created by replacing the signal
value of an artifact region with a certain value and replacing
other regions with another constant value (Fig. 3). In the evaluation of artifact
regions, the percentage of artifact regions in the artifact images
of different sequences was quantitatively compared. More
specifically, the artifact images were constructed based on the
evaluation images following these steps: i) The signal values of
all pixels that fitted the definition of an artifact region were
converted to 1; ii) the signal values of the pixels in the region
of the six screws and the implant support were converted to -1; and
iii) the signal values of all other pixels were converted to 0.
Statistical analysis
SPSS (version 25; SPSS, Inc.) was used for
statistical processing. For the examination of the magnification
ratio and fixed biases, the medians, q1 and q3 were used, since the
Shapiro-Wilk test revealed the absence of normality in the
measurement data (data not shown). Non-parametric Kruskal-Wallis
with a Dunn test was used to assess the significant differences
among the MR sequences. The examination of proportional bias was
performed using the Spearman's correlation coefficient rs value
between the differences. Moreover, the mean of the measurements of
the two investigators was calculated, since the Shapiro-Wilk test
revealed the absence of normality in the measurement data (data not
shown). Fisher's Z-transformation was used to assess the
significant differences in the rs values between the MR
sequences.
In the evaluation of artifact regions, the ratio of
the number of pixels in the artifact region of each MR sequence to
the total number of pixels in the remaining part of the phantom was
compared by multiple χ2 tests with a Bonferroni
correction. P<0.05 was considered to indicate a statistically
significant difference.
Results
Magnification ratio of SCD and DBSC to
CT
In the CT images, the median SCD (q1, q3) was 5.0
(4.4, 6.3) mm for the horizontal measurements, 5.0 (4.4, 5.6) mm
for the vertical measurements and 5.0 (4.4, 5.6) mm for the overall
measurements. Table II indicates
the magnification ratio of SCD and DBSC to CT for each sequence of
the MR images. The MAVRIC SL exhibited the lowest measurement error
compared with that of the other MR sequences; the magnification of
SCD and DBSC were significantly closer to 1 in both phase and
frequency directions (MAVRIC SL vs. MAGiC, CUBE; P<0.05).
Concerning the magnification ratio of SCD and DBSC to CT, ratios
ranged from 0.58-0.73 and 2.81-3.44 for the MAGiC and CUBE, with a
large difference from 1.
| Table IIThe magnification ratio to CT. |
Table II
The magnification ratio to CT.
| | MR sequences |
|---|
| Direction | Measured object of
the magnification ratio | MAGiC | CUBE | MAVRIC SL |
|---|
| Phase | Screw diameter | 3.24a (2.92, 3.75) | 3.44a (3.09, 4.18) | 1.88 (1.61,
2.45) |
| | Distance between
the screws | 0.73a (0.62, 0.78) | 0.64a (0.62, 0.71) | 0.86 (0.85,
0.89) |
| Frequency | Screw diameter | 3.53a,b (3.05, 3.97) | 2.81a,c,d (2.60, 3.06) | 1.41c (1.25, 1.65) |
| | Distance between
the screws | 0.58a,c (0.51, 0.65) | 0.70a,c,d (0.66, 0.72) | 0.87 (0.82,
0.90) |
The comparison of the phase and frequency directions
demonstrated that the magnification ratios of SCD in the frequency
direction approached 1 (P<0.001) for CUBE and MAVRIC SL with a
limited measurement error. In MAGiC, the magnification ratio of SCD
was significantly >1 in the frequency direction compared with
that in the phase direction, and the measurement error was higher.
In MAGiC, the magnification ratio of DBSC was significantly <1
in the frequency direction than that noted in the phase direction,
and the measurement error was higher. In CUBE, the magnification
ratio of DBSC in the frequency direction approached 1 (P<0.05)
compared with that noted in the phase direction, with a lower
measurement error.
Measurement bias
Table III
indicates the fixed biases. In all measurements, the median value
of difference between two investigators approached zero and the
fixed biases were small. For the frequency direction, significant
differences were found in SCD of MAGiC and in DBSC of CUBE compared
with those of MAVRIC SL as determined by the Kruskal-Wallis with a
Dunn test (P<0.05). Table IV
indicates the proportional biases. No proportional biases were
found for the MAVRIC SL. In the phase direction, a correlation was
observed in SCD obtained by MAGiC and in that obtained by CUBE.
Fisher's Z-transformation revealed significant differences in the
rs values of SCDs between the CUBE and MAGiC sequences (P=0.0001)
and in SCDs between the MAVRIC SL and MAGiC sequences (P=0.0042).
In the frequency direction, a correlation was found in DBSC of
MAGiC. The differences in the rs values of DBSC were significant as
determined by Fisher's Z-transformation (P=0.0005) following the
comparison between MAVRIC SL and MAGiC.
| Table IIIDifference between measurements of
two investigators; analysis of fixed bias. |
Table III
Difference between measurements of
two investigators; analysis of fixed bias.
| | MR sequences |
|---|
| Direction | Measured
object | MAGiC | CUBE | MAVRIC SL |
|---|
| Phase | Screw diameter,
mm | 0 (-1.172,
1.172) | 0 (-0.586, 0) | 0 (-0.172, 0) |
| | Distance between
the screws, mm | 0 (-1.172,
1.172) | 0.586 (0,
0.586) | 0 (0, 1.172) |
| Frequency | Screw diameter,
mm | 0a (0, 1.172) | 0 (-0.586,
1.172) | 0 (-1.172, 0) |
| | Distance between
the screws, mm | 0 (-0.586,
1.172) | -0.586a (-1.172, 0.586) | 0 (0, 1.172) |
| Table IVCorrelation between difference and
average of measurements of two investigators; analysis of
proportional bias. |
Table IV
Correlation between difference and
average of measurements of two investigators; analysis of
proportional bias.
| | MR sequences |
|---|
| Direction | Measured
object | MAGiC | CUBE | MAVRIC SL |
|---|
| Phase | Screw diameter | 0.30a | -0.28a,b | -0.12c |
| | Distance between
the screws | -0.1 | -0.08 | 0.06 |
| Frequency | Screw diameter | -0.07 | 0.02 | 0 |
| | Distance between
the screws | -0.61a | -0.2 | 0.24d |
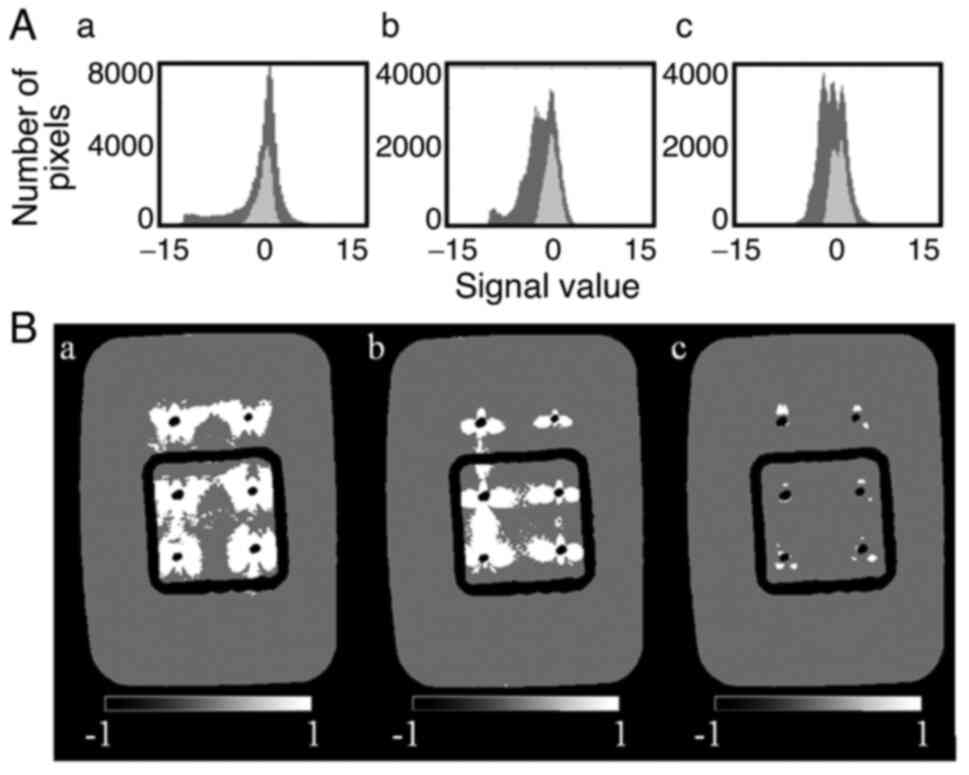
Evaluation of artifact regions
Fig. 4A indicates
the histograms of the signal values in the evaluation images for
each sequence. A low number of differences are noted in the
distribution of the signal values in the phantom evaluation ROI
among sequences due to the standardization. The spread of the
distribution of the signal values outside the phantom evaluation
ROI was lower in MAVRIC SL (Fig.
4Ac) compared with that in the MAGiC (Fig. 4Aa) and CUBE sequences (Fig. 4Ab). Table V indicates the signal values of the
pixels in the phantom ROI; the range of the signal values of the
artifact region was defined by equation 2 for each sequence. The
artifact images for each sequence prepared by this equation are
shown in Fig. 4B. The artifact
regions exhibited the following order: MAVRIC
SL<CUBE<MAGiC.
| Table VSignal values of pixels in the
phantom ROI for each MR evaluation image and definition of the
artifact region. |
Table V
Signal values of pixels in the
phantom ROI for each MR evaluation image and definition of the
artifact region.
| | Signal values |
|---|
| MR images | Phantom ROI | Definition of
artifact region |
|---|
| MAGiC | 0.141 (-0.558,
0.700) | <-4.602,
>5.603 |
| CUBE | 0.017 (-0.676,
0.684) | <-5.404,
>5.472 |
| MAVRIC SL | 0.012 (-0.771,
0.726) | <-6.170,
>5.808 |
Table VI indicates
the quantitative evaluation of the artifact regions. The ratio of
the pixels in the artifact region to the entire phantom exhibited
the following order: MAVRIC SL<CUBE<MAGiC. For MAVRIC SL, the
percentage of artifacts was as low as 0.5%. Multiple χ2
tests with Bonferroni correction indicated a significant difference
(P<0.05) in the percentage of the artifact regions among the
sequences.
| Table VIComparison of artifacts for each MR
sequence. |
Table VI
Comparison of artifacts for each MR
sequence.
| | Number of pixels
(%) |
|---|
| Sequence | Artifact
region | Non-artifact
region |
|---|
| MAGiC | 11,489
(13.0)a | 77,262
(87.0)a |
| CUBE | 6,946
(7.8)a | 81,805
(92.2)a |
| MAVRIC SL | 484
(0.5)a | 88,267
(99.5)a |
Discussion
The present study indicated that the magnification
of MAVRIC SL was significantly lower than that noted for CUBE and
MAGiC with regard to the measurements of SCD and DBSC for both
phase and frequency directions. The bias between the two
investigators was not observed. The MAVRIC SL was more useful than
the CUBE and MAGiC sequences in accurately measuring implants and
reducing distortion, with the quantitatively narrower area of
artifacts around the implant.
Only one previous study (10) has examined the accuracy of implant
geometry and measurement with the MAVRIC SL as a reduction in
distortion. To the best of our knowledge, our previous study
(10) was the first to report on
this topic and only the phase direction was examined. In the
present study, in addition to the phase direction, the frequency
direction was also examined. In addition, the number of
measurements was increased from one (10) to three to increase the reliability
of the measurements. In the present study, the accuracy of the
implant measurement in the phase direction with the MAVRIC SL was
as high as that noted in the previous study (10). The accuracy of the MAVRIC SL
implant measurements in the frequency direction was significantly
higher than that in the phase direction. The present study revealed
that the measurement bias was reduced by selecting MAVRIC SL,
probably because the magnification rate of MAVRIC SL was smaller
than that of other sequences, and the absolute value of the error
between the two investigators became smaller (10).
A significant number of studies have been reported
in clinical practice (14-18)
examining the extent of artifacts around the implant by MAVRIC SL.
The present study is the first report to demonstrate in a
quantitative manner, by using phantom experiments, that MAVRIC SL
exhibits significantly reduced artifacts compared with that noted
in other sequences. Various methods have been proposed to reduce
the metal artifacts in MRI (3).
Several reports have evaluated in a visual and qualitative manner
that MAVRIC SL (8), which combines
MAVRIC and SEMAC, reduces artifacts. Kretzschmar et al
(18) compared MAVRIC SL with fast
spin echo short tau inversion recovery in patients following hip
implantation and reported reduced metal artifacts with MAVRIC SL.
Liebl et al (17) reported
that MAVRIC SL decreased the metal artifacts in the knee lesions.
In our previous report (10), the
data indicated in a qualitative way that the MAVRIC SL exhibited
the narrower area of artifacts. The present study confirmed these
results using a quantitative evaluation method. Gutierrez et
al (14) evaluated MAVRIC SL
and 2D-fast spin echo in a semi-quantitative way and reported the
narrower area of metal artifacts in the MAVRIC SL.
Until recently, the MAVRIC SL could only be used in
limited sequences with short echo times. Recent upgrades to the
MAVRIC SL have made it possible to image T2-weighted images with
long echo times. It is expected that inflammation, abscess
formation and fluid retention in the vicinity of metallic implants
will be evaluated in the future. To the best of our knowledge, a
limited number of clinical reports have been published on
T2-weighted images of MAVRIC SL; these results have to be further
addressed in future studies (19,20).
To improve the long acquisition time of the MAVRIC SL, a novel
technique using robust principal component analysis has been
developed, which has been reported to reduce metal artifacts and
significantly shorten the scan time (21-23).
The first limitation of the present study was that
the MR images were evaluated based on the CT images. The minor
diameter of the screws used in the present study, which corresponds
to the diameter of the screw excluding the threads, was 5.5 mm. The
nominal diameter, which corresponds to the diameter including the
threads, was 7.5 mm. In both CT and MR images, the body diameter
was imaged considering a portion of the screw threads due to
partial volume effects. The CT and MRI data were compared since the
effects of the partial volume and those of the FWHM-based
measurement method were similar for the two imaging methods.
Although the appearance of the metal artifacts is also a limitation
in the CT method, the diameter of the screw measured by CT in the
present study was 5.0 (4.4-5.6) mm, which was considered to be
within the acceptable range for the degree of measurements
including the artifacts. Secondly, the artifacts in the imaging of
the MAVRIC SL used in the present study were evaluated using proton
density-weighted images with short echoes. T2-weighted images are
preferable for clinical applications by detecting lesions, such as
abscesses and hematomas, around metal implants. Our research group
aims to conduct a study with a similar design when T2-weighted
MAVRIC SL images (24), which are
expected to be developed and widely used in the future, become
available for routine clinical use (25). Finally, the present study used a
phantom experiment, and future clinical studies that directly
measure metal implants inserted into patients' bodies may need to
be considered to conclude whether the results of the present study
are clinically useful (26).
In conclusion, MAVRIC SL exhibited reduced implant
measurement error, reduced bias between the two investigator
measurements and the narrower area of artifacts around the implant
compared with those noted in the CUBE and MAGiC methods. Among the
MR imaging methods that can detect the tissue and lesions around
metallic devices, MAVRIC SL was found to be a superior sequence
with predominantly reduced artifacts on MR images compared with
CUBE and MAGiC; moreover, to accurately measure screws and reduce
measurement bias, it is preferable to use the MAVRIC SL rather than
the CUBE or MAGiC for imaging implants.
Acknowledgements
The authors would like to thank Mr. Kaito Murakami,
Mr. Yutaka Fujibuchi, Ms. Nao Ueda, Ms. Nayu Ohmukai and Mr. Naoya
Miura of Okayama University (Okayama, Japan) for their assistance
in analyzing the data.
Funding
Funding: The present study was supported by the Grant-in-Aid for
Scientific Research (grant no. 19K0809801) from the Ministry of
Health, Labour and Welfare of Japan.
Availability of data and materials
The datasets used and/or analyzed during the current
study are available from the corresponding author on reasonable
request.
Authors' contributions
MH, YM and MK participated in research design. MH,
YM, YF, TS, RK, SI, YT, WEA, YN and YS performed the experiments
and collected data. MH, YM and MK analyzed the data and were major
contributors in writing the manuscript. KK, KS, MO, IS and BOB
analyzed data and confirm the authenticity of all the raw data. All
authors read and approved the final manuscript.
Ethics approval and consent to
participate
Not applicable.
Patient consent for publication
Not applicable.
Competing interests
The authors declare that they have no competing
interests.
References
|
1
|
Kreel L: Medical Imaging. Postgrad Med J.
67:334–346. 1991.PubMed/NCBI View Article : Google Scholar
|
|
2
|
Elliott MJ and Slakey JB: CT provides
precise size assessment of implanted titanium alloy pedicle screws.
Clin Orthop Relat Res. 472:1605–1609. 2014.PubMed/NCBI View Article : Google Scholar
|
|
3
|
Jungmann PM, Agten CA, Pfirrmann CW and
Sutter R: Advances in MRI around metal. J Magn Reson Imaging.
46:972–991. 2017.PubMed/NCBI View Article : Google Scholar
|
|
4
|
Smith MR, Artz NS, Wiens C, Hernando D and
Reeder SB: Characterizing the limits of MRI near metallic
prostheses. Magn Reson Med. 74:1564–1573. 2015.PubMed/NCBI View Article : Google Scholar
|
|
5
|
Cyteval C and Bourdon A: Imaging
orthopedic implant infections. Diagn Interv Imaging. 93:547–557.
2012.PubMed/NCBI View Article : Google Scholar
|
|
6
|
Lu W, Pauly KB, Gold GE, Pauly JM and
Hargreaves BA: Slice encoding for metal artifact correction with
noise reduction. Magn Reson Med. 65:1352–1357. 2011.PubMed/NCBI View Article : Google Scholar
|
|
7
|
Butts K, Pauly JM and Gold GE: Reduction
of blurring in view angle tilting MRI. Magn Reson Med. 53:418–424.
2005.PubMed/NCBI View Article : Google Scholar
|
|
8
|
Viano AM, Gronemeyer SA, Haliloglu M and
Hoffer FA: Improved MR imaging for patients with metallic implants.
Magn Reson Imaging. 18:287–295. 2000.PubMed/NCBI View Article : Google Scholar
|
|
9
|
Bhoil A, Caw H and Vinjamuri S: Role of
18F-flurodeoxyglucose in orthopaedic implant-related infection:
Review of literature and experience. Nucl Med Commun. 40:875–887.
2019.PubMed/NCBI View Article : Google Scholar
|
|
10
|
Fujiwara Y, Sasaki T, Muto Y, Hirano M,
Kamizaki R, Murakami K, Miura N, Fujibuchi Y, Ohmukai N, Ueda N, et
al: Multiacquisition variable-resonance image combination selective
can improve image quality and reproducibility for metallic implants
in the lumbar spine. Acta Med Okayama. 75:187–197. 2021.PubMed/NCBI View Article : Google Scholar
|
|
11
|
Koch KM, Brau AC, Chen W, Gold GE,
Hargreaves BA, Koff M, McKinnon GC, Potter HG and King KF: Imaging
near metal with a MAVRIC SL-SEMAC hybrid. Magn Reson Med. 65:71–82.
2011.PubMed/NCBI View Article : Google Scholar
|
|
12
|
Hilson A: Bland-Altman plot. Radiology.
231(604): author reply 604-5. 2004.PubMed/NCBI View Article : Google Scholar
|
|
13
|
Chen CP and Lin YM: Bland-Altman plots and
receiver operating characteristic curves are preferred. Radiology.
257(896): author reply 896-7. 2010.PubMed/NCBI View Article : Google Scholar
|
|
14
|
Gutierrez LB, Do BH, Gold GE, Hargreaves
BA, Koch KM, Worters PW and Stevens KJ: MRI near metallic implants
using MAVRIC SL: Initial clinical experience at 3T. Acad Radiol.
22:370–379. 2015.PubMed/NCBI View Article : Google Scholar
|
|
15
|
Choi S, Koch MK, Hargreaves AB, Stevens JK
and Gold EG: Metal artifact reduction with MAVRIC SL at 3-T MRI in
patients with hip arthroplasty. AJR Am J Roentgenol. 204:140–147.
2015.PubMed/NCBI View Article : Google Scholar
|
|
16
|
Hayter LC, Koff FM, Shah P, Koch MK,
Miller TT and Potter GH: MRI after arthroplasty: Comparison of
MAVRIC and conventional fast spin-echo techniques. AJR Am J
Roentgenol. 197:W405–W411. 2011.PubMed/NCBI View Article : Google Scholar
|
|
17
|
Liebl H, Heilmeier U, Lee S, Nardo L,
Patsch J, Schuppert C, Han M, Rondak IC, Banerjee S, Koch K, et al:
In vitro assessment of knee MRI in the presence of metal implants
comparing MAVRIC-SL and conventional fast spin echo sequences at
1.5 and 3 T field strength. J Magn Reson Imaging. 41:1291–1299.
2015.PubMed/NCBI View Article : Google Scholar
|
|
18
|
Kretzschmar M, Nardo L, Han MM, Heilmeier
U, Sam C, Joseph GB, Koch KM, Krug R and Link TM: Metal artifact
suppression at 3 T MRI: Comparison of MAVRIC SL with conventional
fast spin echo sequences in patients with hip joint arthroplasty.
Eur Radiol. 25:2403–2411. 2015.PubMed/NCBI View Article : Google Scholar
|
|
19
|
Ai T, Padua A, Goerner F, Nittka M, Gugala
Z, Jadhav S, Trelles M, Johnson RF, Lindsey RW, Li X and Runge VM:
SEMAC-VAT and MSVAT-SPACE sequence strategies for metal artifact
reduction in 1.5T magnetic resonance imaging. Invest Radiol.
47:267–276. 2012.PubMed/NCBI View Article : Google Scholar
|
|
20
|
Ariyanayagam T, Malcolm PN and Toms AP:
Advances in metal artifact reduction techniques for periprosthetic
soft tissue imaging. Semin Musculoskelet Radiol. 19:328–334.
2015.PubMed/NCBI View Article : Google Scholar
|
|
21
|
Albakheet SS, Lee HY, Hahn S, Song TH, Suh
SJ and Kaushik S: Accelerated metallic artifact reduction imaging
using spectral bin modulation of multiacquisition
variable-resonance image combination selective imaging. Magn Reson
Imaging. 72:19–24. 2020.PubMed/NCBI View Article : Google Scholar
|
|
22
|
Doyle Z, Yoon D, Lee KP, Rosenberg J,
Hargreaves AB, Beaulieu FC and Stevens JK: Clinical utility of
accelerated MAVRIC-SL with robust-PCA compared to conventional
MAVRIC-SL in evaluation of total hip arthroplasties. Skeletal
Radiol. 51:549–556. 2022.PubMed/NCBI View Article : Google Scholar
|
|
23
|
Yang R, Liu C, Li L, Chen L, Liu WV and
Zha Y: 3-T MRI in patients who received anterior cervical
discectomy and fusion surgery with MAVRIC SL IR sequence: A
feasibility study. Comb Chem High Throughput Screen. 25:1024–1030.
2022.PubMed/NCBI View Article : Google Scholar
|
|
24
|
Park M, Moon Y, Han SH, Kim HK and Moon
WJ: Myelin loss in white matter hyperintensities and
normal-appearing white matter of cognitively impaired patients: A
quantitative synthetic magnetic resonance imaging study. Eur
Radiol. 29:4914–4921. 2019.PubMed/NCBI View Article : Google Scholar
|
|
25
|
Togashi K, Nishimura K, Itoh K, Fujisawa
I, Sago T, Minami S, Nakano Y, Itoh H, Torizuka K and Ozasa H:
Ovarian cystic teratomas: MR imaging. Radiology. 162:669–673.
1987.PubMed/NCBI View Article : Google Scholar
|
|
26
|
Lee SM, Choi YH, Cheon JE, Kim IO, Cho SH,
Kim WH, Kim HJ, Cho HH, You SK, Park SH and Hwang MJ: Image quality
at synthetic brain magnetic resonance imaging in children. Pediatr
Radiol. 47:1638–1647. 2017.PubMed/NCBI View Article : Google Scholar
|