Introduction
Throughout the last 10 years, glioma has persisted
as the foremost prevalent and lethal primary brain tumor among
adult populations worldwide, exhibiting an annual incidence of 6
cases per 100,000 individuals and a 5-year overall survival rate
not exceeding 35% (1,2). According to recent studies, low-grade
gliomas (LGG) account for 15-20% of all adult gliomas and correlate
with a median overall survival of 10 years, which is higher
compared with the median overall survival of high-grade glioma
(HGG) (3,4). Tumor-associated epilepsy is a common
symptom in patients with LGG (5).
Nevertheless, patients with LGG have a higher mortality rate when
compared with the general population (6). Despite improved advancements in
diagnostics and therapeutic techniques, the majority of LGGs in
adults invariably progress to glioblastoma (GBM) over time
(7). Moreover, high-risk LGG
patients display shorter survival outcomes when compared with
low-risk LGG patients (8,9). Thus, it is necessary to elucidate the
prognostic predictors and underlying molecular mechanisms in
patients with LGG.
Spectrin β non-erythrocytic 2 (SPTBN2), also
termed β-III spectrin, is highly expressed in the brain and plays
an important role in the neuronal membrane skeleton (10). SPTBN2 regulates
glutamate-associated pathways by stabilizing excitatory amino-acid
transporter 4(11). SPTBN2
is detected in numerous tumors and is involved in tumor occurrence
and metastasis (12-14).
The expression of SPTBN2 is higher in lung cancer compared
with in normal lung tissues (14).
In addition, SPTBN2 expression is correlated with the
prognosis of patients with lung adenocarcinoma (14). SPTBN2 is significantly
overexpressed in endometrioid endometrial cancer and is positively
associated with poor prognosis (15).
The SPTBN2 expression, prognosis and
regulatory mechanism in LGG remain elusive. A prior study revealed
that SPTBN2 has an adverse effect on reduced infiltration of
CD4+ T cells, contributing to a suboptimal prognosis for
patients with ovarian cancer (16). Nevertheless, the potential function
of SPTBN2 in regulating tumor immune infiltration in LGG is
poorly understood. The present study performed expression and
survival analyses for SPTBN2 in a pan-cancer study. Next,
the potential upstream noncoding RNAs (ncRNAs) of SPTBN2
were investigated in LGG, including microRNAs (miRNAs/miRs) and
long noncoding RNAs (lncRNAs). Finally, the relationship of
SPTBN2 expression to immune infiltration, immune biomarkers,
and immune checkpoints in LGG was determined. The aim of the
present study was to investigate the association between
ncRNA-mediated downregulation of SPTBN2 and tumor immune
infiltration and prognosis in patients with LGG.
Materials and methods
Ethics approval and consent to
participate
The study was approved by the Ethics Committee of
the First Affiliated Hospital of Fujian Medical University
(approval no. MRCTA, ECFAH of FMU [2022]509).
The Cancer Genome Atlas (TCGA) data
download, process, and analysis
Pan-cancer gene expression data were obtained from
TCGA database (https://tcga-data.nci.nih.gov/tcga/; V33.0; accession
no. phs001145). The 33 TCGA cancer types analyzed are presented in
Table SI. A differential
expression analysis of SPTBN2 was performed using the R
package (version 3.6.3) (17).
Weighted Pearson correlations and P-values were also calculated
using the R package (version 3.6.3) ‘weights’ (https://CRAN.R-project.org/package=weights) (18). P<0.05 was considered to indicate
a statistically significant difference. The clinicopathological
features of patients with LGG are displayed in Table I. Patients with incomplete clinical
information were excluded.
 | Table ICorrelation of SPTBN2 mRNA with
clinicopathological features in The Cancer Genome Atlas cohort. |
Table I
Correlation of SPTBN2 mRNA with
clinicopathological features in The Cancer Genome Atlas cohort.
| Characteristic | Low expression of
SPTBN2 | High expression of
SPTBN2 |
P-valuea |
|---|
| Total, n | 264 | 264 | |
| WHO grade, n
(%)a | | | 0.204 |
|
Grade 2 | 102 (21.8) | 122 (26.1) | |
|
Grade 3 | 126 (27.0) | 117 (25.1) | |
| IDH status, n
(%)a | | | <0.001 |
|
WT | 76 (14.5) | 21 (4.0) | |
|
Mut | 187 (35.6) | 241 (45.9) | |
| 1p/19q codeletion,
n (%)a | | | <0.001 |
|
Codel | 54 (10.2) | 117 (22.2) | |
|
Non-codel | 210 (39.8) | 147 (27.8) | |
| Primary therapy
outcome, n (%)a | | | 0.145 |
|
Partial
remission | 64 (14.0) | 46 (10.0) | |
|
Stable
disease | 70 (15.3) | 76 (16.6) | |
|
Progressive
disease | 28 (6.1) | 36 (7.9) | |
|
Complete
remission | 62 (13.5) | 76 (16.6) | |
| Sex, n
(%)a | | | 0.221 |
|
Female | 112 (21.2) | 127 (24.1) | |
|
Male | 152 (28.8) | 137 (25.9) | |
| Age, n
(%)a | | | 0.019 |
|
≤40 | 118 (22.3) | 146 (27.7) | |
|
>40 | 146 (27.7) | 118 (22.3) | |
| Median age
(IQR)b | 42.5 (32, 54) | 38 (32, 51) | 0.071 |
Gene Expression Profiling Interactive
Analysis (GEPIA) database analysis
GEPIA (http://gepia.cancer-pku.cn/detail.php; accessed on 16
August 2022; accession no. GEPIA2) is a web server for
gene-expression profiling and correlation analysis based on The
Genotype-Tissue Expression (GTEx) data and TCGA (19). GEPIA was used to analyze
SPTBN2 and lncRNA expression in various types of cancer. An
appropriate expression threshold was selected to split the high and
low expression cohorts by grouping cut-offs. High cut-off values
were considered to be samples with expression levels above this
threshold, and were the high expression cohorts. Samples with lower
cut-off values were considered to have an expression level below
this threshold and were considered to be the low-expression cohort.
A comparison of high and low-expression groups was completed using
GEPIA. P<0.05 was considered to indicate a statistically
significant difference. GEPIA was used to generate survival
analysis for SPTBN2 pan-cancer studies, including overall
survival (OS) and disease-free survival (DFS). Also, candidate
lncRNAs in SPTBN2 were assessed prognostically using
GEPIA. Cluster of differentiation 274 (CD274),
programmed cell death 1 (PDCD1), cytotoxic T lymphocyte
antigen 4 (CTLA4), sialic acid-binding immunoglobulin-like
lectin 15 (SIGLEC15), T cell immunoreceptor with Ig and
immunoreceptor tyrosine-based inhibitory domains (TIGIT),
hepatitis A virus cellular receptor 2 (HAVCR2), lymphocyte
activation gene-3 (LAG3), indoleamine 2,3-dioxygenase 1
(IDO1) and programmed cell death 1 ligand 2
(PDCD1LG2) were selected to be immune checkpoints. The GEPIA
database investigated the relationship between SPTBN2 and immune
checkpoints in LGG.
Encyclopedia of RNA Interactomes
(ENCORI) database analysis
ENCORI (http://starbase.sysu.edu.cn/; accessed on 16 August
2022, version 2.0) is an online publicly accessed platform for
studying the interactions between various RNAs (20). Candidate miRNAs were generated
using ENCORI. Several target prediction programs were used to
obtain upstream binding miRNAs of SPTBN2, including RNA22,
PITA, miRmap, microT, PicTar, miRanda and TargetScan (http://starbase.sysu.edu.cn; version 2.0) (21). In addition, parameters for
degradome data (low stringency) and pan-cancer type (one cancer
type) were set. Only the predicted miRNAs obtained in at least
three programs were considered candidate miRNAs of SPTBN2
and included for subsequent analysis. ENCORI was also used to
generate the correlation between miRNAs and SPTBN2 in LGG.
miRNAs negatively correlated with SPTBN2 were selected for
subsequent survival analysis. Survival analysis of candidate miRNAs
was performed by the ggplot2 R package (version 3.6.3) (https://cran.r-project.org/package=ggplot2) (22). Besides, candidate lncRNAs that
could potentially bind to candidate miRNAs were generated using
ENCORI.
Prediction of lncRNA and ceRNA network
construction
Analysis of miRNet2.0 (www.mirnet.ca/miRNet/home.xhtml; version Primeface 11)
and ENCORI was implemented to predict targeted lncRNAs of miRNAs.
The positive correlation between SPTBN2 and targeted lncRNAs
was analyzed using miRNet2.0 databases following the ceRNA
hypothesis. Moreover, a lncRNA-miRNA-mRNA interaction network of
SPTBN2 was constructed using ENCORI to understand
post-transcriptional gene regulation. Overall survival analysis of
these candidate miRNAs was performed using R package. The Sankey
diagram was generated using SankeyMATIC (www.sankymatic.com).
University of California, Santa Cruz
(UCSC) Xena database analysis and Kaplan-Meier plotter
analysis
The UCSC Xena database (http://xena.ucsc.edu/; accessed on 16 August 2022)
supports the visualization and analysis of correlations between
genomic and/or phenotypic variables. The database contains numerous
public datasets, including data from TCGA. The database provides
information on gene expression and survival outcomes. The
expression and survival curve of lncRNAs was obtained by combining
the GEPIA database (http://gepia.cancer-pku.cn/detail.php; accession no.
GEPIA2) (19) and the ‘survival’
package-derived R Project (http://cran.r-project.org/package=survival) (23).
TIMER database analysis
TIMER (https://cistrome.shinyapps.io/timer/; accessed on 16
August 2022; version 2.0) is a comprehensive database established
for the systematical analysis of tumor-infiltrating immune cells
and their clinical impact. TIMER was also employed to analyze the
relationship between SPTBN2 expression and immune infiltrates in
LGG. P<0.05 was considered to indicate a statistically
significant difference. The survival module assessed the
association between clinical outcomes and the abundance of immune
infiltrates.
Immune infiltration analysis
The level of tumor immune infiltrates was identified
using a single sample GSEA (ssGSEA) method with the Gene Set
Variation Analysis R package (17)
based on TCGA data sets (https://tcga-data.nci.nih.gov/tcga/; V33.0; accession
no. phs001145) (24). The Spearman
correlation test was used to calculate the correlation analysis
between SPTBN2 and 24 immune cell types. Graphs and figures
were generated using the ggplot2 R package (version 3.6.3)
(https://cran.r-project.org/package=ggplot2) (23). The correlation between SPTBN2 and
gene markers of immune cells was derived from GEPIA.
Enrichment analysis of Gene Set
Enrichment Analysis (GSEA)
The tumor samples were divided into SPTBN2-low and
SPTBN2-high groups according to the data downloaded from the TCGA
database (https://tcga-data.nci.nih.gov/tcga/; V33.0; accession
no. phs001145) (24). The R
package DESeq2 (version 1.26.0) was used to conduct the GSEA
between SPTBN2-low and SPTBN2-high groups (25). Heatmap generation was performed
with the R package (version 3.6.3) (22). The top 25 negative and top 25
positive correlations and these genes were selected as the top 50
correlation-ranked probes. Adjusted P-value <0.05 and false
discovery rate (FDR) q-value <0.25 were considered statistically
significant.
University of Alabama at Birmingham
Cancer (UALCAN) data analysis portal
UALCAN is a comprehensive and interactive web
resource for analyzing cancer OMICS data (26). UALCAN was used to generate graphs
and plots depicting survival information of miRNAs and lncRNAs in
patients with LGG.
The Human Protein Atlas (THPA)
analysis
THPA (version 21.1), a roadmap to generate renewable
protein binders to the human proteome by integrating various omics
technologies (including antibody-based imaging, mass
spectrometry-based proteomics and transcriptomics), was used to
assess SPTBN2 expression of LGG and normal tissues. The
SPTBN2 expression of normal brain tissues and glioma tissues
were detected using immunohistochemical data from THPA (27).
Tissue samples
The tissues of the patients (recruited June 2021 to
January 2022) were obtained from the Department of Neurosurgery,
The First Hospital of Fujian Medical University (Fuzhou, China).
Glioma tissues were from first-onset cases that had not received
any treatment before surgery. A total of five glioma tissues [4
World Health Organization (WHO) grade 2 glioma tissues and 1 WHO
grade 3 glioma tissue] were used. The normal cerebral tissues were
obtained from patients with severe traumatic brain injury
undergoing internal decompression surgery. The inclusion criteria
were as follows: i) The patients were >18 years of age; and ii)
the patients had severe traumatic brain injury and required
internal decompression surgery. The exclusion criteria were as
follows: i) The patient was <18 years old; ii) the patient had
other tumors in combination; iii) the patient did not provide
consent; and iv) there was no serious damage or bleeding in the
brain tissue taken. A total of 3 normal cerebral tissues were
obtained from patients with severe traumatic brain injury
undergoing internal decompression operation. The group of glioma
samples comprised 5 patients (3 males and 2 females; age,
45.67±18.18 years), and the group of internal decompression samples
comprised 3 patients (1 male and 2 females; age, 32.20±14.62
years). Resected samples were immediately frozen by liquid nitrogen
and stored at -80˚C until use. The diagnosis of gliomas was
confirmed by the pathologist through postoperative histological
examination according to The 2021 WHO Classification of Tumors of
the Central Nervous System (28).
The pathologist was independent from the study. The diagnosis of
human tumors is based on codes specified by the International
Classification of Diseases (ICD) (29). The ICD was available from
http://www.who.int/classifications/icd/en/. The Ethics
Committee of the First Affiliated Hospital of Fujian Medical
University (Fuzhou, China) approved the study protocol. All
patients provided written informed consent.
Western blotting assay
Cells were lysed in NP-40 buffer (Wuhan Boster
Biological Technology, Ltd.) with protease inhibitor cocktail
(MedChemExpress; cat. no. HY-K0010; 1:99) and phosphatase inhibitor
cocktail III (MedChemExpress; cat. no. HY-K0023; 1:99). The
proteins were extracted from tissue samples using RIPA lysis buffer
(Beyotime Institute of Biotechnology; cat. no. P0013B) with
protease inhibitor cocktail (MedChemExpress; cat. no. HY-K0010;
1:99) and phosphatase inhibitor cocktail III (MedChemExpress; cat.
no. HY-K0023; 1:99). Protein levels were determined by
bicinchoninic acid assay. Equal amounts of proteins (10 µg)
extracted from tissue samples and cells were separated by 12%
SDS-PAGE and transferred onto a 0.45-µm PVDF membrane (Amersham;
Cytiva). Membranes were blocked with 5% skimmed milk [Beijing
Solarbio Science & Technology Co., Ltd.; cat. no. D8340; with
1X TBST (TBS with 0.1% Tween-20)] for 2 h at room temperature.
Next, the membranes were probed with primary antibodies for β-actin
(1:50,000; cat. no. AC026; ABclonal Biotech Co., Ltd.) and
anti-SPTBN2 (1:1,000; cat. no. 55107-1-AP; ProteinTech Group, Inc.)
overnight at 4˚C. After three washes (1X TBST), the membranes were
incubated with goat anti-rabbit IgG horseradish
peroxidase-conjugated secondary antibodies (1:5,000; cat. no.
SA00001-2; ProteinTech Group, Inc.) for 1 h at 37˚C. After three
washes (1X TBST), target proteins were detected by ECL solution
(Vazyme Biotech Co., Ltd.) on Amersham Imager 680 System (Amersham;
Cytiva).
Statistical analysis
SPTBN2 expression analysis was conducted with
the GEPIA, TIMER, THPA, and R projects using the ‘ggplot2’ package
(version 3.6.3) (https://cran.r-project.org/package=ggplot2). Analysis
of correlation was performed using Spearman's test. Survivals,
including OS and DFS, were performed with GEPIA, ENCORI, TIMER and
R projects (version 3.6.3) (23).
The association between SPTBN2 expression and clinicopathologic
features was evaluated using Fisher's exact test, χ2
test, Wilcoxon signed-rank test and logistic regression. In
addition, the Kaplan-Meier method and Cox regression were used to
evaluate the role of SPTBN2 expression in prognosis.
P<0.05 was considered to indicate a statistically significant
difference.
Results
Expression and survival analysis for
SPTBN2 in pan-cancer studies
To explore the potential roles of SPTBN2 in
carcinogenesis, the expression of SPTBN2 in various types of
human cancer and corresponding TCGA and GTEx normal tissues were
analyzed. Differences in SPTBN2 were detected in 27 types of
cancer, except cholangiocarcinoma (CHOL), kidney chromosome cancer
(KICH), mesothelioma (MESO), pheochromocytoma and paraganglioma
(PCPG), sarcomas (SARC) and uveal melanoma (UVM) (Fig. 1A). SPTBN2 expression was
downregulated In LGG samples compared with corresponding TCGA and
GTEx normal tissues (Fig. 1). For
OS, higher expression of SPTBN2 had an unfavorable prognosis
in kidney renal clear cell carcinoma (KIRC), ovarian serous
cystadenocarcinoma (OV), prostate adenocarcinoma (PAAD) and UVM
(Fig. 1B-F). Moreover, higher
expression of SPTBN2 was significantly associated with short DFS in
KIRC and PAAD (Fig. 1G-K).
However, lower expression of SPTBN2 was associated with
short OS and DFS in LGG. Higher expression of SPTBN2 was associated
with poor prognosis in KIRC and PAAD (Fig. 1B, E, G and
J), while lower expression of
SPTBN2 was associated with an unfavorable outcome in LGG
(Fig. 1C and H).
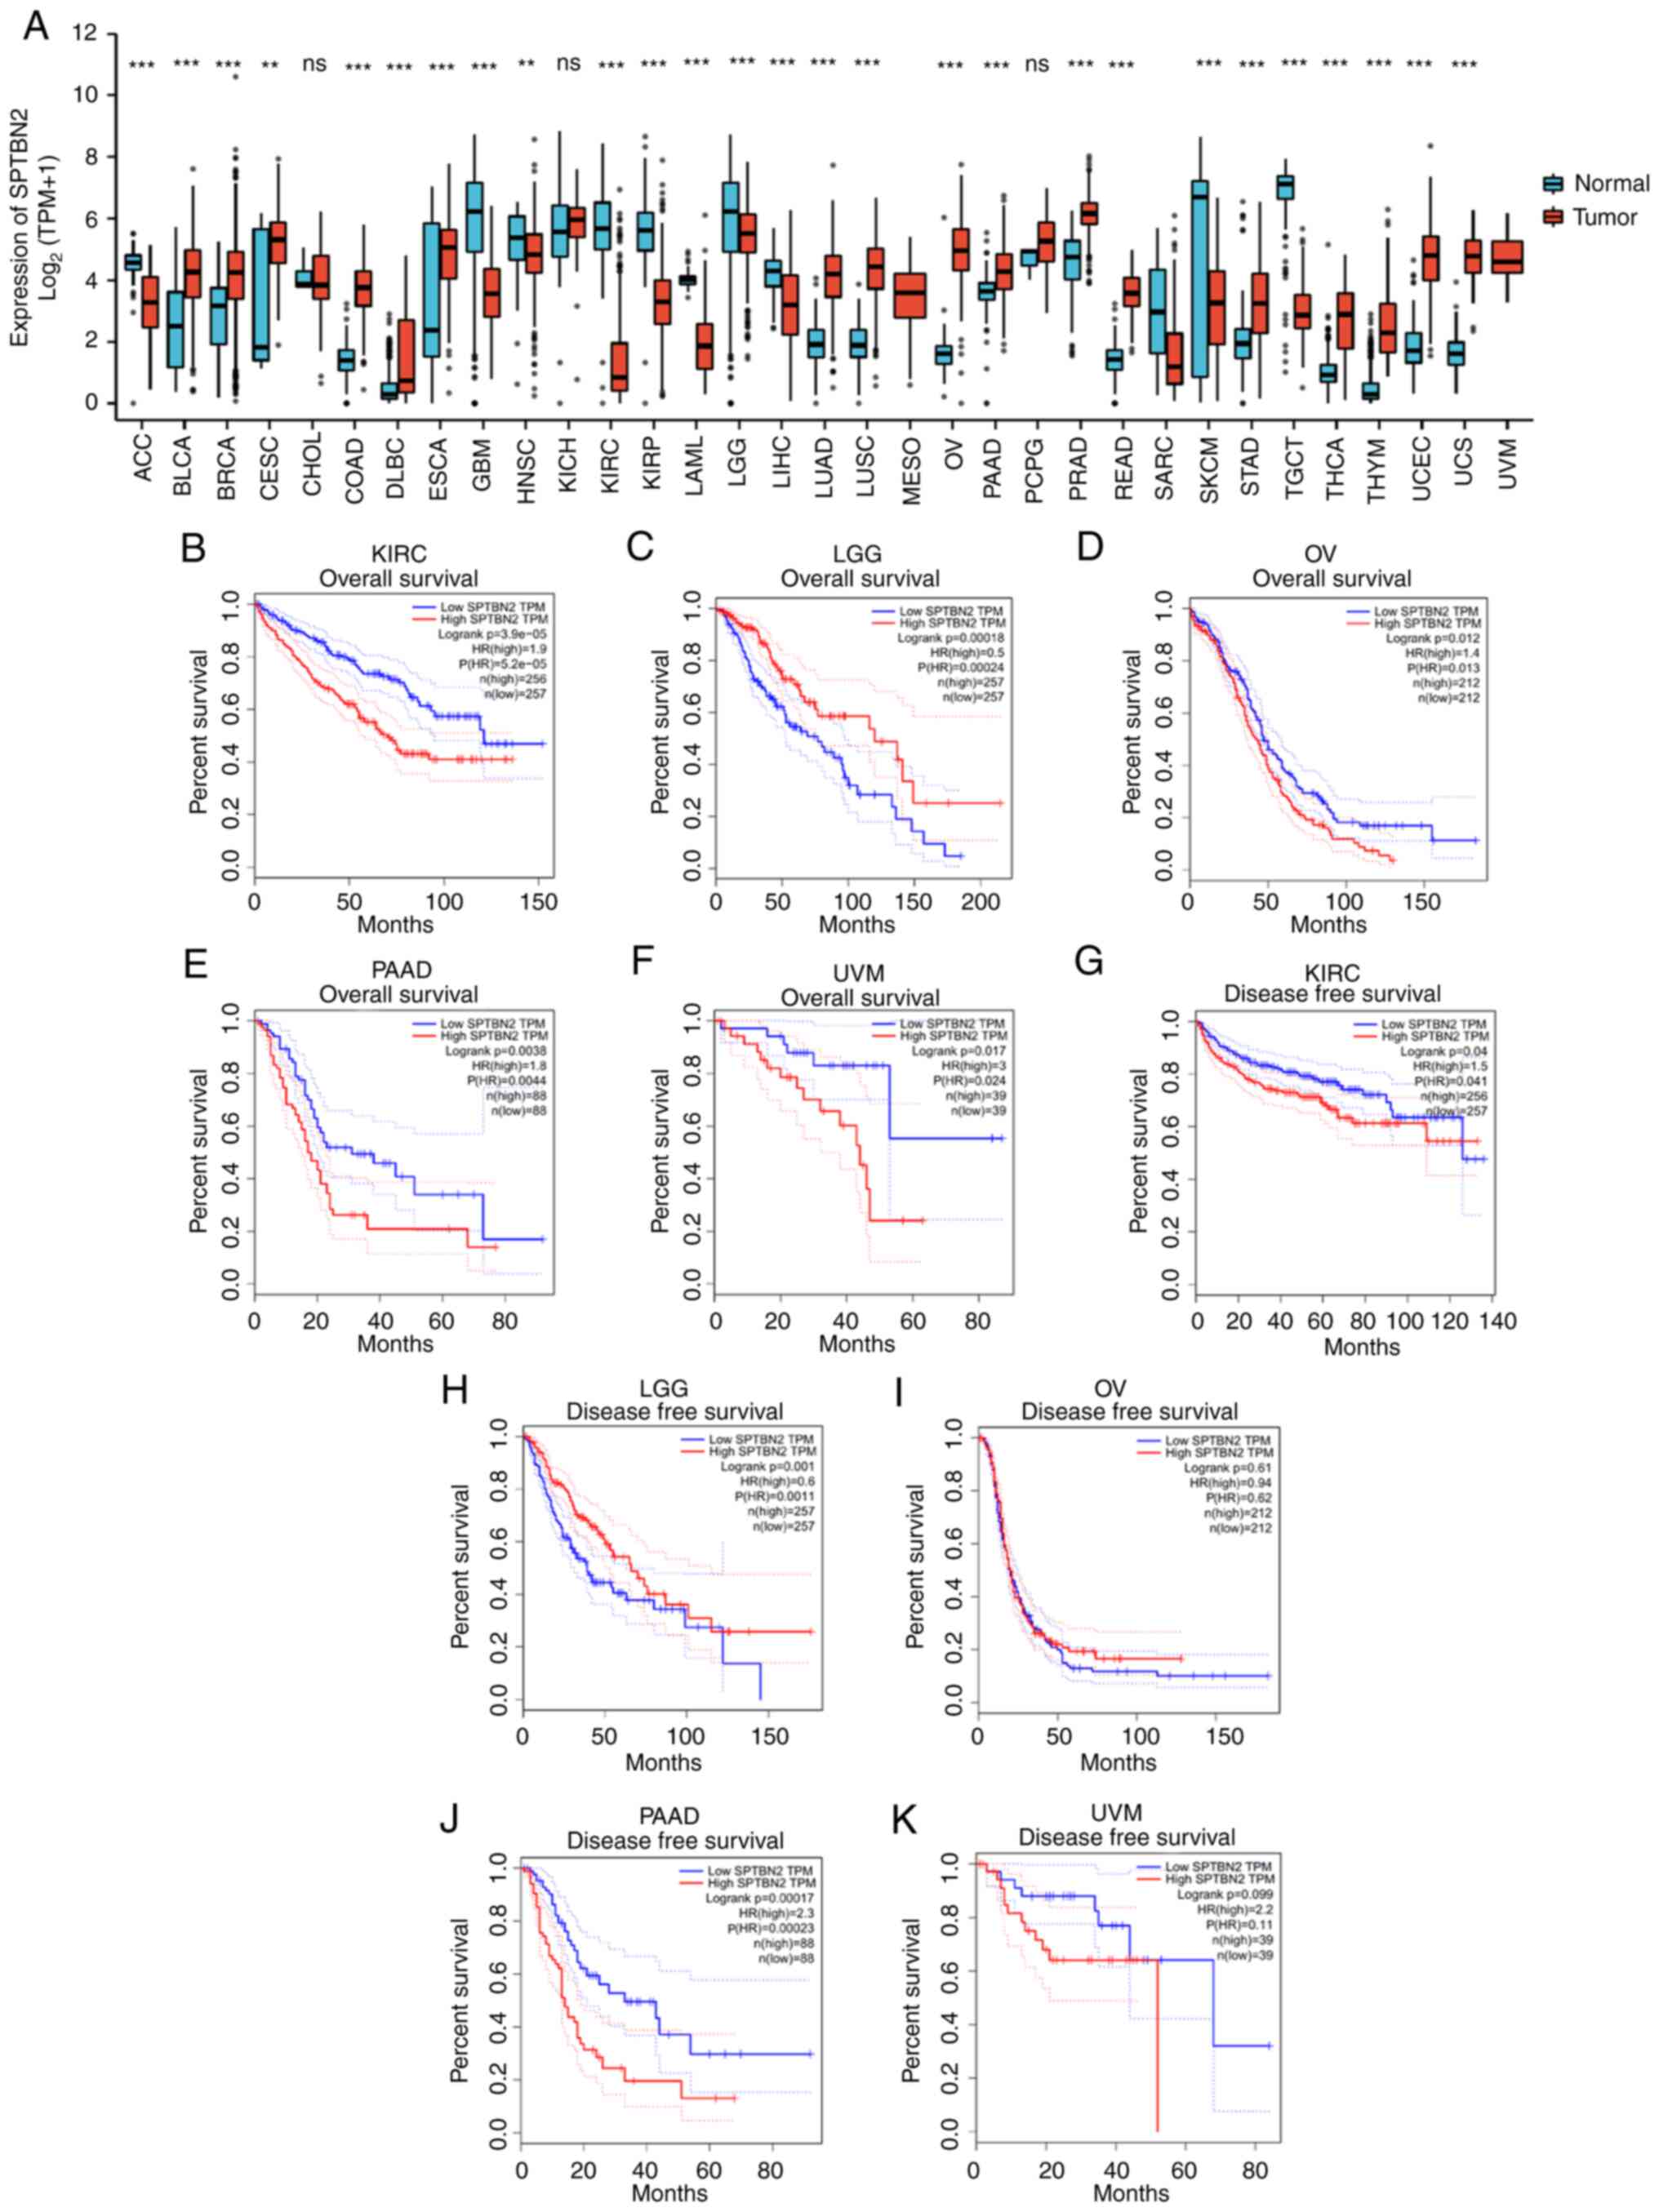 | Figure 1Expression and survival analysis for
SPTBN2 in pan-cancer types. (A) The expression of SPTBN2 in
pan-cancer types of human cancer compared with corresponding TCGA
and GTEx normal tissues was performed. Significant differences in
SPTBN2 were detected in 27 types of cancer, except CHOL, KICH,
MESO, PCPG, SARC and UVM. SPTBN2 was downregulated in LGG. (B) For
OS, higher expression of SPTBN2 had an unfavorable prognosis in
KIRC. (C) Lower expression of SPTBN2 correlated with short OS in
LGG. Higher expression of SPTBN2 had an unfavorable prognosis in
(D) OV, (E) PAAD and (F) UVM. (G) For DFS, higher expression of
SPTBN2 correlated with short DFS in KIRC. (H) Lower expression of
SPTBN2 correlated with DFS in LGG. (I) Lower expression of SPTBN2
was not associated with DFS in OV. (J) Higher expression of SPTBN2
correlated with short DFS in PAAD. (K) Higher expression of SPTBN2
was not associated with DFS in UVM. **P<0.01 and
***P<0.001. CHOL, cholangiocarcinoma; KICH, kidney
chromosome cancer; MESO, mesothelioma; PCPG, pheochromocytoma and
paraganglioma; SARC, sarcomas; UCM, uveal melanoma; KIRC, kidney
renal clear cell carcinoma; OV, ovarian serous cystadenocarcinoma;
PAAD, prostate adenocarcinoma. |
Low SPTBN2 expression is associated
with poor clinicopathological features of LGG
As shown in Table
I, 528 LGG cases were collected from TCGA datasets with
complete clinical and gene expression data. Patients with LGG were
categorized into SPTBN2-high (n=264) and SPTBN2-low
(n=264) groups. The association between SPTBN2 expression and
clinicopathological characteristics of patients with LGG was
evaluated (Table I and Fig. 2). Immunohistochemical analysis of
SPTBN2 was conducted on normal brain and glioma tissues
using the THPA database (Fig.
2A-C). A significant correlation between low SPTBN2 mRNA
expression and poor clinicopathological features was detected,
including elders (P=0.019; Fig.
2D), males (P<0.05; Fig.
2E), 1p/19q non-codeletion (P<0.001; Fig. 2F), wild-type isocitrate
dehydrogenase (IDH) status (P<0.001; Fig. 2G), primary therapy (P<0.05;
Fig. 2H) and WHO grade (P<0.05;
Fig. 2I). The western blotting
assay results demonstrated that the expression of SPTBN2 in
LGG was significantly lower compared with that in normal brain
tissues (P=0.0266; Fig. 2J).
Furthermore, univariate logistic regression analysis (Table II) indicated that SPTBN2
mRNA expression was closely associated with 1p/19q codeletion
[OR=0.323; 95% confidence interval (CI), 0.219-0.473; P<0.001],
IDH status (OR=4.664; 95% CI, 2.822-8.014; P<0.001) and older
ages (OR=0.653; 95% CI, 0.463-0.920; P=0.015).
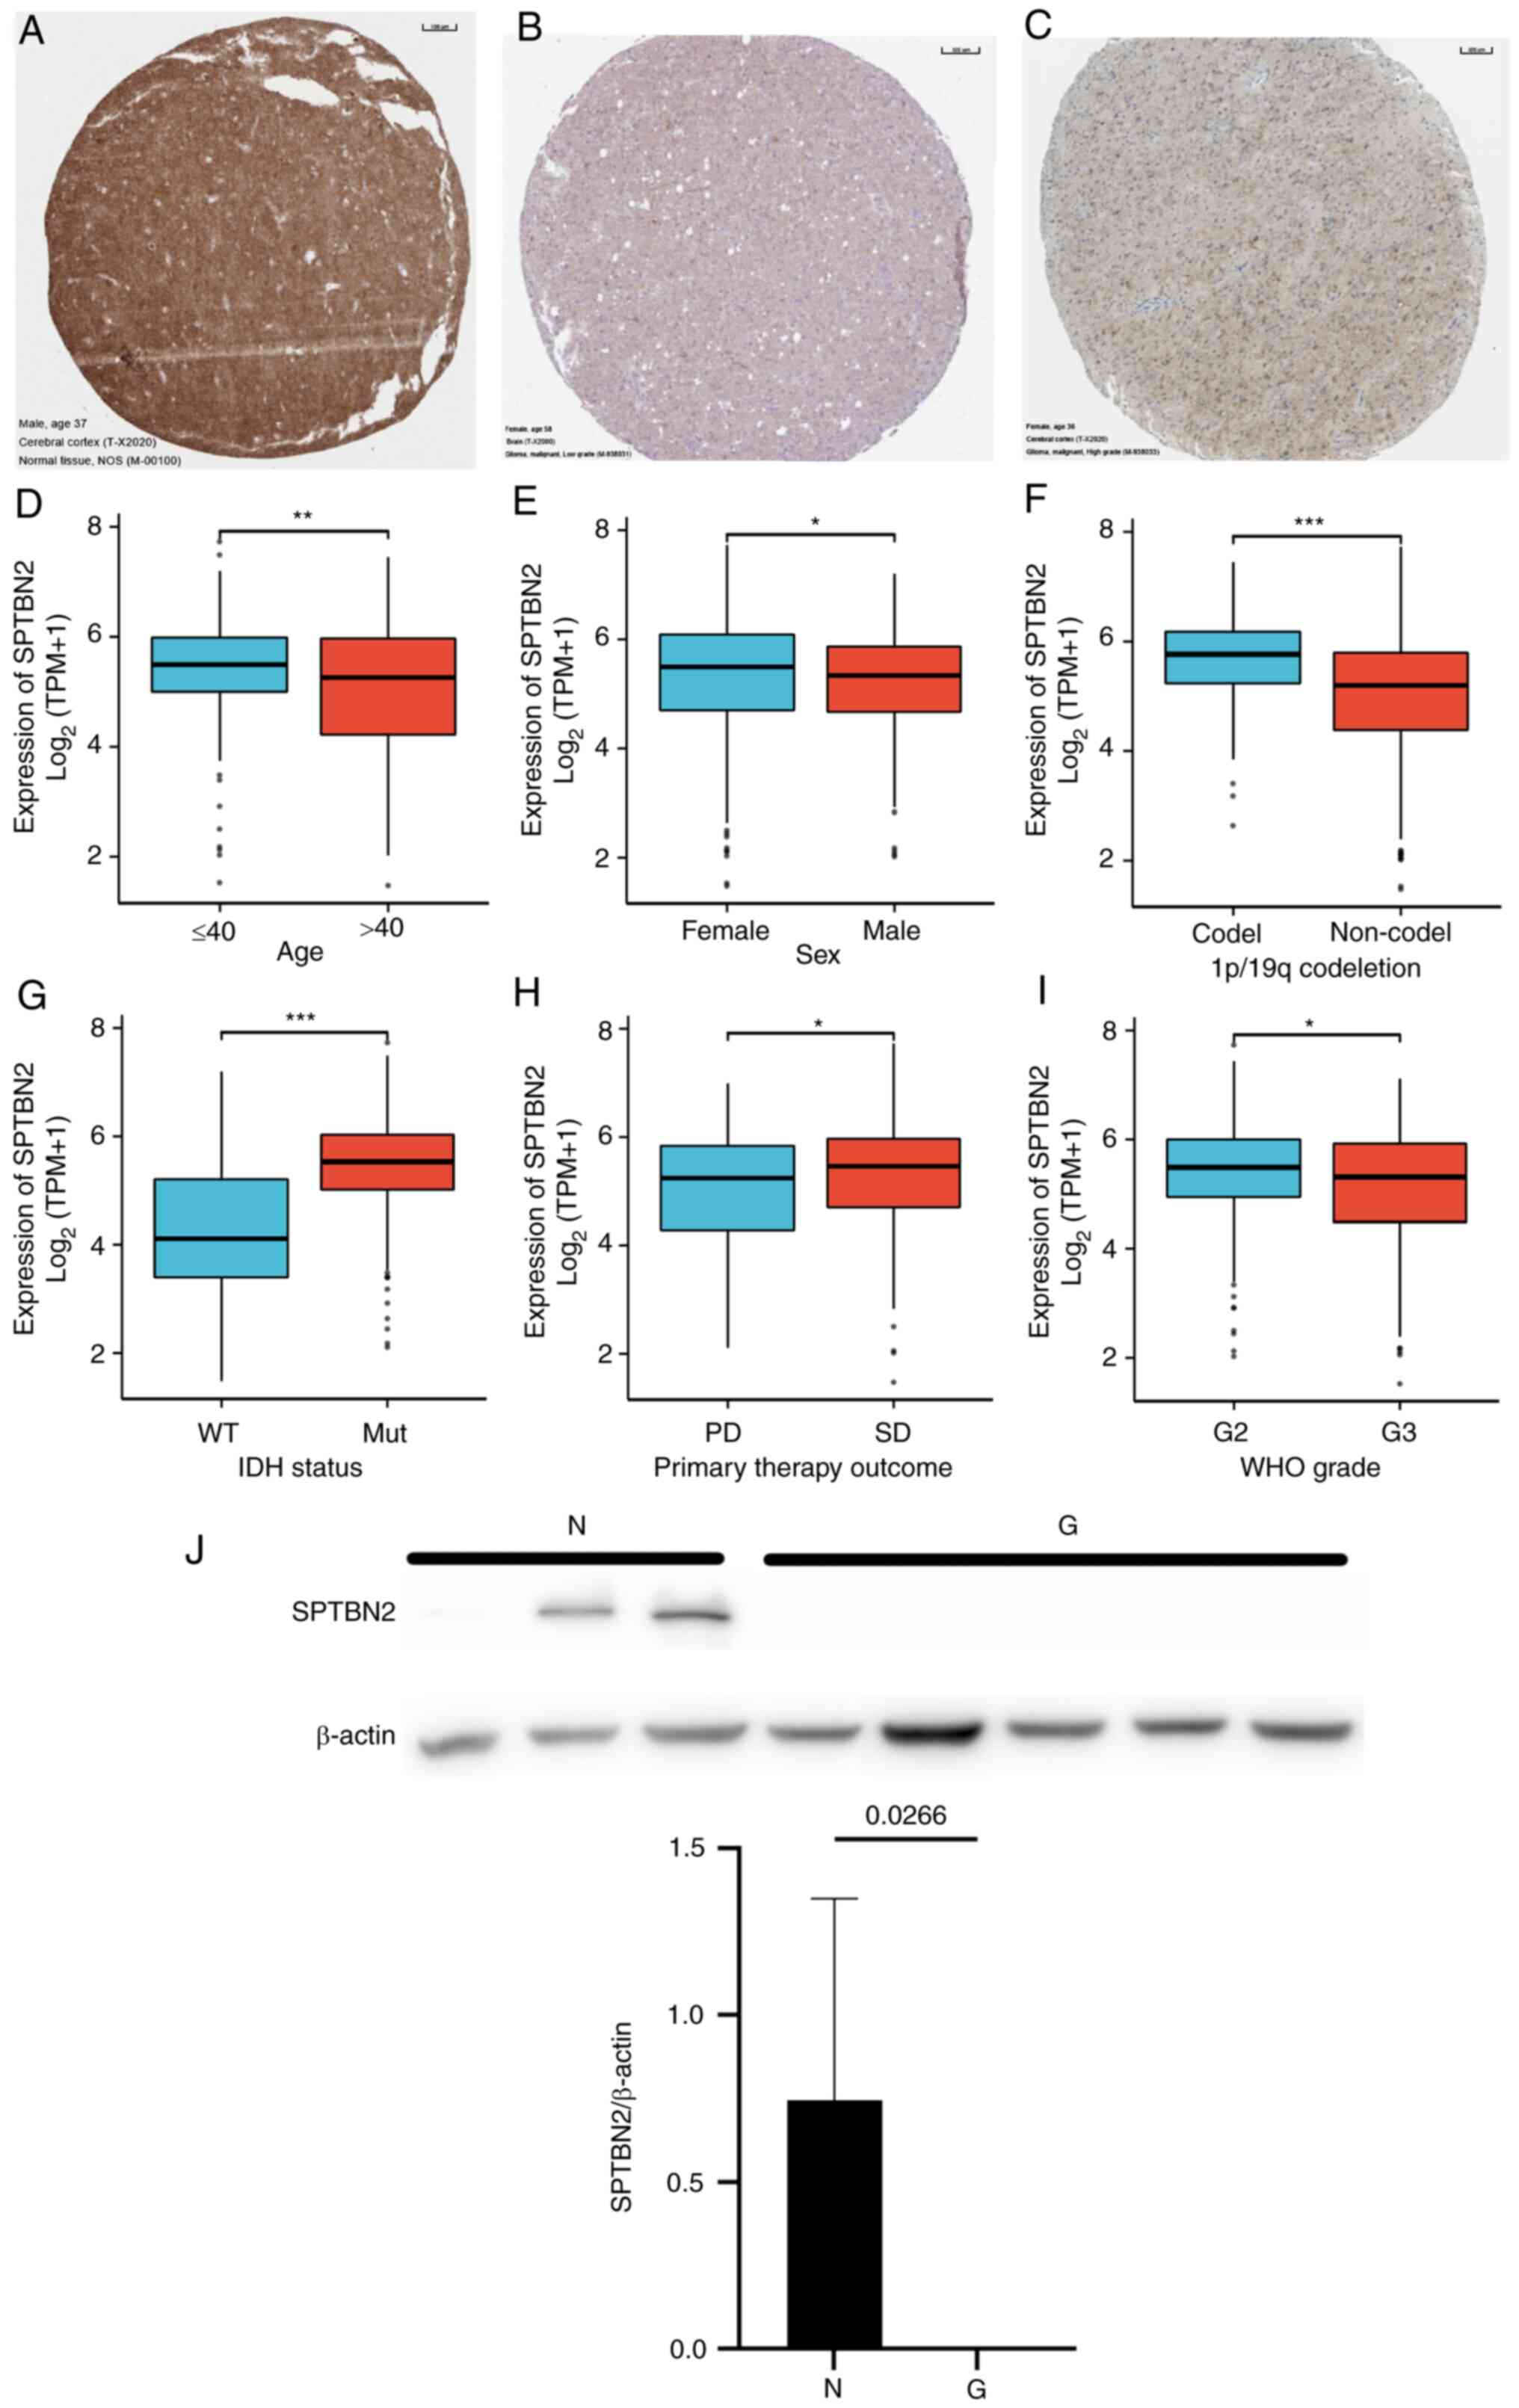 | Figure 2Correlation of SPTBN2 mRNA and
clinical status. (A-C) Immunohistochemical analysis of SPTBN2 was
conducted on normal brain and glioma tissues using The Human
Protein Atlas database. (A) Abundant expression of SPTBN2 was found
in the normal cerebral cortex. (B) No expression and (C) weak
expression were detected in low-grade glioma. The mRNA of SPTBN2 in
LGG from TCGA was analyzed using the TCGA colonic adenocarcinoma
and rectal adenocarcinoma data sets according to (D) age, (E) sex,
(F) 1p/19q codeletion, (G) IDH status, (H) primary therapy outcome
(I) and WHO grade. Low SPTBN2 expression was significantly
correlated with older age, males, 1p/19q non-codeletion, wild-type
IDH status, PD and WHO grade. (J) Western blotting assay results
showed that the amount of SPTBN2 in LGG was significantly lower
compared with that in normal brain tissues (P=0.0266).
*P<0.05, **P<0.01,
***P<0.001. Ns, no significant difference; SPTBN2,
spectrin β non-erythrocytic 2; TCGA, The Cancer Genome Atlas; LGG,
low-grade gliomas; IDH, isocitrate dehydrogenase; PD, progressive
disease; WHO, World Health Organization; WT, wild-type; Mut,
mutation; SD, stable disease. |
| Table IIMultivariate logistic regression
analysis of how SPTBN2 is associated with clinicopathological
parameters in LGG. |
Table II
Multivariate logistic regression
analysis of how SPTBN2 is associated with clinicopathological
parameters in LGG.
|
Characteristics | Total (n) | Odds ratio
(OR) |
P-valuea |
|---|
| WHO grade (G3 vs.
G2) | 467 | 0.776
(0.539-1.117) | 0.173 |
| 1p/19q codeletion
(non-codel vs. codel) | 528 | 0.323
(0.219-0.473) | <0.001 |
| Primary therapy
outcome (PR + CR vs. PD + SD) | 458 | 1.367
(0.945-1.982) | 0.098 |
| Sex (male vs.
female) | 528 | 0.795
(0.563-1.120) | 0.190 |
| Age (>40 vs.
≤40) | 528 | 0.653
(0.463-0.920) | 0.015 |
| IDH status (Mut vs.
WT) | 525 | 4.664
(2.822-8.014) | <0.001 |
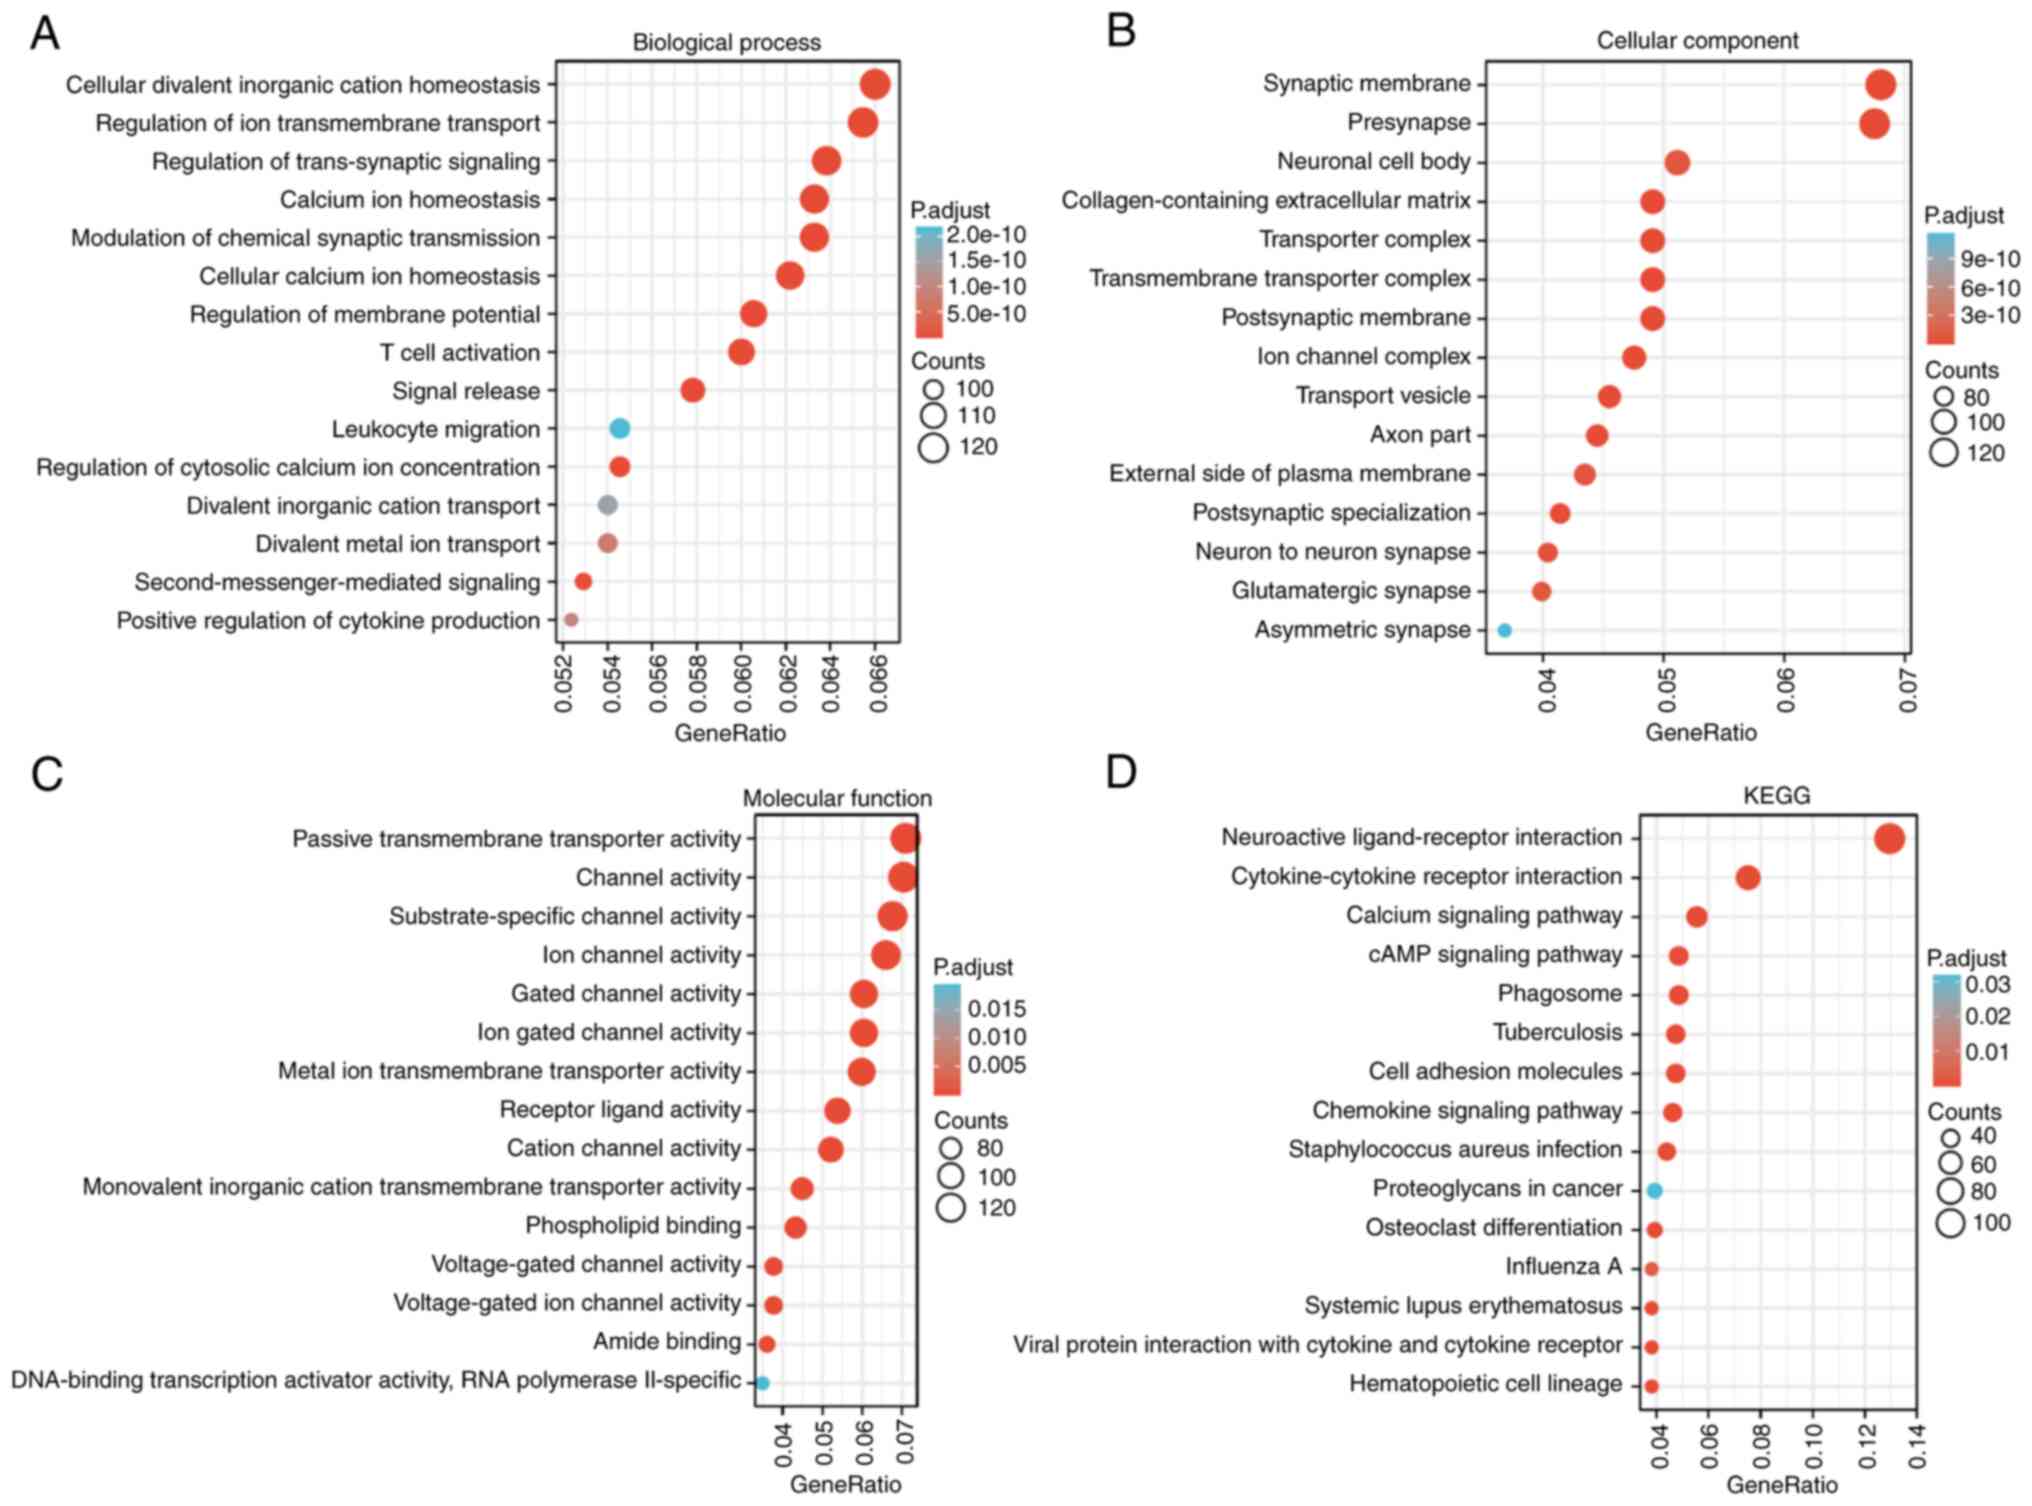
Predicted biological function and
pathways of SPTBN2 in LGG
GSEA analysis was performed to identify the possible
biological pathways regulated by SPTBN2 between
SPTBN2-high and SPTBN2-low groups. As shown in
Fig. 3A-D, several signal KEGG
pathways were significantly associated with SPTBN2
expression, including ‘neuroactive ligand-receptor interaction’,
‘cytokine-cytokine receptor interaction’, ‘calcium signaling
pathway’ and ‘cAMP signaling pathway’. A heatmap showed the top 50
genes in LGGs that were positively and negatively associated with
SPTBN2 (Fig. 4A). The red
color denoted positively correlated genes, and the blue color
denoted negatively correlated (Fig.
4A). Briefly, SPTBN2 was positively associated with CDK5R1,
PAK5, UNC5A, DLGAP3 and CELF5. By contrast,
SPTBN2 was negatively associated with CD99, HOMER3, PTLP,
SLC8B1 and CD44.
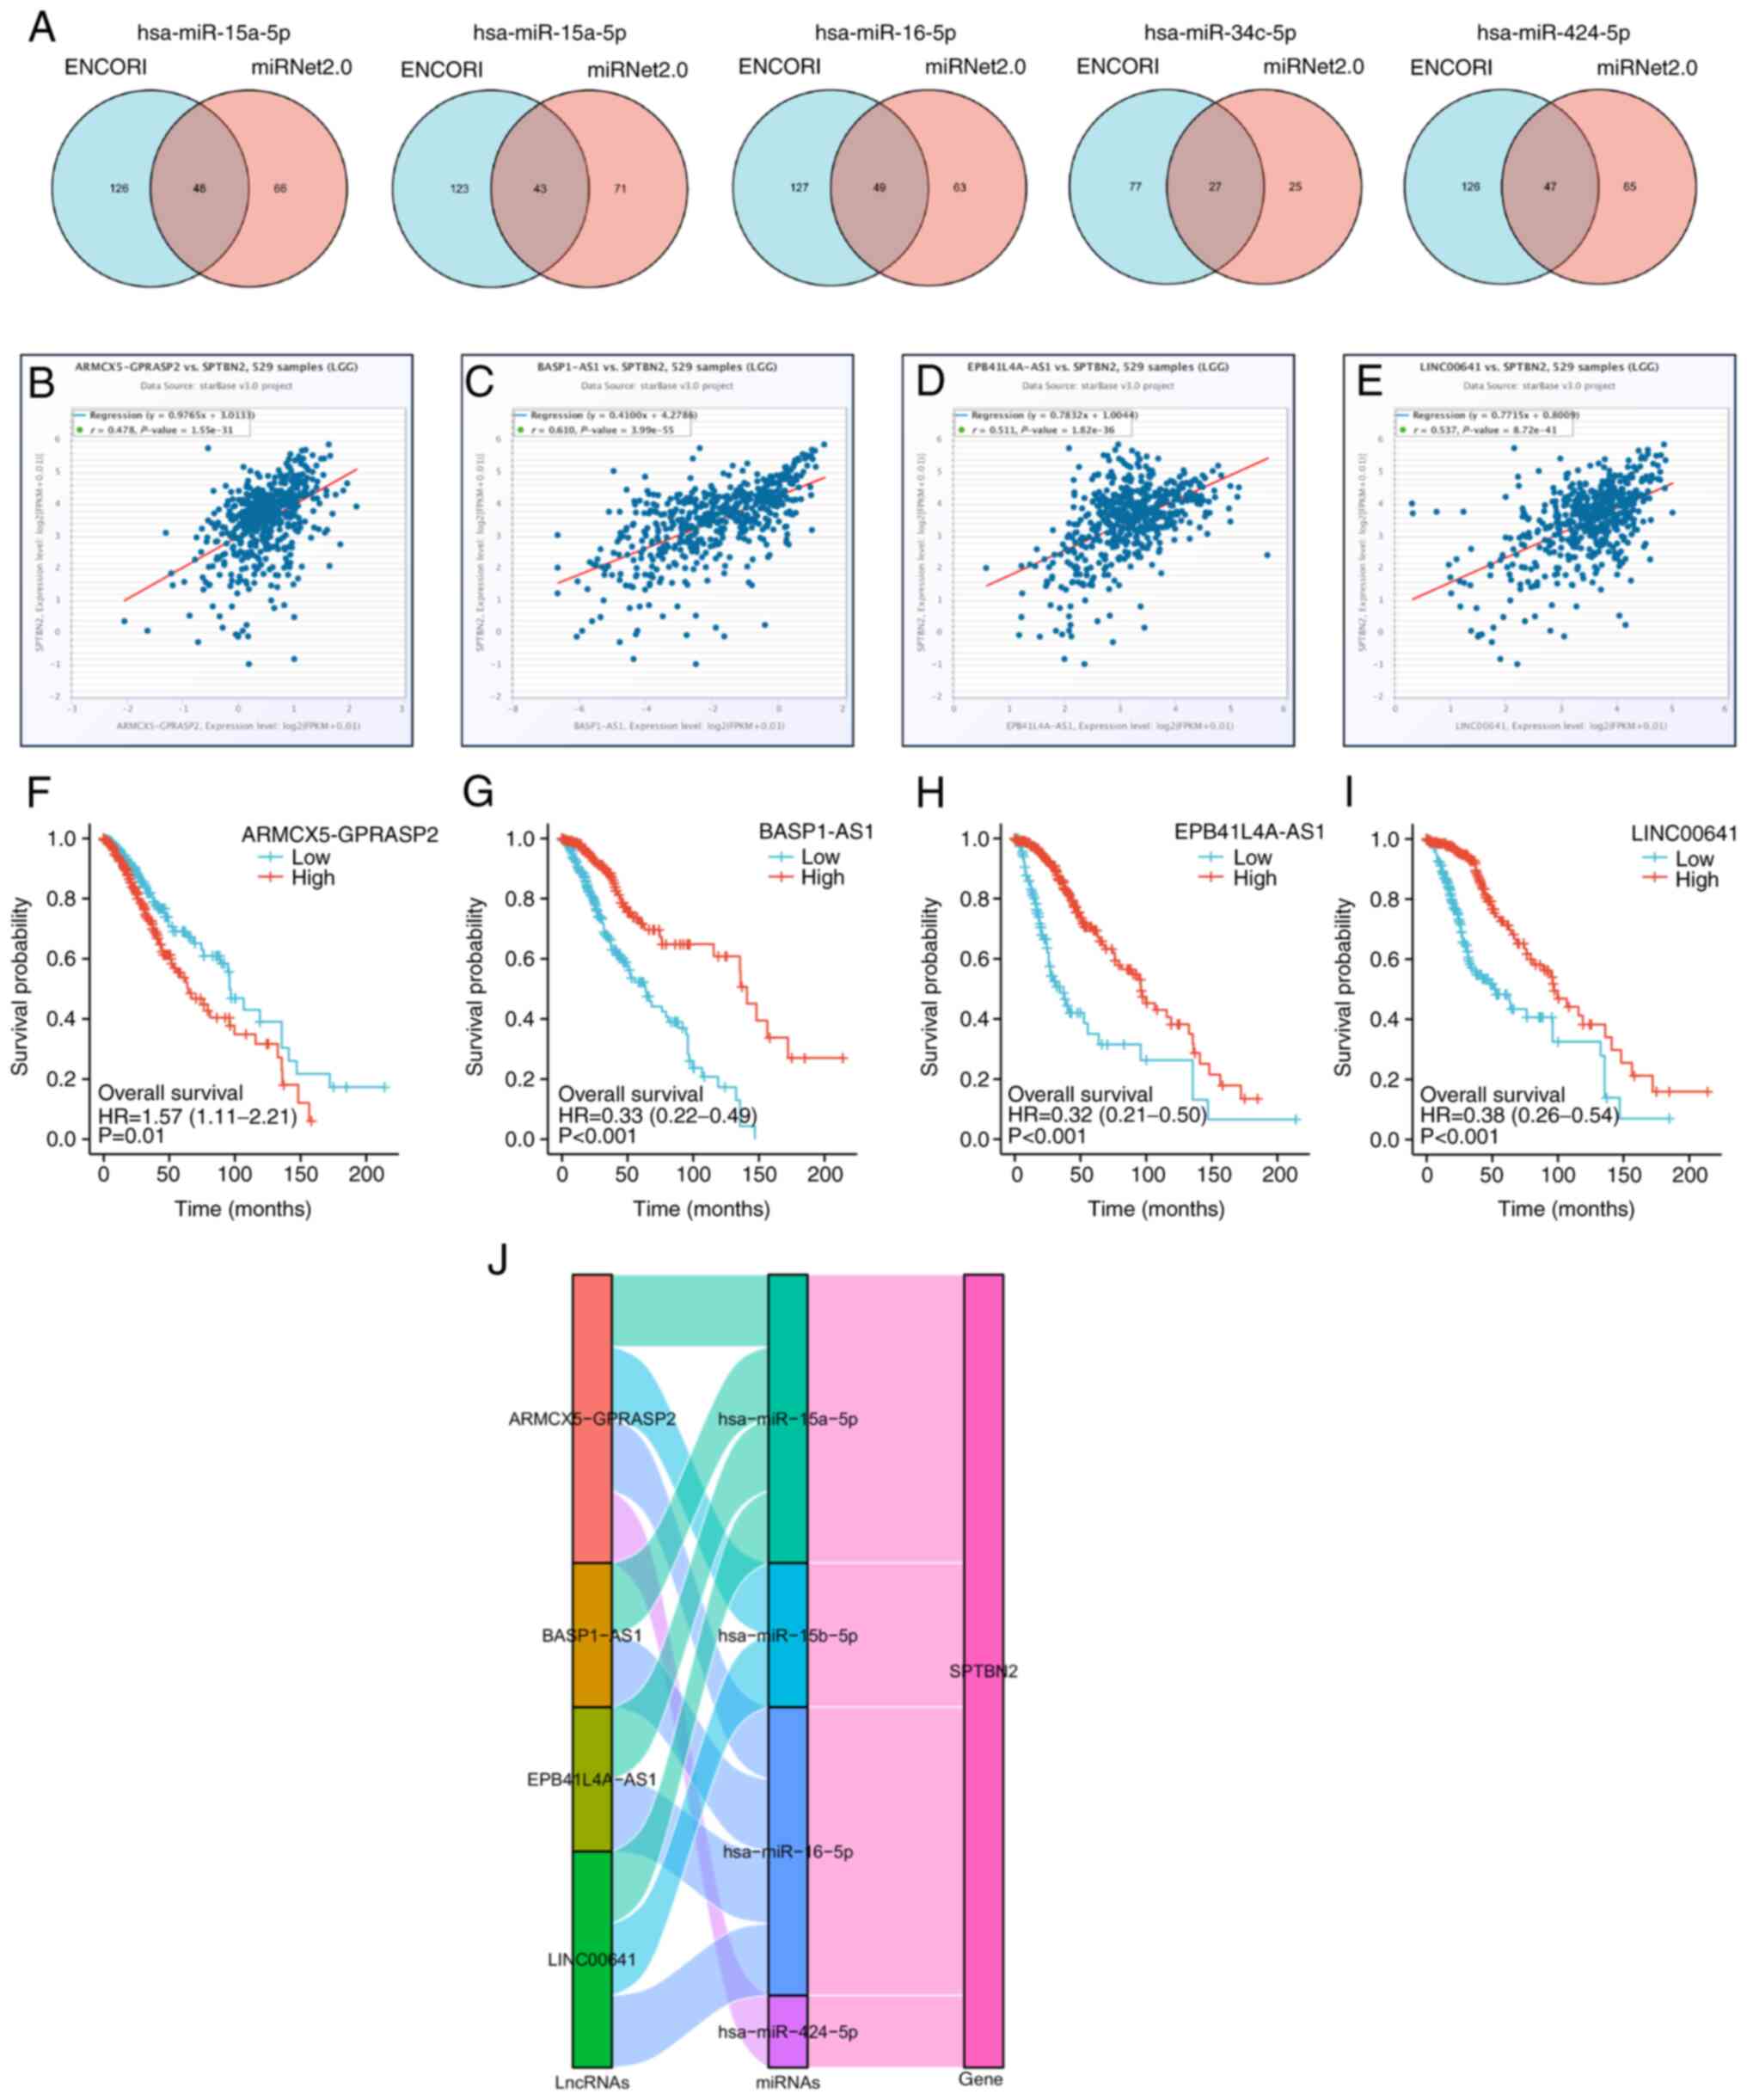
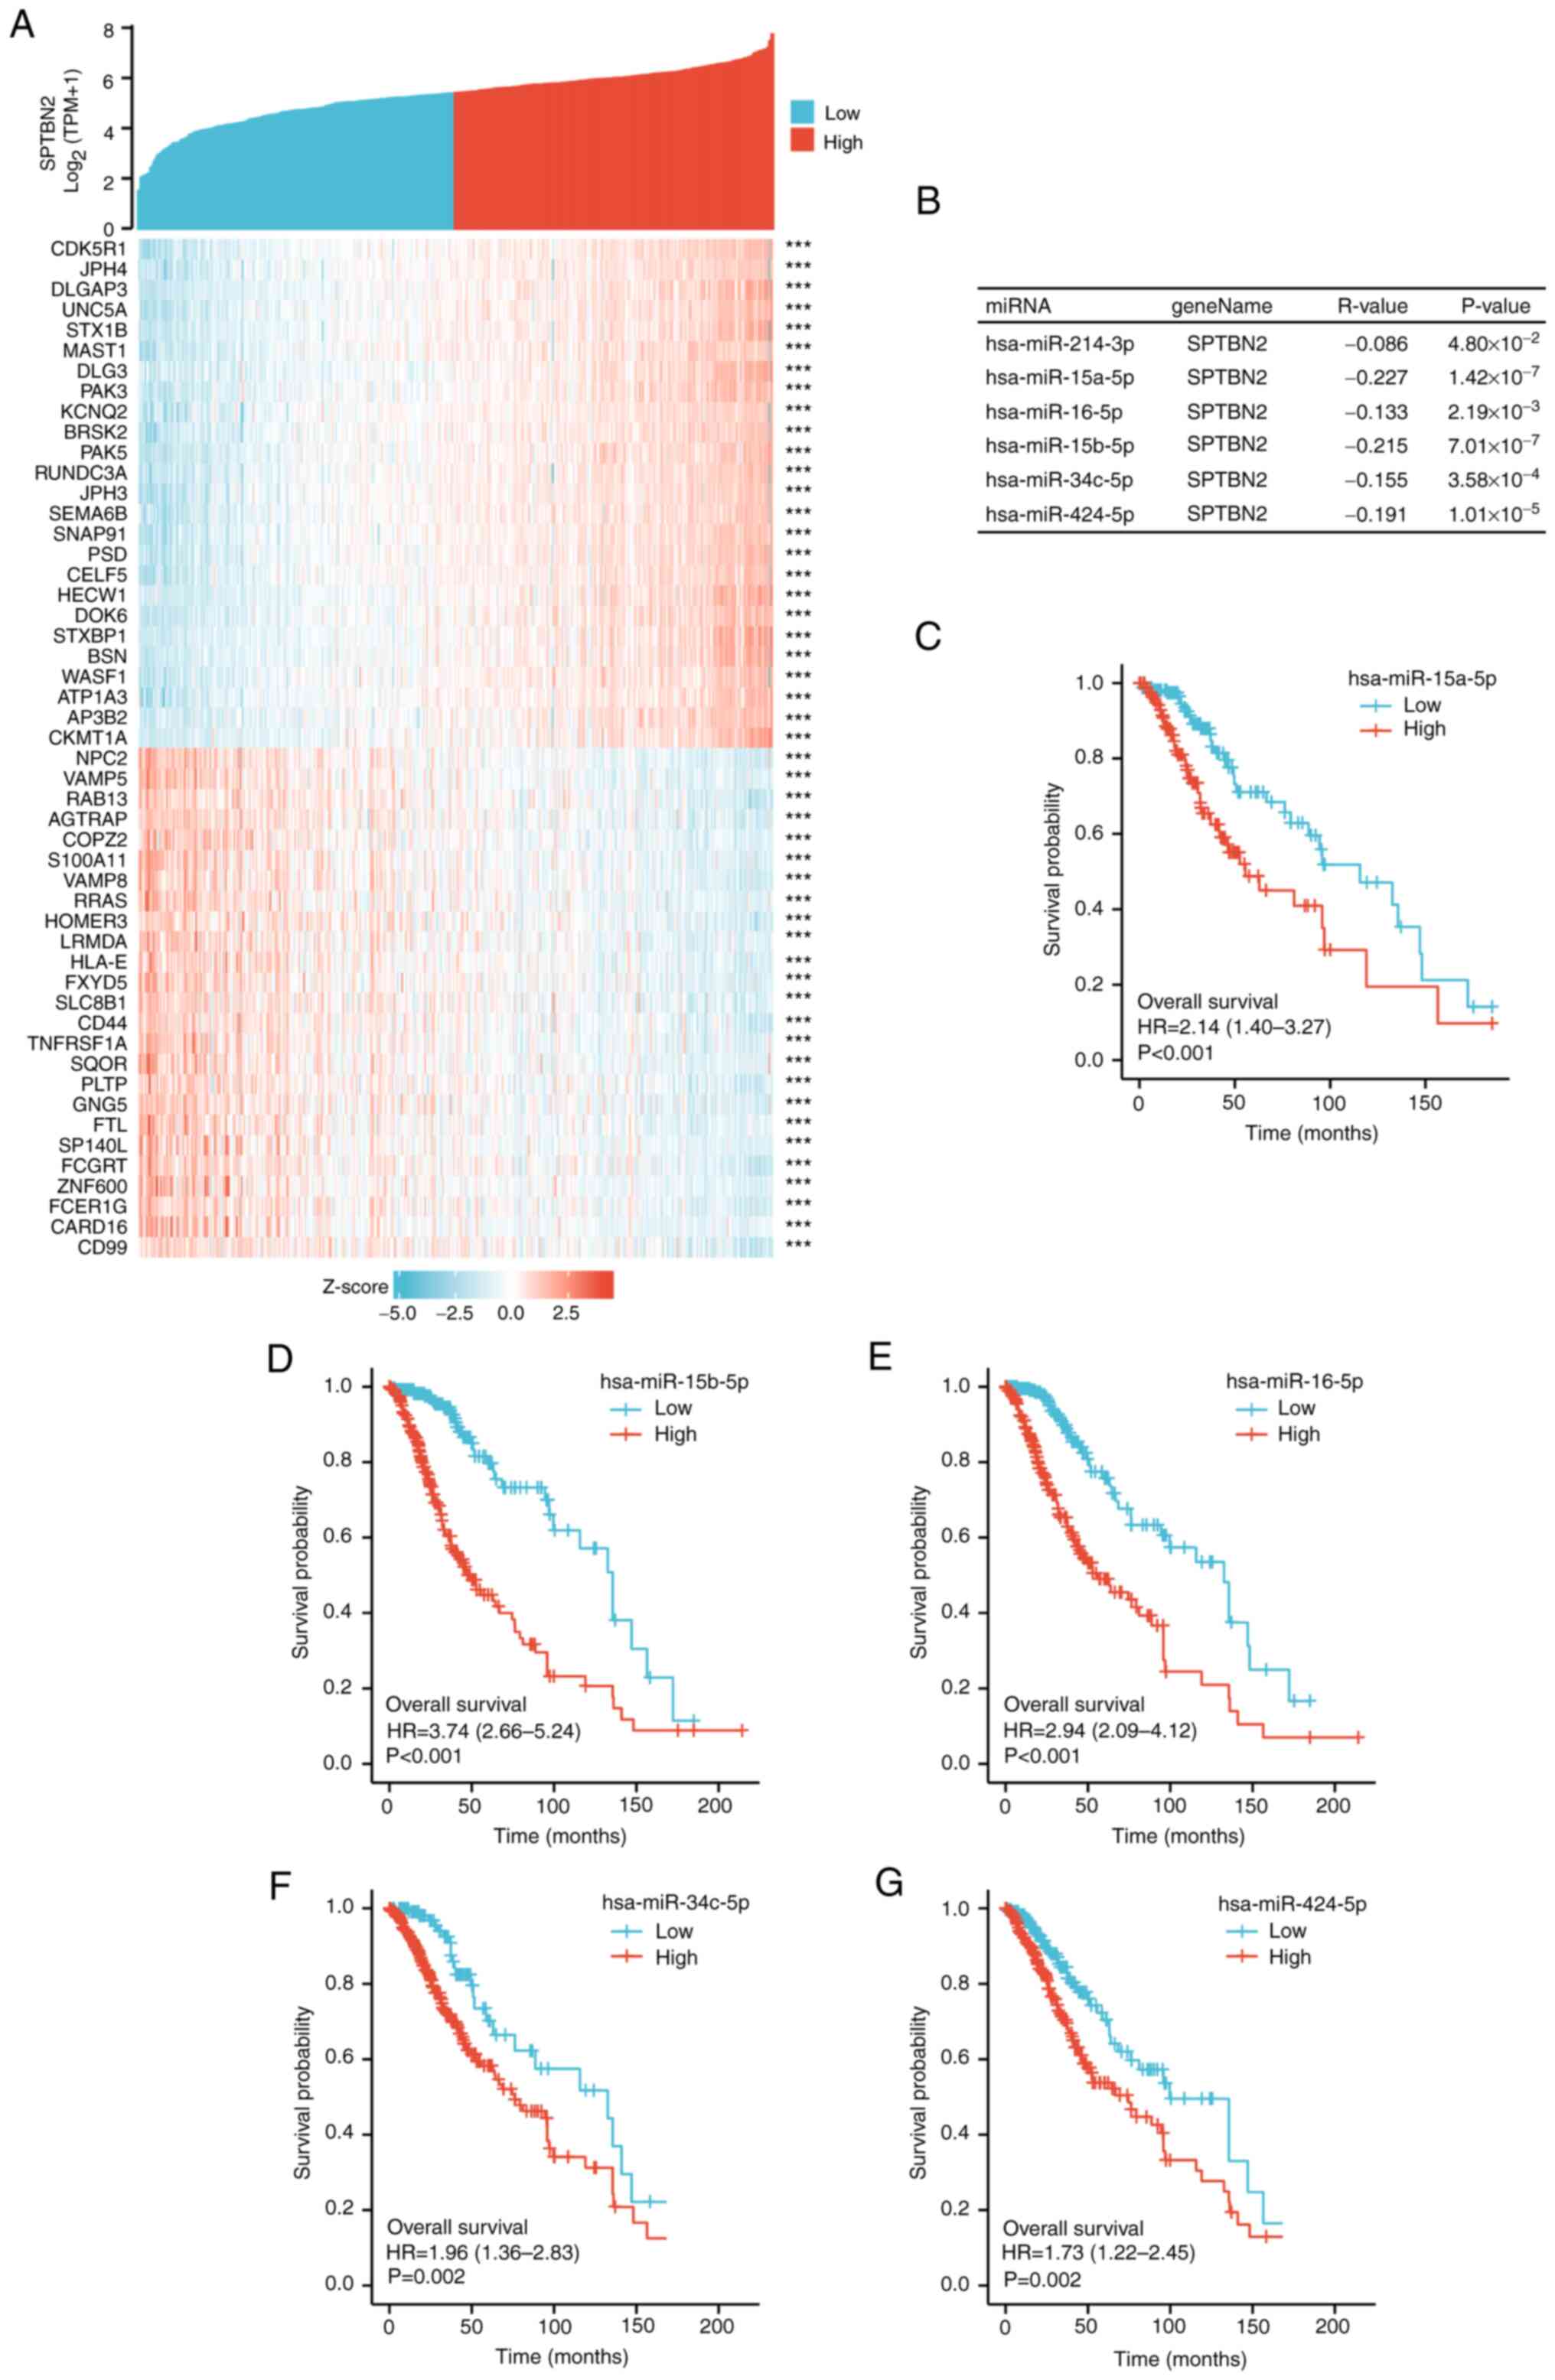 | Figure 4Analysis of candidate miRNAs and
lncRNAs binding to SPTBN2. (A) Heatmap showing the top 50 genes in
LGG that were positively and negatively associated with SPTBN2. Red
represents positively related genes, and blue represents negatively
related genes. (B) All six candidate miRNAs, including
hsa-miR-214-3p, hsa-miR-15a-5p, hsa-miR-16-5p, hsa-miR-15b-5p,
hsa-miR-34c-5p, and hsa-miR-424-5p, that are negatively correlated
with SPTBN2 mRNA expression. (C-G) The R package assessed the
overall survival analysis of 6 candidate miRNAs. Higher expression
of (C) hsa-miR-15a-5p, (D) hsa-miR-15b-5p, (E) hsa-miR-16-5p, (F)
hsa-miR-34c-5p and (G) hsa-miR-424-5p was associated with poor
prognosis. LGG, low-grade glioma; SPTBN2, Spectrin β
non-erythrocytic 2; miR, microRNA. |
Analysis of candidate miRNAs and
lncRNAs that bind to SPTBN2
According to the ceRNA hypothesis (30), miRNAs negatively correlate with
SPTBN2, while lncRNAs correlate positively with SPTBN2.
Candidate miRNAs must negatively correlate with SPTBN2 expression
and be statistically associated with prognosis in LGG (30). Subsequently, candidate lncRNAs that
might bind to the candidate miRNAs were generated using ENCORI. The
enrolled lncRNAs must positively correlate with the expression of
SPTBN2 and the prognosis of low-grade gliomas. MiRNAs and
lncRNAs were rigorously screened out based on the ceRNA
hypothesis.
Predicted miRNAs that could competitively bind to
SPTBN2 were investigated. A total of six candidate miRNAs,
including hsa-miR-214-3p, hsa-miR-15a-5p, hsa-miR-16-5p,
hsa-miR-15b-5p, hsa-miR-34c-5p and hsa-miR-424-5p, were
revealed (Fig. 4B). Higher
expression of five miRNAs, hsa-miR-15a-5p (Fig. 4C), hsa-miR-15b-5p (Fig. 4D), hsa-miR-16-5p (Fig. 4E), hsa-miR-34c-5p (Fig. 4F) and hsa-miR-424-5p (Fig. 4G) were associated with poor
prognosis in LGG. Subsequently, 48 candidate lncRNAs associated
with hsa-miR-15a-5p were regulated in LGG (Fig. 5A), of which 22 candidate lncRNAs
related to hsa-miR-15a-5p were downregulated in LGG. The
statistical significances of four lncRNAs (BASP1-AS1,
EPB41L4A-AS1, LINC00641 and ARMCX5-GPRASP2) for predicting the
prognosis of LGG were obtained, while the statistical significance
of the other 18 LncRNAs were not. In addition, a positive
correlation of candidate lncRNAs and SPTBN2 was revealed by ENCORI
(Fig. 5B-E). A total of 43
candidate lncRNAs associated with hsa-miR-15b-5p were
regulated in LGG (Fig. 5A), of
which 21 candidate lncRNAs related to hsa-miR-15b-5p were
downregulated in LGG. The statistical significances of two lncRNAs
(LINC00641 and ARMCX5-GPRASP2) for predicting the
prognosis of LGG were detected, while the statistical significance
of the other 19 lncRNAs were not. A total of 49 lncRNAs that were
associated with hsa-miR-16-5p underwent regulation in LGG
(Fig. 5A), with 22 of these
lncRNAs experiencing downregulation. The statistical significances
of ARMCX5-GPRASP2 (Fig.
5F), BASP1-AS1 (Fig.
5G), EPB41L4A-AS1 (Fig.
5H), LINC00641 (Fig.
5I) were investigated to predict the prognosis of LGG, while
the statistical significance of the other 18 lncRNAs were not. In
LGG, a total of 27 candidate lncRNAs that were linked to
hsa-miR-34c-5p exhibited regulation, as demonstrated in
Fig. 5A. Among these, 15 candidate
lncRNAs that were associated with hsa-miR-34c-5p were
observed to be downregulated. A significant correlation was not
found between all lncRNAs and prognosis for LGG. A total of 22
candidate lncRNAs associated with hsa-miR-424-5p were
downregulated in LGG. A total of 47 candidate lncRNAs associated
with hsa-miR-424-5p were downregulated in LGG (Fig. 5A), of which 22 candidate lncRNAs
associated with hsa-miR-424-5p were downregulated. Finally,
the statistical significance of four lncRNAs, including
ARMCX5-GPRASP2, BASP1-AS1, EPB41L4A-AS1 and LINC00641, were
detected to predict predict the prognosis of high and low
expression levels in LGG (Fig.
5F-I).. In LGG patients, high expression of ARMCX5-GPRASP2 was
associated with shorter survival time, while low expression of
BASP1-AS1, EPB41L4A-AS1 and LINC00641 was associated with shorter
survival time.
The Sankey diagram presents the
lncRNA-miRNA-SPTBN2 regulatory network according to the
ceRNA hypothesis (Fig. 5J).
Overall, four lncRNAs (ARMCX5-GPRASP2, BASP1-AS1,
EPB41L4A-AS1 and LINC00641) were involved in the
regulation of SPTBN2 via five miRNAs (hsa-miR-15a-5p,
hsa-miR-15b-5p, hsa-miR-16-5p and
hsa-miR-424-5p) in LGG.
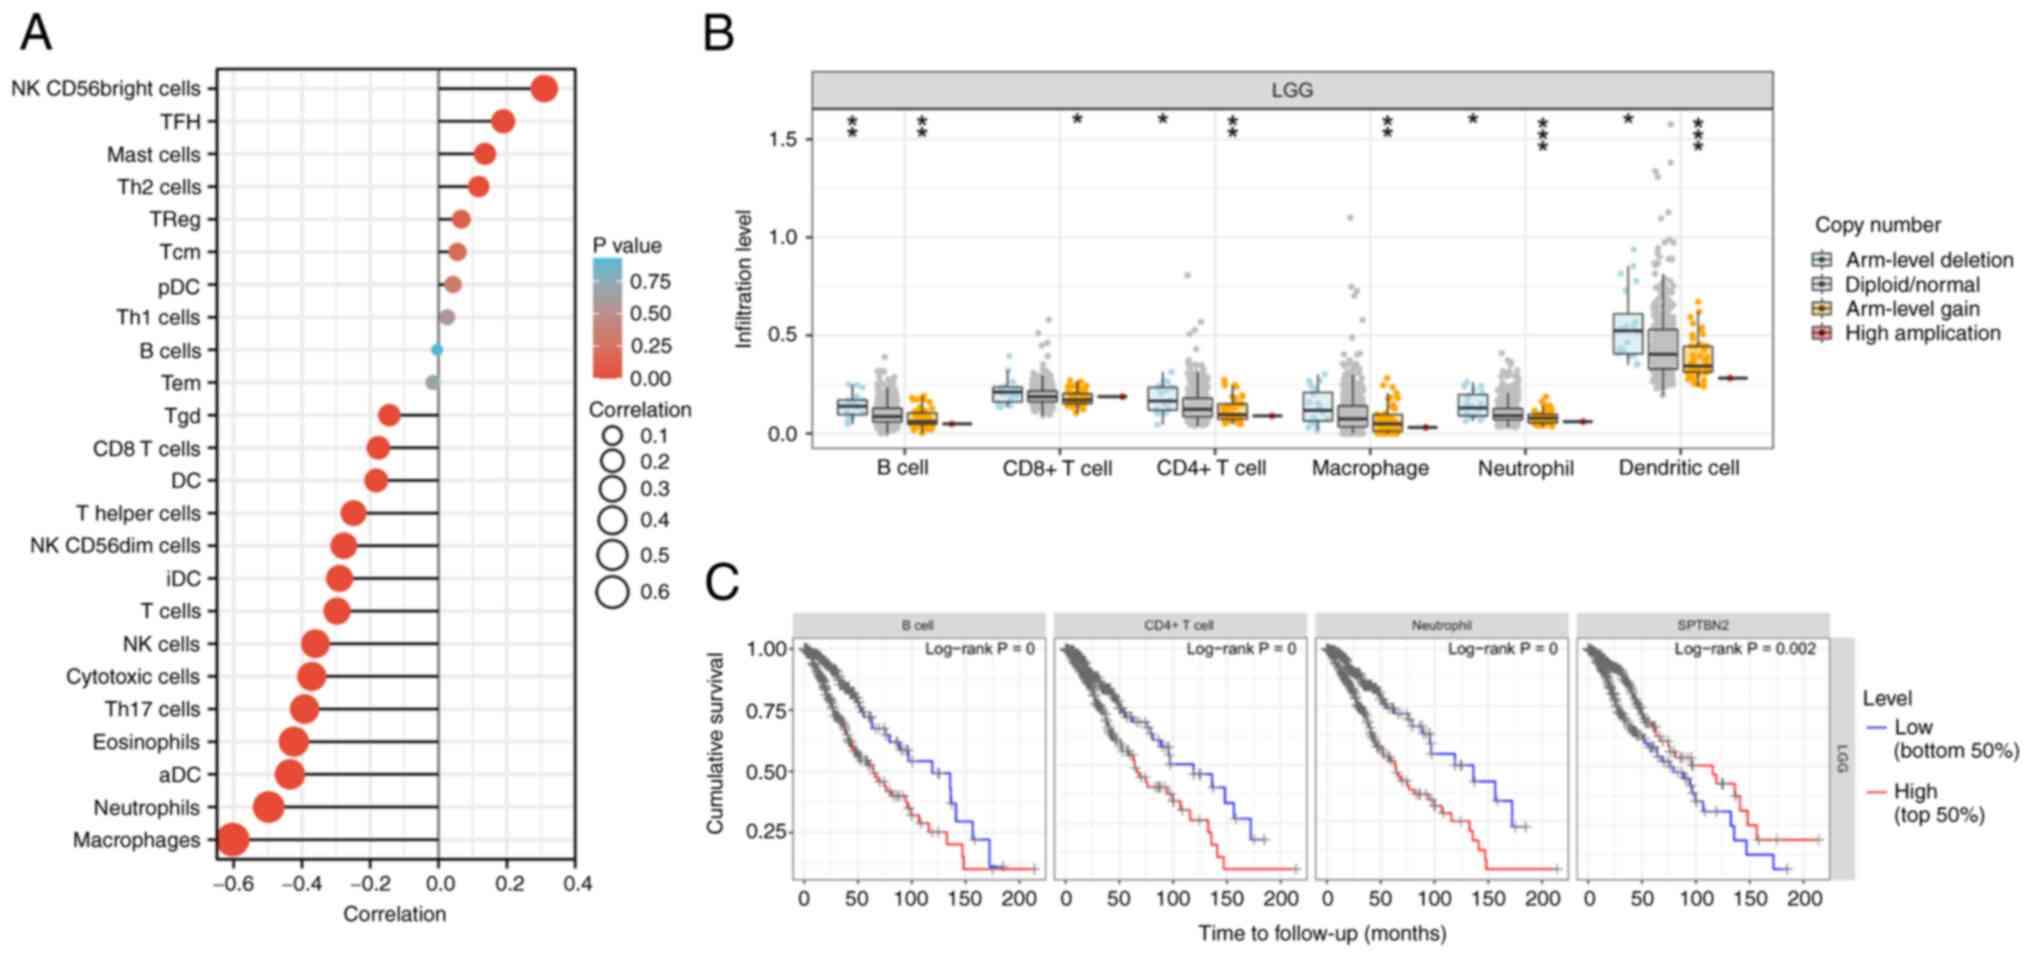
Association of immune cell
infiltration, overall survival, immune checkpoints and SPTBN2 level
in LGG
Infiltration of immune cells, including
‘macrophages’, ‘neutrophils’, ‘dendritic cells’, ‘NK cells’ and ‘T
cells’, were negatively correlated with SPTBN2 expression
(Fig. 6A). In addition,
significant changes in immune cell infiltration with various copy
numbers of SPTBN2 in LGG, including B cells, CD8+
T cells, CD4+ T cells, macrophage, neutrophils, and
dendritic cells were observed (Fig.
6B). Correlation analysis between SPTBN2 and biomarkers
of immune cells in LGG are presented in Table III. The survival module explored
the association between clinical outcomes and the abundance of
SPTBN2-related immune infiltrates (Fig. 6C). Higher immune infiltrates (B
cells, CD4+ cells, neutrophils) and low expression of
SPTBN2 were significantly positively associated with poor
outcomes (Fig. 6C). Moreover,
SPTBN2 mRNA expression was negatively correlated with nine
immune checkpoints: CD274, CTLA4, HAVCR2, IDO1, LAG3, PDCD1,
PDCD1LG2, SIGLEC15 and TIGIT (Fig.
7).
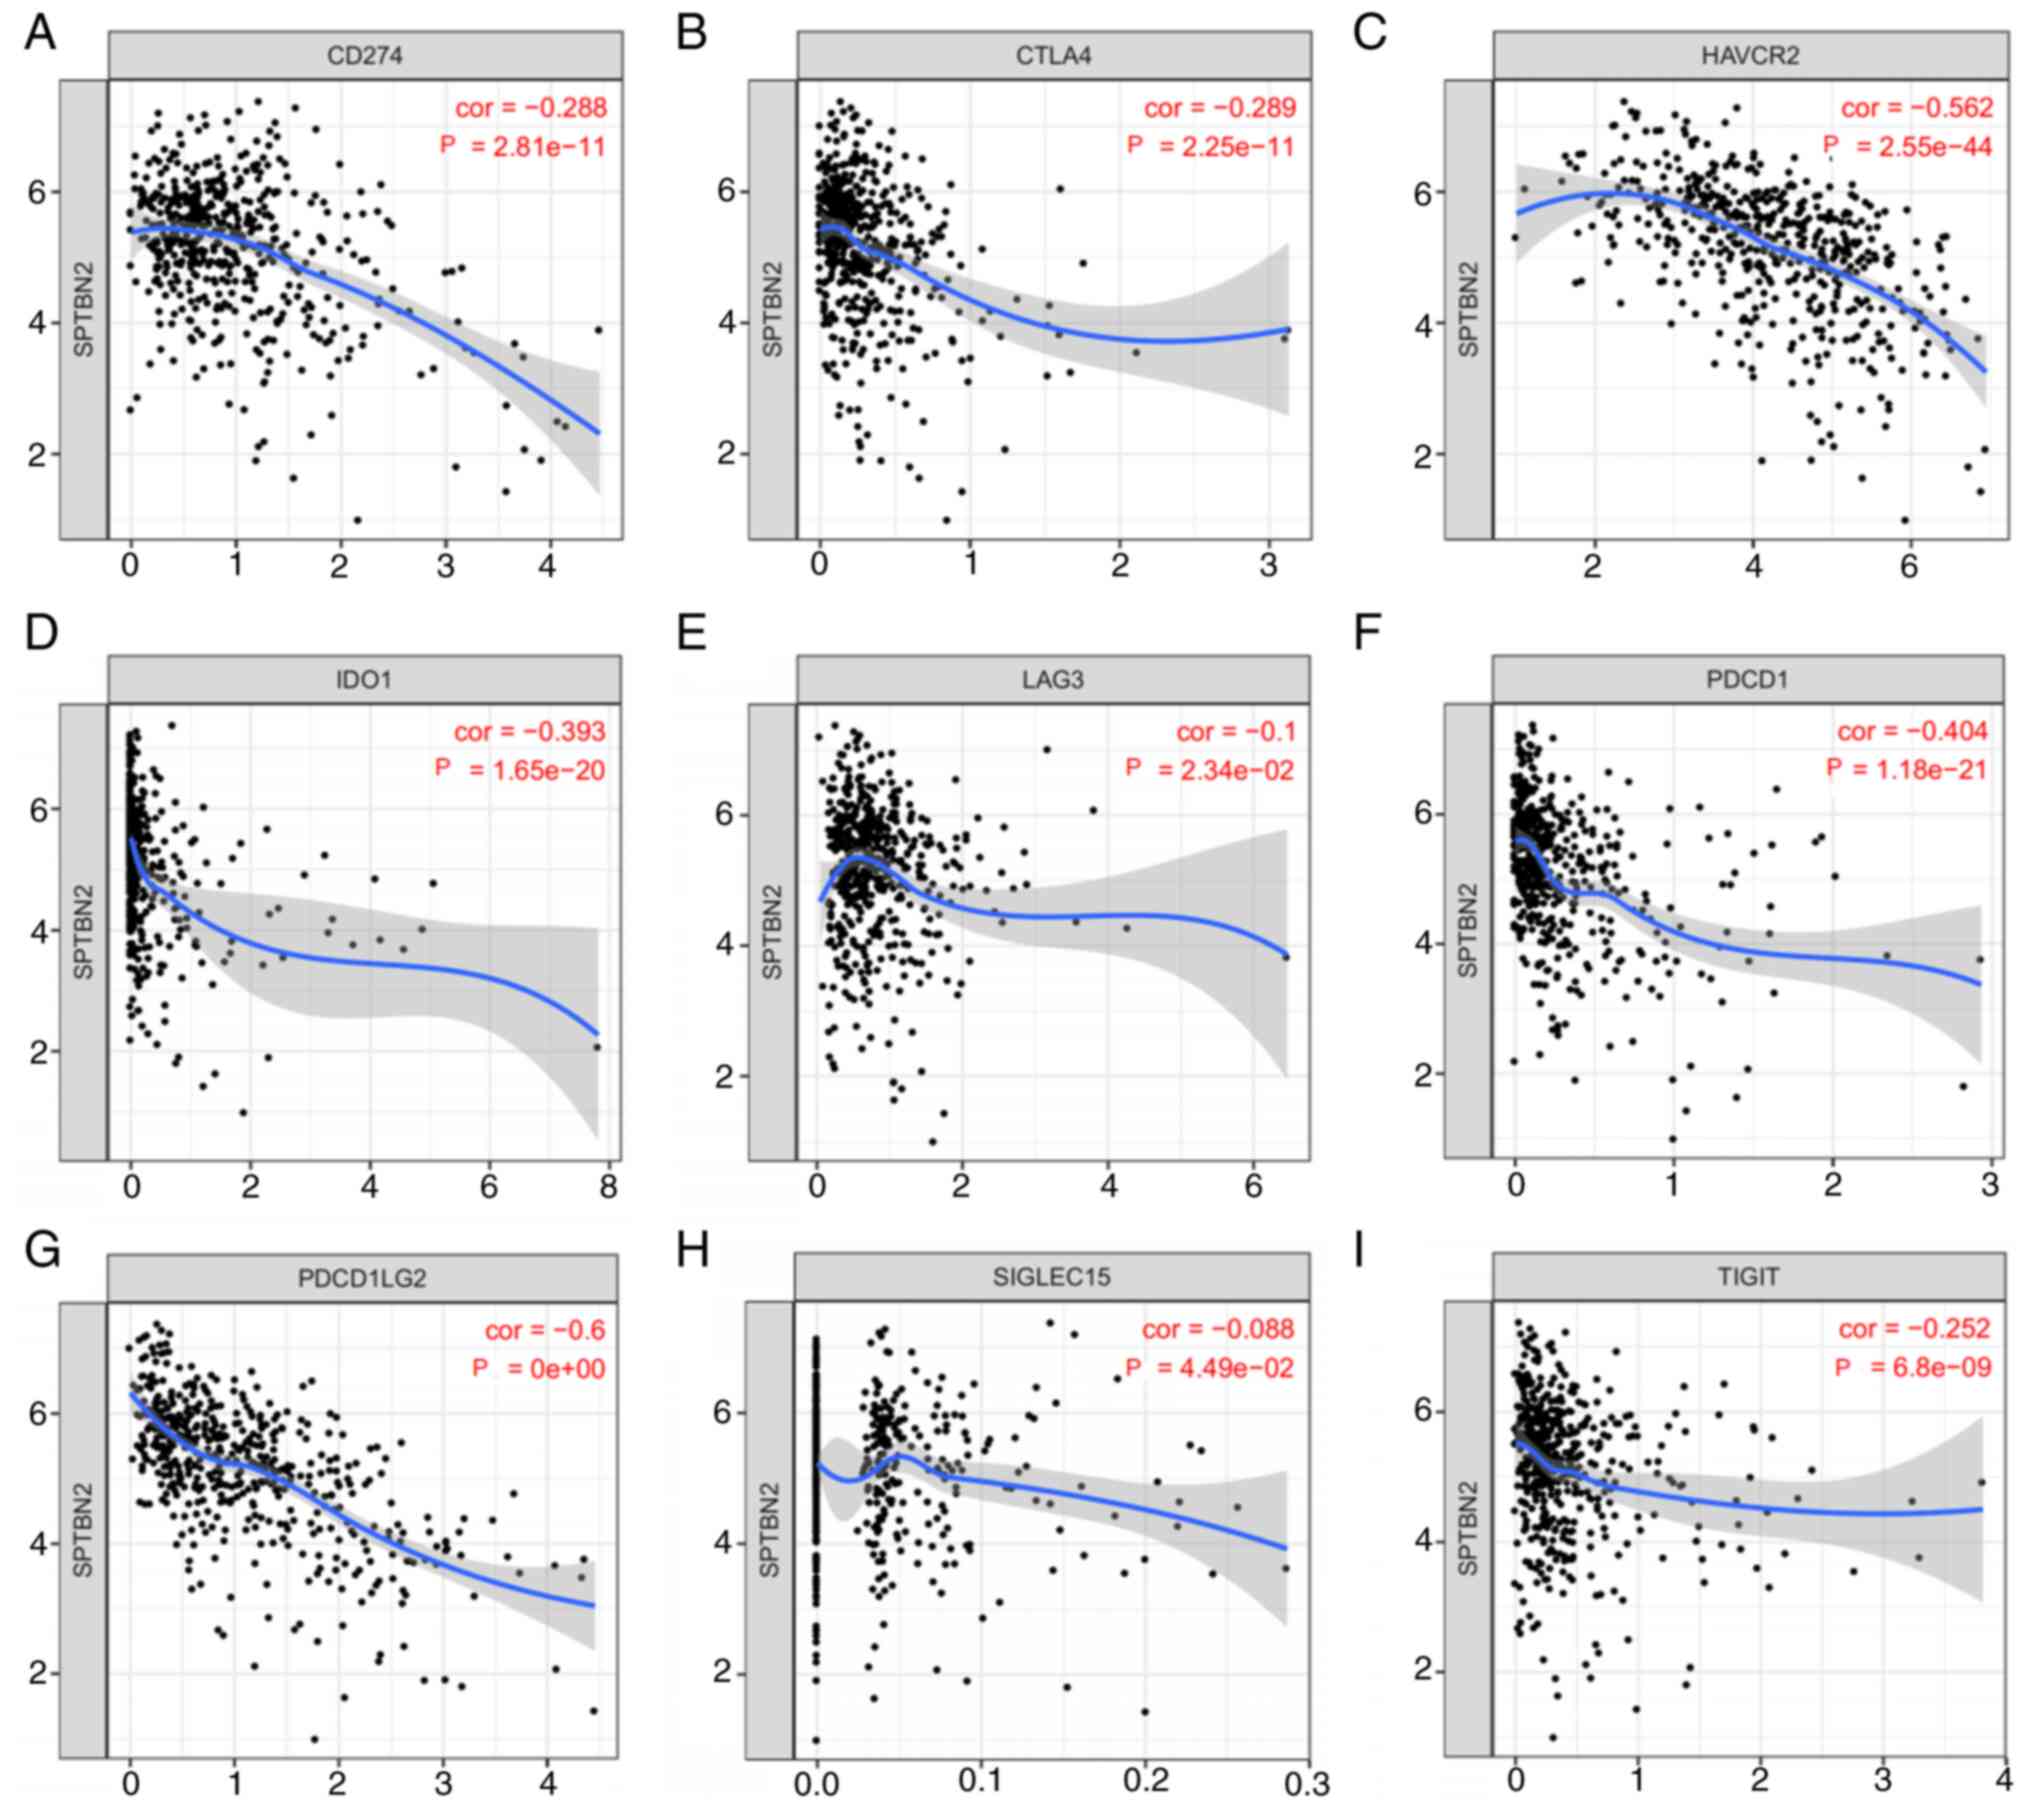 | Figure 7Relationship between SPTBN2 and
immune checkpoints in LGG. SPTBN2 expression and immune checkpoints
in LGG were assessed. SPTBN2 mRNA expression was
significantly negatively correlated with (A) CD274, (B)
CTLA4, (C) HAVCR2, (D) IDO1, (E) LAG3,
(F) PDCD1, (G) PDCD1LG2, (H) SIGLEC15 and (I)
TIGIT. CD274, cluster of differentiation 274;
PDCD1, programmed cell death 1; CTLA4, cytotoxic T
lymphocyte antigen 4; SIGLEC15, sialic acid-binding
immunoglobulin-like lectin 15; TIGIT, T cell immunoreceptor
with Ig and immunoreceptor tyrosine-based inhibitory domains;
HAVCR2, hepatitis A virus cellular receptor 2; LAG3,
lymphocyte activation gene-3; IDO1, indoleamine
2,3-dioxygenase 1; PDCD1LG2, programmed cell death 1 ligand
2. |
| Table IIICorrelation analysis between SPTBN2
and biomarkers of immune cells in LGG. |
Table III
Correlation analysis between SPTBN2
and biomarkers of immune cells in LGG.
| Immune cells | Biomarker | R value | P-value |
|---|
| T cell
(general) | CD3D | -0.26 |
3.5x10⁻⁹ |
| | CD3E | -0.26 |
2.6x10⁻⁹ |
| | CD2 | -0.26 |
2.7x10⁻⁹ |
| CD8+ T
cell | CD8A | -0.07 |
1.0x10⁻¹ |
| | CD8B | -0.24 |
2.9x10⁻⁸ |
| Tumor-associated
macrophages | CCL2 | -0.18 |
4.0x10⁻⁵ |
| | CD68 | -0.41 |
2.1x10⁻²² |
| B Cell | CD19 | -0.13 |
3.8x10⁻³ |
| | CD79A | -0.1 |
1.8x10⁻² |
| Macrophage/M1 | NOS2 | -0.03 |
5.6x10⁻¹ |
| | IRF5 | -0.43 |
2.6x10⁻²⁵ |
| | PTGS2 | 0.08 |
7.1x10⁻² |
| Macrophage/M2 | CD163 | -0.25 |
7.6x10⁻⁹ |
| | VSIG4 | -0.34 |
4.3x10⁻¹⁵ |
| | MS4A4A | -0.31 |
3.3x10⁻¹³ |
| Neutrophil | CEACAM8 | -0.07 |
1.4x10⁻¹ |
| | ITGAM | -0.4 |
2.0x10⁻²¹ |
| | CCR7 | -0.15 |
7.3x10⁻⁴ |
| Natural killer
cell | KIR2DL1 | -0.09 |
4.0x10⁻² |
| | KIR2DL3 | -0.11 |
8.9x10⁻³ |
| | KIR2DL4 | -0.22 |
6.7x10⁻⁷ |
| | KIR3DL1 | -0.15 |
6.8x10⁻⁴ |
| | KIR3DL2 | -0.16 |
3.3x10⁻⁴ |
| | KIR3DL2 | -0.16 |
3.3x10⁻⁴ |
| | KIR2DS4 | -0.09 |
4.5x10⁻² |
| Dendritic
cells | HLA-DPB1 | -0.35 |
9.1x10⁻¹⁷ |
| | HLA-DQB1 | -0.28 |
8.6x10⁻¹¹ |
| | HLA-DRA | -0.36 |
3.6x10⁻¹⁷ |
| | HLA-DPA1 | -0.32 |
3.6x10⁻¹⁴ |
| | CD11c/ITGAX | -0.36 |
2.0x10⁻¹⁷ |
Discussion
Management of patients with low-grade gliomas is
mainly based on clinical prognostic factors. Median survival varies
from 3.2 (high-risk LGG) to 7.8 years (low-risk LGG) (31). Despite improved advances in
diagnosis and therapeutic techniques, the majority of LGGs progress
clinically to GBM over time (7).
Moreover, high-risk LGGs resemble GBM and correlate with poor
outcomes (32). Evidence suggests
that SPTBN2 plays important roles in tumor initiation and
progression in multiple types of human cancer, including ovarian
cancer, endometrioid endometrial cancer and lung cancer
adenocarcinoma (13,15). However, the expression, function,
and molecular mechanism of SPTBN2 in LGG remain unclear.
The present study conducted a pan-cancer analysis
of the expression of SPTBN2 using TCGA and GTEx data. Previous
studies have indicated that SPTBN2 is highly expressed in
lung adenocarcinoma and endometrioid endometrial cancer, is
positively correlated with unfavorable prognosis and promotes
cancer proliferation, invasion, and migration of cells (13,15).
In the present study, the TCGA and GTEx databases analysis revealed
a statistically significant decrease in SPTBN2 expression in
LGG samples compared with normal tissues. SPTBN2 has been
previously reported in the development of neurological disorders
and cancer (13,15). The low expression of SPTBN2
may be associated with the expression of tumor suppressors in LGG
(16). Additionally, SPTBN2
has recently been identified as a key gene in the development of
seven different types of cancer, and it has been identified as a
marker for the recognition of cancer patterns (33). However, survival analysis indicated
that patients with LGG with low expression SPTBN2 had a
worse prognosis. An age >40 years has been reported to be
associated with an inferior prognosis (34). Known favorable molecular prognostic
factors of LGG contain codeletion of chromosome 1p/19q and
isocitrate dehydrogenase mutation (31). IDH wild-type LGGs mimicking
high-grade gliomas are associated with poor outcomes (32). The present study revealed that low
expression of SPTBN2 was significantly correlated with older
adults (>40 years), 1p/19q non-codeletion and wild-type IDH
status, which were associated with an unfavorable outcome.
It is well known that ncRNAs, including miRNAs and
lncRNAs, play key roles in regulating gene expression via the ceRNA
mechanism (14,15,35).
The present study used seven prediction programs to identify the
candidate miRNAs of SPTBN2. Lastly, six miRNAs were
obtained, including hsa-miR-214-3p, hsa-miR-15a-5p,
hsa-miR-16-5p, hsa-miR-15b-5p, hsa-miR-34c-5p, and
hsa-miR-424-5p. In addition, 5 miRNAs, including
hsa-miR-15a-5p, hsa-miR-16-5p, hsa-miR-15b-5p, hsa-miR-34c-5p
and hsa-miR-424-5p, had pro-tumorigenic effects and were
correlated with poor prognosis in LGG. Higher expression of
hsa-miR-15b-5p has been reported to be associated with a
short survival time of patients with LGG (36). Has-miR-15a-5p promotes the
proliferation and invasion of colorectal cancer by targeting
CCND1(37). Hsa-mir-16-5p is
downregulated in giant cell tumors (38). Ectopic expression of hsa-miR-424-5p
leads to enhanced growth of gastric cancer cells by targeting
LATS1(39). The present study
revealed that higher expression levels of hsa-miR-15a-5p,
hsa-miR-16-5p, hsa-miR-34c-5p and hsa-miR-424-5p, were
correlated with lower SPTBN2 mRNA expression and unfavorable
prognosis in LGG. SPTBN2 was associated with poor prognosis
and regulated by miRNA-1827 in ovarian cancer (16). SPTBN2 was also a target of
miR-424-5p and promoted endometrial cancer metastasis via
the PI3K/AKT pathway (15).
Based on the ceRNA hypothesis, the potential
lncRNAs were positively related to SPTBN2 in LGG (30). A comprehensive, integrated analysis
of lncRNAs indicated that the four most promising lncRNAs,
including ARMCX5-GPRASP2, BASP1-AS1, EPB41L4A-AS1 and
LINC00641, were associated with SPTBN2 mRNA expression
and prognosis of LGG. Higher expression levels of BASP-AS1,
EPB41L4A-AS1 and LINC00641 were associated with a favorable
outcome of LGG, while higher expression of ARMCX5-GPRASP2
correlated with poor prognosis in LGG. BASP1-AS1 is a
protective lncRNA and significantly impacts the proliferation of
glioma cells (40). Functionally,
the ectopic expression of BASP1-AS1 promotes cell
proliferation and invasion in melanoma (41). LINC00641 is differentially
expressed in various tumors and is associated with a poor prognosis
(42). Decreased LINC00641
leads to changes in tumor proliferation (42). Yang et al revealed that
reduced expression of LINC00641 is observed in glioma, and
overexpression of LINC00641 promotes apoptosis of glioma
(43).
Nevertheless, the role of ARMCX5-GPRASP2 and
EPB41L4A-AS1 in predicting prognosis in LGG remains unclear.
Low expression of EPB41L4A-AS1 has been detected in multiple
types of human cancer and is associated with poor prognosis
(44). EPB41L4A-AS1
functions as a repressor of the Warburg effect and plays a notable
role in the metabolic reprogramming of cancer (44). EPB41L4A-AS1 also functions
as an oncogene by regulating the Rho/ROCK pathway in colon cancer
(45). The deletion of
ARMCX5-GPRASP2 has been associated with the novel Xq22.1
deletion syndrome in a male patient with multiple congenital
abnormalities (46). The present
study revealed that higher expression of ARMCX5-GPRASP2
correlated with poor prognosis in LGG.
Previous studies have indicated that
LINC01605 can regulate m6A modification of SPTBN2 mRNA in
colorectal cancer (27). In a
lncRNA-miRNA-mRNA network of bladder cancer, SPTBN2 and
hsa-miR-590-3p affect the prognosis of patients with bladder
cancer (14). Collectively,
according to the ceRNA hypothesis, the Sankey plot can demonstrate
the pathways by which low SPTBN2 expression is associated
with poor prognosis in LGG. The Sankey plot illustrates the
lncRNA-miRNA-SPTBN2 regulatory network based on the ceRNA
hypothesis. In LGG, four lncRNAs (ARMCX5-GPRASP2, BASP1-AS1,
EPB41L4A-AS1 and LINC00641) were regulated through five miRNAs
(hsa-miR-15a-5p, hsa-miR-15b-5p, hsa-miR-16-5p, hsa-miR-34c
-5p and hsa-miR-424-5p) were involved in the regulation
of SPTBN2. Candidate miRNAs, lncRNAs, and SPTBN2 expression were
observed to correlate with poor LGG prognosis.
Tumor cells frequently interact with the
microenvironment and a variety of immune cells. Moreover, the tumor
microenvironment has been shown to affect response to immune
checkpoint blockade (47). An
immune checkpoint blockade takes advantage of tumor immune
infiltration to launch an effective immune response (47). The present study suggested that
significant changes in immune infiltration with various copy
numbers of SPTBN2, including B cells, CD8+ T cells,
CD4+ T cells, macrophages, neutrophils and dendritic
cells, were observed in LGG. Furthermore, higher immune cell
infiltration (B cells, CD8+ cells, CD4+
cells, macrophages, neutrophils and dendritic cells) and low
expression of SPTBN2 were significantly positively associated with
poor outcomes. A previous study revealed that SPTBN2 generates
adverse effects on the reduced infiltration of CD4+ T
cells and leads to an unsatisfactory outcome in ovarian cancer
(16). The present study also
assessed the relationship between SPTBN2 and immune checkpoints.
The results demonstrated that SPTBN2 mRNA expression was
significantly negatively correlated with nine immune checkpoints,
indicating that targeting SPTBN2 might increase the efficacy of
immunotherapy in LGG. However, future experiments are required to
ascertain the correlation between SPTBN2 and tumor immunity
in LGG.
In summary, we elucidated that SPTBN2 was
lowly expressed and correlated with an unfavorable prognosis in
LGG. We identified 6miRNAs and four lncRNAs being able to modulate
SPTBN2 in an lncRNA-miRNA-mRNA network of LGG. Furthermore,
our current findings also indicated that SPTBN2 possessed
anti-tumor roles via regulating tumor immune infiltration and
immune checkpoint expression. However, these results should be
validated by more basic experiments and clinical trials in the
future.
Supplementary Material
The Cancer Genome Atlas cancer types
analyzed (n=33).
Acknowledgements
Not applicable.
Funding
Funding: The study was supported by the Excellent Talent Project
of the First Affiliated Hospital of Fujian Medical University
(grant no. YYXQN-YPS2021), Fujian Clinical Research Center for
Neurological Disease (grant no. SSJ-YJZX-1) and Fujian Key
Laboratory of Precision Medicine for Cancer (grant no.
ZLZDSYS-2020).
Availability of data and materials
The datasets analyzed in this study are available
in the following open access repositories. TGGA: The Cancer Genome
Atlas (TCGA) database (https://tcga-data.nci.nih.gov/tcga/; version V33.0;
release date, May 3, 2022; dbGaP Study accession no. phs001145),
GEPIA (http://gepia.cancer-pku.cn/detail.php; accessed on 16
August 2022; accession no. GEPIA2), ENCORI (http://starbase.sysu.edu.cn; accessed on 16 August
2022), miRNet2.0 (www.mirnet.ca/miRNet/home.xhtml; accessed on 16
August 2022), The UCSC Xena database (http://xena.ucsc.edu/; accessed on 16 August 2022)
and TIMER (https://cistrome.shinyapps.io/timer/; accessed on 16
August 2022). The datasets used and/or analyzed during the current
study are available from the corresponding author on reasonable
request.
Authors' contributions
GRC, YBZ, SFZ, DZK and PSY designed the study. YBZ,
GRC, PL and HCSG performed all bioinformatic analyses. GRC, YBZ and
YWX completed the experiments. GRC, YXL, and PSY confirm the
authenticity of all the raw data. YXL and DZK acquired the data,
and analyzed and interpreted the data. GRC, YBZ, SFZ, and PSY
drafted the manuscript. YBZ, YWX, PL and HCSG prepared the figures
and interpreted the results. PSY and DZK were identified as the
guarantors of the paper, taking responsibility for the integrity of
the work as a whole. All authors read and approved the final
manuscript.
Ethics approval and consent to
participate
The present study was approved by the Ethics
Committee of the First Affiliated Hospital of Fujian Medical
University [approval no. MRCTA, ECFAH of FMU(2022)509]. Written
informed consents were obtained from all enrolled individuals prior
to their participation.
Patient consent for publication
Not applicable.
Competing interests
The authors declare that they have no competing
interests.
References
|
1
|
Hua D, Tang L, Wang W, Tang S, Yu L, Zhou
X, Wang Q, Sun C, Shi C, Luo W, et al: Improved antiglioblastoma
activity and BBB permeability by conjugation of paclitaxel to a
cell-penetrative MMP-2-cleavable peptide. Adv Sci (Weinh).
8(2001960)2021.PubMed/NCBI View Article : Google Scholar
|
|
2
|
Lapointe S, Perry A and Butowski NA:
Primary brain tumours in adults. Lancet. 392:432–446.
2018.PubMed/NCBI View Article : Google Scholar
|
|
3
|
Lin W, Huang Z, Xu Y, Chen X, Chen T, Ye
Y, Ding J, Chen Z, Chen L, Qiu X and Qiu S: A three-lncRNA
signature predicts clinical outcomes in low-grade glioma patients
after radiotherapy. Aging. 12:9188–9204. 2020.PubMed/NCBI View Article : Google Scholar
|
|
4
|
Bhanja D, Ba D, Tuohy K, Wilding H, Trifoi
M, Padmanaban V, Liu G, Sughrue M, Zacharia B, Leslie D and
Mansouri A: Association of low-grade glioma diagnosis and
management approach with mental health disorders: A MarketScan
analysis 2005-2014. Cancers (Basel). 14(1376)2022.PubMed/NCBI View Article : Google Scholar
|
|
5
|
Pallud J, Le Van Quyen M, Bielle F,
Pellegrino C, Varlet P, Cresto N, Baulac M, Duyckaerts C,
Kourdougli N, Chazal G, et al: Cortical GABAergic excitation
contributes to epileptic activities around human glioma. Sci Transl
Med. 6(244ra89)2014.PubMed/NCBI View Article : Google Scholar
|
|
6
|
Smoll NR, Gautschi OP, Schatlo B, Schaller
K and Weber DC: Relative survival of patients with supratentorial
low-grade gliomas. Neuro Oncol. 14:1062–1069. 2012.PubMed/NCBI View Article : Google Scholar
|
|
7
|
Mistry M, Zhukova N, Merico D, Rakopoulos
P, Krishnatry R, Shago M, Stavropoulos J, Alon N, Pole JD, Ray PN,
et al: BRAF mutation and CDKN2A deletion define a clinically
distinct subgroup of childhood secondary high-grade glioma. J Clin
Oncol. 33:1015–1022. 2015.PubMed/NCBI View Article : Google Scholar
|
|
8
|
Bell EH, Zhang P, Shaw EG, Buckner JC,
Barger GR, Bullard DE, Mehta MP, Gilbert MR, Brown PD, Stelzer KJ,
et al: Comprehensive genomic analysis in NRG oncology/RTOG 9802: A
phase III trial of radiation versus radiation plus procarbazine,
lomustine (CCNU), and vincristine in high-risk low-grade glioma. J
Clin Oncol. 38:3407–3417. 2020.PubMed/NCBI View Article : Google Scholar
|
|
9
|
Reuss DE, Sahm F, Schrimpf D, Wiestler B,
Capper D, Koelsche C, Schweizer L, Korshunov A, Jones DT, Hovestadt
V, et al: ATRX and IDH1-R132H immunohistochemistry with subsequent
copy number analysis and IDH sequencing as a basis for an
‘integrated’ diagnostic approach for adult astrocytoma,
oligodendroglioma and glioblastoma. Acta Neuropathol. 129:133–146.
2015.PubMed/NCBI View Article : Google Scholar
|
|
10
|
Lise S, Clarkson Y, Perkins E, Kwasniewska
A, Sadighi Akha E, Schnekenberg RP, Suminaite D, Hope J, Baker I,
Gregory L, et al: Recessive mutations in SPTBN2 implicate β-III
spectrin in both cognitive and motor development. PLoS Genet.
8(e1003074)2012.PubMed/NCBI View Article : Google Scholar
|
|
11
|
Ikeda Y, Dick KA, Weatherspoon MR, Gincel
D, Armbrust KR, Dalton JC, Stevanin G, Dürr A, Zühlke C, Bürk K, et
al: Spectrin mutations cause spinocerebellar ataxia type 5. Nat
Genet. 38:184–190. 2006.PubMed/NCBI View
Article : Google Scholar
|
|
12
|
Yang Z, Yu G, Guo M, Yu J, Zhang X and
Wang J: CDPath: Cooperative driver pathways discovery using integer
linear programming and Markov clustering. IEEE/ACM Trans Comput
Biol Bioinform. 18:1384–1395. 2021.PubMed/NCBI View Article : Google Scholar
|
|
13
|
Wu C, Dong B, Huang L, Liu Y, Ye G, Li S
and Qi Y: SPTBN2, a new biomarker of lung adenocarcinoma. Front
Oncol. 11(754290)2021.PubMed/NCBI View Article : Google Scholar
|
|
14
|
Huang M, Long Y, Jin Y, Ya W, Meng D, Qin
T, Su L, Zhou W, Wu J, Huang C and Huang Q: Comprehensive analysis
of the lncRNA-miRNA-mRNA regulatory network for bladder cancer.
Transl Androl Urol. 10:1286–1301. 2021.PubMed/NCBI View Article : Google Scholar
|
|
15
|
Wang P, Liu T, Zhao Z, Wang Z, Liu S and
Yang X: SPTBN2 regulated by miR-424-5p promotes endometrial cancer
progression via CLDN4/PI3K/AKT axis. Cell Death Dis.
7(382)2021.PubMed/NCBI View Article : Google Scholar
|
|
16
|
Feng P, Ge Z, Guo Z, Lin L and Yu Q: A
comprehensive analysis of the downregulation of miRNA-1827 and its
prognostic significance by targeting SPTBN2 and BCL2L1 in ovarian
cancer. Front Mol Biosci. 8(687576)2021.PubMed/NCBI View Article : Google Scholar
|
|
17
|
Riesenberg S, Groetchen A, Siddaway R,
Bald T, Reinhardt J, Smorra D, Kohlmeyer J, Renn M, Phung B, Aymans
P, et al: MITF and c-Jun antagonism interconnects melanoma
dedifferentiation with pro-inflammatory cytokine responsiveness and
myeloid cell recruitment. Nat Commun. 6:8755. 2015.PubMed/NCBI View Article : Google Scholar
|
|
18
|
Brockmann L, Soukou S, Steglich B,
Czarnewski P, Zhao L, Wende S, Bedke T, Ergen C, Manthey C,
Agalioti T, et al: Molecular and functional heterogeneity of
IL-10-producing CD4+ T cells. Nat Commun.
9(5457)2018.PubMed/NCBI View Article : Google Scholar
|
|
19
|
Tang Z, Li C, Kang B, Gao G, Li C and
Zhang Z: GEPIA: A web server for cancer and normal gene expression
profiling and interactive analyses. Nucleic Acids Res. 45:W98–W102.
2017.PubMed/NCBI View Article : Google Scholar
|
|
20
|
Li JH, Liu S, Zhou H, Qu LH and Yang JH:
starBase v2.0: Decoding miRNA-ceRNA, miRNA-ncRNA and protein-RNA
interaction networks from large-scale CLIP-Seq data. Nucleic Acids
Res. 42:D92–D97. 2014.PubMed/NCBI View Article : Google Scholar
|
|
21
|
Lyu X, Qiang Y, Zhang B, Xu W, Cui Y and
Ma L: Identification of immuno-infiltrating MAP1A as a
prognosis-related biomarker for bladder cancer and its ceRNA
network construction. Front Oncol. 12(1016542)2022.PubMed/NCBI View Article : Google Scholar
|
|
22
|
Gregory AC, Zablocki O, Zayed AA, Howell
A, Bolduc B and Sullivan MB: The gut virome database reveals
age-dependent patterns of virome diversity in the human gut. Cell
Host Microbe. 28:724–740 e8. 2020.PubMed/NCBI View Article : Google Scholar
|
|
23
|
Zhang Y and Zhu J: Ten genes associated
with MGMT promoter methylation predict the prognosis of patients
with glioma. Oncol Rep. 41:908–916. 2019.PubMed/NCBI View Article : Google Scholar
|
|
24
|
Hänzelmann S, Castelo R and Guinney J:
GSVA: Gene set variation analysis for microarray and RNA-seq data.
BMC Bioinformatics. 14(7)2013.PubMed/NCBI View Article : Google Scholar
|
|
25
|
Love MI, Huber W and Anders S: Moderated
estimation of fold change and dispersion for RNA-seq data with
DESeq2. Genome Biol. 15(550)2014.PubMed/NCBI View Article : Google Scholar
|
|
26
|
Chandrashekar DS, Bashel B, Balasubramanya
SAH, Creighton CJ, Ponce-Rodriguez I, Chakravarthi BVSK and
Varambally S: UALCAN: A portal for facilitating tumor subgroup gene
expression and survival analyses. Neoplasia. 19:649–658.
2017.PubMed/NCBI View Article : Google Scholar
|
|
27
|
Uhlen M, Oksvold P, Fagerberg L, Lundberg
E, Jonasson K, Forsberg M, Zwahlen M, Kampf C, Wester K, Hober S,
et al: Towards a knowledge-based human protein atlas. Nat
Biotechnol. 28:1248–1250. 2010.PubMed/NCBI View Article : Google Scholar
|
|
28
|
Wen PY and Packer RJ: The 2021 WHO
classification of tumors of the central nervous system: Clinical
implications. Neuro Oncol. 23:1215–1217. 2021.PubMed/NCBI View Article : Google Scholar
|
|
29
|
World Health Organization (WHO):
International Classification of Diseases (ICD). WHO, Geneva,
2022.
|
|
30
|
Salmena L, Poliseno L, Tay Y, Kats L and
Pandolfi PP: A ceRNA hypothesis: The Rosetta stone of a hidden RNA
language? Cell. 146:353–358. 2011.PubMed/NCBI View Article : Google Scholar
|
|
31
|
Baumert BG, Hegi ME, van den Bent MJ, von
Deimling A, Gorlia T, Hoang-Xuan K, Brandes AA, Kantor G, Taphoorn
MJB, Hassel MB, et al: Temozolomide chemotherapy versus
radiotherapy in high-risk low-grade glioma (EORTC 22033-26033): A
randomised, open-label, phase 3 intergroup study. Lancet Oncol.
17:1521–1532. 2016.PubMed/NCBI View Article : Google Scholar
|
|
32
|
Chatsirisupachai K, Lesluyes T, Paraoan L,
Van Loo P and de Magalhães JP: An integrative analysis of the
age-associated multi-omic landscape across cancers. Nat Commun.
12:2345. 2021.PubMed/NCBI View Article : Google Scholar
|
|
33
|
Wen JX, Li XQ and Chang Y: Signature gene
identification of cancer occurrence and pattern recognition. J
Comput Biol. 25:907–916. 2018.PubMed/NCBI View Article : Google Scholar
|
|
34
|
Pignatti F, van den Bent M, Curran D,
Debruyne C, Sylvester R, Therasse P, Afra D, Cornu P, Bolla M,
Vecht C, et al: Prognostic factors for survival in adult patients
with cerebral low-grade glioma. J Clin Oncol. 20:2076–2084.
2002.PubMed/NCBI View Article : Google Scholar
|
|
35
|
Yue M, Liu T, Yan G, Luo X and Wang L:
LINC01605, regulated by the EP300-SMYD2 complex, potentiates the
binding between METTL3 and SPTBN2 in colorectal cancer. Cancer Cell
Int. 21(504)2021.PubMed/NCBI View Article : Google Scholar
|
|
36
|
Xiao H, Bai J, Yan M, Ji K, Tian W, Liu D,
Ning T, Liu X and Zou J: Discovery of 5-signature predicting
survival of patients with lower-grade glioma. World Neurosurg.
126:e765–e772. 2019.PubMed/NCBI View Article : Google Scholar
|
|
37
|
Li Z, Zhu Z, Wang Y, Wang Y, Li W, Wang Z,
Zhou X and Bao Y: has-miR-15a-5p inhibits colon cell carcinoma via
targeting CCND1. Mol Med Rep. 24(735)2021.PubMed/NCBI View Article : Google Scholar
|
|
38
|
Qin S, He NB, Yan HL and Dong Y:
Characterization of microRNA expression profiles in patients with
giant cell tumor. Orthop Surg. 8:212–219. 2016.PubMed/NCBI View Article : Google Scholar
|
|
39
|
Zhang J, Liu H, Hou L, Wang G, Zhang R,
Huang Y, Chen X and Zhu J: Circular RNA_LARP4 inhibits cell
proliferation and invasion of gastric cancer by sponging miR-424-5p
and regulating LATS1 expression. Mol Cancer. 16(151)2017.PubMed/NCBI View Article : Google Scholar
|
|
40
|
Xu S, Tang L, Liu Z, Luo C and Cheng Q:
Hypoxia-related lncRNA correlates with prognosis and immune
microenvironment in lower-grade glioma. Front Immunol.
12(731048)2021.PubMed/NCBI View Article : Google Scholar
|
|
41
|
Li Y, Gao Y, Niu X, Tang M, Li J, Song B
and Guan X: LncRNA BASP1-AS1 interacts with YBX1 to regulate Notch
transcription and drives the malignancy of melanoma. Cancer Sci.
112:4526–4542. 2021.PubMed/NCBI View Article : Google Scholar
|
|
42
|
Han X and Zhang S: Role of long non-coding
RNA LINC00641 in cancer. Front Oncol. 11(829137)2021.PubMed/NCBI View Article : Google Scholar
|
|
43
|
Yang J, Yu D, Liu X, Changyong E and Yu S:
LINC00641/miR-4262/NRGN axis confines cell proliferation in glioma.
Cancer Biol Ther. 21:758–766. 2020.PubMed/NCBI View Article : Google Scholar
|
|
44
|
Liao M, Liao W, Xu N, Li B, Liu F, Zhang
S, Wang Y, Wang S, Zhu Y, Chen D, et al: LncRNA EPB41L4A-AS1
regulates glycolysis and glutaminolysis by mediating nucleolar
translocation of HDAC2. EBioMedicine. 41:200–213. 2019.PubMed/NCBI View Article : Google Scholar
|
|
45
|
Bin J, Nie S, Tang Z, Kang A, Fu Z, Hu Y,
Liao Q, Xiong W, Zhou Y, Tang Y and Jiang J: Long noncoding RNA
EPB41L4A-AS1 functions as an oncogene by regulating the Rho/ROCK
pathway in colorectal cancer. J Cell Physiol. 236:523–535.
2021.PubMed/NCBI View Article : Google Scholar
|
|
46
|
Cao Y and Aypar U: A novel Xq22.1 deletion
in a male with multiple congenital abnormalities and respiratory
failure. Eur J Med Genet. 59:274–277. 2016.PubMed/NCBI View Article : Google Scholar
|
|
47
|
Petitprez F, Meylan M, de Reyniès A,
Sautès-Fridman C and Fridman WH: The tumor microenvironment in the
response to immune checkpoint blockade therapies. Front Immunol.
11(784)2020.PubMed/NCBI View Article : Google Scholar
|