Introduction
The spleen is the largest lymphoid organ in the
body, and plays a pivotal role in regulating hematologic and immune
homeostasis (1). A wide range of
conditions, including hematologic malignancies, infections and
inflammatory disorders (systemic lupus erythematosus, rheumatoid
arthritis, sarcoidosis), can induce alterations in splenic volume,
morphology and metabolic activity (2). Imaging serves as a critical tool for
evaluating splenic architecture, facilitating the distinction
between focal and diffuse patterns of involvement (3). Among these, diffuse infiltration
poses the greatest diagnostic challenge, arising from either the
accumulation of normal or neoplastic cellular elements, or from
congestion due to hyperemia and impaired venous outflow (3).
Myelofibrosis (MF) is a myeloproliferative neoplasm
of unclear etiology. MF is a rare disorder that typically
progresses insidiously during the early-stage and is characterized
by non-specific clinical manifestations (fatigue, weight loss,
night sweats, and mild abdominal discomfort), contributing to a
high rate of misdiagnosis (4).
Early-stage MF often presents with splenomegaly and cytopenia,
clinical features that can be readily mistaken for liver cirrhosis
(5,6). Consequently, patients frequently
first seek medical evaluation in gastroenterology or infectious
disease clinics, reflecting the subtlety of hematologic
abnormalities at presentation. Due to the limited familiarity with
MF within these clinics, treatment is often suboptimal. MF has
frequently advanced to the intermediate or late stages before
patients are referred to the hematology department, which results
in poor treatment outcomes and prognosis (7). Hence, there is a critical need for
early differential diagnosis between MF and liver cirrhosis.
Non-invasive methods are particularly valuable for assessing the
underlying causes of splenic involvement in patients, given the
constraints of splenic biopsy. Distinguishing variations based on
the qualitative features of spleen cross-sectional images is a
notable challenge (8).
Radiomics, an emerging tool in precision medicine,
leverages advanced algorithms to automatically extract quantitative
features, such as lesion intensity, morphology and texture, from
medical imaging datasets. These features can then be integrated
into predictive models that enhance clinical decision-making
(9). To the best of our knowledge,
no studies have directly compared ultrasound-based radiomic
signatures of splenomegaly attributable to MF vs. liver cirrhosis.
The present study aimed to develop a nomogram incorporating
clinical and ultrasound radiomics features of the spleen to
noninvasively distinguish early-stage MF from cirrhosis, thereby
offering a valuable reference for guiding therapeutic strategies
and patient management.
Materials and methods
Study cohort
The present retrospective study included a total of
40 patients with confirmed MF and treated at Wuxi People's Hospital
(Wuxi, China) or The Second Affiliated Hospital of Soochow
University (Suzhou, China) between January 2020 and August 2024
were included in the present study. The MF cohort comprised of 22
male patients and 18 female patients, aged between 53 and 73 years,
with an average age of 62.93±12.96 years (mean ± SD). Additionally,
50 patients with clinically diagnosed hepatitis B-related cirrhosis
and portal hypertension were selected from the same institutions
during the same period. The cirrhosis group included 36 male and 14
women, aged between 40 and 75 years, with an average age of
50.93±12.96 years. The patients were randomly allocated into a
training set consisting of 72 cases (including 32 patients with MF)
and a validation set comprising of 18 cases (including 8 patients
with MF). Allocation was performed using stratified sampling at an
8:2 ratio. The inclusion criteria comprised: i) Availability of
complete, unannotated ultrasound images suitable for analysis; ii)
a definitive clinical diagnosis supported by comprehensive clinical
data and the absence of prior surgical intervention; and iii) no
history of treatment prior to imaging. The exclusion criteria
encompassed: i) Normal splenic volume; ii) splenic infarction; iii)
presence of cystic or solid splenic lesions; and iv) thrombosis of
the portal or splenic veins. The present study was approved by The
Medical Ethics Committee of Wuxi People's Hospital (approval no.
KY23017). Written informed consent was obtained from the patients
for participation and for the publication of clinical details and
accompanying images.
Clinical data collection
The electronic medical record system was used to
retrieve the clinical data of patients, including the direct
bilirubin level, glutamic-pyruvic transaminase, γ-glutamyl
transferase, glutamic-oxalacetic transaminase and the isozyme of
glutamic-oxalacetic transaminase, as well as complete blood count
parameters including platelet counts.
Ultrasound examination
All ultrasound examinations were performed using
standardized settings: Frequency 3.5-5 MHz, dynamic range 60-65 dB,
gain 50-60%, depth 15-20 cm, focus position at the level of the
spleen, and tissue harmonic imaging enabled. Images were saved in
DICOM format with a resolution of 1,024x768 pixels without
compression. All examinations were performed by sonographers with
>5 years of experience in abdominal imaging. All patients were
required to fast for 8 h before the examination. The present study
utilized the LOGIQ™ E9 color Doppler ultrasound diagnostic
instrument (GE Healthcare) equipped with a convex array probe
operating at 3.5-5 MHz. Patients were positioned in a supine
stance, with their left arm raised above their head to optimize the
supracostal access. The probe was placed between the 9th and 11th
left ribs to capture the oblique section of the major axis of the
spleen. The maximum major-axis section of the spleen was preserved
for subsequent analysis. The major axis and thickness of the spleen
were recorded by identifying the section with the maximum major
axis, with three measurements averaged for accuracy. Portal vein
diameter was measured at the crossing point of the hepatic artery
and splenic vein diameter was measured 2 cm from the splenic hilum
during quiet respiration. These measurements were averaged from
three consecutive readings during the same examination for
accuracy. These procedures were documented and assessed by two
ultrasonography physicians, each with >10 years of diagnostic
experience. The physicians were blinded to each other's diagnoses
and pathological findings. Any discrepancies in diagnoses were
resolved through discussion to reach a consensus.
Image segmentation and data
preprocessing
A high-resolution image of the maximum major-axis
section of the spleen was imported into 3D-Slicer version 5.4
(slicer.org) in JPG format. Two experienced
ultrasonography physicians, each with >10 years of diagnostic
expertise, drew boundaries around the edge of the spleen on the
image. This ensured that the entire spleen was encompassed within
the largest possible region of interest (ROI). In cases where the
discrepancy between the two ROIs drawn by the physicians
(calculated as the ratio of the combined area of non-overlapping
parts to the total area of both ROIs) was <5%, the ROI was
defined as the overlapping region of the two. If the discrepancy
was >5%, the physicians discussed this and reached a consensus.
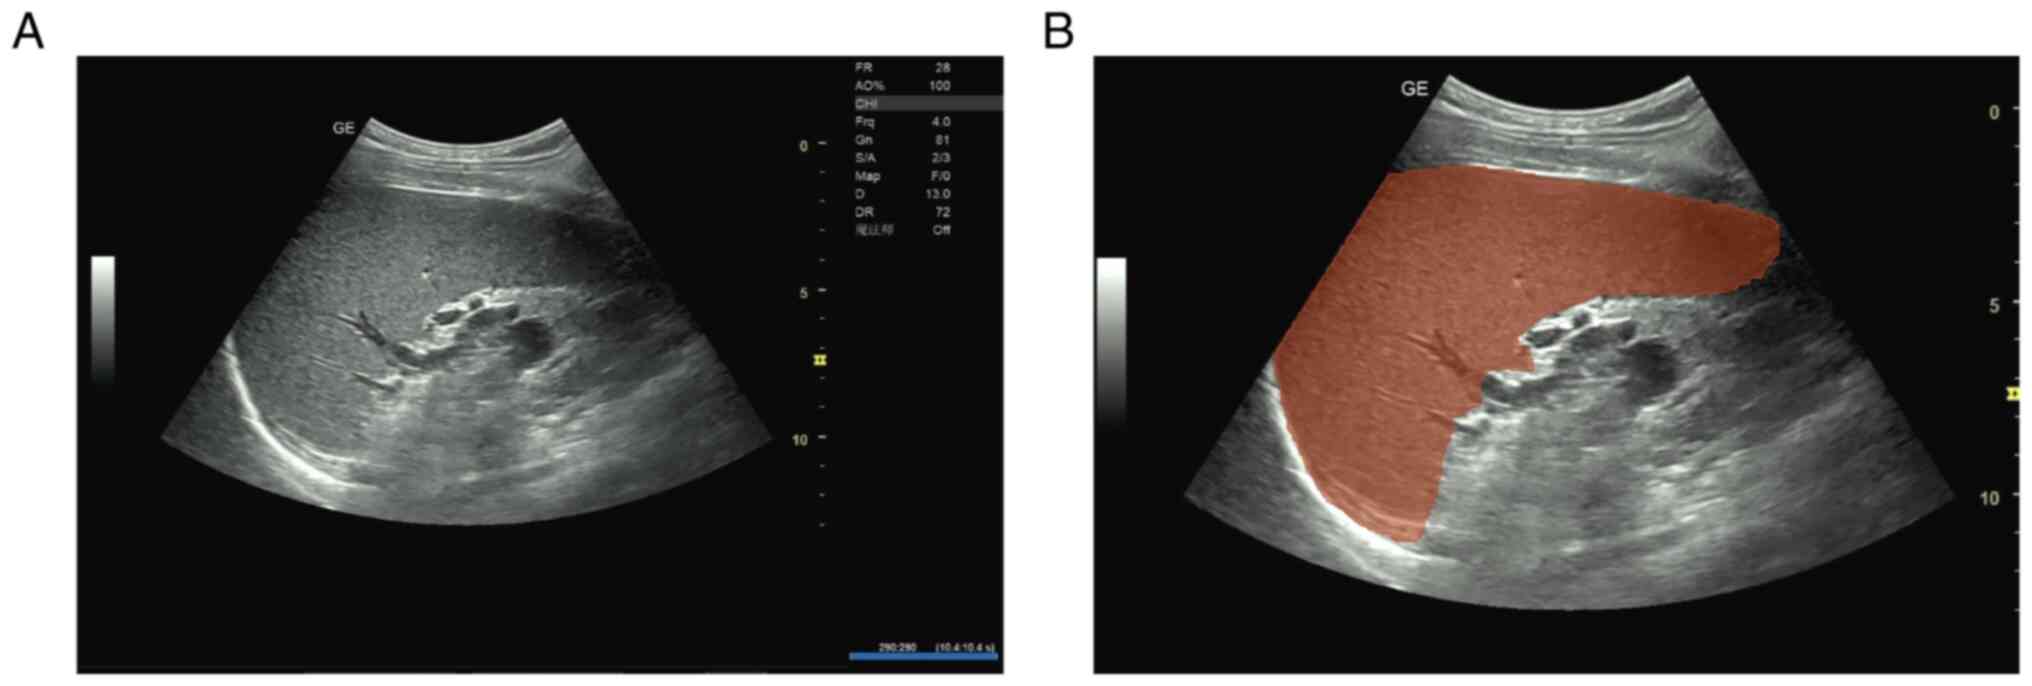
Fig. 1 illustrates the ROI
delineation process, showing the original grayscale ultrasound
image of an enlarged spleen (Fig.
1A) and the same image with manual ROI segmentation performed
by experienced sonographers (Fig.
1B).
To assess segmentation reproducibility, 30 randomly
selected cases (33%) were independently re-segmented (ROI redrawn)
by both ultrasonography physicians after a 4-week interval to
minimize recall bias. The inter-observer intraclass correlation
coefficient (ICC) for ROI segmentation was 0.892 [95% confidence
interval (CI), 0.845-0.932], and the intra-observer ICCs were 0.916
(95% CI, 0.878-0.948) for observer 1 and 0.909 (95% CI,
0.869-0.943) for observer 2. For radiomics feature extraction, an
inter-observer ICC of >0.85 for 782/837 features (93.4%) and
intra-observer ICC of >0.90 for 801/837 features (95.7%) was
achieved. Only features with an ICC of >0.75 were retained for
subsequent analysis.
Feature selection of ultrasound
radiomics
The PyRadiomics module in Python version 3.9 (Python
Software Foundation) was used to extract radiomics features from
the grayscale ultrasound images. Initially, the ICC was utilized to
assess the consistency of feature extraction between and within
observers in the ROI. Higher ICC indicated greater consistency and
improved repeatability. The analysis moved forward to the feature
screening stage when the ICC was >0.75 in both groups. A total
of 837 radiomics features were extracted, and Z-score normalization
was applied to standardize these features and mitigate the effects
of varying dimensions. Subsequently, two dimensionality reduction
methods were employed to refine the selection from the 837
features, which ensured a more manageable set for analysis: i) The
least absolute shrinkage and selection operator (LASSO) algorithm,
with 5-fold cross-validation, was implemented to compress certain
regression coefficients. This was achieved by introducing a penalty
function that reduced the sum of the coefficients' absolute values
below a predetermined threshold. The glmnet package (version 4.1-7)
in R software (version 4.3.3, R Foundation for Statistical
Computing), with family=binomial for binary result data. Key
parameter α was set to 1 and cross-validation was conducted using
the cv.glmnet function. Two λ values, λ.min and λ.1se, were chosen:
λ.min minimized cross-validation errors, while lambda.1se favored a
more succinct model. The two provided a balance between model
complexity and prediction accuracy. Ultimately, variables
significant to prediction were identified based on non-zero
coefficients, which simplified the model and enhanced
interpretability. ii) The Boruta algorithm, a feature selection
technique rooted in a random forest, assessed feature importance by
creating shadow variables for each original variable in the
dataset. Utilizing Boruta package version 8.0.0 (cran.r-project.org/package=Boruta) for
feature selection, the algorithm systematically compared the
significance of each original variable against its shadow
counterpart. The importance of each variable was confirmed after
500 iterations or when all variables showed stability. The final
results were extracted using the attStats function in R, and the
format was refined with a custom adjustdata function in R
Establishment of a joint
clinical-radiomics model
Independent predictors for differentiating liver
cirrhosis from MF were identified using multivariate logistic
regression. Analysis was based on the independent influencing
factors of selected clinical and ultrasound characteristics, along
with ultrasound radiomics features from the training set.
Subsequently, a comprehensive clinical-radiomics model was
developed and a corresponding nomogram was created.
Statistical processing
Data analysis was conducted using R (version 4.3.3),
Python (version 3.7), and SPSS 27.0 (IBM Corp.) statistical
software. Measurement data that adhered to a normal distribution
are presented as the mean ± SD, with independent sample t-tests
performed for group comparisons. Categorical data are presented as
case counts, and χ2 test was used for group comparisons.
No categorical variables met criteria for statistical analysis in
this cohort. The predictive efficacy of the model in the training
and validation sets was evaluated by creating receiver operating
characteristic curves and determining the area under the curve
(AUC). P<0.05 (two-tailed) was considered to indicate a
statistically significant difference.
Results
Selection of ultrasound radiomics
feature
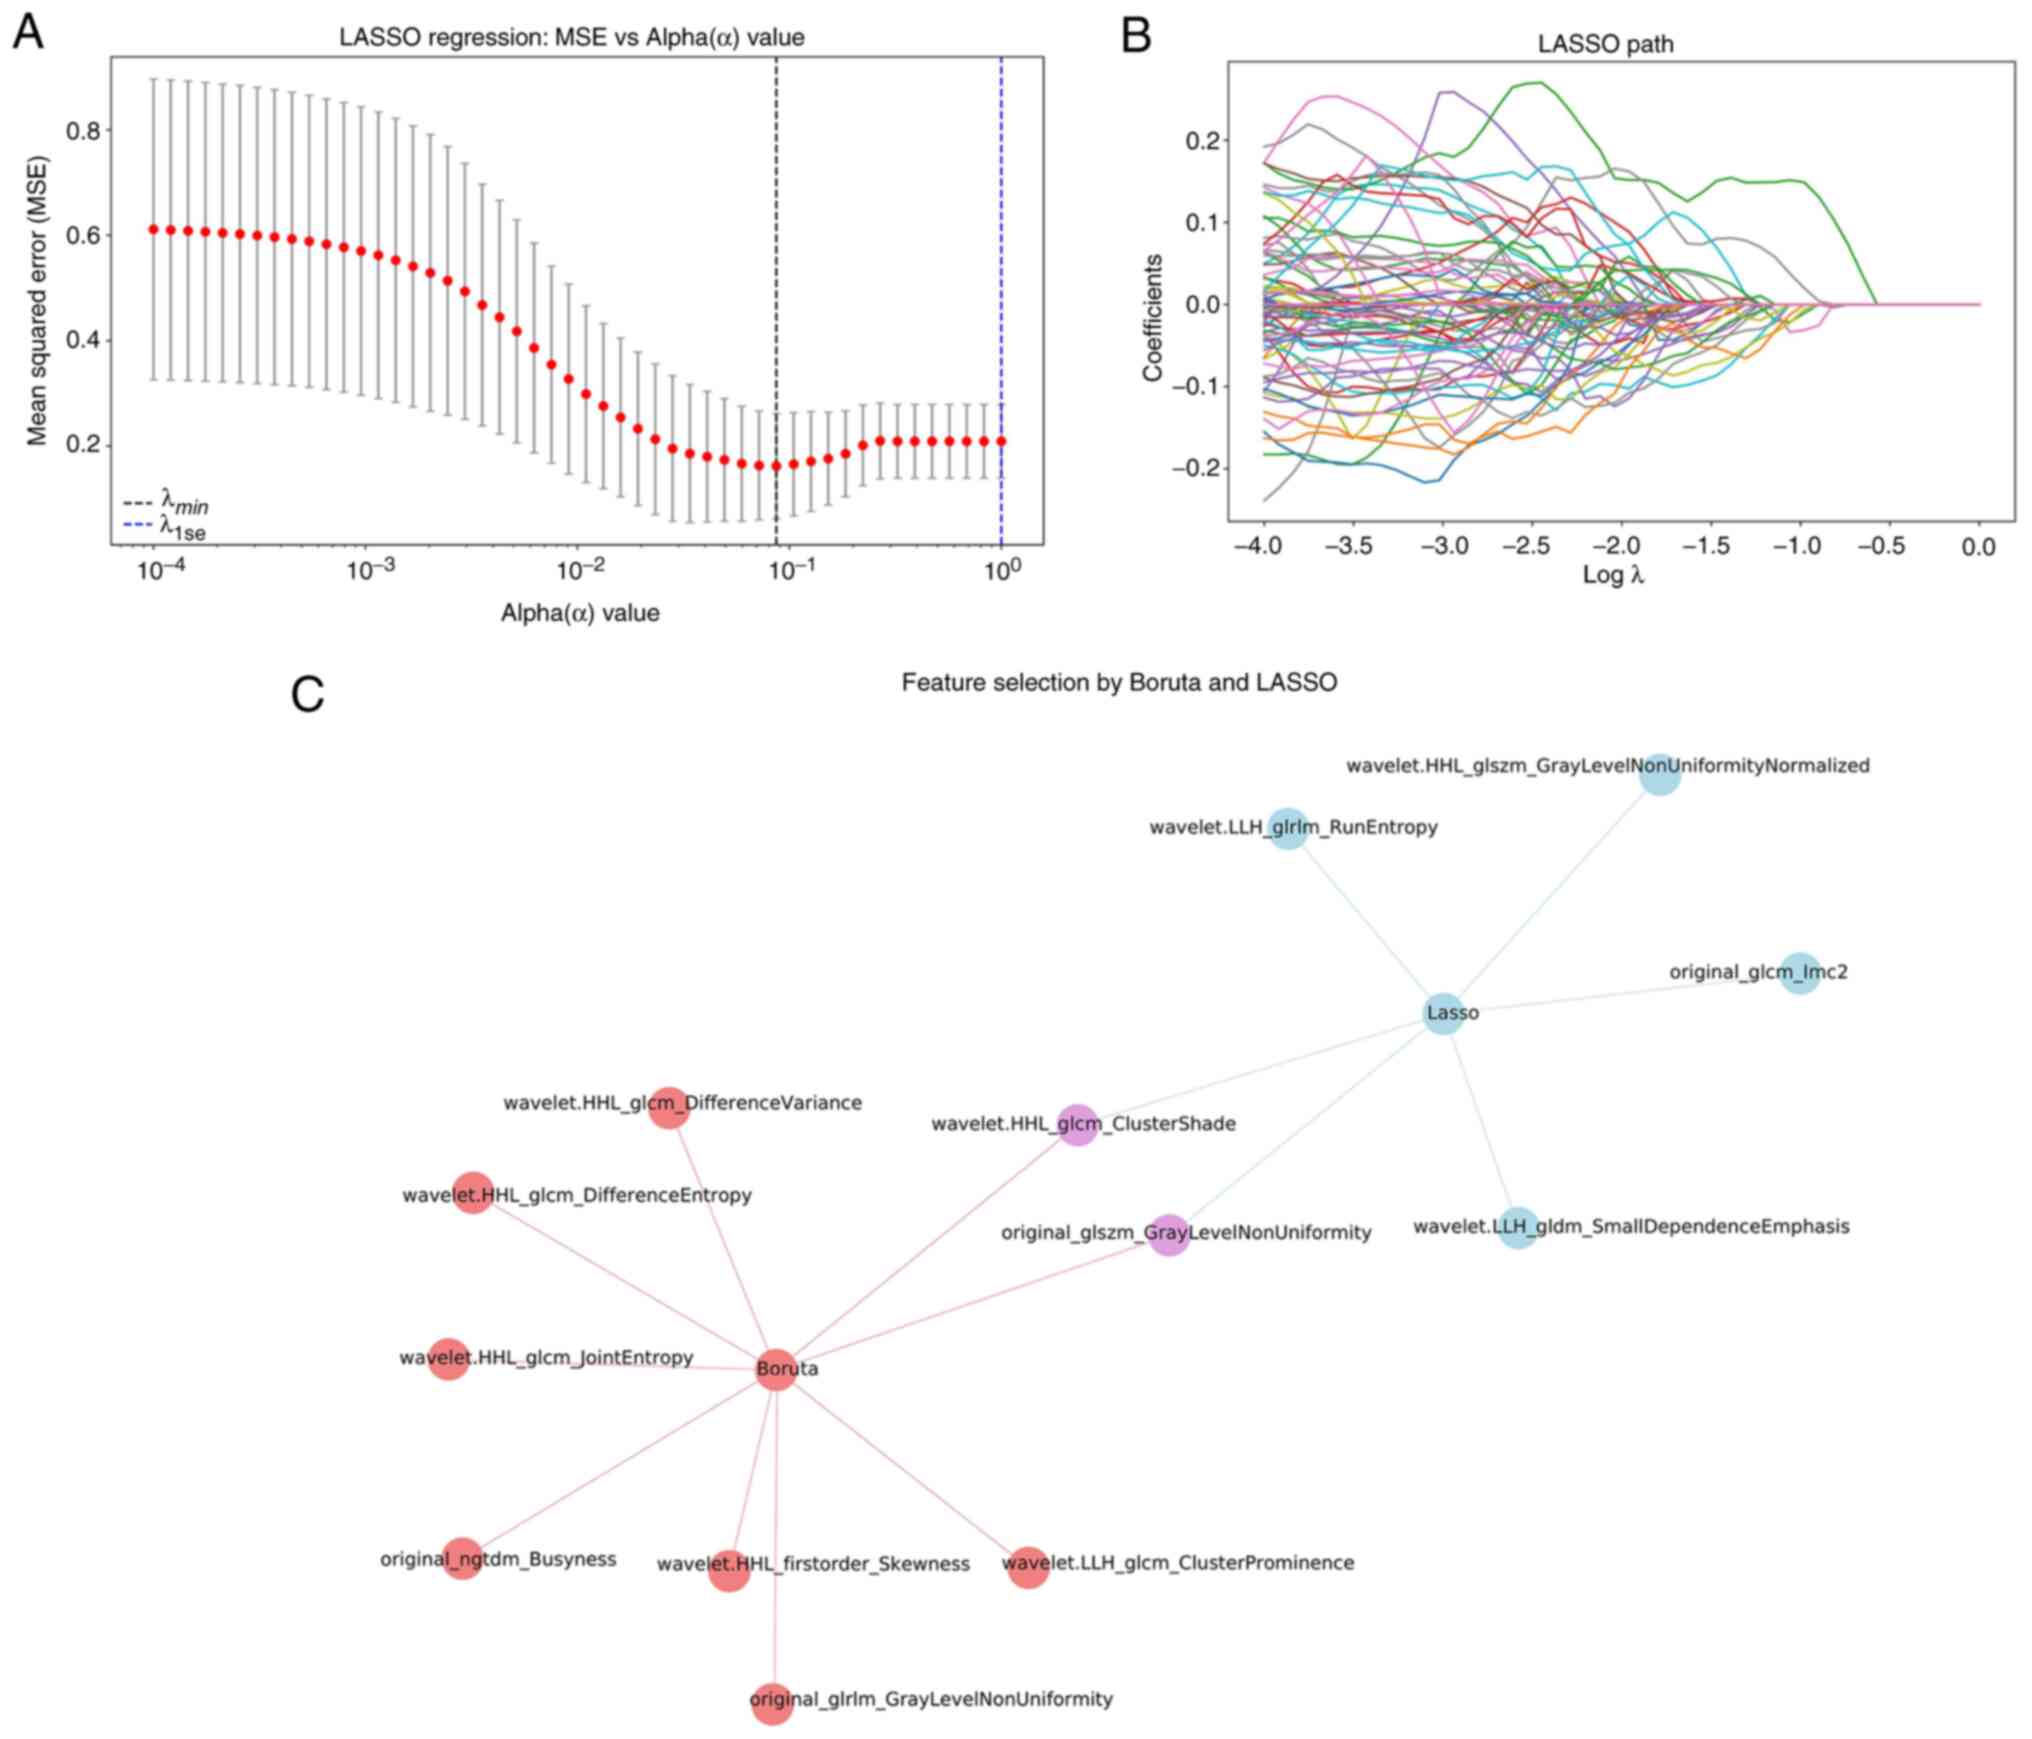
Using the PyRadiomics software package, 837
ultrasound image features of the spleen were extracted. Two key
radiomics features were identified after dimensionality reduction
by LASSO and Boruta algorithms: wavelet.HHL_glcm_ClusterShade (C1)
and original_glszm_GrayLevelNonUniformity (C2) (Fig. 2).
Univariate and multivariate analyses
of clinical and ultrasound radiomics data
The training set consisted of 72 patients, including
40 patients diagnosed with liver cirrhosis and 32 patients with MF.
In univariate analysis, significant differences in C2, direct
bilirubin, glutamic-pyruvic transaminase, glutamic-oxalacetic
transaminase and the major axis of the spleen were observed between
the two groups (all P<0.05). However, the C1, thickness of the
spleen, γ-glutamyl transferase and glutamic-oxalacetic transaminase
isozymes had no statistical significance between the two groups
(all P>0.05; Table I).
 | Table IUnivariate analysis of clinical and
ultrasound radiomics data in the training set. |
Table I
Univariate analysis of clinical and
ultrasound radiomics data in the training set.
| Variable | Liver cirrhosis | Myelofibrosis | t-value | P-value |
|---|
| C1 | 0.01±0.87 | 0.63±1.11 | 2.054 | 0.051 |
| C2 | 0.70±0.28 | 1.30±0.60 | -3.790 | 0.001 |
| Spleen major ais
(mm) | 151.00±25.80 | 170.00±20.70 | -2.883 | 0.007 |
| Spleen thickness,
(mm) | 56.2±12.60 | 66.70±6.60 | -1.746 | 0.087 |
| Direct bilirubin
(µmol/l) | 18.00± 6.60 | 6.30±4.30 | 2.679 | 0.010 |
| Glutamic-pyruvic
transaminase (U/l) | 38.00±30.90 | 18.50±9.40 | 3.586 | <0.001 |
| γ-glutamyl
transferase (U/l) | 69.40±105.00 | 37.90± 3.40 | 1.789 | 0.079 |
| Glutamic-oxalacetic
transaminase (U/l) | 55.70±45.90 | 21.40±4.10 | 4.676 | <0.001 |
| Glutamic-oxalacetic
transaminase isozyme (U/l) | 16.70±8.60 | 12.90±5.90 | 1.874 | 0.068 |
| Platelet count
(x109/l) | 96.00±19.60 | 155.50±114.00 | -2.292 | 0.033 |
| Portal vein
(mm) | 13.60±1.55 | 12.40±1.31 | 3.361 | 0.002 |
| Splenic vein
(mm) | 9.50±1.50 | 9.60±2.20 | -0.221 | 0.826 |
As show in Table I,
univariate analysis revealed significant differences in portal vein
diameter between the two groups, with the liver cirrhosis group
showing larger portal vein diameters compared with the MF group
(13.6±1.55 vs. 12.4±1.31 mm, P=0.002). However, splenic vein
diameters showed no statistically significant difference between
the groups (9.5±1.5 vs. 9.6±2.2 mm, P=0.826). In the multivariate
logistic regression analysis (Table
II), portal vein diameter did not emerge as an independent
predictor for differentiating the two conditions. Platelet count
showed significant differences between the two groups (Table I: 96.00±19.60 vs. 155.50±114.00
x109/l, P=0.033), with both conditions demonstrating
thrombocytopenia but to varying degrees. The MF group showed more
variable platelet counts (ranging from 54-488 x109/l)
compared with the liver cirrhosis group.
| Table IIMultivariate analysis of clinical and
ultrasound radiomics data in the training set. |
Table II
Multivariate analysis of clinical and
ultrasound radiomics data in the training set.
| Variable | Regression
coefficient | Standard error | Wald χ2
value | P-value | OR value (95%
confidence intervals) |
|---|
| C2 | 3.694 | 1.608 | 5.279 | 0.022 | 40.218
(1.721-940.008) |
| Direct
bilirubin | -0.376 | 0.166 | 5.146 | 0.023 | 0.687
(0.496-0.950) |
| Glutamic-oxalacetic
transaminase | -0.211 | 0.104 | 4.137 | 0.042 | 0.810
(0.660-0.992) |
| Constant | 2.895 | 2.319 | 1.559 | 0.212 | 18.092
(-1.653-7.443) |
The dependent variable was coded as liver
cirrhosis=0 and MF=1. Multivariate logistic regression analysis
included all variables with P<0.05 in univariate analysis: C2,
direct bilirubin, glutamic-pyruvic transaminase,
glutamic-oxalacetic transaminase, and the major axis of the spleen.
Forward stepwise selection retained three variables in the final
model. C2, direct bilirubin and glutamic-oxalacetic transaminase
were identified as independent predictors for differentiating liver
cirrhosis from MF. The logistic regression equation for predicting
MF probability is: Logit (P)=2.895 + 3.694 x C2-0.376x direct
bilirubin -0.211 x glutamic-oxalacetic transaminase, where P
represents the probability of MF diagnosis (Table II).
Model construction and predictive
diagnosis effectiveness
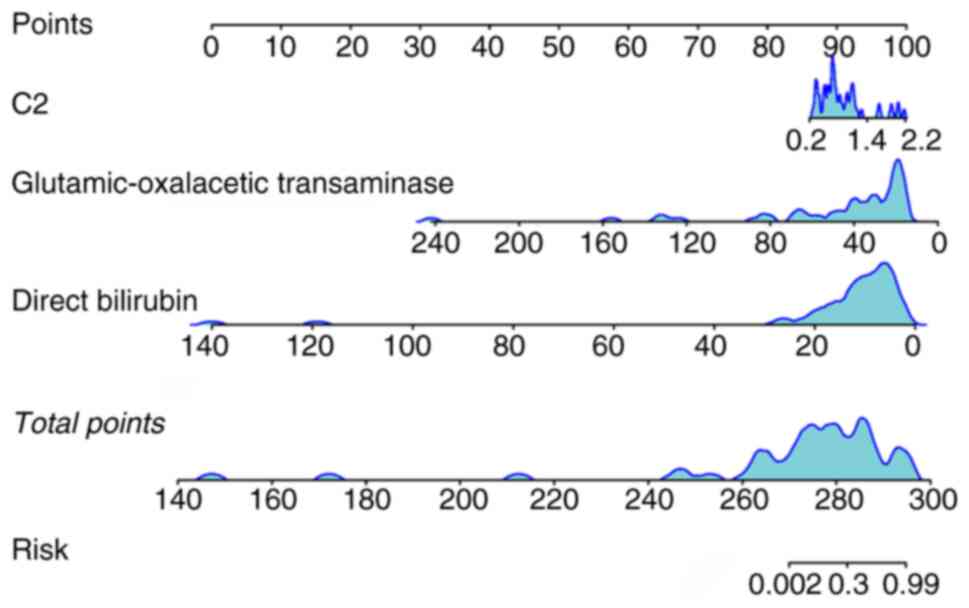
A nomogram model was developed by incorporating two
radiomics features (C1 and C2) and two clinical parameters (direct
bilirubin and glutamic-oxalacetic transaminase levels) (Fig. 3). The model showed an AUC of 0.958
(95% CI, 0.912-1.0) for the training set and 0.750 (95% CI,
0.487-1.0) for the validation set (Fig. 4A and B). The model also achieved 93.8%
sensitivity, 87.5% specificity and 80.3% accuracy for the training
set, and 100% sensitivity, 60% specificity and 71.4% accuracy for
the validation set. The concordance between liver cirrhosis and
clinical diagnosis was 70% (35/50), and it was 100% (40/40) for MF.
Fig. 4C-E presents the calibration
and decision curves for both the training and validation sets.
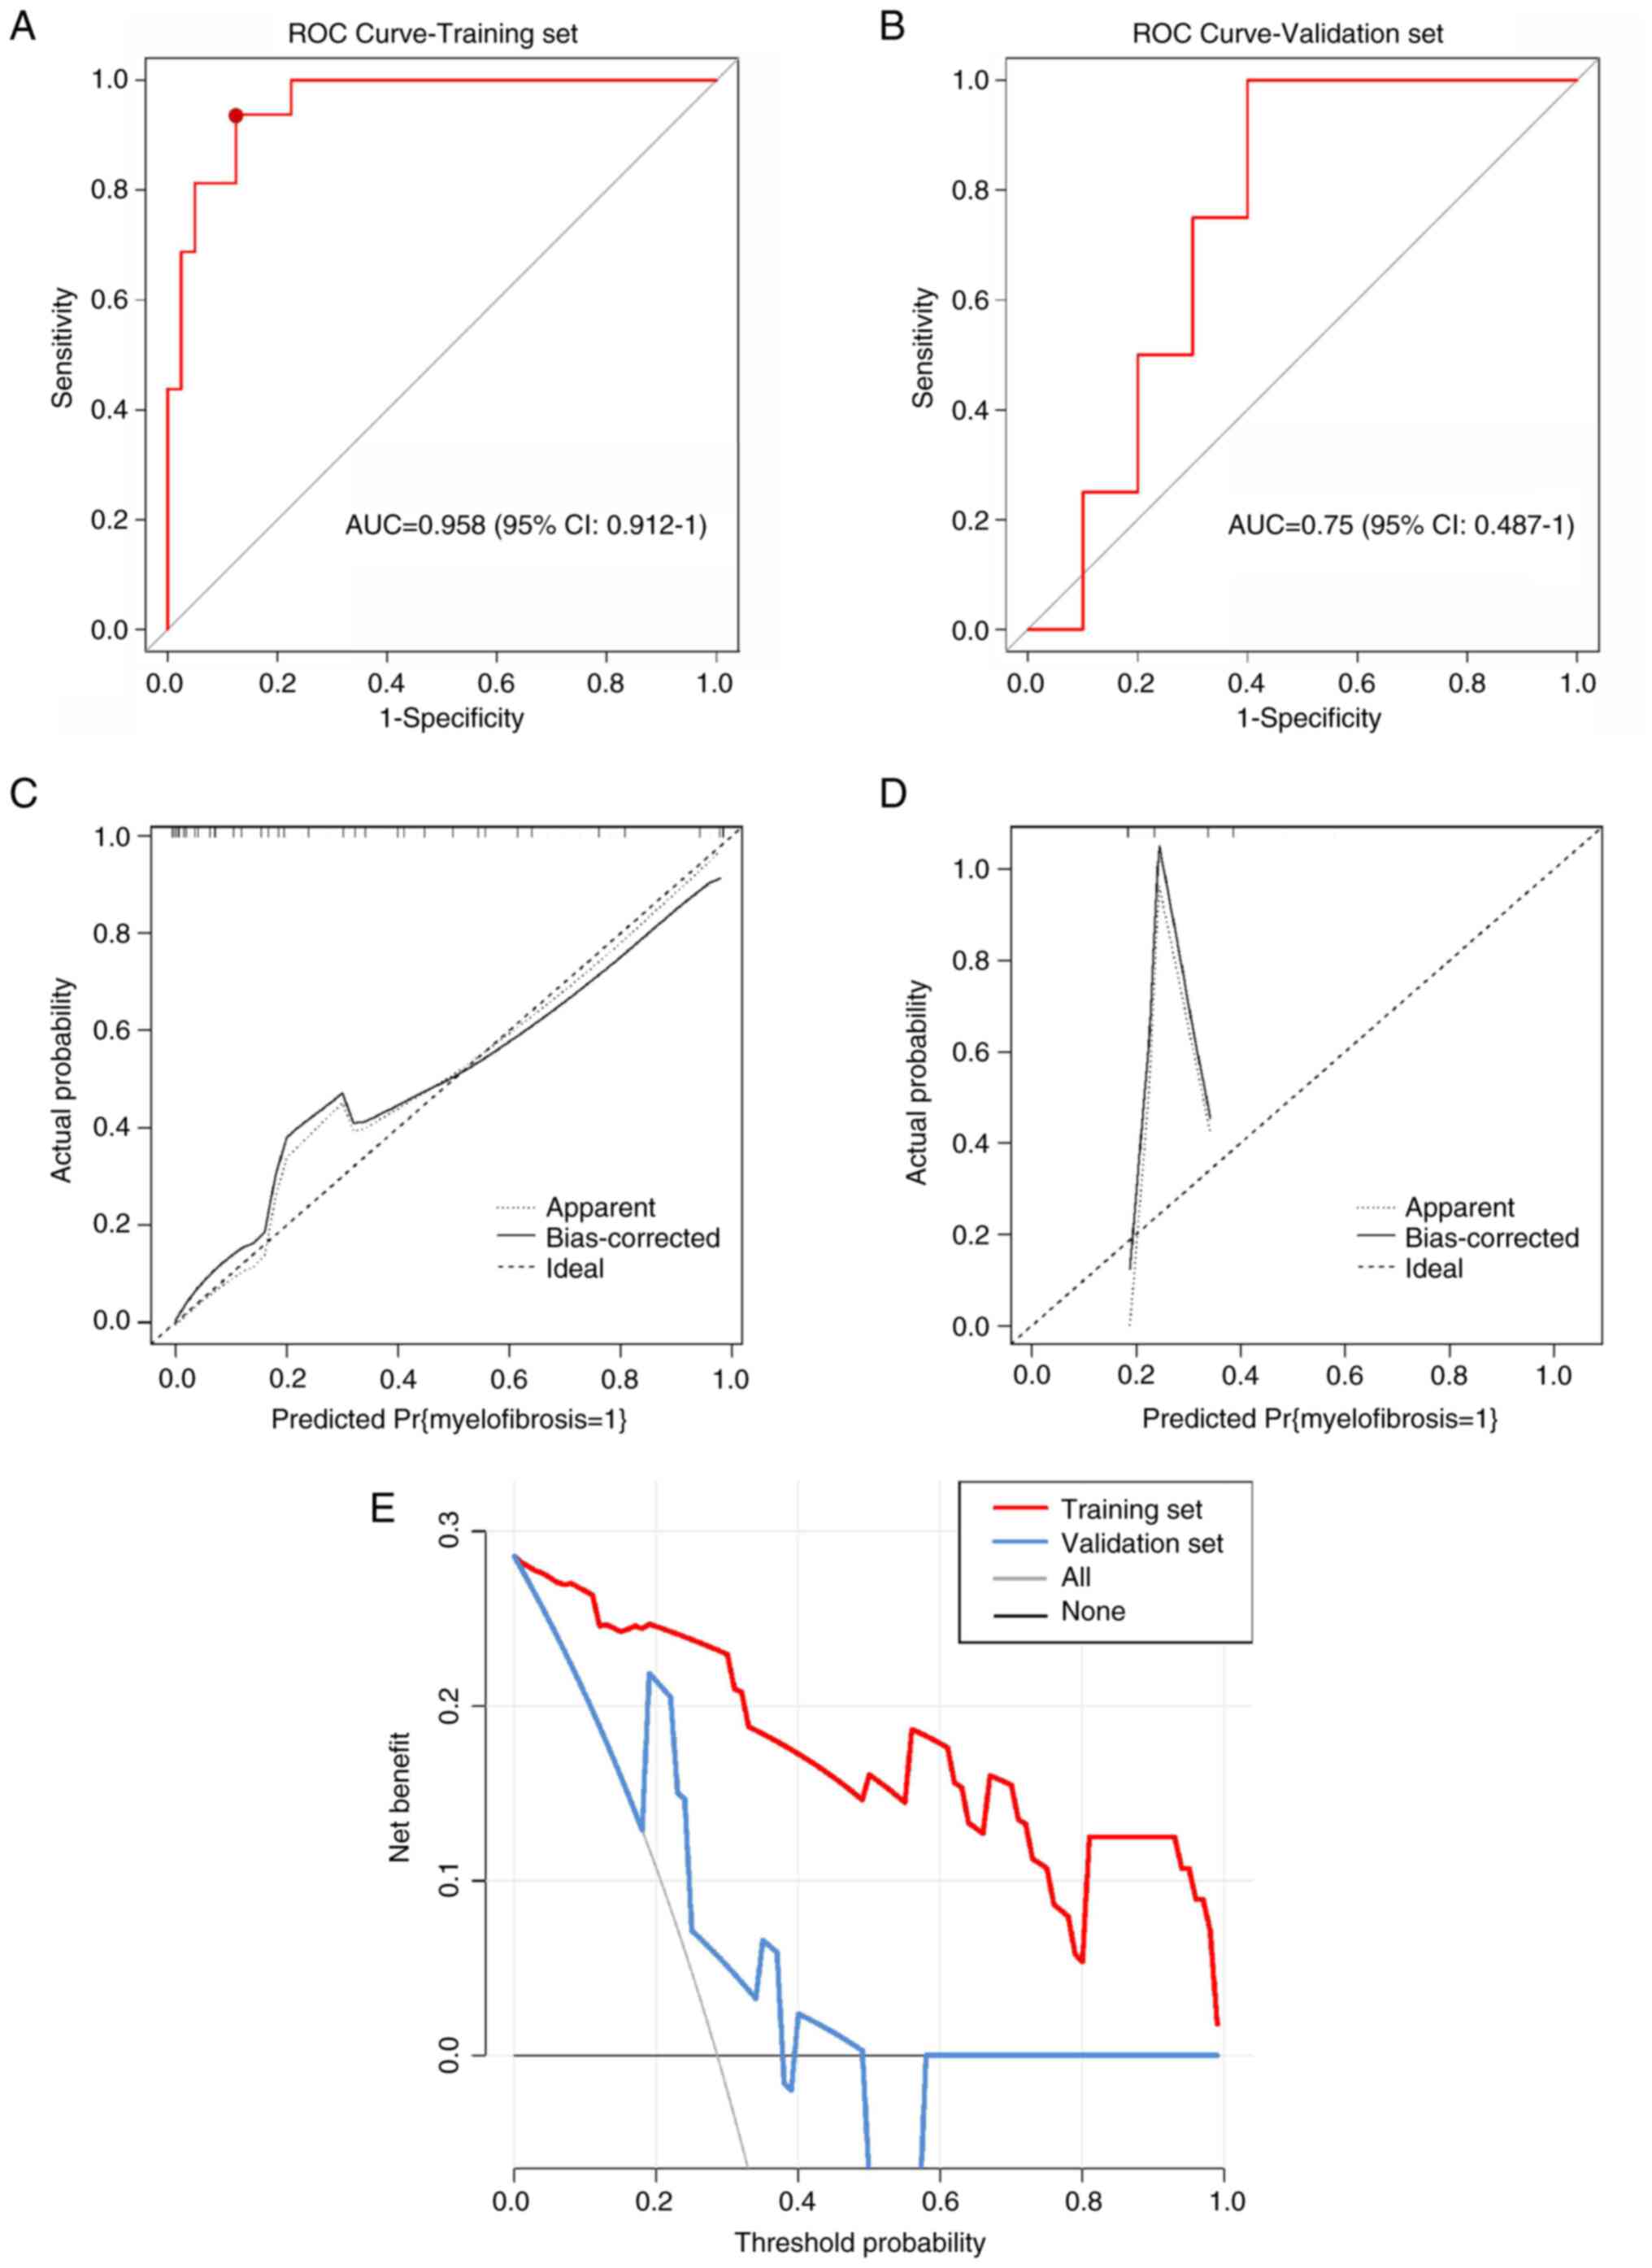 | Figure 4Model performance validation and
clinical utility assessment. (A) ROC) curve for the training set
(n=72). The curve demonstrates excellent discrimination with
AUC=0.958 (95% CI, 0.912-1.0). The optimal cutoff point
(sensitivity=93.8%, specificity=87.5%) is marked with a red dot.
(B) ROC curve for the validation set (n=18). The curve shows
moderate discrimination with AUC=0.750 (95% CI, 0.487-1.0),
indicating acceptable but reduced performance compared to the
training set. (C) Calibration curve for the training set. The plot
demonstrates excellent agreement between predicted probabilities
(x-axis) and observed frequencies (y-axis), with the calibration
line closely following the diagonal reference line (perfect
calibration). (D) Calibration curve for the validation set. The
plot shows moderate calibration with some deviation from the
diagonal reference line, particularly at higher predicted
probabilities, suggesting slight model overconfidence in this
cohort. (E) Decision curve analysis for clinical utility
assessment. The graph displays net benefit (y-axis) across
threshold probabilities (x-axis, 0-1.0). The nomogram model (red
line) provides superior clinical utility compared to treat-all
strategy (blue line) or treat-none strategy (black horizontal line
at net benefit=0) for threshold probabilities between 0.1 and 0.8.
ROC, receiver operating characteristic; AUC, area under the curve;
CI, confidence interval. |
Model validation and stability
analysis
To assess potential overfitting given the difference
between training (AUC=0.958) and validation (AUC=0.750)
performance, additional validation analyses were performed.
Five-fold cross-validation within the training set yielded a mean
AUC of 0.856 (95% CI, 0.792-0.920), suggesting more modest
performance than the initial training AUC. Bootstrapping with 1,000
iterations revealed confidence intervals of 0.889-0.987 for the
training AUC, confirming model stability. When a more stringent
feature selection was applied using λ.1se instead of λ.min, the
model retained only the two most robust features (C2 and C1),
supporting their importance for differentiation.
Discussion
The spleen, a central lymphoid organ, plays a
critical role in the pathophysiology of infections (infectious
mononucleosis, malaria), metabolic disorders (e.g., Gaucher and
Niemann-Pick disease), and hematologic diseases (e.g., lymphoma,
leukemia) (10-12).
Splenomegaly, defined as enlargement of the spleen, is a frequent
clinical manifestation and underlying etiology is pivotal for
guiding targeted therapy (13). In
MF extramedullary hematopoiesis within the liver and spleen
contributes to secondary portal hypertension, characterized by
increased splenic blood flow and elevated resistance within hepatic
sinusoids, ultimately leading to splenomegaly. In ~50% of patients
with MF, the presented symptoms are attributable to portal
hypertension at initial diagnosis (14). Among these, gastrointestinal
hemorrhage is the most prevalent, followed by other complications
of portal hypertension, such as ascites, fatigue and abdominal
distension,- clinical features that often lead to misdiagnosis as
liver cirrhosis.
Researchers have highlighted the difficulty in
differentiating splenomegaly due to early-stage MF or liver
cirrhosis (15,16). Thus, a reliable and non-invasive
diagnostic method is essential for clinical management. Ultrasound
is the preferred imaging technique for spleen examination:
Ultrasound radiomics involves extracting numerous quantitative
parameters from ultrasound images that are indiscernible to the
human eye. The parameter features reflect the internal differences
in biological information of the lesion; therefore, these
parameters can aid in precise diagnosis, differentiation, risk
stratification and treatment evaluation. Consequently, the present
study utilized ultrasound radiomics to extract considerable
microscopic information from spleen ultrasound images in patients
with MF or liver cirrhosis; combining ultrasound radiomics with
high-risk clinical factors, a nomogram model was developed to
differentiate MF from liver cirrhosis.
The present study sought to develop a comprehensive
model integrating clinical and ultrasound radiomics data to enhance
the differentiation between MF and liver cirrhosis. Clinically,
significant disparities were noted in direct bilirubin,
glutamic-pyruvic transaminase and glutamic-oxalacetic transaminase
levels between the two conditions. Xie et al (17) previously concluded that differences
in glutamic-pyruvic transaminase, lactate dehydrogenase and direct
bilirubin across MF and liver cirrhosis groups have statistical
significance, which is consistent with the findings of the present
study. Patients with MF retain normal liver cell function; thus,
their synthetic, transformative and metabolic abilities are
unaffected. By contrast, patients with liver cirrhosis suffer from
abnormal liver function due to the damage of liver cells. The
platelet count differences observed in the present study reflect
the distinct pathophysiological mechanisms of thrombocytopenia in
these conditions. In liver cirrhosis, thrombocytopenia primarily
results from splenic sequestration due to portal hypertension and
reduced hepatic thrombopoietin production (18). By contrast, patients with MF
exhibited more variable platelet counts, which is characteristic of
the heterogeneous nature of the disease, some patients may present
with thrombocytosis in early stages while others develop
thrombocytopenia as bone marrow fibrosis progresses (19). This variability in platelet counts
in patients with MF, compared with the more consistent moderate
thrombocytopenia in cirrhosis, may serve as an additional
diagnostic marker when integrated with other clinical and imaging
findings in individual patient assessment. However, platelet count
alone was not retained as an independent predictor in the
multivariate model used in the present study, suggesting that the
combination of radiomics features and liver function tests provides
superior discriminative power.
Patients with liver cirrhosis maintain a constant
liver size or experience a compensatory increase in size in the
early stages, and it is only in the advanced stages that the liver
begins to shrink (20). Spleen
enlargement in early cirrhosis is typically moderate (13-15 cm)
compared with marked splenomegaly (>20 cm) often seen in
advanced MF. In addition, patients with MF often initially show no
substantial blood system abnormalities (anemia, leukocytosis, or
thrombocytosis) (21), with
splenomegaly being the sole manifestation. As MF progresses, the
enhanced extramedullary hematopoietic function leads to blockage of
the hepatic veins, which in turn increases portal venous pressure
and liver volume, and the spleen becomes moderately or more
enlarged. The present study includes ultrasound image of the spleen
of a patient with MF at the onset of the disease: In the case
presented, the condition is mild and does not exhibit the typical
features of severe spleen enlargement.
The findings of the present study regarding portal
and splenic vein dimensions align with the pathophysiological
differences between MF and liver cirrhosis. The significantly
larger portal vein diameter in patients with liver cirrhosis
reflects the well-established portal hypertension that
characterizes this condition (22). By contrast, patients with MF showed
relatively normal portal vein dimensions despite splenomegaly,
suggesting that the splenic enlargement in MF is primarily due to
extramedullary hematopoiesis rather than portal hypertension
(23). Furthermore, splenic vein
diameters were similar between groups in the present study,
possibly due to compensatory mechanisms in both conditions. While
these vascular parameters provide additional diagnostic insights,
they did not independently predict disease type in the multivariate
model presented in the current study, suggesting that the
combination of radiomics features and liver function tests remains
more discriminative.
Clinical vigilance is essential for cases presenting
with anemia and splenomegaly but without hypohepatia, as these may
indicate the presence of MF (24)
It is recommended to conduct bone marrow aspiration and
examination, and if necessary, a liver biopsy should be performed
to investigate the presence of extramedullary hematopoiesis. MF) is
a rare condition, with incidence rates reported between 0.1 and 1.9
cases/100,000 persons per year (25), and numerous patients do not receive
an accurate clinical diagnosis until their death. Patients
exhibiting early-stage splenomegaly in MF were included in the
present study; however, some patients with MF who exhibited signs
of greatly enlarged spleen had their condition misjudged during
initial clinical evaluations, which delayed proper diagnosis, and
consequently these patients were excluded due to incomplete imaging
data from delayed referral. Therefore, the difference in splenic
size between the two groups had no statistical significance in the
multivariate logical regression analysis.
The present study pioneered the use of spleen
radiomics for differentiating MF from liver cirrhosis. Spleen CT
radiomics has been previously employed to distinguish lymphoma from
benign splenomegaly (26);
additionally, the characteristics of spleen CT radiomics have been
utilized to forecast the prognosis of patients with esophageal
squamous cell carcinoma (27).
Furthermore, the relapse of hepatocellular carcinoma (HCC) has been
predicted using the characteristics of CT spleen radiomics
(28); these spleen-based
radiomics models have demonstrated notable clinical predictive
value. The clinical value of spleen radiomics is further
demonstrated in the present study where the ultrasound radiomics
approach, grounded in splenomegaly, enhanced the differentiation
between MF and liver cirrhosis. The radiomics was able to convert
medical imaging data into high-throughput data, encompassing
features such as markings and shape characteristics that were not
readily observable to the naked eye.
The pathophysiological mechanisms driving
splenomegaly in MF and liver cirrhosis are fundamentally distinct.
The spleen comprises two primary compartments: Red pulp and white
pulp. The red pulp is composed of venous sinuses, reticular fibers,
myofibroblasts and macrophages, whereas the white pulp contains the
periarterial lymphatic sheath, follicles, and marginal zones
enriched with lymphocytes, macrophages, dendritic cells and plasma
cells. In liver cirrhosis, portal hypertension induces congestive
splenomegaly predominantly involving the red pulp (29). Conversely, MF is characterized by
infiltration of clonal hematopoietic cells into the white pulp and
marginal zones. These divergent histopathological alterations
manifest as distinct radiomics signatures on imaging (30).
The findings of the present study align with and
extend previous radiomics applications in spleen imaging. Enke
et al (26) used CT-based
spleen radiomics to differentiate lymphoma from benign
splenomegaly, achieving an AUC of 0.87, comparable to validation
set performance in the present study. However, the previous study
required radiation exposure, whereas in the present study the
ultrasound-based approach offers a radiation-free alternative.
Similarly, Li et al (28)
demonstrated that spleen CT radiomics could predict HCC recurrence
with an AUC of 0.82, suggesting that splenic texture changes
reflect systemic disease states beyond primary splenic
pathology.
The radiomics features identified in the present
study (wavelet.HHL_glcm_ClusterShade and
original_glszm_GrayLevelNonUniformity) reflect texture
heterogeneity, consistent with texture heterogeneity findings in
liver, kidney and pancreatic radiomics studies (31,32).
These gray-level non-uniformity features have proven valuable in
detecting tissue architectural disruption in pancreatic radiomics
(AUC 0.85 for pancreatitis vs. normal) and renal radiomics (AUC
0.88 for chronic kidney disease staging), supporting their
biological relevance across different pathological processes
(33,34).
The ultrasound radiomics nomogram developed in the
present study provides a non-invasive tool for differentiating MF
from liver cirrhosis, addressing a critical diagnostic challenge in
clinical practice. By combining readily available ultrasound
imaging with routine laboratory tests, this approach could
facilitate earlier referral to hematology specialists and reduce
diagnostic delays that often result in suboptimal treatment
outcomes. Therefore, this model has the potential to reduce the
need for unnecessary bone marrow aspirations and pathological
biopsies in some patients with liver cirrhosis. The validity and
reliability of the ultrasound radiomics model were confirmed in the
present study.
To facilitate clinical adoption of the nomogram
model used in the present study, a three-tier implementation
strategy should be implemented. First, for immediate
implementation, a web-based calculator (accessible at frontiersin.org/articles/10.3389/fmed.2024.1474311/fulls)
has been developed, where clinicians can input the two radiomics
values (C2 and C1), direct bilirubin and glutamic-oxalacetic
transaminase levels to obtain the probability of MF vs. liver
cirrhosis. This requires only manual ROI drawing in existing
Picture Archiving and Communication System (PACS) viewers and
feature extraction using the provided script.
For medium-term integration (6-12 months), a
PACS-integrated plugin that enables semi-automated workflow is
currently in development, which will work as follows: i) The
sonographer acquires standard spleen images and flags them for
analysis; ii) a trained technician performs ROI segmentation using
the standardized protocol presented in the current study (estimated
time, 2-3 min); iii) radiomics features are automatically extracted
and combined with laboratory values from the Electronic Medical
Record system; and iv) the nomogram probability is calculated and
displayed in the report template.
For long-term implementation, it is the aim to
generate a fully automated system incorporating deep learning-based
spleen segmentation. The preliminary testing shows that U-Net deep
learning architecture can achieve Dice similarity coefficients of
0.89-0.92 based on preliminary validation using 50 test cases for
spleen segmentation, reducing analysis time to <30 sec. However,
this requires validation on larger datasets before clinical
deployment.
The primary limitation of the present study is the
relatively small sample size, particularly for patients with MF
(n=40) and the validation cohort (n=18). This limitation reflects
the rarity of MF, which has an incidence of only 0.5-1.5 per
100,000 person-years. Despite recruiting from two tertiary centers
over 4.5 years, the strict inclusion criteria necessary for
high-quality radiomics analysis (such as, standardized imaging
protocols and the absence of prior treatment) further limited the
cohort size. The substantial decrease in AUC from the training set
(0.958) to the validation set (0.750) suggested potential
overfitting despite the use of LASSO and Boruta algorithms for
feature selection. To address these limitations and ensure model
generalizability, a multicenter validation strategy should be
conducted using the following criteria : i) Prospective enrollment
from at least five hematology centers nationwide to achieve a
target sample size of 200 patients with MF and 250 patients with
liver cirrhosis over 3 years; ii) standardization of ultrasound
acquisition protocols across centers with mandatory quality control
measures; iii) implementation of external validation using
completely independent datasets from different geographic regions;
and iv) regular model recalibration every 6 months during the
validation phase to maintain optimal performance. Discussions with
the Chinese Hematology Ultrasound Consortium to implement this
validation protocol will be initiated in the future.
In conclusion the model developed in the present
study can distinguish patients with MF from those with liver
cirrhosis in clinical settings, offering a valuable tool for early
diagnosis and treatment. This advancement has the potential to
markedly enhance patient care and outcomes. While the nomogram
model shows promise for differentiating MF from liver cirrhosis,
the current results should be interpreted with caution due to the
limited sample size and evidence of overfitting. Larger,
multicenter validation studies are essential before clinical
implementation.
Acknowledgements
Not applicable.
Funding
Funding: The present study was funded by the Wuxi Double Hundred
Program for Young and Middle-Aged Medical and Health Professionals
(grant no. HB2023001).
Availability of data and materials
The data generated in the present study may be
requested from the corresponding author.
Authors' contributions
SYZ designed the study, SCC and YD edited the
manuscript. SCC and XYX collected data, processed the data and
conducted the statistical analysis. YD and SYZ reviewed and revised
the manuscript. SYZ and YD confirm the authenticity of all the raw
data. All authors read and approved the final manuscript.
Ethics approval and consent to
participate
The present study was approved by the Medical Ethics
Committee of Wuxi People's Hospital (approval no. KY23017). Written
informed consent was obtained from participants for participation
in the study and all methods were carried out in accordance with
The Declaration of Helsinki.
Patient consent for publication
Written informed consent was obtained from the
patients for the publication of clinical details and any
accompanying images.
Competing interests
The authors declare that they have no competing
interests.
References
|
1
|
Lewis SM, Williams A and Eisenbarth SC:
Structure and function of the immune system in the spleen. Sci
Immunol. 4(eaau6085)2019.PubMed/NCBI View Article : Google Scholar
|
|
2
|
Garrison RN, McCoy M, Winkler C, Yam L and
Fry DE: Splenectomy in hematologic malignancy. Am Surg. 50:428–432.
1984.PubMed/NCBI
|
|
3
|
Reinert CP, Hinterleitner C, Fritz J,
Nikolaou K and Horger M: Diagnosis of diffuse spleen involvement in
haematological malignancies using a spleen-to-liver attenuation
ratio on contrast-enhanced CT images. Eur Radiol. 29:450–457.
2019.PubMed/NCBI View Article : Google Scholar
|
|
4
|
Dong HW, Hernandez L, Ghahremani JS,
Chapek MA, Safran BA, Lau DL and Brewer MB: Venous stasis
ulceration due to massive splenomegaly causing iliac vein
compression from secondary myelofibrosis. Vasc Endovascular Surg.
58:769–772. 2024.PubMed/NCBI View Article : Google Scholar
|
|
5
|
Klimova NF and Glasko EN: Myelofibrosis as
one of the masks of liver cirrhosis. Gematol Transfuziol. 28:22–24.
1983.PubMed/NCBI(In Russian).
|
|
6
|
Lu C, Hu XM, Bao WY, Zhou SY, Fan YQ, Ke
J, Wang HS, Zhu RF, Liu Y, Fan L and Xiao SF: Primary biliary
cirrhosis secondary to myelofibrosis: A case report and literature
review. J Clin Hematol. 31:56–58. 2018.PubMed/NCBI
|
|
7
|
Lee MW, Yeon SH, Ryu H, Song IC, Lee HJ,
Yun HJ, Kim SY, Lee JE, Shin KS and Jo DY: Volumetric splenomegaly
in patients with essential thrombocythemia and prefibrotic/early
primary myelofibrosis. Int J Hematol. 114:35–43. 2021.PubMed/NCBI View Article : Google Scholar
|
|
8
|
Gillies RJ, Kinahan PE and Hricak H:
Radiomics: Images are more than pictures, they are data. Radiology.
278:563–77. 2016.PubMed/NCBI View Article : Google Scholar
|
|
9
|
Liu Y, Li C, Guo J and Liu Y: A
clinical-radiomics nomogram for differentiating focal organizing
pneumonia and lung adenocarcinoma. Nan Fang Yi Ke Da Xue Xue Bao.
44:397–404. 2024.PubMed/NCBI View Article : Google Scholar : (In Chinese).
|
|
10
|
Breitfeld V and Lee RE: Pathology of the
spleen in hematologic disease. Surg Clin North Am. 55:233–51.
1975.PubMed/NCBI View Article : Google Scholar
|
|
11
|
Barthold D, Brouwer E, Barton LJ,
Arterburn DE, Basu A, Courcoulas A, Crawford CL, Fedorka PN,
Fischer H, Kim BB, et al: Minimum threshold of bariatric surgical
weight loss for initial diabetes remission. Diabetes Care.
45:92–99. 2022.PubMed/NCBI View Article : Google Scholar
|
|
12
|
Chang TC and Cavuoto KM: Binocular
disturbance after glaucoma drainage device implantation. World J
Ophthalmol. 4:25–28. 2014.PubMed/NCBI View Article : Google Scholar
|
|
13
|
Wang X, He TT, Zhang N, Zhou C, Wang Q,
Bai YF, Zhang JJ, Fu SG, Liang XX, Li X and Gong M: Clinical
characteristics of 12 patients with primary myelofibrosis and liver
cirrhosis. J Clin Hepatol. 36:2524–252. 2020.
|
|
14
|
Li R, Liu HS and Chen Y: Recent research
advance to differentiate portal hypertension associated with
primary myelofibrosis and cirrhosi. Chin J Exp Hematol. 31:598–601.
2023.PubMed/NCBI View Article : Google Scholar : (In Chinese).
|
|
15
|
Mazur R, Celmer M, Silicki J, Hołownia D,
Pozowski P and Międzybrodzki K: Clinical applications of spleen
ultrasound elastography-A review. J Ultrason. 18:37–41.
2018.PubMed/NCBI View Article : Google Scholar
|
|
16
|
Webb M, Shibolet O, Halpern Z, Nagar M,
Amariglio N, Levit S, Steinberg DM, Santo E and Salomon O:
Assessment of liver and spleen stiffness in patients with
myelofibrosis using fibroscan and shear wave elastography.
Ultrasound Q. 31:166–9. 2015.PubMed/NCBI View Article : Google Scholar
|
|
17
|
Xie QX, Jiang XP and Li X: Clinical
characteristic analysis of 17 cases of primary myelofibrosis and
portal hypertension. Chin J Infect Dis. 31:369–370. 2013.
|
|
18
|
Peck-Radosavljevic M: Thrombocytopenia in
chronic liver disease. Liver Int. 37:778–793. 2017.PubMed/NCBI View Article : Google Scholar
|
|
19
|
Yilmaz M and Verstovsek S: Managing
patients with myelofibrosis and thrombocytopenia. Expert Rev
Hematol. 15:233–241. 2022.PubMed/NCBI View Article : Google Scholar
|
|
20
|
Ganeshan D, Bhosale P and Kundra V:
Current update on cytogenetics, taxonomy, diagnosis, and management
of adrenocortical carcinoma: What radiologists should know. AJR Am
J Roentgenol. 199:1283–93. 2012.PubMed/NCBI View Article : Google Scholar
|
|
21
|
Thiele J, Kvasnicka HM, Zankovich R and
Diehl V: Early-stage idiopathic (primary) myelofibrosis-Current
issues of diagnostic features. Leuk Lymphoma. 43:1035–1041.
2002.PubMed/NCBI View Article : Google Scholar
|
|
22
|
Lafortune M, Marleau D, Breton G, Viallet
A, Lavoie P and Huet PM: Portal venous system measurements in
portal hypertension. Radiology. 151:27–30. 1984.PubMed/NCBI View Article : Google Scholar
|
|
23
|
Johnson SS, Anslyn EV, Graham HV, Mahaffy
PR and Ellington AD: Fingerprinting non-terran biosignatures.
Astrobiology. 18:915–922. 2018.PubMed/NCBI View Article : Google Scholar
|
|
24
|
Teodorescu P, Pasca S, Jurj A, Gafencu G,
Joelsson JP, Selicean S, Moldovan C, Munteanu R, Onaciu A, Tigu AB,
et al: Transforming growth factor β-mediated micromechanics
modulates disease progression in primary myelofibrosis. J Cell Mol
Med. 24:11100–11110. 2020.PubMed/NCBI View Article : Google Scholar
|
|
25
|
Moulard O, Mehta J, Fryzek J, Olivares R,
Iqbal U and Mesa RA: Epidemiology of myelofibrosis, essential
thrombocythemia, and polycythemia vera in the European Union. Eur J
Haematol. 92:289–97. 2014.PubMed/NCBI View Article : Google Scholar
|
|
26
|
Enke JS, Moltz JH, D'Anastasi M, Kunz WG,
Schmidt C, Maurus S, Mühlberg A, Katzmann A, Sühling M, Hahn H, et
al: Radiomics features of the spleen as surrogates for CT-based
lymphoma diagnosis and subtype differentiation. Cancers (Basel).
4(713)2022.PubMed/NCBI View Article : Google Scholar
|
|
27
|
Guo L, Liu A, Geng X, Zhao Z, Nie Y, Wang
L, Liu D, Li Y, Li Y, Li D, et al: The role of spleen radiomics
model for predicting prognosis in esophageal squamous cell
carcinoma patients receiving definitive radiotherapy. Thorac
Cancer. 15:947–964. 2024.PubMed/NCBI View Article : Google Scholar
|
|
28
|
Li P, Wu L, Li Z, Li J, Ye W, Shi Z, Xu Z,
Zhu C, Ye H, Liu Z and Liang C: Spleen radiomics signature: A
potential biomarker for prediction of early and late recurrences of
hepatocellular carcinoma after resection. Front Oncol.
11(716849)2021.PubMed/NCBI View Article : Google Scholar
|
|
29
|
Bolognesi M, Merkel C, Sacerdoti D, Nava V
and Gatta A: Role of spleen enlargement in cirrhosis with portal
hypertension. Dig Liver Dis. 34:144–150. 2002.PubMed/NCBI View Article : Google Scholar
|
|
30
|
Meng D, Wei Y, Feng X, Kang B, Wang X, Qi
J, Zhao X and Zhu Q: CT-based radiomics score can accurately
predict esophageal variceal rebleeding in cirrhotic patients. Front
Med (Lausanne). 8(745931)2021.PubMed/NCBI View Article : Google Scholar
|
|
31
|
Kraft WK and Waldman SA: Manufacturer's
drug interaction and postmarketing adverse event data: What are
appropriate uses? Drug Saf. 24:637–643. 2001.PubMed/NCBI View Article : Google Scholar
|
|
32
|
Wang FY, Stankiewicz CA, Bennett NL and
Myers JS: Hit the ground running: Engaging early-career medical
educators in scholarly activity. Acad Med. 94(1837)2019.PubMed/NCBI View Article : Google Scholar
|
|
33
|
Matsumoto S, Imamura H, Takayanagi A,
Fukumitsu R, Goto M, Sunohara T, Fukui N, Omura Y, Akiyama T,
Fukuda T, et al: First-in-human trial of center wire for
neuroendovascular therapy to avoid guidewire-related complications.
Interv Neuroradiol. 31:532–538. 2025.PubMed/NCBI View Article : Google Scholar
|
|
34
|
Zhao W, Bendickson L and Nilsen-Hamilton
M: The lipocalin2 gene is regulated in mammary epithelial cells by
NFκB and C/EBP in response to mycoplasma. Sci Rep.
10(7641)2020.PubMed/NCBI View Article : Google Scholar
|