Introduction
Clear cell renal cell carcinoma (RCC; KIRC) accounts
for the majority of RCC cases, comprising 75-85% of all RCC
subtypes, and remains a leading cause of cancer-related mortality
worldwide, with an estimated ~175,000 deaths annually (1,2).
Global estimates suggest that >400,000 new RCC diagnoses are
made each year and ~175,000 RCC-related deaths, an upward trend
that has persisted for over a decade (3,4).
Despite advances in targeted therapies and immune checkpoint
inhibitors (5,6), outcomes for metastatic disease remain
poor (7). A key reason lies in the
marked biological heterogeneity of the tumor and its ability to
rapidly develop resistance to treatment (8). What complicates matters further is
that a number of patients with RCC also suffer from comorbid
conditions, particularly chronic kidney disease (CKD). Studies
report that 30-40% of patients with RCC have concomitant CKD
(9), a combination that not only
accelerates renal function decline but also limits tolerance to
standard oncologic regimens (10).
Clinically, this creates a difficult balancing act as aggressive
immunotherapies may control tumor growth but risk worsening kidney
damage, directly impacting quality of life and survival. Notably,
patients with both KIRC and CKD experience a median survival
reduction of 2-3 years compared with those with either condition
alone (11,12).
At the molecular level, the interplay between RCC
and CKD is poorly understood. Both diseases involve dysregulated
immune pathways and metabolic disturbances (13), yet most prior research has treated
them as separate entities. This siloed approach overlooks potential
shared mechanisms, especially those involving immunogenic cell
death (ICD), a form of regulated cell death that can stimulate
antitumor immunity (14,15). ICD has received little attention in
the context of RCC-CKD comorbidity, despite its theoretical
relevance (16).
The aim of the present study was to address this
gap. Rather than analyzing RCC or CKD in isolation, multi-omics
data, from bulk and single-cell RNA sequencing to epigenetic and
proteomic profiles, was integrated using machine learning to
identify convergent molecular signatures. The present study aimed
to identify shared molecular mechanisms linking CKD and RCC, with a
focus on exploring the role of Wilms tumor 1 (WT1) in
immune-metabolic crosstalk. Ultimately, we hope that the present
study will move beyond descriptive associations and lay the
groundwork for a comorbidity-aware framework in RCC management, a
framework where treatment decisions account not just for tumor
biology, but also for the underlying kidney health of patients.
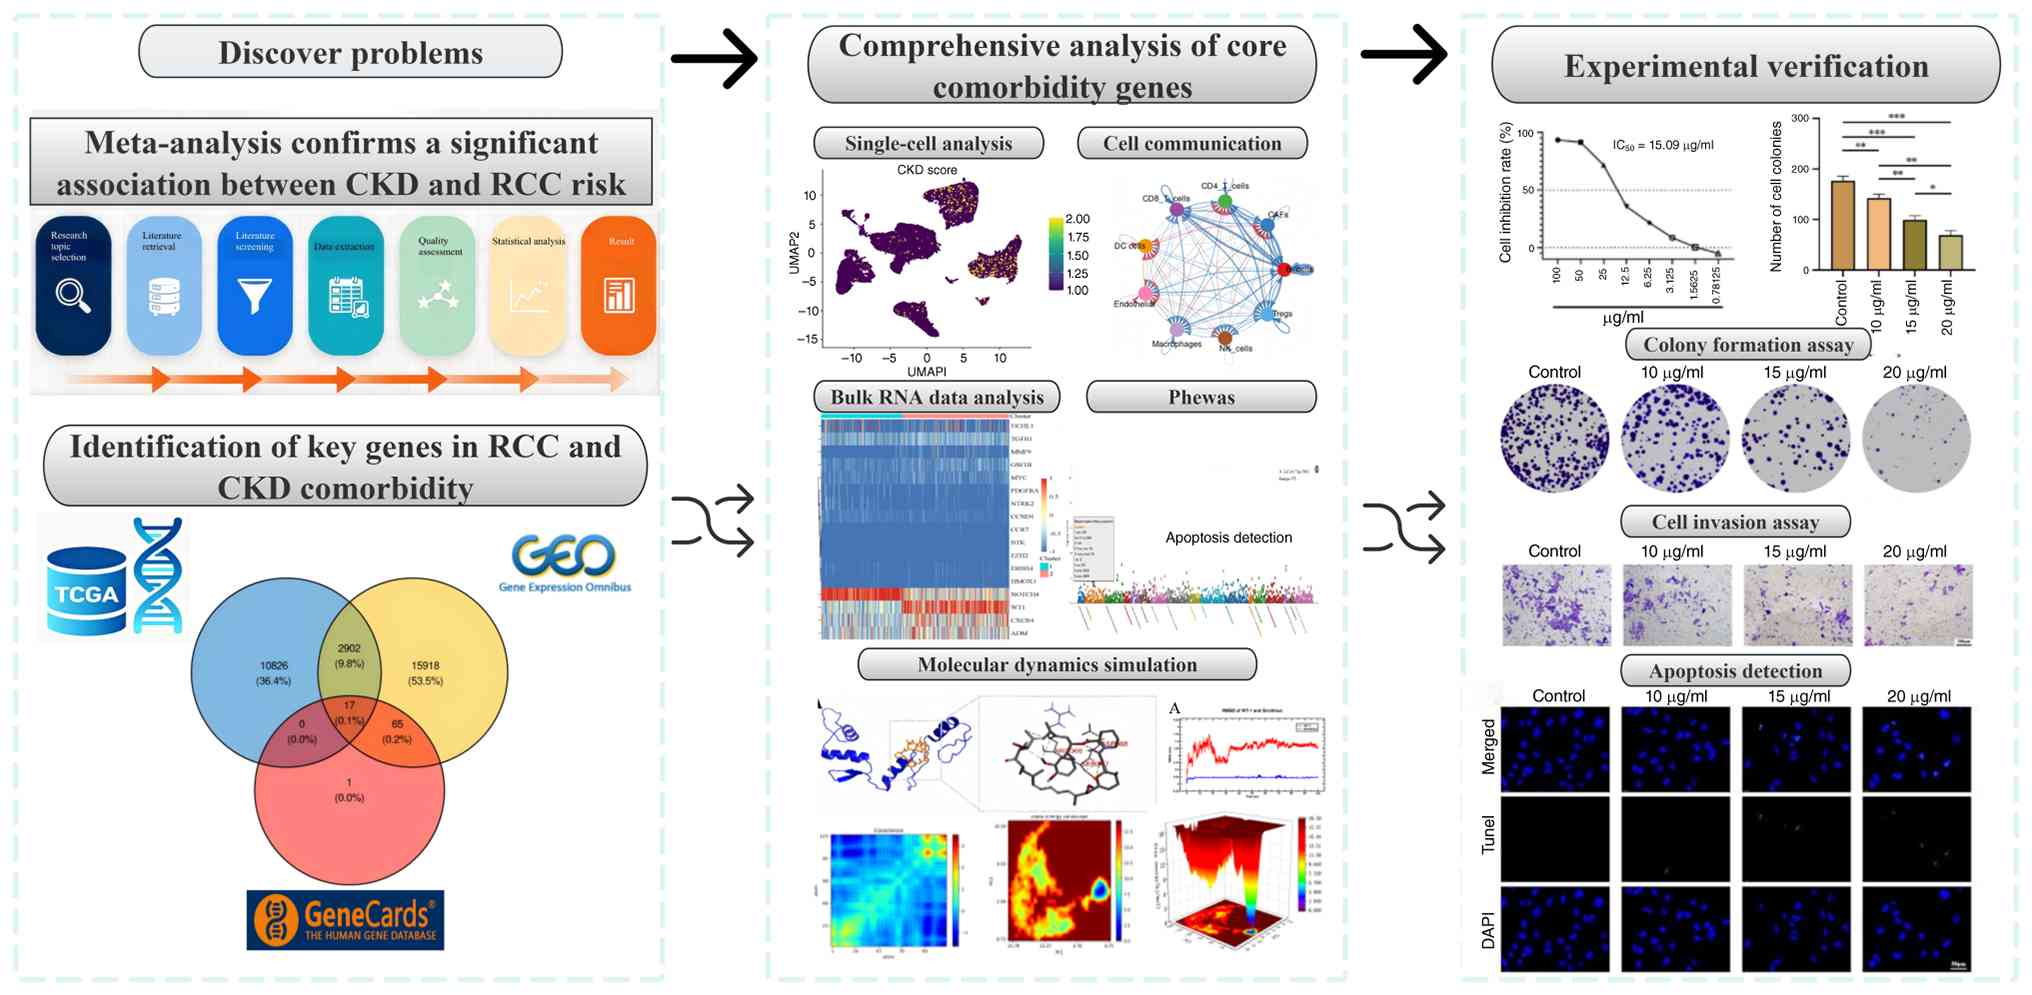
Fig. 1 outlines the integrated
workflow of the present study, from data integration to therapeutic
hypothesis generation.
Materials and methods
Data sources and preprocessing
RNA-sequencing (seq) data from The Cancer Genome
Atlas (TCGA)-KIRC dataset (https://portal.gdc.cancer.gov/), which included 539
tumor samples, 72 adjacent non-tumor samples and clinical records,
were analyzed. For CKD, the GSE98603 dataset (GPL13497 platform;
https://www.ncbi.nlm.nih.gov/geo/query/acc.cgi?acc=GSE98603)
from the Gene Expression Omnibus (GEO) database (https://www.ncbi.nlm.nih.gov/geo)(), comprising
renal cortical biopsies from 9 patients with CKD and 9 healthy
controls, was used. An ICD-related gene list was compiled from
GeneCards by querying ‘immunogenic cell death’ and retaining genes
with a relevance score above the median score of 19.16. Raw counts
from TCGA were converted to fragments per kilobase of transcript
per million mapped reads (FPKM) and log2(FPKM + 1)
transformed.
Meta-analysis
A systematic review and meta-analysis were conducted
to assess whether CKD may be associated with an increased risk of
incident RCC in cancer-free adults. PubMed (https://pubmed.ncbi.nlm.nih.gov/), Web of Science
(www.webofscience.com), CNKI (https://www.cnki.net/), WanFang (https://www.wanfangdata.com.cn/index.html), VIP
(https://www.cqvip.com/) and CBM (https://www.sinomed.ac.cn/zh/index.jsp?type=wx) were
searched from inception to 2025, using predefined key words related
to CKD and RCC. The initial search yielded 7,743 records; after
removing duplicates, 5,218 unique citations underwent
title/abstract screening, followed by full-text assessment of 42
potentially eligible articles. In total, 7 studies met the
inclusion criteria (Table SI)
(17-23),
of which 4 reported sufficient binary data for meta-analysis. Study
quality was assessed using the Newcastle-Ottawa Scale (NOS)
(24) and all were rated high
quality (NOS≥7). Given anticipated heterogeneity, a random-effects
model was used to calculate the pooled odds ratio (OR). Publication
bias was evaluated using funnel plots, in which the log[OR] was
plotted against its standard error for each included study. Funnel
plot asymmetry was visually inspected for the overall meta-analysis
and for the East Asian subgroup analysis. Egger's regression test
was also performed to quantitatively assess funnel plot asymmetry,
with P<0.05 considered indicative of significant publication
bias. All analyses were performed using RevMan software (version
5.4; The Cochrane Collaboration).
Inclusion criteria
The 7 included studies met the following criteria:
i) Cohort, case-control or cross-sectional design assessing the
association between CKD and incident RCC; ii) adult general
population without baseline RCC; iii) CKD defined by estimated
glomerular filtration rate (eGFR) <60 ml/min/1.73 m2,
albuminuria (albumin-to-creatinine ratio ≥30 mg/g) or International
Classification of Diseases diagnostic codes (Fifth Edition, 2016)
(25); iv) RCC confirmed
pathologically, radiologically or by cancer registry; v) reported
ORs, hazard ratios (HRs) or relative risks with 95% confidence
intervals (CIs), or provided raw data to calculate them; four
studies contributed to the binary-variable meta-analysis, and the
other three reported consistent positive associations without being
pooled; vi) original peer-reviewed articles in English or Chinese,
excluding reviews, case reports or preclinical studies; vii) NOS
score ≥7, indicating high quality.
Identification and functional analysis
of key CDK-associated genes (CKDGs)
Differentially expressed genes (DEGs) in the
TCGA-KIRC cohort were identified by comparing tumor samples (n=539)
with adjacent non-tumor tissues (n=72) using the edgeR package
(v4.2.1) in R (https://www.r-project.org/). Genes with
|log2[fold change (FC)]|>1 and false discovery rate
(FDR) <0.05 were considered significantly dysregulated,
following the standard practice for TCGA RNA-seq analysis (26). For the CKD GSE98603 dataset,
differential expression analysis was performed via GEO2R-2025,
applying thresholds of |log2FC|>0.5 and adjusted
P<0.05 to account for the smaller effect sizes typically
observed in non-neoplastic kidney disease (27) (Table
SII).
The intersection of the KIRC DEGs, CKD DEGs and the
ICD-related gene set from GeneCards was taken to identify common
key genes (28,29), which were designated CKDGs. To
interpret the biological roles and pathway involvements of the
identified CKDGs, Gene Ontology (GO) annotation and Kyoto
Encyclopedia of Genes and Genomes (KEGG) enrichment were performed
with the clusterProfiler R package (version 4.12.6), adopting a
significance threshold of FDR<0.05 (30,31).
The prognostic value of each CKDG was assessed using univariate Cox
proportional hazards regression on overall survival (OS) data from
the TCGA-KIRC cohort, estimating HRs and corresponding P-values
(32). To explore functional
relationships among the CKDGs, a protein-protein interaction (PPI)
network was built using the STRING database (version 12.0;
https://cn.string-db.org/), limited to Homo
sapiens and retaining interactions with a confidence score
≥0.4. The resulting network was imported into Cytoscape (v3.9.1;
https://cytoscape.org/) for visualization and hub
gene identification based on degree centrality.
Single-cell RNA-seq data analysis
The single-cell RNA-seq GSE304466 (https://www.ncbi.nlm.nih.gov/geo/query/acc.cgi?acc=GSE304466)
dataset from the GEO was analyzed to characterize the tumor immune
microenvironment in KIRC. Raw count matrices were processed using
Seurat (v5.1.0) in R (33). Cells
were retained if they expressed ≥200 genes and had <20%
mitochondrial reads; genes detected in <10 cells were excluded.
Data were normalized using the LogNormalize method, scaled and
subjected to principal component analysis. Clusters were identified
via the Louvain algorithm on a k-nearest neighbor graph
(resolution=0.6) and cell types were annotated based on canonical
markers (34). To evaluate CKDG
activity across cell populations, a CKDG signature score was
calculated for each cell using Seurat's AddModuleScore function
(35). For intercellular
communication, cells were stratified into high- and low-CKDG-score
groups (median split) and CellChat (v2.2.0) analysis was performed
to compare ligand-receptor interaction patterns between groups
(36,37). Pseudotime trajectory analysis of
T-cell subsets was performed using the Monocle3 R package (version
1.0; https://github.com/cole-trapnell-lab/monocle3) within
the R statistical computing environment (version 4.1.0). The
analysis followed the standard Monocle3 workflow: Dimensionality
reduction using Uniform Manifold Approximation and Projection, cell
clustering, graph learning and pseudotime calculation. Naive
CD4+ T cells were designated as the root of the
trajectory.
Identification of CKD-associated
molecular subtypes and immune landscape analysis
Unsupervised consensus clustering of TCGA-KIRC
patients based on the expression of the 17 CKDGs was performed
using the ConsensusClusterPlus R package (v1.64) (38). After evaluating consensus
cumulative distribution functions and the proportion of ambiguous
clustering across k=2-6, k=2 was selected as the optimal partition,
yielding CKDGs-Cluster 1 and Cluster 2 (Table SIII). Kaplan-Meier survival curves
and log-rank tests were performed using the survival R package
(version 3.8-3; https://cran.r-project.org/web/packages/survival/index.html)
to compare OS between subtypes (Table
SIV). Heatmaps were generated using the pheatmap R package
(version 1.0.13; https://cran.r-project.org/web/packages/pheatmap/index.html)
to display CKDG expression patterns alongside key
clinicopathological variables. To identify enriched biological
pathways, Gene Set Enrichment Analysis (GSEA; v4.2.3) was performed
using hallmark gene sets from MSigDB (https://www.gsea-msigdb.org/), considering results
significant at FDR<0.25(39).
The tumor immune microenvironment was assessed using two
complementary approaches. ESTIMATE scores (stromal, immune and
combined) were calculated using the estimate R package (version
1.0.13; https://github.com/oicr-gsi/ESTIMATE) to infer
non-tumor content. CIBERSORTx (accessed via https://cibersortx.stanford.edu/) was applied to
estimate the relative proportions of 22 immune cell types from bulk
RNA-seq profiles (40).
Differences in immune composition between clusters were tested
using Wilcoxon rank-sum tests. Tumor immune dysfunction and
exclusion (TIDE) scores were calculated for each sample using the
TIDE web platform (http://tide.dfci.harvard.edu/). Gene expression
profiles were submitted to the ‘Response Prediction’ module of the
TIDE website, which returns TIDE scores (a higher score indicates
greater tumor immune dysfunction/exclusion potential and a lower
score predicts immunotherapy response).
Construction of a machine
learning-based prognostic signature
A CKDG-based prognostic signature was constructed
using TCGA-KIRC patients randomly split into training (70%) and
testing (30%) cohorts (set.seed=123). In the training cohort, CKDGs
were first screened for association with OS via univariate Cox
regression (P<0.05). The significant candidates were then
further prioritized using the Random Survival Forest algorithm as
implemented in the randomForestSRC R package (version 3.2.0;
https://cran.r-project.org/web/packages/randomForestSRC/index.html),
retaining genes with positive minimal depth-based variable
importance. The remaining genes were subsequently subjected to
Least Absolute Shrinkage and Selection Operator (LASSO)-Cox
regression (R package glmnet; v4.1-7; https://cran.r-project.org/package=glmnet) with
10-fold cross-validation; the optimal penalty parameter λ was
selected at the value yielding the minimum partial likelihood
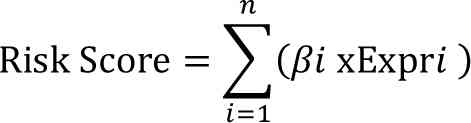
deviance (λ.min) (41). Genes
retained by LASSO were included in a multivariate Cox proportional
hazards model to derive a risk score:
where βi is the regression coefficient
and Expri is the expression of gene i. The median risk
score from the training cohort was used to dichotomize patients
into high- and low-risk groups in both cohorts. Model performance
was evaluated by Kaplan-Meier survival analysis (log-rank test) and
time-dependent receiver operating characteristic (ROC) curves (R
package timeROC; version 0.4.1; https://cran.r-project.org/web/packages/timeROC/index.html).
Phenome-wide association study
(PheWAS)
To explore the clinical relevance of CKDGs
(particularly the top-priority gene, WT1) a phenome-wide scan was
performed using publicly available PheWAS results from the
genome-wide association study (GWAS) catalog (accessed June 2025;
https://www.ebi.ac.uk/gwas/) and the
UKBiobank TOPMed-imputed PheWeb (https://pheweb.org/UKB-TOPMed). Gene-trait
associations derived from gene-based tests (such as MAGMA or
VEGAS2) that mapped single nucleotide polymorphisms to WT1 and
other CKDGs were focused on. Given the large number of tested
phenotypes (>1,000), a Bonferroni-corrected significance
threshold (P<0.05/N) was applied and associations at FDR<0.1
were reported. Renal carcinoma and related kidney disease
phenotypes were highlighted a priori based on the focus of the
present study (42).
MD simulations and molecular
docking
The crystal structure of the WT1 zinc finger domain
(PDB ID: 1A4Y; residues 270-340; https://www.rcsb.org/) was retrieved from the RCSB PDB
(43) Virtual screening was
performed using AutoDock Vina software (v1.1.2; http://vina.scripps.edu/) by docking compounds from
the zinc small molecule database into the active site of WT1.
Top-ranking candidate compounds were selected based on binding free
energy (ΔG, kcal/mol) and binding mode analysis. MD simulations
were carried out on the most promising protein-ligand complexes
using Gromacs (2021) software (version 2021.1; https://www.gromacs.org/) (44,45).
Following the MD simulations, complex stability was analyzed by
computing the root mean square deviation (RMSD), reflecting atomic
positional drift, and the radius of gyration (Rg), indicating
overall compactness, across the production trajectory. Molecular
Mechanics/Poisson-Boltzmann Surface Area (MM/PBSA) binding free
energy calculations were performed using the gmx_MMPBSA tool
(version 1.6.0; https://valdes-tresanco-ms.github.io/gmx_MMPBSA/dev/)
based on the molecular dynamics trajectories generated with Gromacs
2021.
Cell culture
Under standard culture conditions (37˚C, 5%
CO2, humidified), UOK276 cells (kindly provided by
Professor Zhang, Zhejiang Provincial Key Laboratory of Precision
Diagnosis and Therapy for Urological Diseases, Hangzhou, China)
were propagated in DMEM (Procell Life Science & Technology Co.,
Ltd.) supplemented with 10% fetal bovine serum (FBS) (Procell Life
Science & Technology Co., Ltd.).
Cell counting kit-8 (CCK-8) assay
A dose-response assay was conducted to determine the
IC50 of sirolimus (MedChemExpress) against UOK276 cells
using the CCK-8 kit (Dojindo Laboratories, Inc.). Briefly, cells in
the log phase were seeded (5x10³/well) in 96-well
plates. After adherence, the cells were exposed to a gradient of
sirolimus concentrations (0, 1.25, 2.5, 5, 10, 20, 40 and 80 µg/ml)
in quintuplicate for 48 h at 37˚C in a humidified atmosphere
containing 5% CO2. Post-treatment, each well was
incubated with 10 µl of CCK-8 solution for 2 h. The absorbance at
450 nm was then recorded. Cell viability (%) was calculated
relative to the untreated control and the IC50 value was
generated by non-linear curve fitting in GraphPad Prism 9.0
(Dotmatics).
Colony formation assay
A colony formation assay was employed to measure the
long-term proliferative capacity of UOK276 cells following
sirolimus treatment. Cells were seeded at a low density (500
cells/well) in 6-well plates and, after attachment, exposed to
sirolimus at 0, 10, 15 or 20 µg/ml (triplicates per concentration).
The culture was continued for 10 days with refreshment of
drug-containing medium every third day. Following the appearance of
macroscopic colonies in the control wells, the assay was
terminated. Subsequent to PBS washing, cells were fixed with 4%
paraformaldehyde (25˚C, 15 min) and stained with 0.1% crystal
violet (25˚C, 30 min). After washing and drying, colonies (>50
cells) were counted using ImageJ (version 1.53t; National
Institutes of Health). Three independent experimental repeats were
performed.
Cell invasion assay (Transwell)
To determine whether sirolimus impairs the invasive
potential of UOK276 cells, a Transwell invasion assay was
performed. Chambers (8 µm pore; Corning, Inc.; cat. no. 3428) were
pre-coated with a layer of Matrigel (BD Biosciences; cat. no.
356234) at 37˚C for 30 min. Cells, pre-exposed to sirolimus (0, 10,
15 or 20 µg/ml) for 48 h, were placed in the serum-free upper
chamber (1x10⁵ cells/ml in 200 µl), while the lower
chamber contained medium with 20% FBS to induce chemotaxis. After
48 h, cells that had not invaded were removed from the upper side
of the membrane. The cells that had invaded to the lower side were
then fixed with 4% paraformaldehyde (25˚C, 30 min), stained with
0.1% crystal violet (25˚C, 30 min) and quantified by counting five
random fields per membrane under an inverted microscope. Three
independent experimental replicates were carried out.
Apoptosis detection: Terminal
deoxynucleotidyl transferase dUTP nick-end labeling (TUNEL)
staining
Sirolimus-induced apoptosis in UOK276 cells was
assessed using the TUNEL assay. Cells were treated with sirolimus
(0, 10, 15 or 20 µg/ml) for 48 h at 25˚C, then fixed with 4%
paraformaldehyde (25˚C, 30 min) and permeabilized with 0.1% Triton
X-100 (25˚C, 30 min). DNA fragmentation was detected using the In
Situ Cell Death Detection Kit, Fluorescein (Roche Diagnostics; cat.
no. 12156792910), according to the manufacturer's protocol. Nuclei
were counterstained with DAPI (1 µg/ml at 25˚C for 10 min. Images
were acquired using a Zeiss LSM 880 confocal microscope (63x oil
objective; excitation 488 nm for FITC, 405 nm for DAPI).
TUNEL-positive nuclei (green fluorescence) were quantified in five
random fields per sample using ImageJ (version 1.53t). Data
represent three independent biological replicates.
Statistical analysis
Statistical analyses were performed using R (v4.4.1)
for bioinformatics and GraphPad Prism 9.0 for experimental data.
All cell-based experiments were conducted in three independent
biological replicates and data are presented as the mean ± SD.
Normality was assessed using the Shapiro-Wilk test and homogeneity
of variance by Levene's test. For comparisons across more than two
groups, one-way ANOVA followed by Tukey's post hoc test was used
for pairwise comparisons. P<0.05 was considered to indicate a
statistically significant difference.
Results
Confirmation of a significant
association between CKD and RCC risk
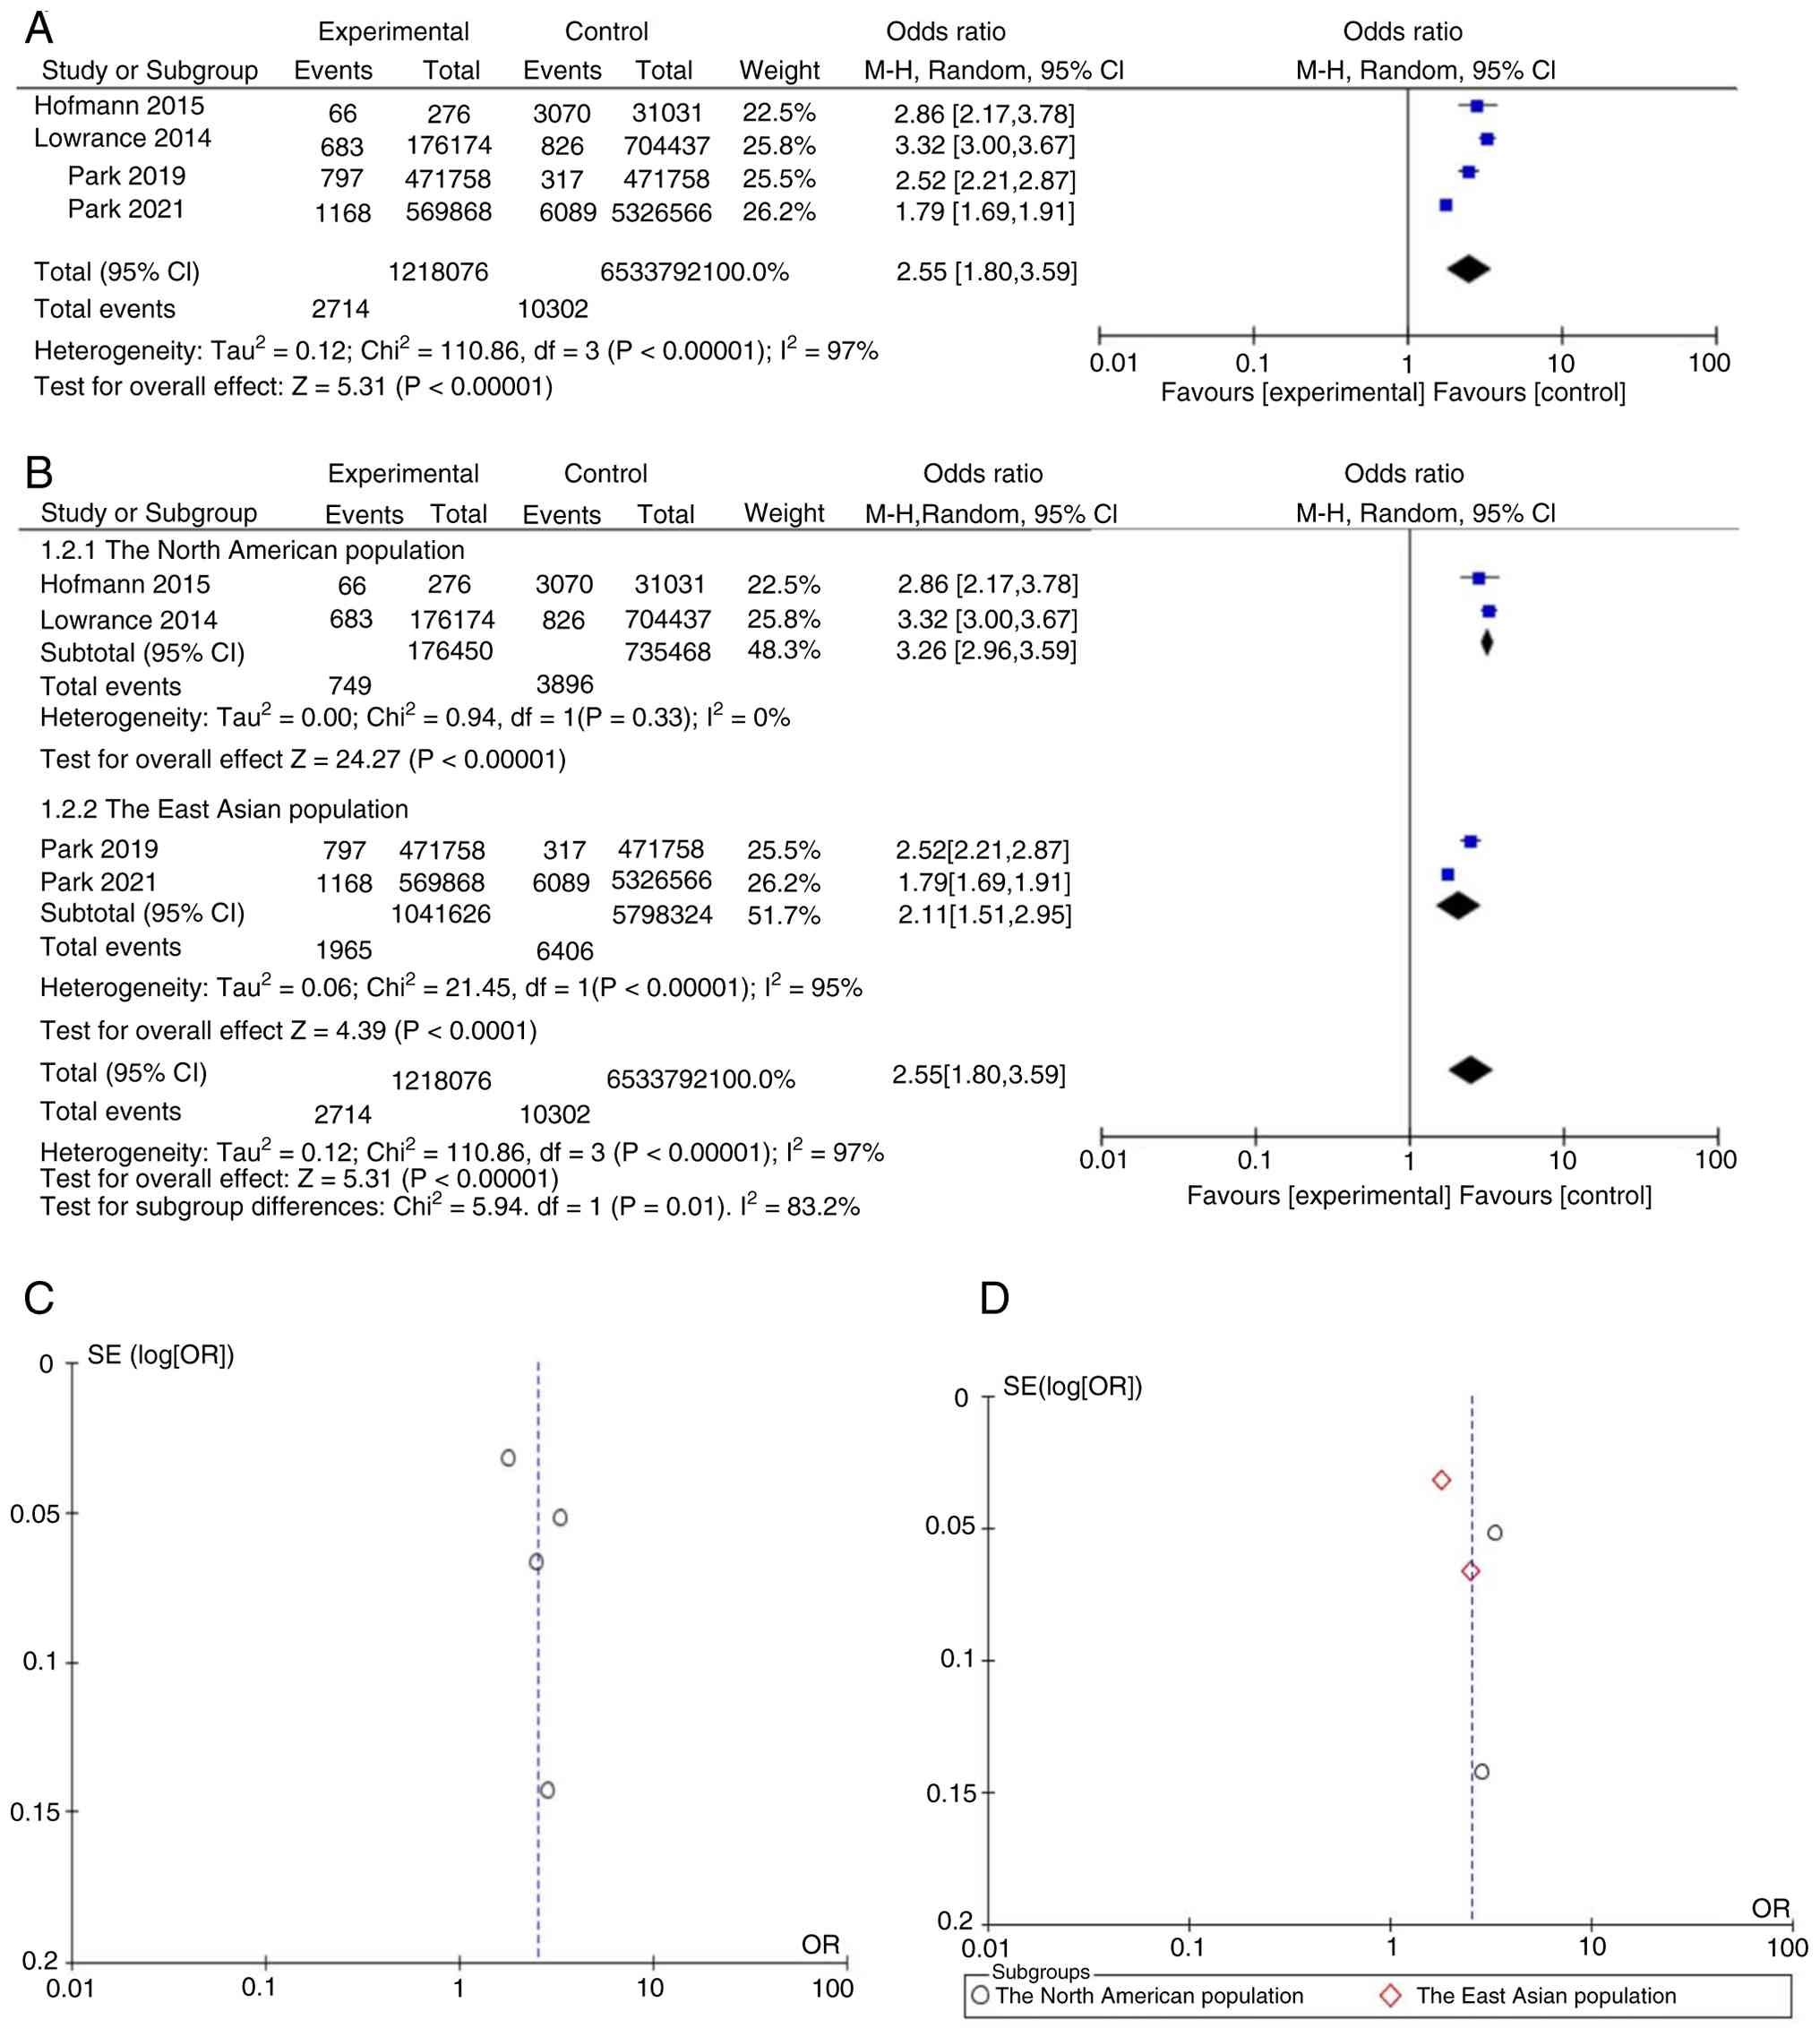
The present meta-analysis identified a significant
association between pre-existing CKD and an increased risk of
new-onset RCC, with a pooled OR of 2.55 (95% CI, 1.80-3.59;
P<0.001; Fig. 2A). Notable
heterogeneity was observed across studies (I²=97%). Subgroup
analysis by geographical region revealed an OR of 3.26 (95% CI:
2.96-3.59; I²=0%) in North American studies and 2.11 (95% CI:
1.51-2.95; I²=95%) in East Asian studies (Fig. 2B). The between-group difference was
statistically significant (P=0.01). Within the East Asian subgroup,
marked methodological differences were noted between Park et
al (18) and Park et al
(23), including CKD diagnostic
criteria (eGFR-only vs. eGFR + albuminuria), control selection
(population-based vs. hospital-based) and adjustment for
hypertension and diabetes, which may account for the residual
heterogeneity. Notably, 3 additional studies (17,19,22)
reported qualitatively consistent positive associations between CKD
and RCC risk but were excluded from quantitative synthesis due to
incompatible data formats. Visual inspection of the funnel plot for
the overall analysis (Fig. 2C)
revealed a roughly symmetrical distribution of effect estimates
around the pooled log[OR], suggesting no substantial publication
bias. Similarly, the funnel plot for the East Asian subgroup
(Fig. 2D) showed generally
symmetrical scatter, indicating that publication bias was unlikely
to have distorted the subgroup estimate.
Identification and characterization of
key genes in RCC and CKD comorbidity
To identify shared molecular features between KIRC
and CKD, DEGs from the TCGA-KIRC cohort and the CKD GSE98603
dataset were integrated. Differential expression analysis
identified 10,826 DEGs in TCGA-KIRC (|log2FC|>1, FDR
<0.05; Fig. 3A) and 15,918 DEGs
in GSE98603 (|log2FC|>0.5, adj. P<0.05).
Intersecting these DEGs with a curated set of 99 ICD-related genes
(GeneCards relevance score ≥10) yielded 17 overlapping genes
(Fig. 3B). These co-dysregulated,
ICD-associated genes were designated CKDGs. KEGG pathway enrichment
of the CKDGs highlighted involvement in oncogenic signaling,
including the MAPK and PI3K-Akt pathways, as well as microRNAs in
cancer (Fig. 3C). GO analysis
showed enrichment in biological processes, such as epithelial tube
morphogenesis and positive regulation of transferase activity, and
in molecular functions including protein tyrosine kinase activity
(Fig. 3D). Univariate Cox
regression in the TCGA-KIRC cohort identified 4 CKDGs significantly
associated with OS (P<0.05; Fig.
3E): 3 risk genes (HR>1) and 1 protective gene (HR<1). A
PPI network constructed via STRING (confidence ≥0.7) identified
WT1, adrenomedullin and C-C chemokine receptor 7 as hub genes based
on degree centrality (Fig. 3F),
prioritizing them for downstream validation.
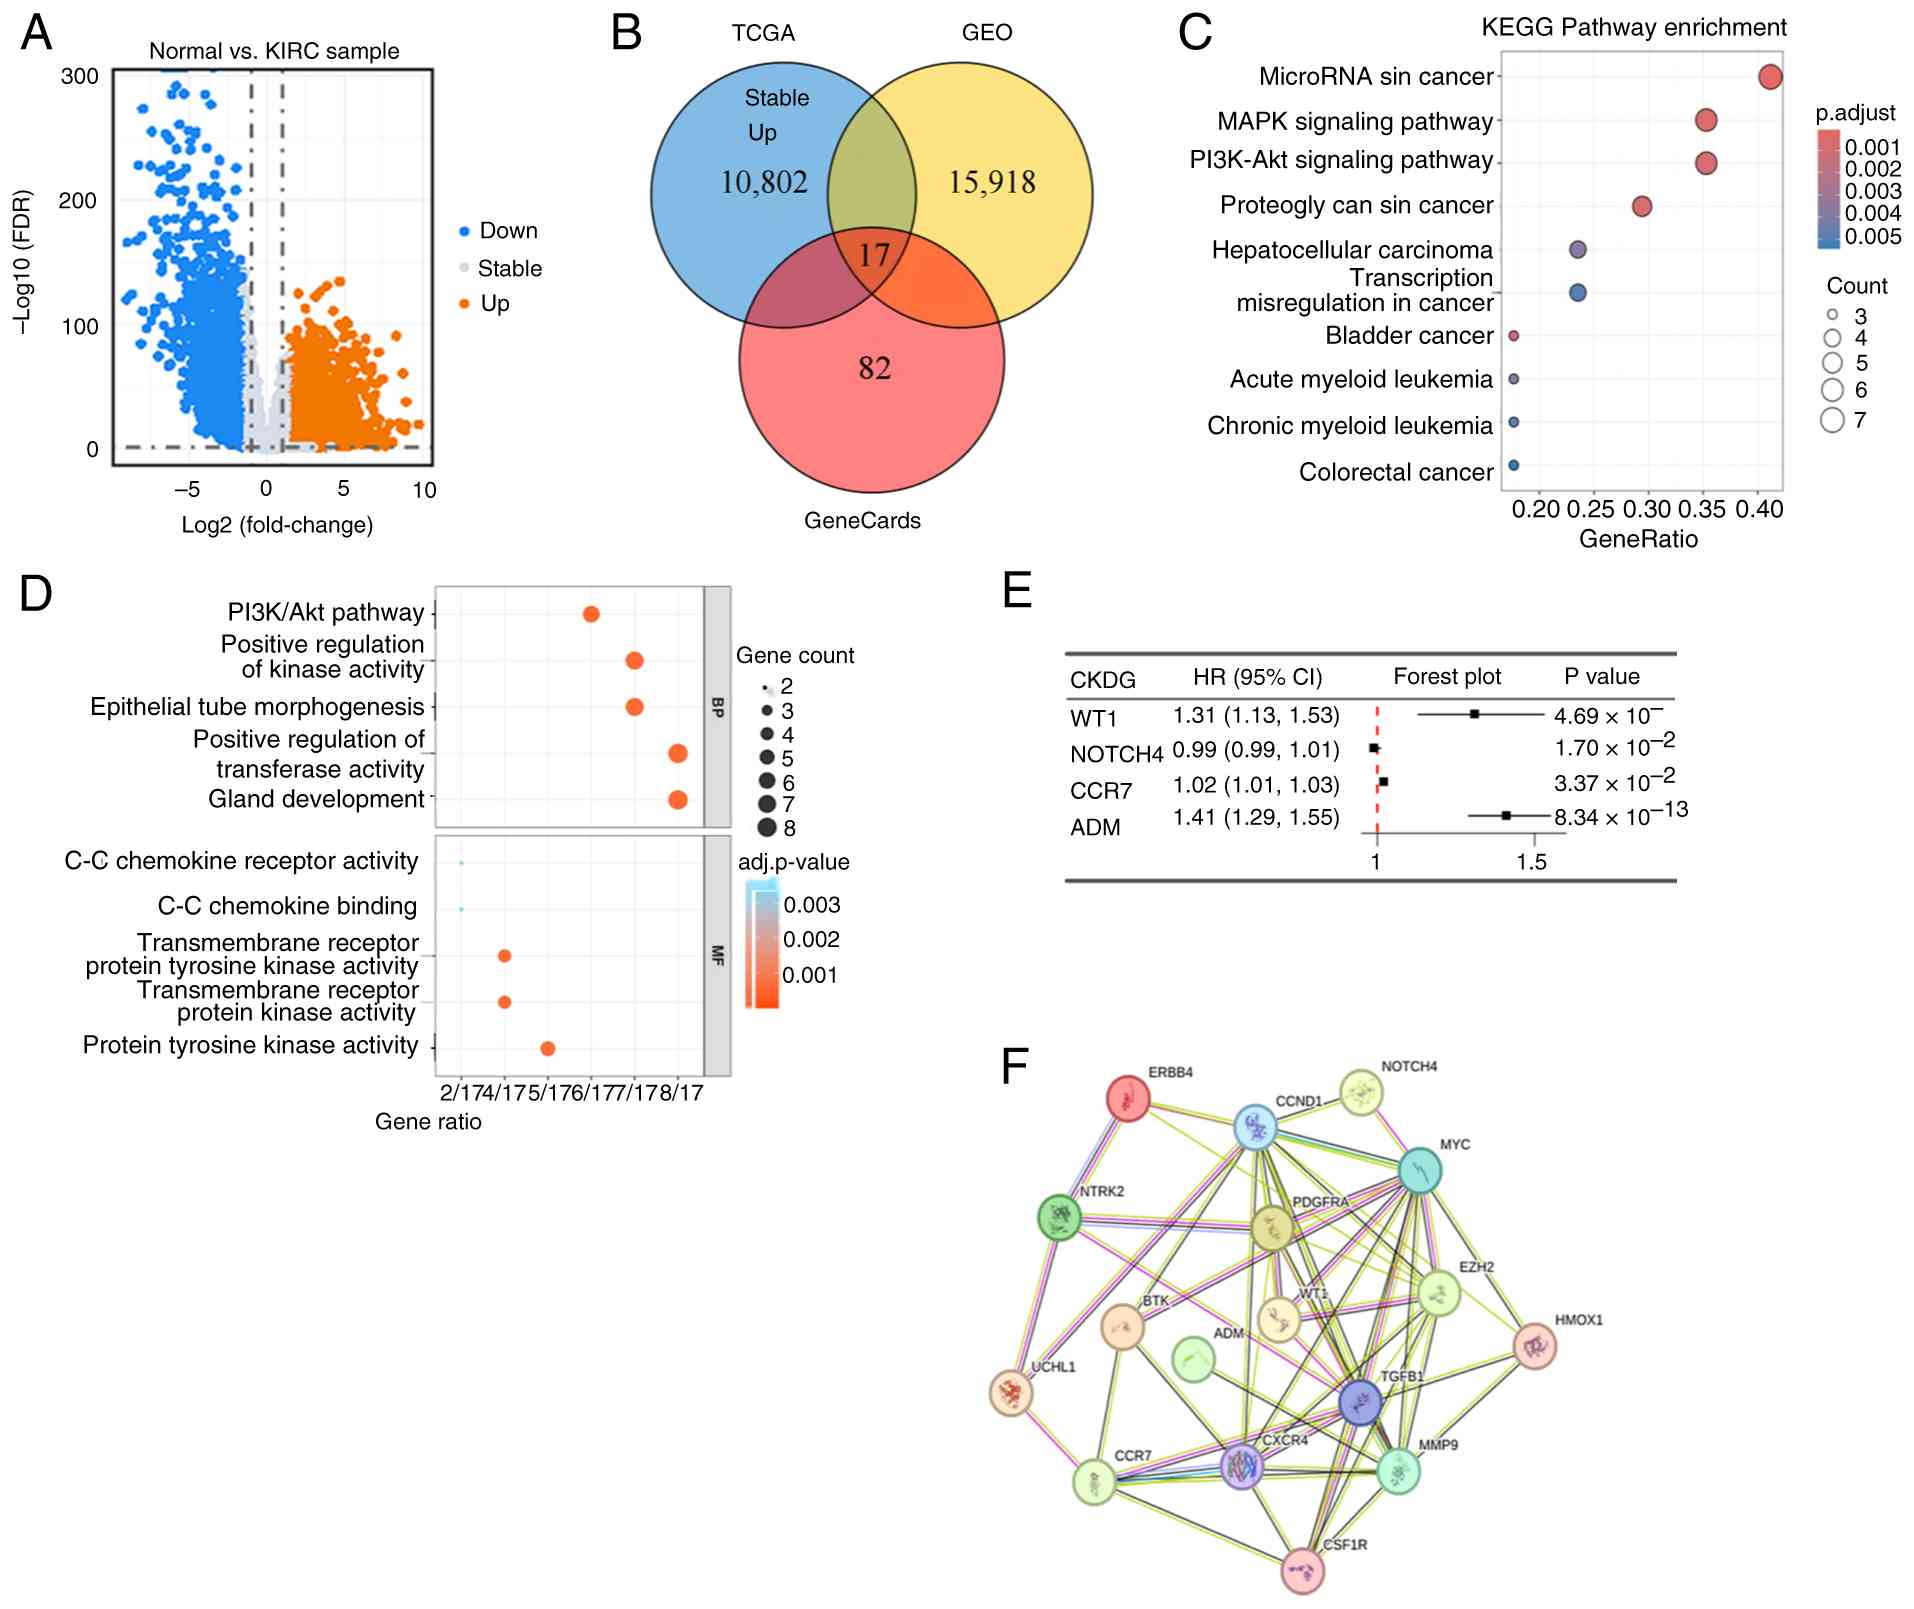 | Figure 3Identification and characterization
of CKDGs shared between KIRC and CKD. (A) Volcano map of
differential gene expression in the TCGA-KIRC cohort. (B) Venn
diagrams of CKDGs from the TCGA, GEO and GeneCards databases. (C)
KEGG analysis and (D) Gene Ontology analysis based on CKDGs. (E)
Prognostic analysis based on CKDGs. (F) Protein-protein interaction
network based on the CKDGs. TCGA, The Cancer Genome Atlas; FDR,
false discovery rate; KIRC, kidney renal clear cell carcinoma; GEO,
Gene Expression Omnibus; KEGG, Kyoto Encyclopedia of Genes and
Genomes; BP, biological process; MF, molecular function; CKDG,
chronic kidney disease-associated gene; HR, hazard ratio; CI,
confidence interval. |
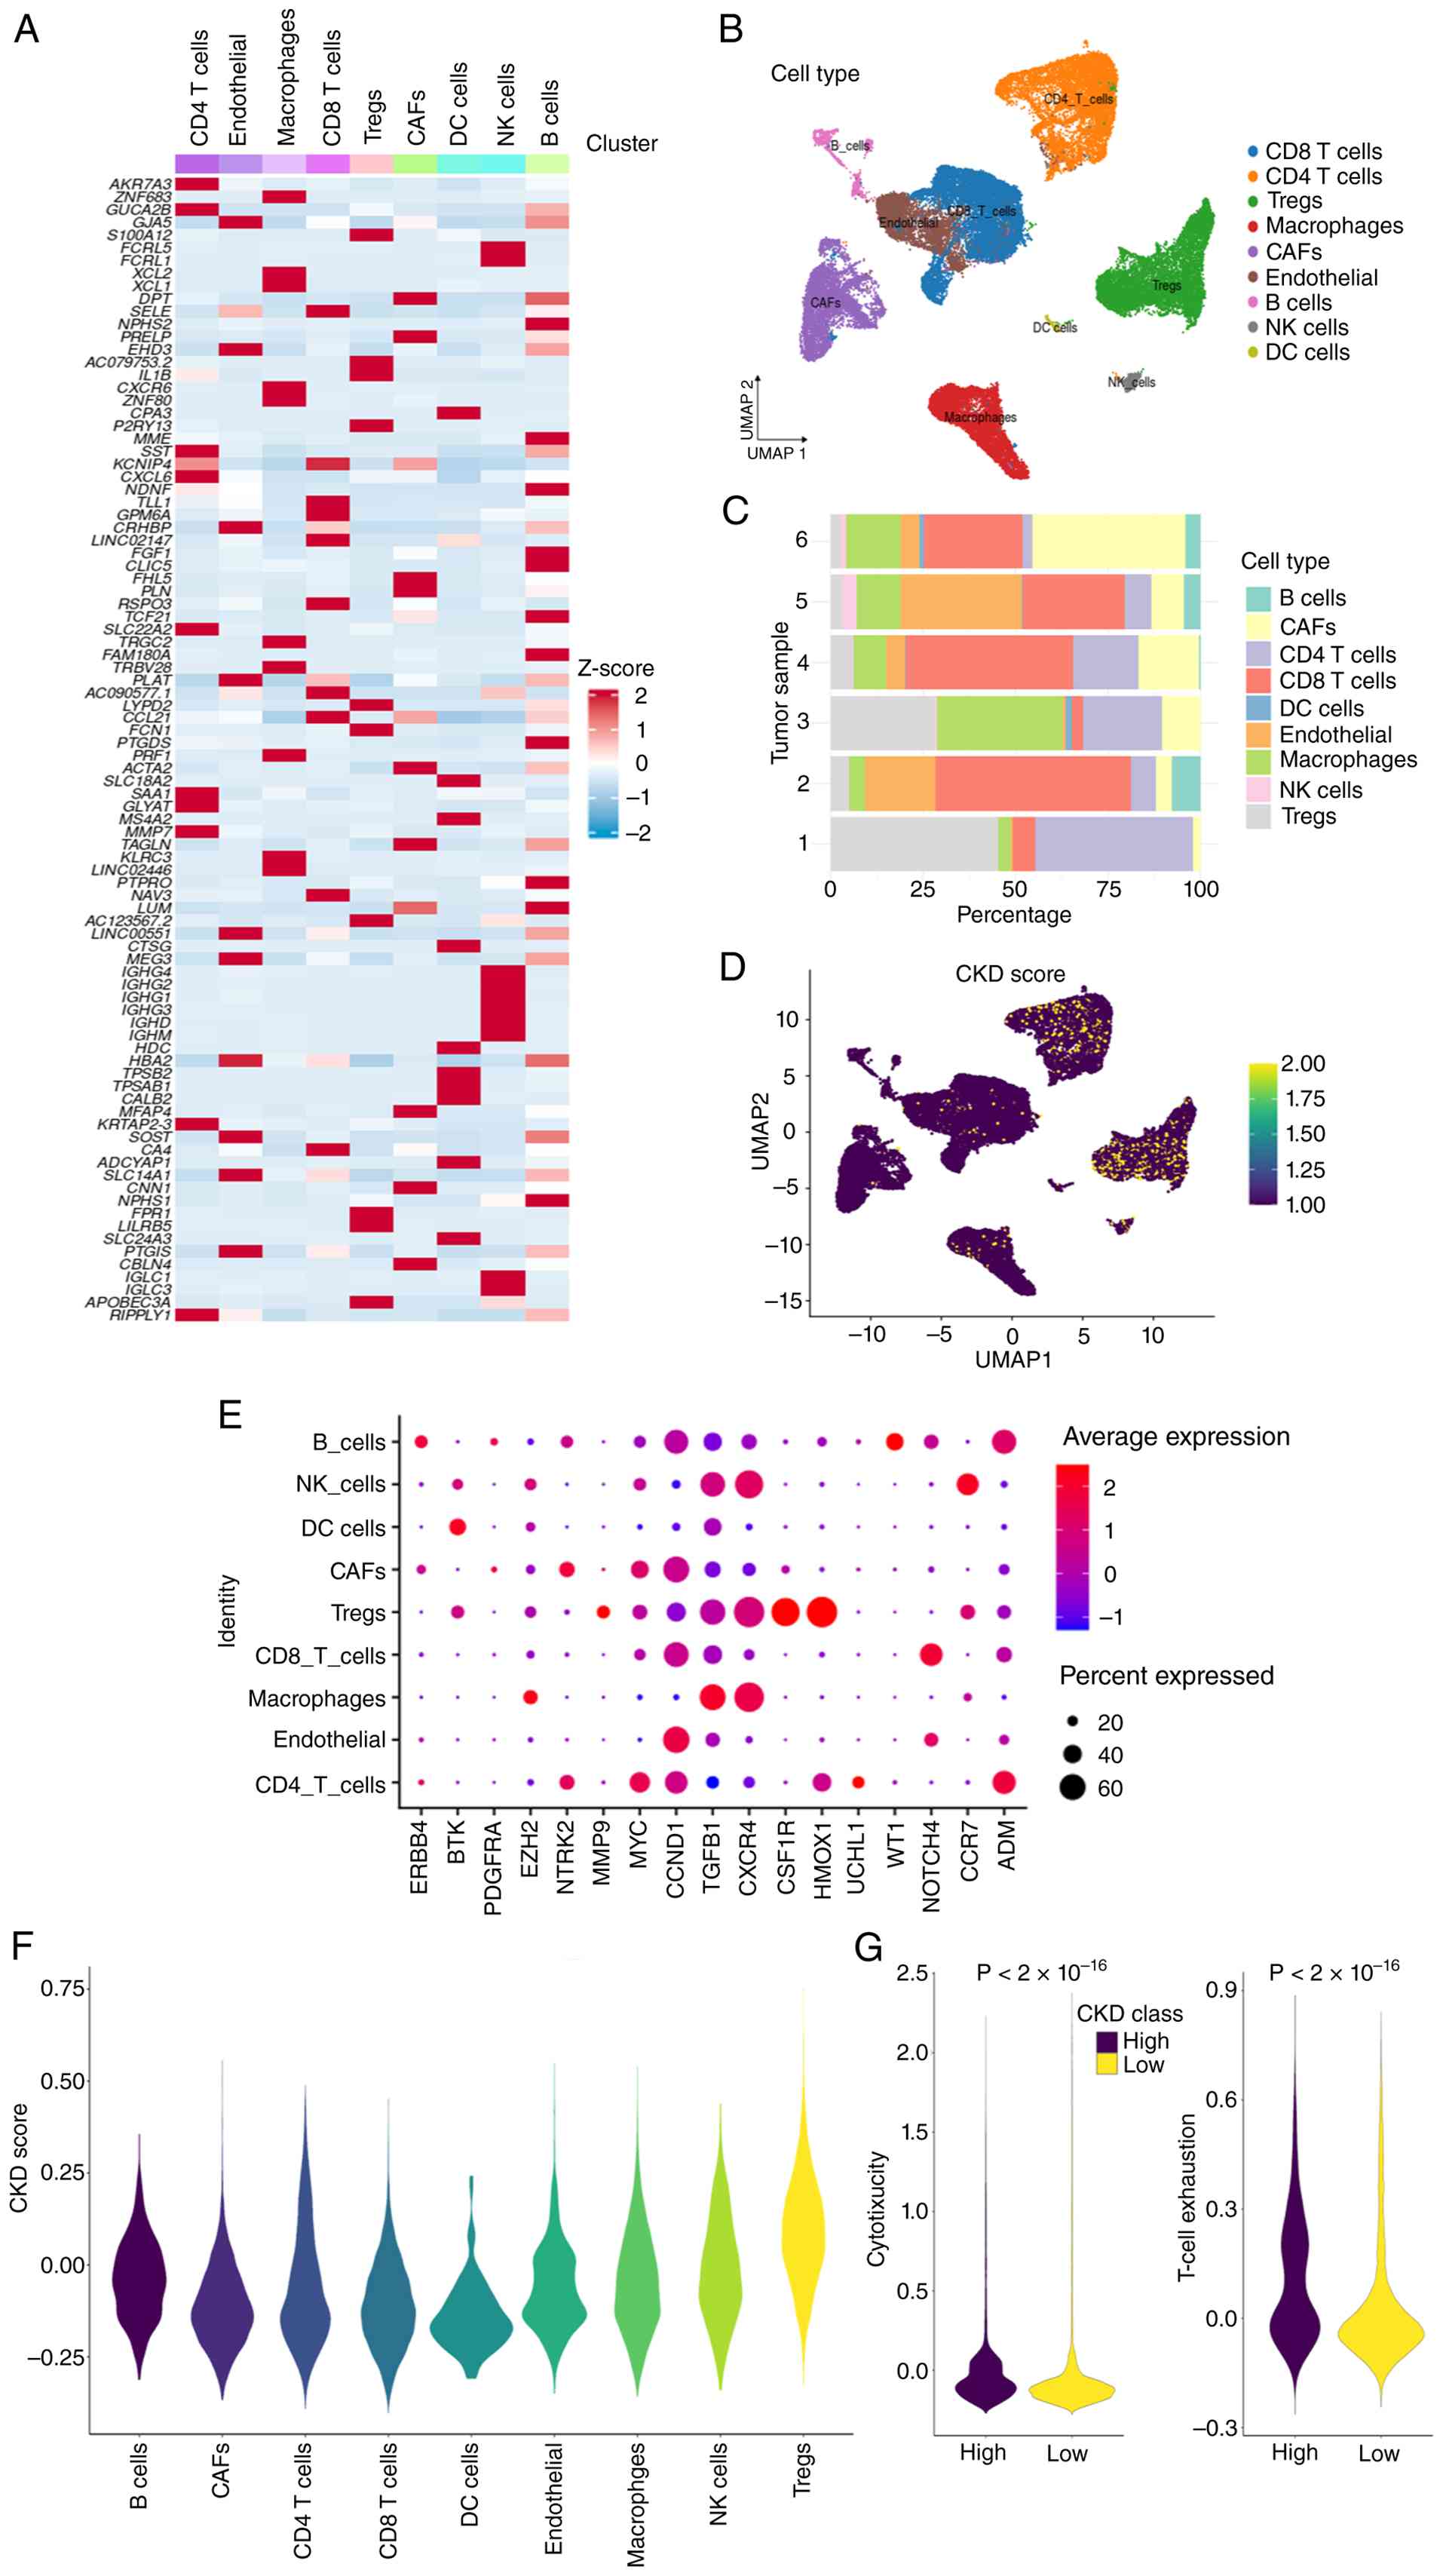
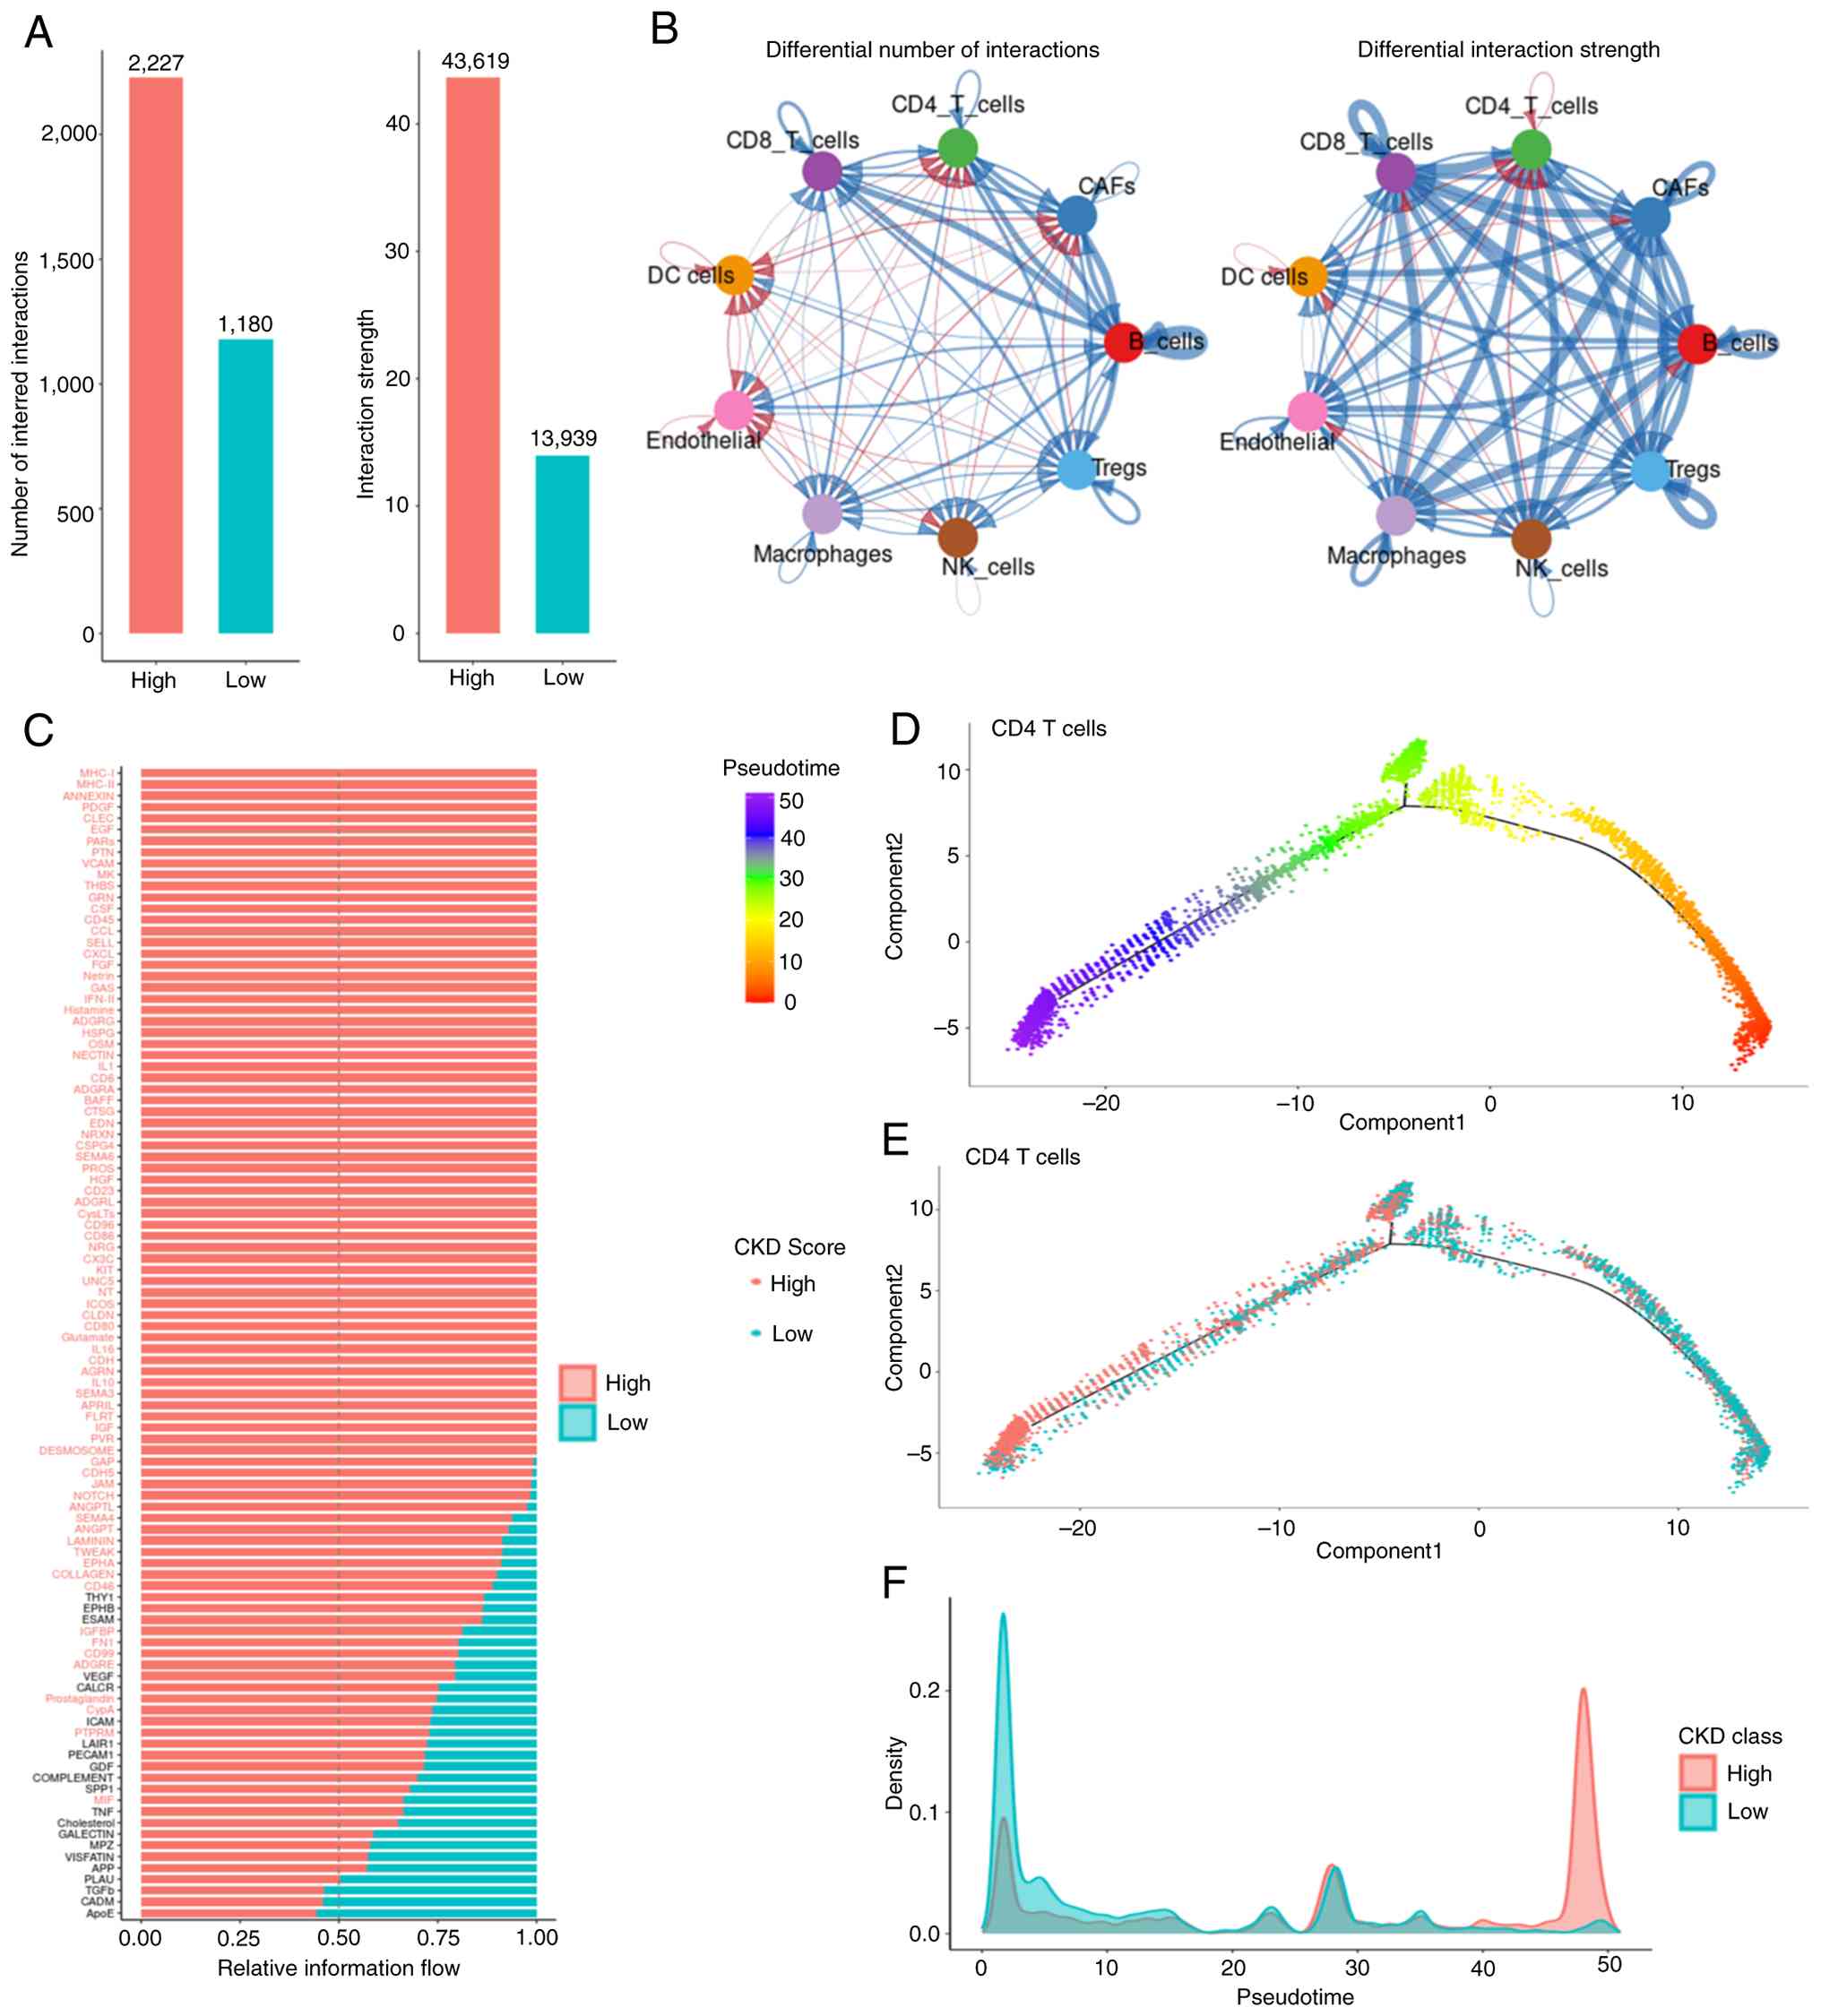
Single-cell RNA sequencing (scRNA-seq)
reveals an association between the CKD signature score and the
immune microenvironment
To investigate the cellular localization and
function of CKDGs at single-cell resolution, the GSE304466 KIRC
scRNA-seq dataset was analyzed. After rigorous quality control and
unsupervised clustering, cells were annotated into nine major types
(Fig. 4A-C): Cluster of
differentiation 4 (CD4)+ T cells (42.6%),
CD8+ T cells (39.2%), natural killer cells (4.9%), B
cells (4%), macrophages (3.5%), cancer-associated fibroblasts
(2.1%), endothelial cells (0.4%), regulatory T cells (Tregs) (0.2%)
and dendritic cells (DCs; 0.1%). Expression profiling of the 17
CKDGs across these cell types showed a distinct pattern, with
higher expression levels and proportions particularly in Tregs,
CD4+ T cells and CD8+ T cells (Fig. 4E). A CKDG signature score was
calculated for each cell using Seurat's AddModuleScore function
(default parameters). The score varied across cell types (Fig. 4D), with Tregs showing the highest
median score (Fig. 4F). When
stratifying T cells by median CKDG score (high vs. low), the
high-score group exhibited significantly higher cytotoxicity scores
(based on granzyme B, perforin-1 and interferon-γ expression) and
higher T-cell exhaustion scores [based on programmed cell death
protein 1 (PDCD1), cytotoxic T-lymphocyte-associated protein 4
(CTLA4), lymphocyte-activation gene 3 (LAG3) and T-cell
immunoreceptor with Ig and ITIM domains (TIGIT)], compared with the
low-score group (P<2x10-16, Wilcoxon rank-sum test;
Fig. 4G). CellChat analysis
revealed a greater number of significant ligand-receptor
interactions in the high CKDG score group (Fig. 5A). Differential communication
analysis identified enhanced signaling between CD4+ T
cells and Tregs, particularly involving the major
histocompatibility complex class I (MHC-I) and platelet-derived
growth factor subunit A (PDGFA) pathways (Fig. 5B). Pathway-level comparison showed
significantly higher communication probability for the MHC-I,
Annexin and PDGFA pathways in the high-score group (P<0.05,
permutation test; Fig. 5C).
Pseudotime trajectory analysis of T cell subsets, performed using
Monocle3 with naive CD4+ T cells as the root,
reconstructed their developmental path (Fig. 5D). Stratifying cells into ‘early’
and ‘late’ states based on the median pseudotime revealed a
significant distribution difference (P<0.05, χ2
test). Cells in the ‘early’ state predominantly had low CKDG
scores, whereas ‘late’-state T cells possessed significantly higher
scores (Fig. 5E and F).
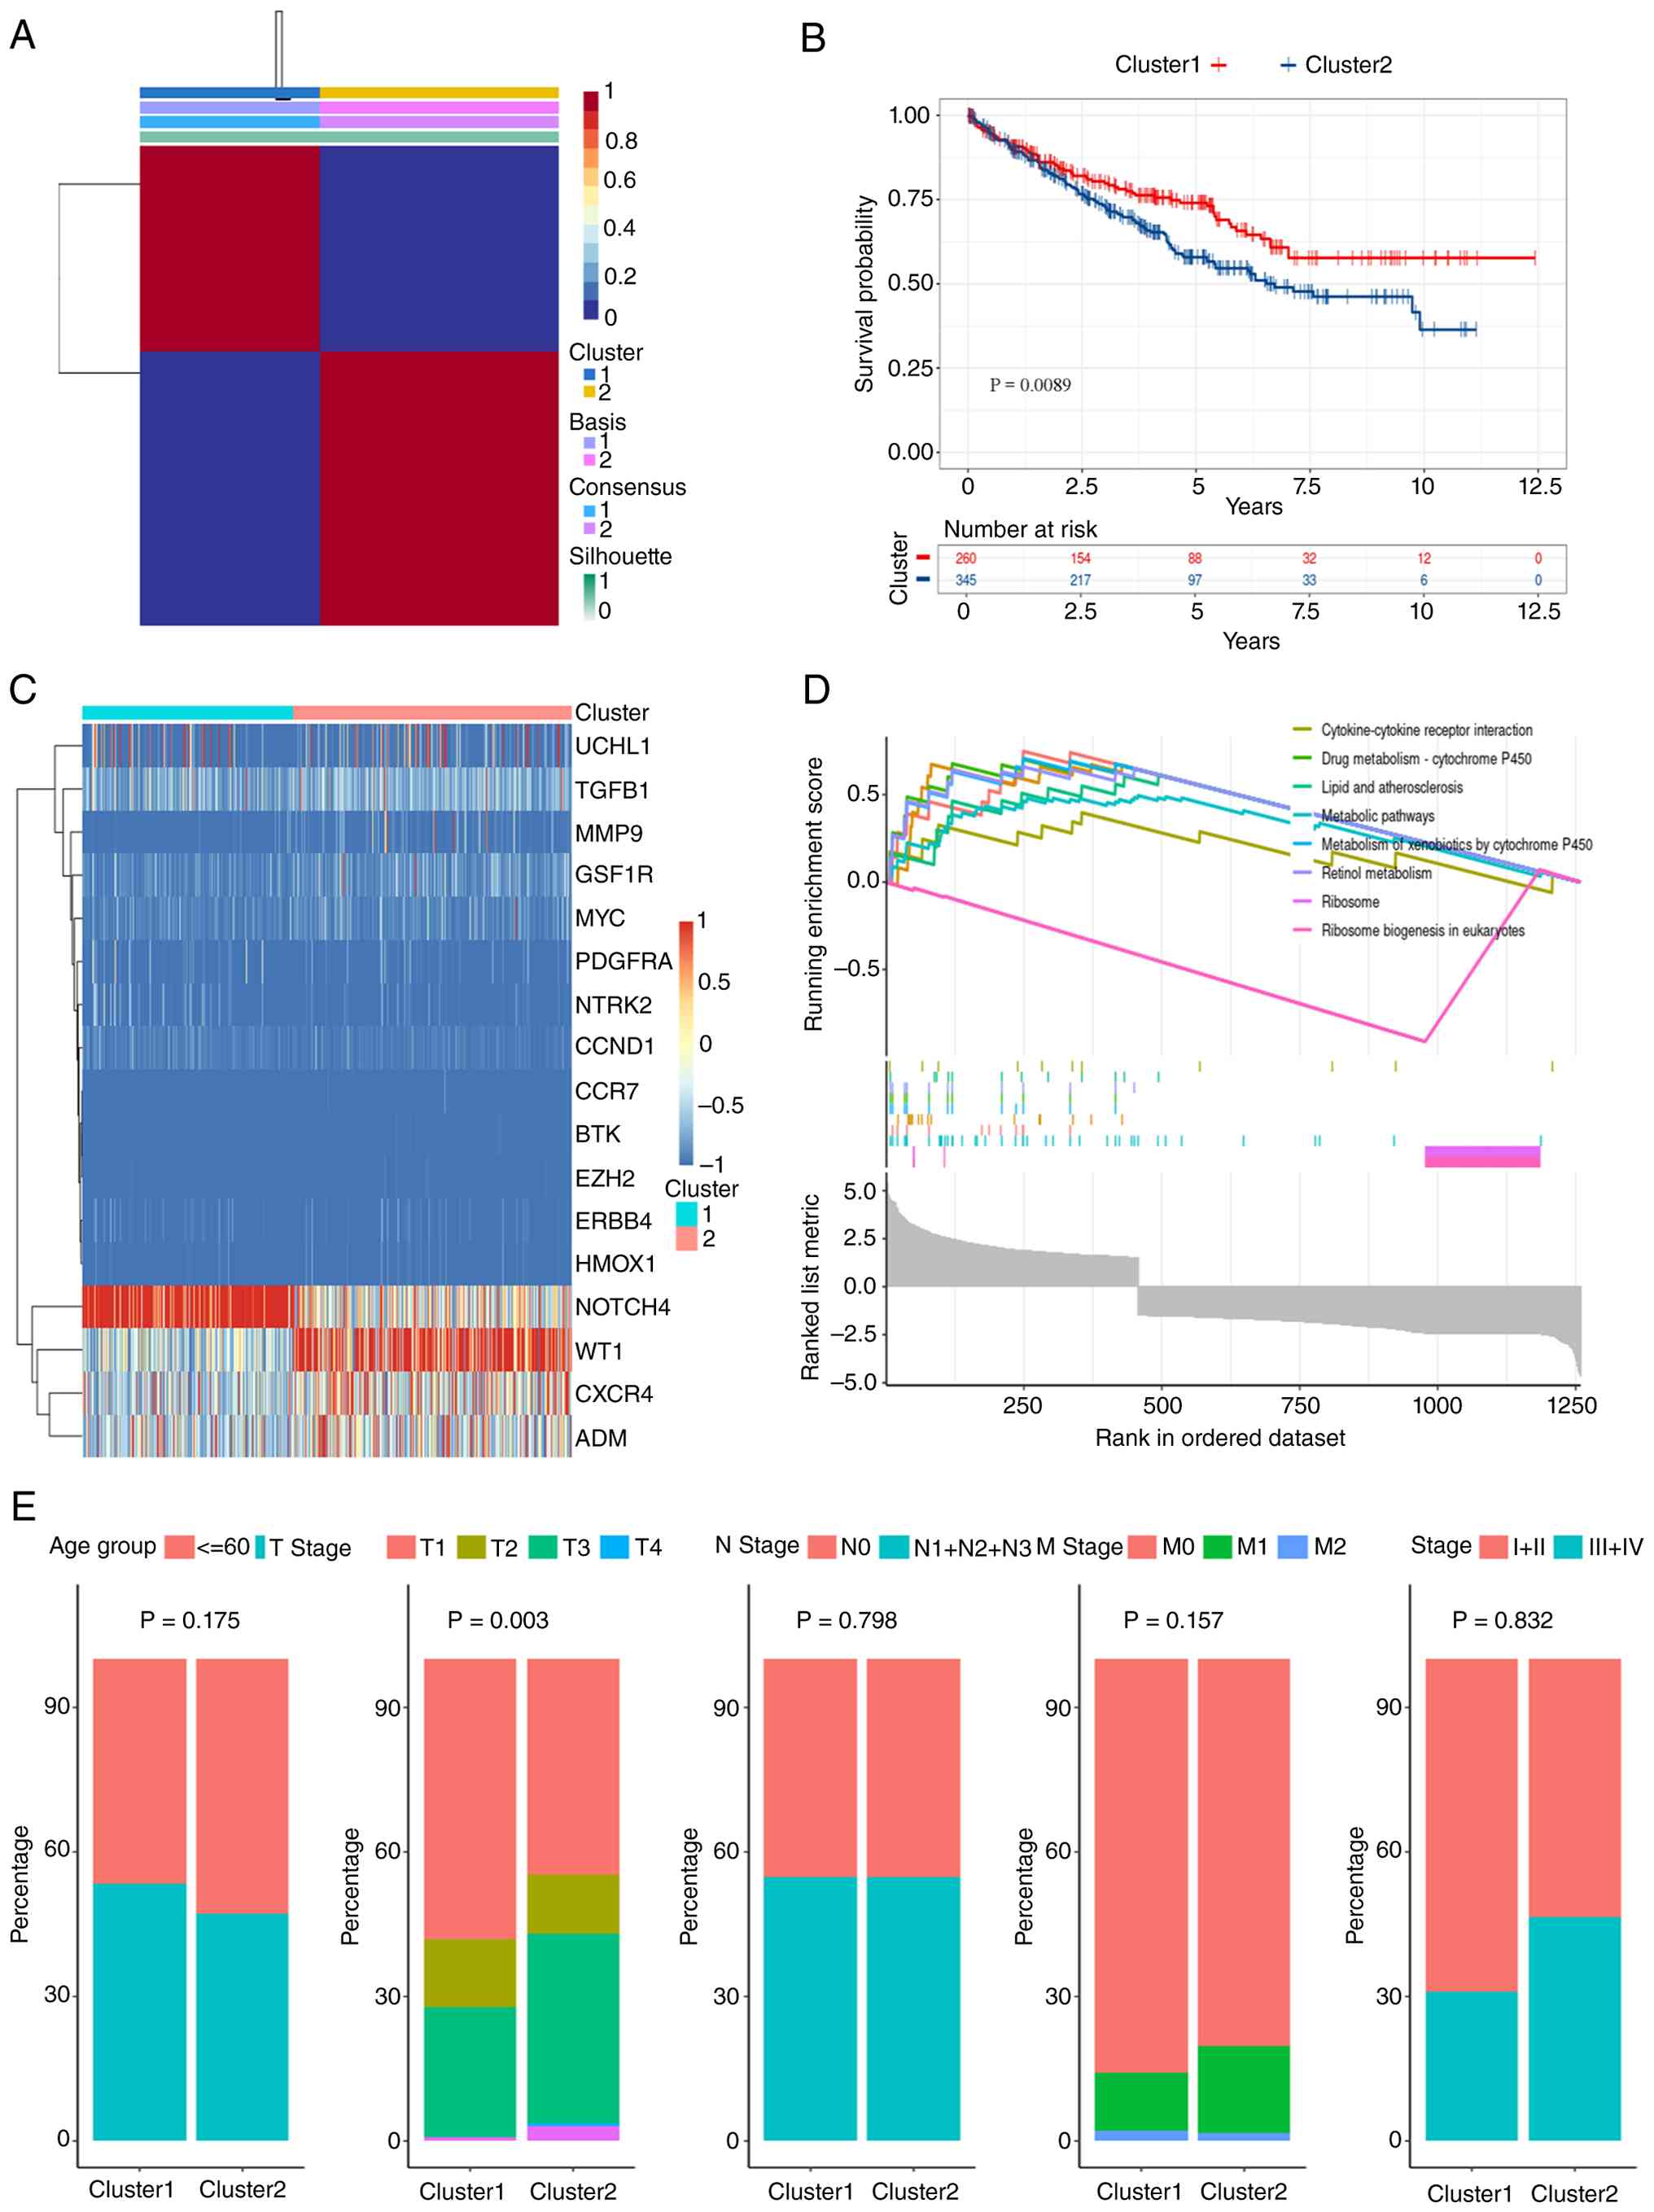
CKDG-based molecular subtyping of bulk
RNA data revealed KIRC subtypes with distinct immune features
Unsupervised molecular subtyping of the TCGA-KIRC
cohort based on the 17 CKDGs using non-negative matrix
factorization identified two stable subtypes at k=2, as supported
by consensus clustering (Fig. 6A).
The cohort was stratified into CKDG-Cluster 1 (n=546) and
CKDG-Cluster 2 (n=698). Kaplan-Meier analysis revealed a
significantly improved OS in Cluster 1 (P=0.0089, log-rank;
Fig. 6B). A heatmap confirmed
higher expression of multiple CKDGs in Cluster 2 (Fig. 6C). GSEA revealed enrichment in
‘Cytokine-cytokine receptor interaction’ and ‘Metabolic pathways’
in Cluster 2 (Fig. 6D).
Clinicopathological comparison indicated a significant difference
in T-stage distribution (P=0.003), but not in age, N-stage or
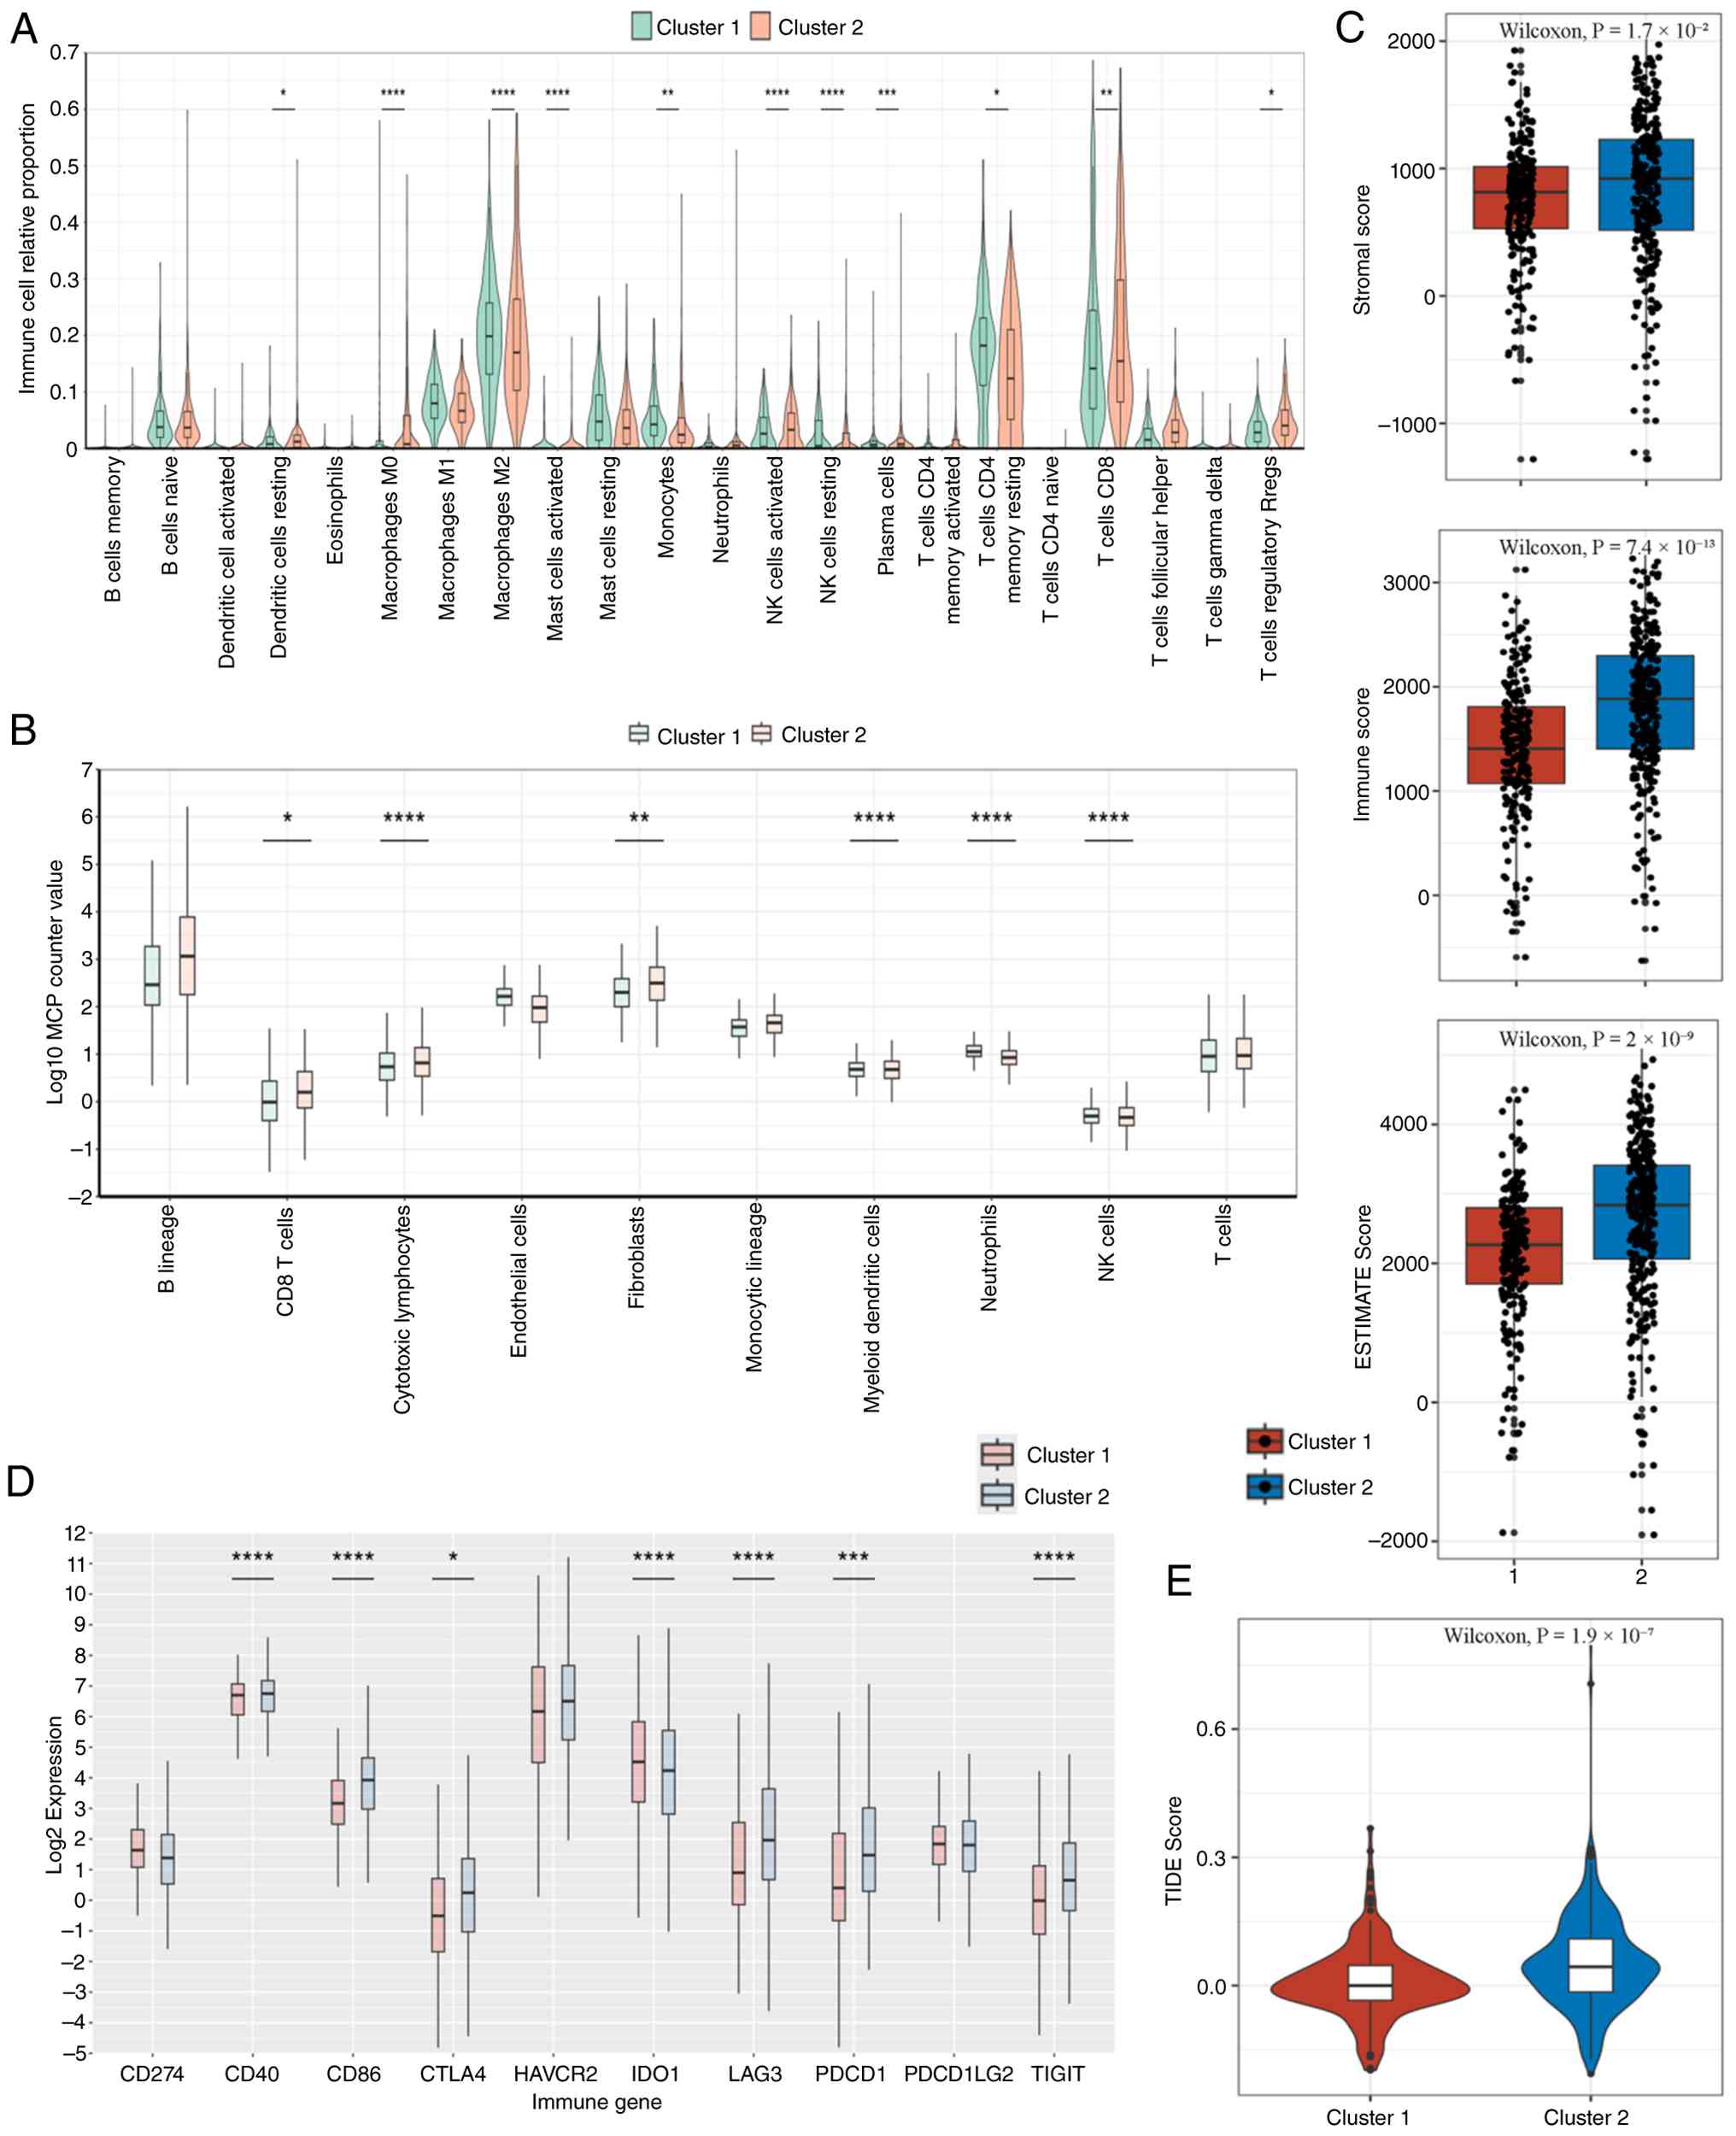
M-stage (Fig. 6E). Immune
deconvolution using CIBERSORTx revealed a higher infiltration of M0
macrophages in Cluster 1, whereas Cluster 2 had elevated
CD8+ T cells, M2 macrophages and activated DCs (Fig. 7A). Monocyte chemoattractant
protein-counter confirmed higher levels of T cells and cytotoxic
lymphocytes in Cluster 2 (P<0.05; Fig. 7B). Consistently, ESTIMATE-derived
stromal, immune and composite scores were all significantly higher
in Cluster 2 (P<0.05; Fig. 7C).
The expression of immune checkpoint genes, including CD40, CD48,
CTLA4, LAG3, PDCD1 (PD-1) and TIGIT, was significantly upregulated
in Cluster 2 (Fig. 7D). Of note,
the TIDE score was also significantly higher in this cluster
(P<0.001; Fig. 7E).
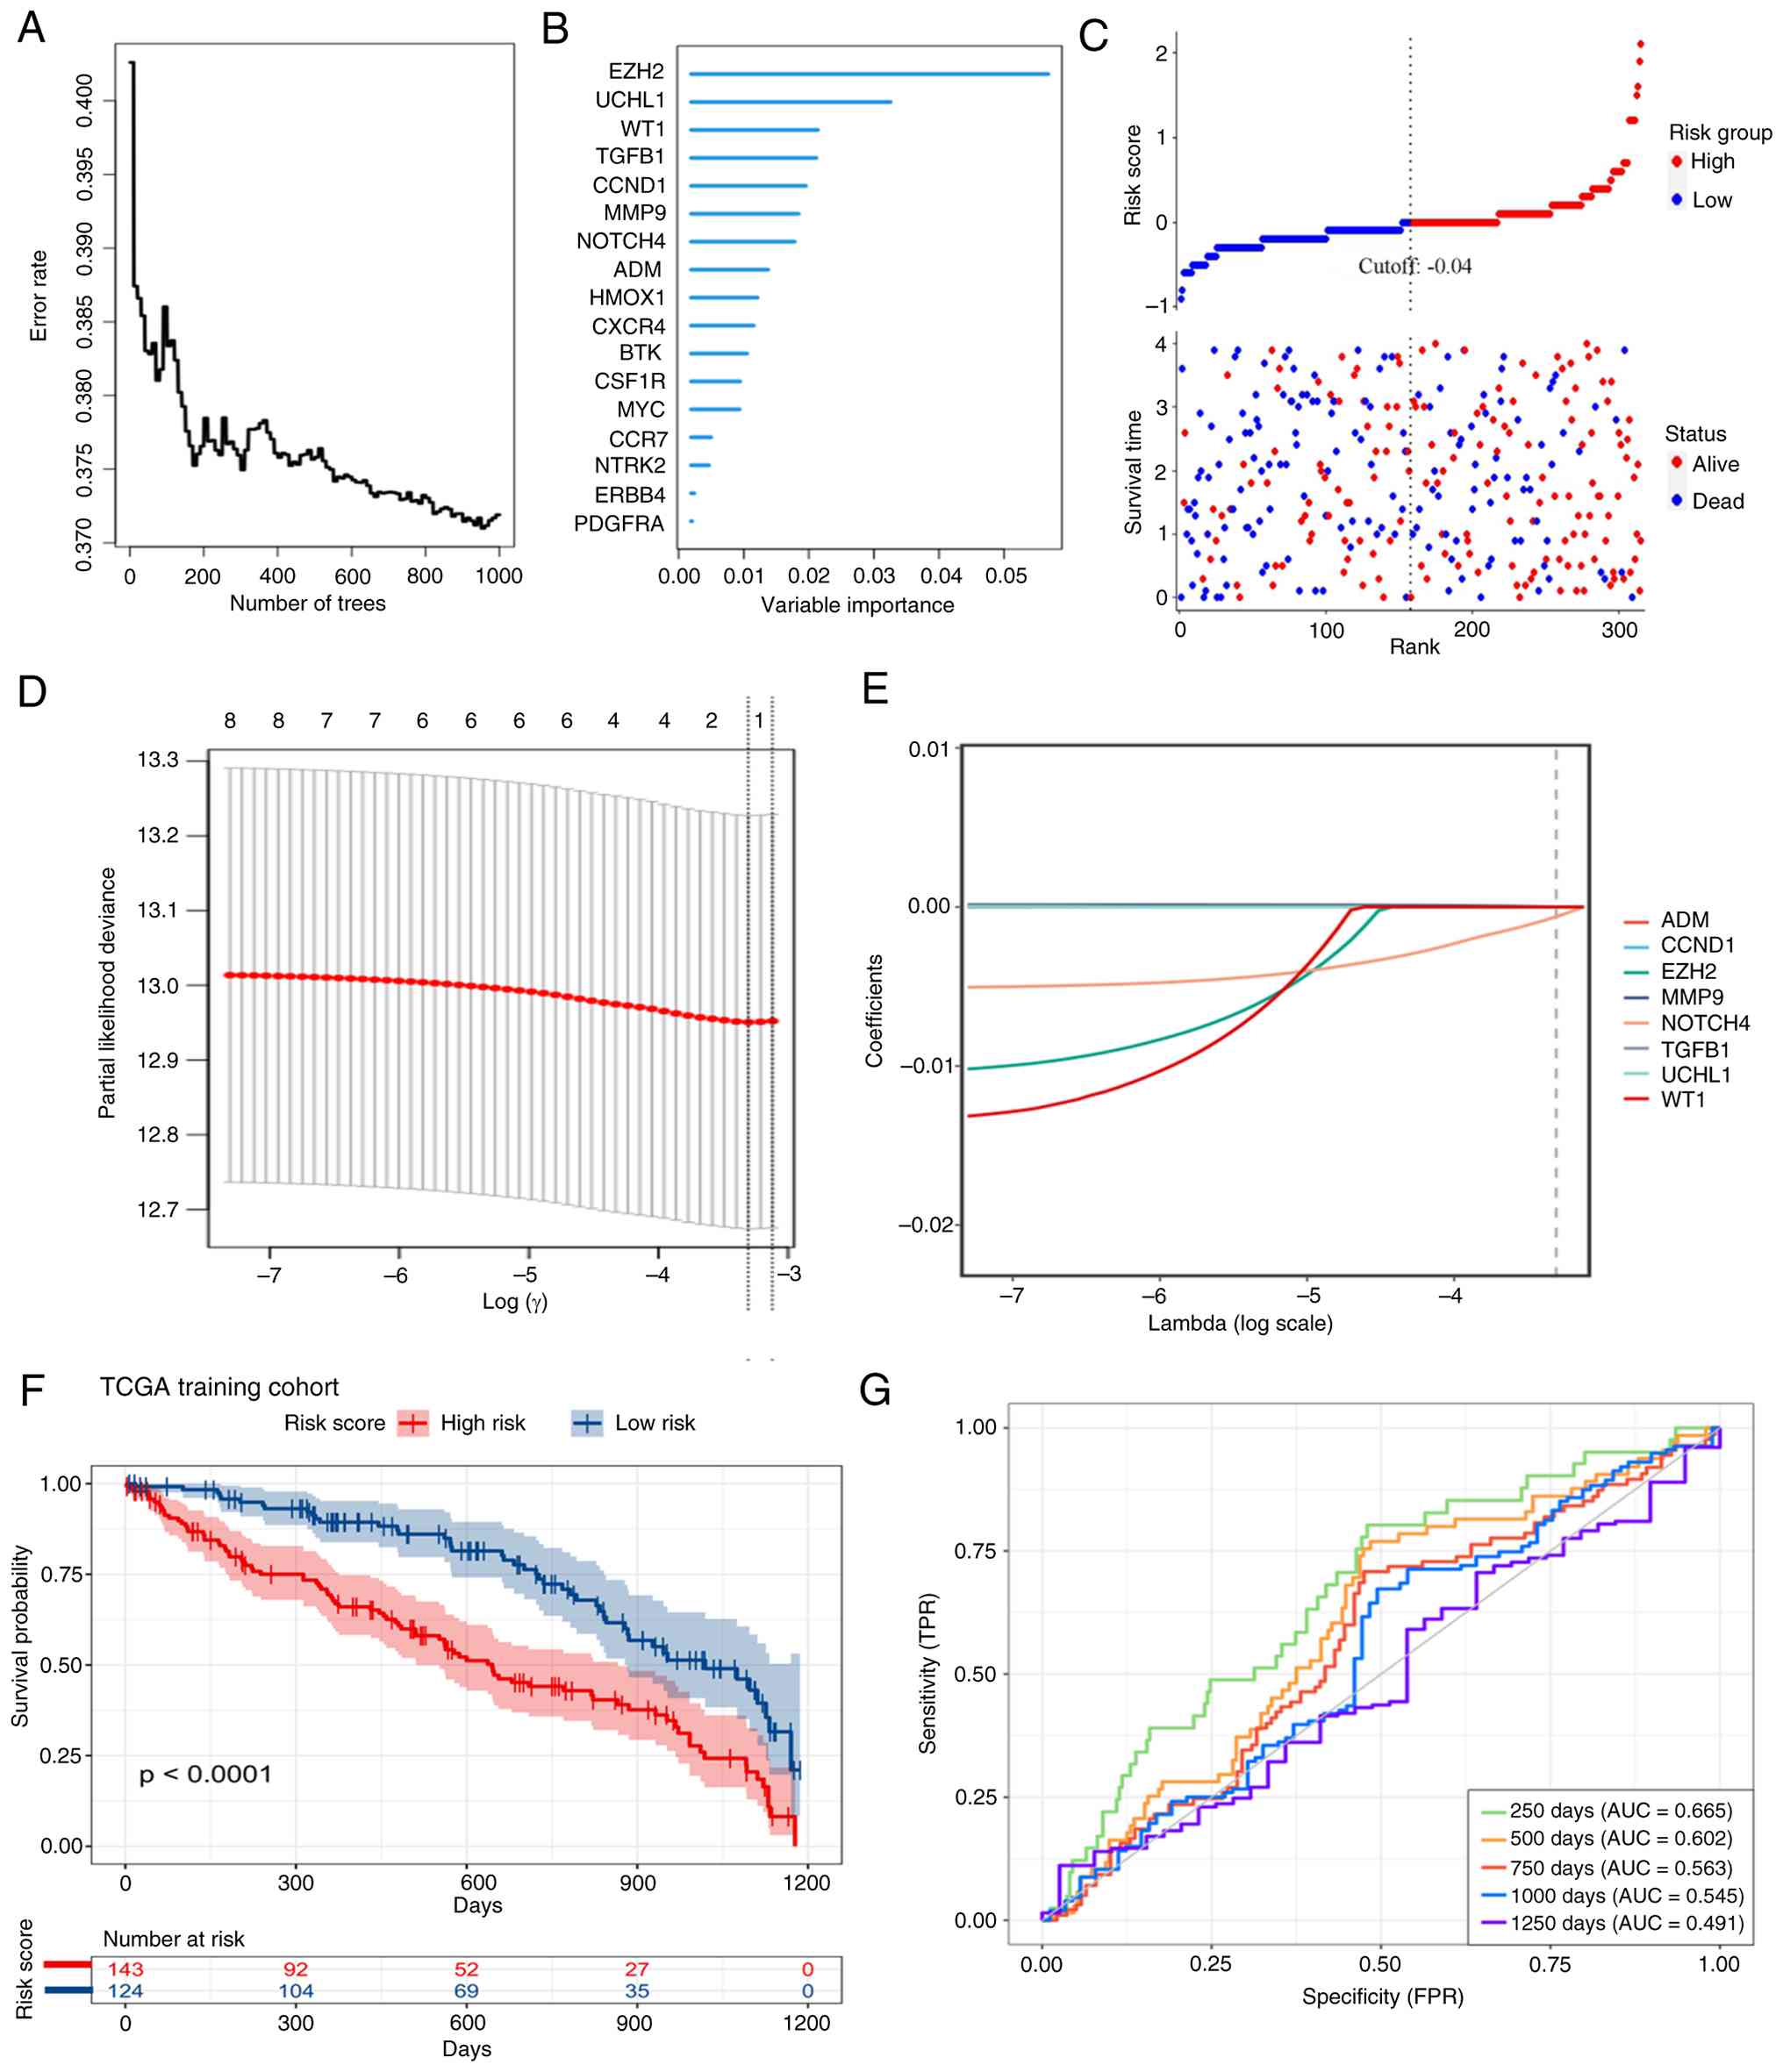
Construction and validation of a
CKD-associated prognostic signature
To develop a clinically applicable risk
stratification tool, a prognostic signature was constructed based
on the 17 CKDGs. These candidates were further prioritized using
the Random Survival Forest algorithm, retaining those with positive
minimal depth-based variable importance (Fig. 8A and B). Subsequent LASSO-Cox regression
identified an optimal 8-gene model at the penalty parameter (λ)
corresponding to the minimum cross-validated partial likelihood
deviance (Fig. 8D. A multivariate
Cox proportional hazards model was then fitted using these 8 genes
to compute a risk score for each patient in the TCGA-KIRC cohort
(Fig. 8E).
Patients were dichotomized into high- and low-risk
groups using the median risk score. The risk score distribution,
aligned with survival status and follow-up time, showed a higher
proportion of death events in the high-risk group (Fig. 8C). Kaplan-Meier analysis confirmed
a significantly poorer OS in the high-risk group (log-rank
P<0.0001; Fig. 8F).
Time-dependent ROC analysis yielded area under the curve values of
0.665, 0.602 and 0.563 for 250-, 500- and 750-day survival
prediction, respectively (Fig.
8G), indicating a modest short-term but limited long-term
discriminative ability.
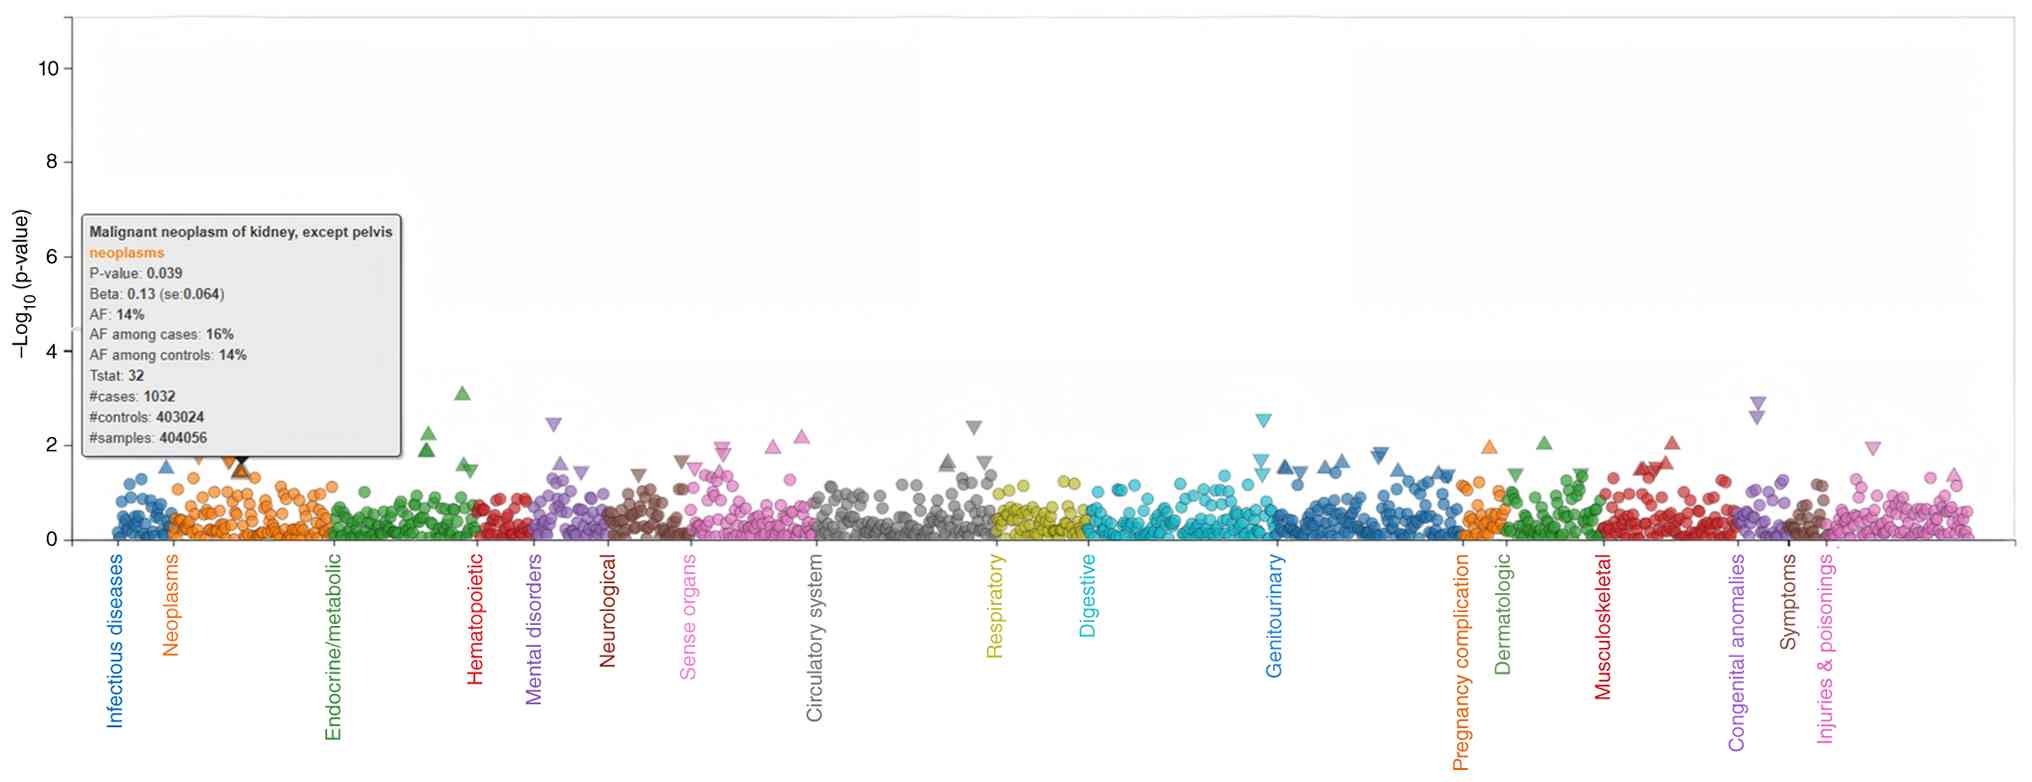
Confirmation of WT1 as a key biomarker
and computational screening for targeted therapeutics
To assess the broader clinical relevance of the
8-gene prognostic signature, a PheWAS was performed using publicly
available GWAS summary statistics. Among the 8 CKDGs, only WT1
exhibited a nominal association with renal carcinoma (P=0.039;
Fig. 9). No significant
associations were observed for the other 7 genes. Given the prior
biological plausibility of WT1 in kidney pathophysiology, in
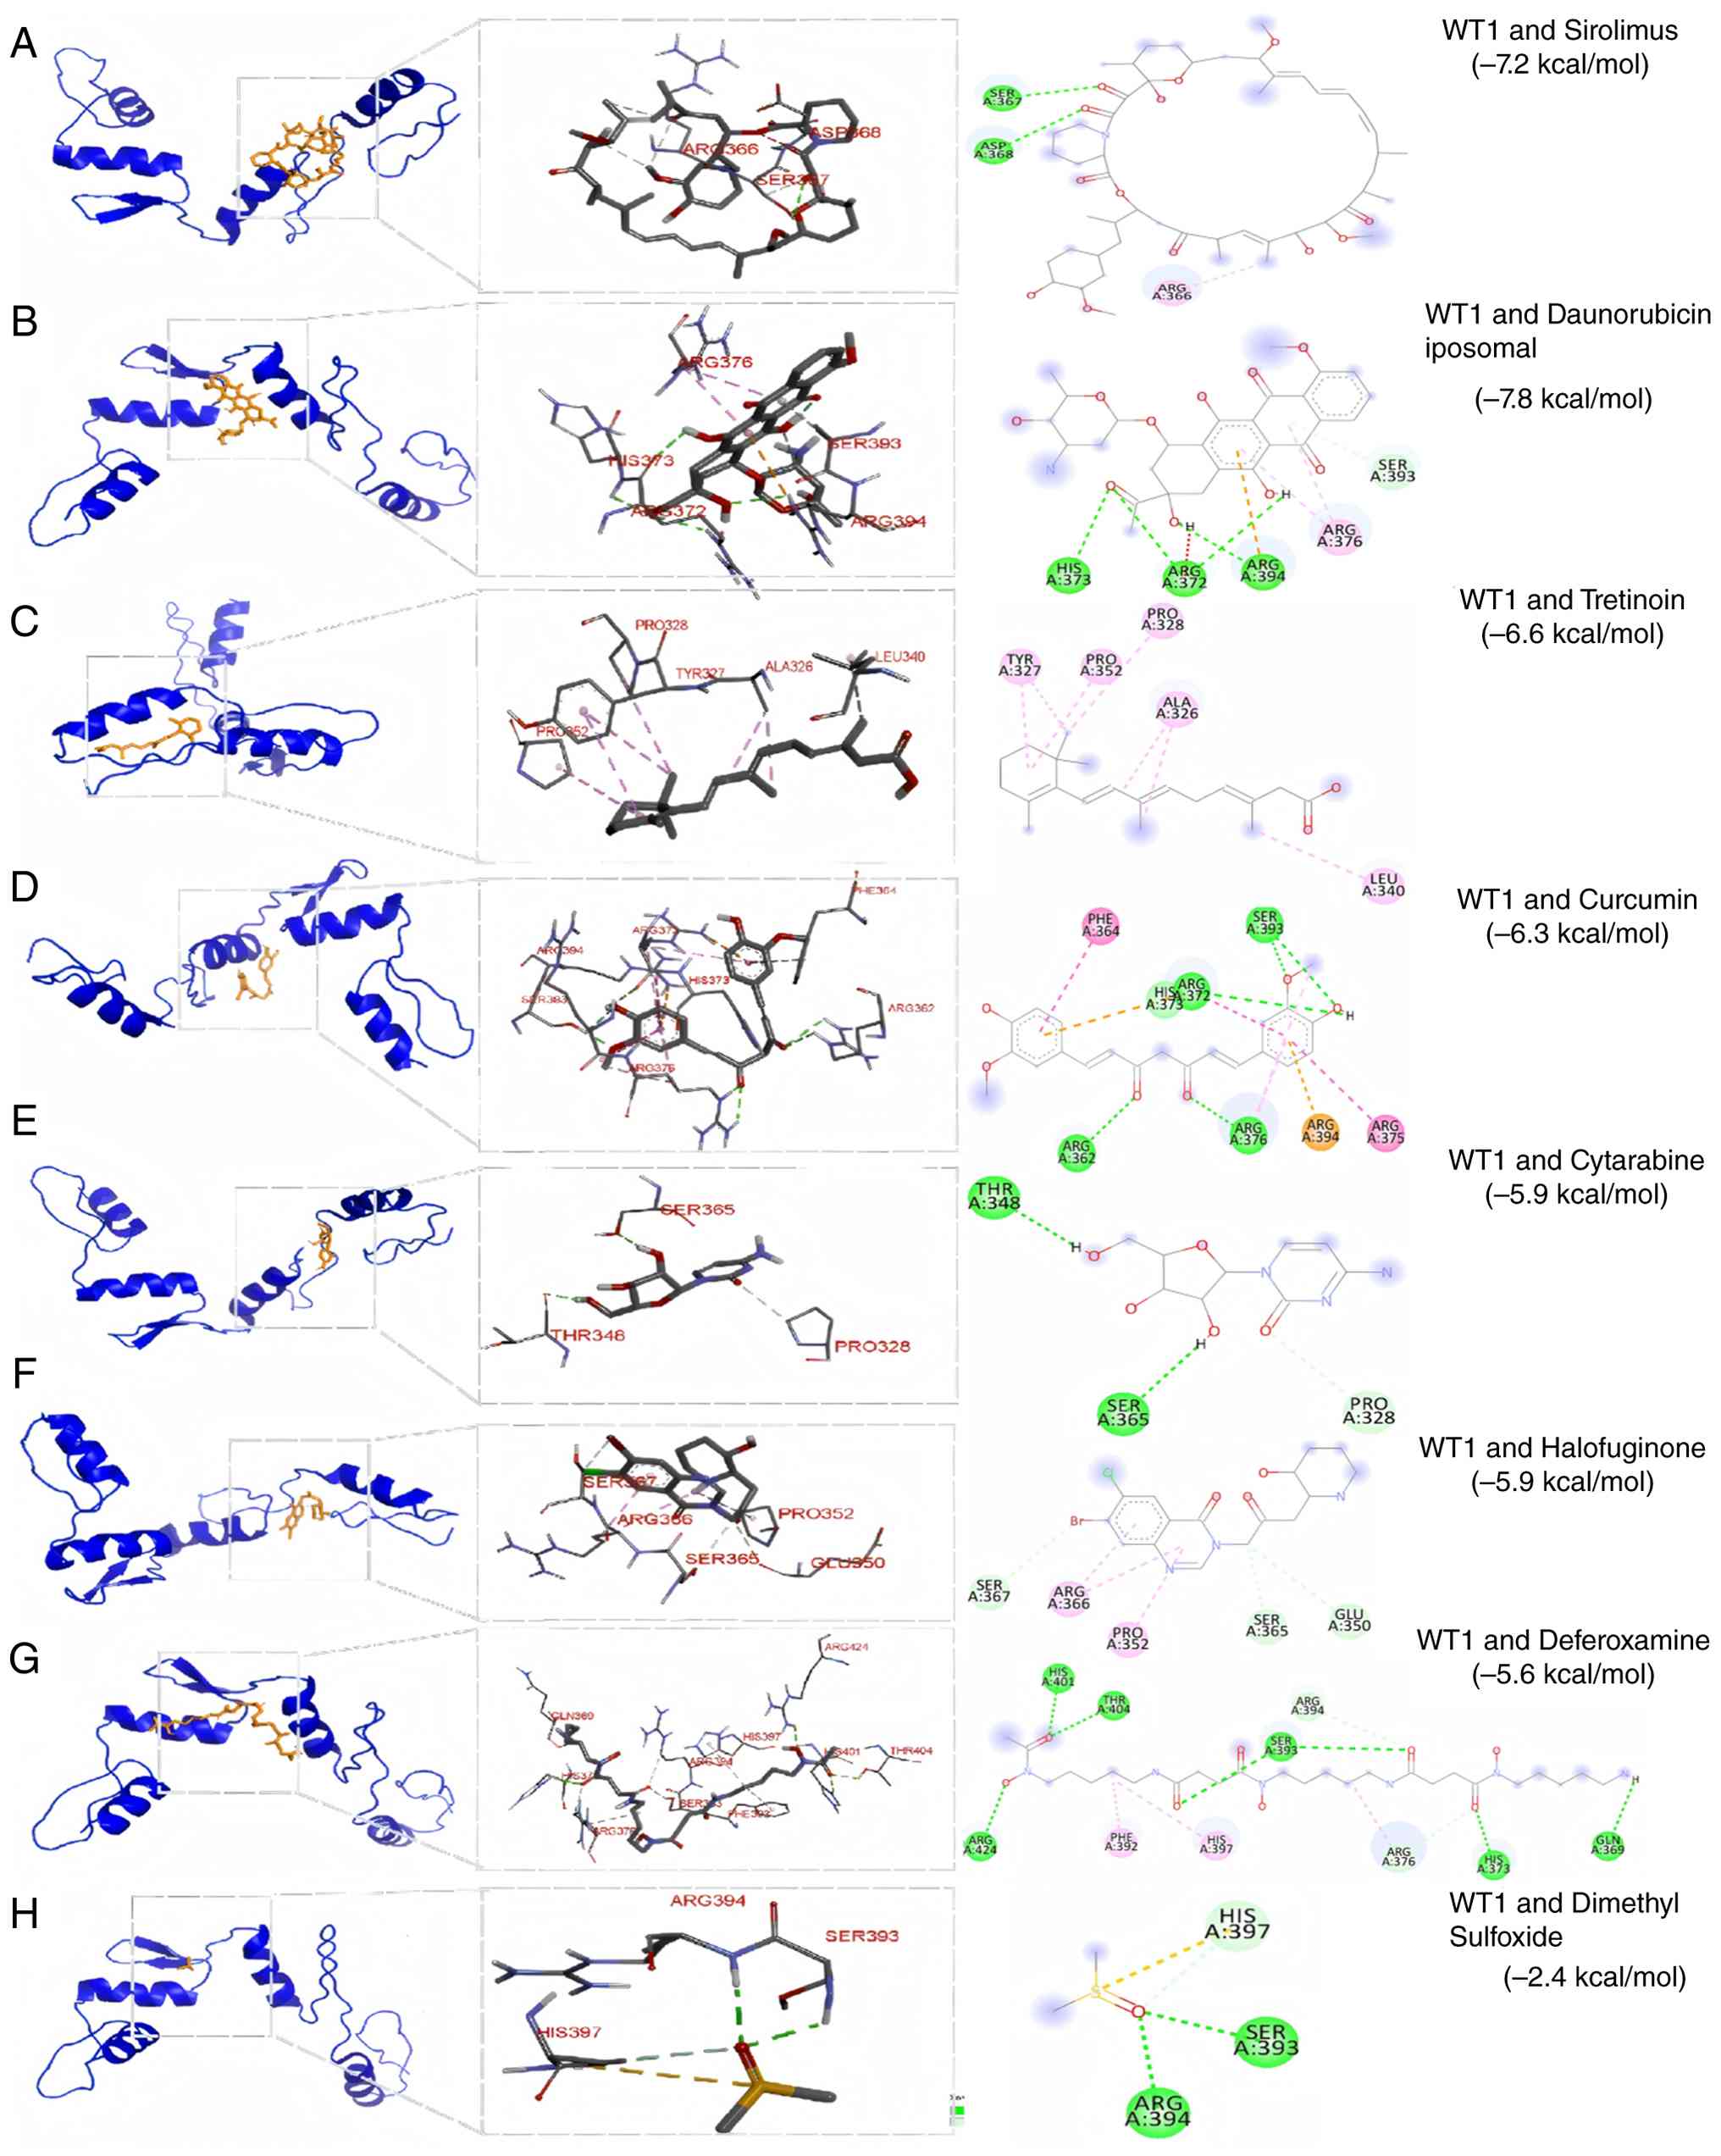
silico drug repurposing screening was conducted. Molecular
docking of WT1 against a panel of Food and Drug Administration
(FDA)-approved compounds identified sirolimus (-7.2 kcal/mol),
liposomal daunorubicin (-7.5 kcal/mol) and tretinoin (-6.6
kcal/mol) as top candidates based on predicted binding affinity
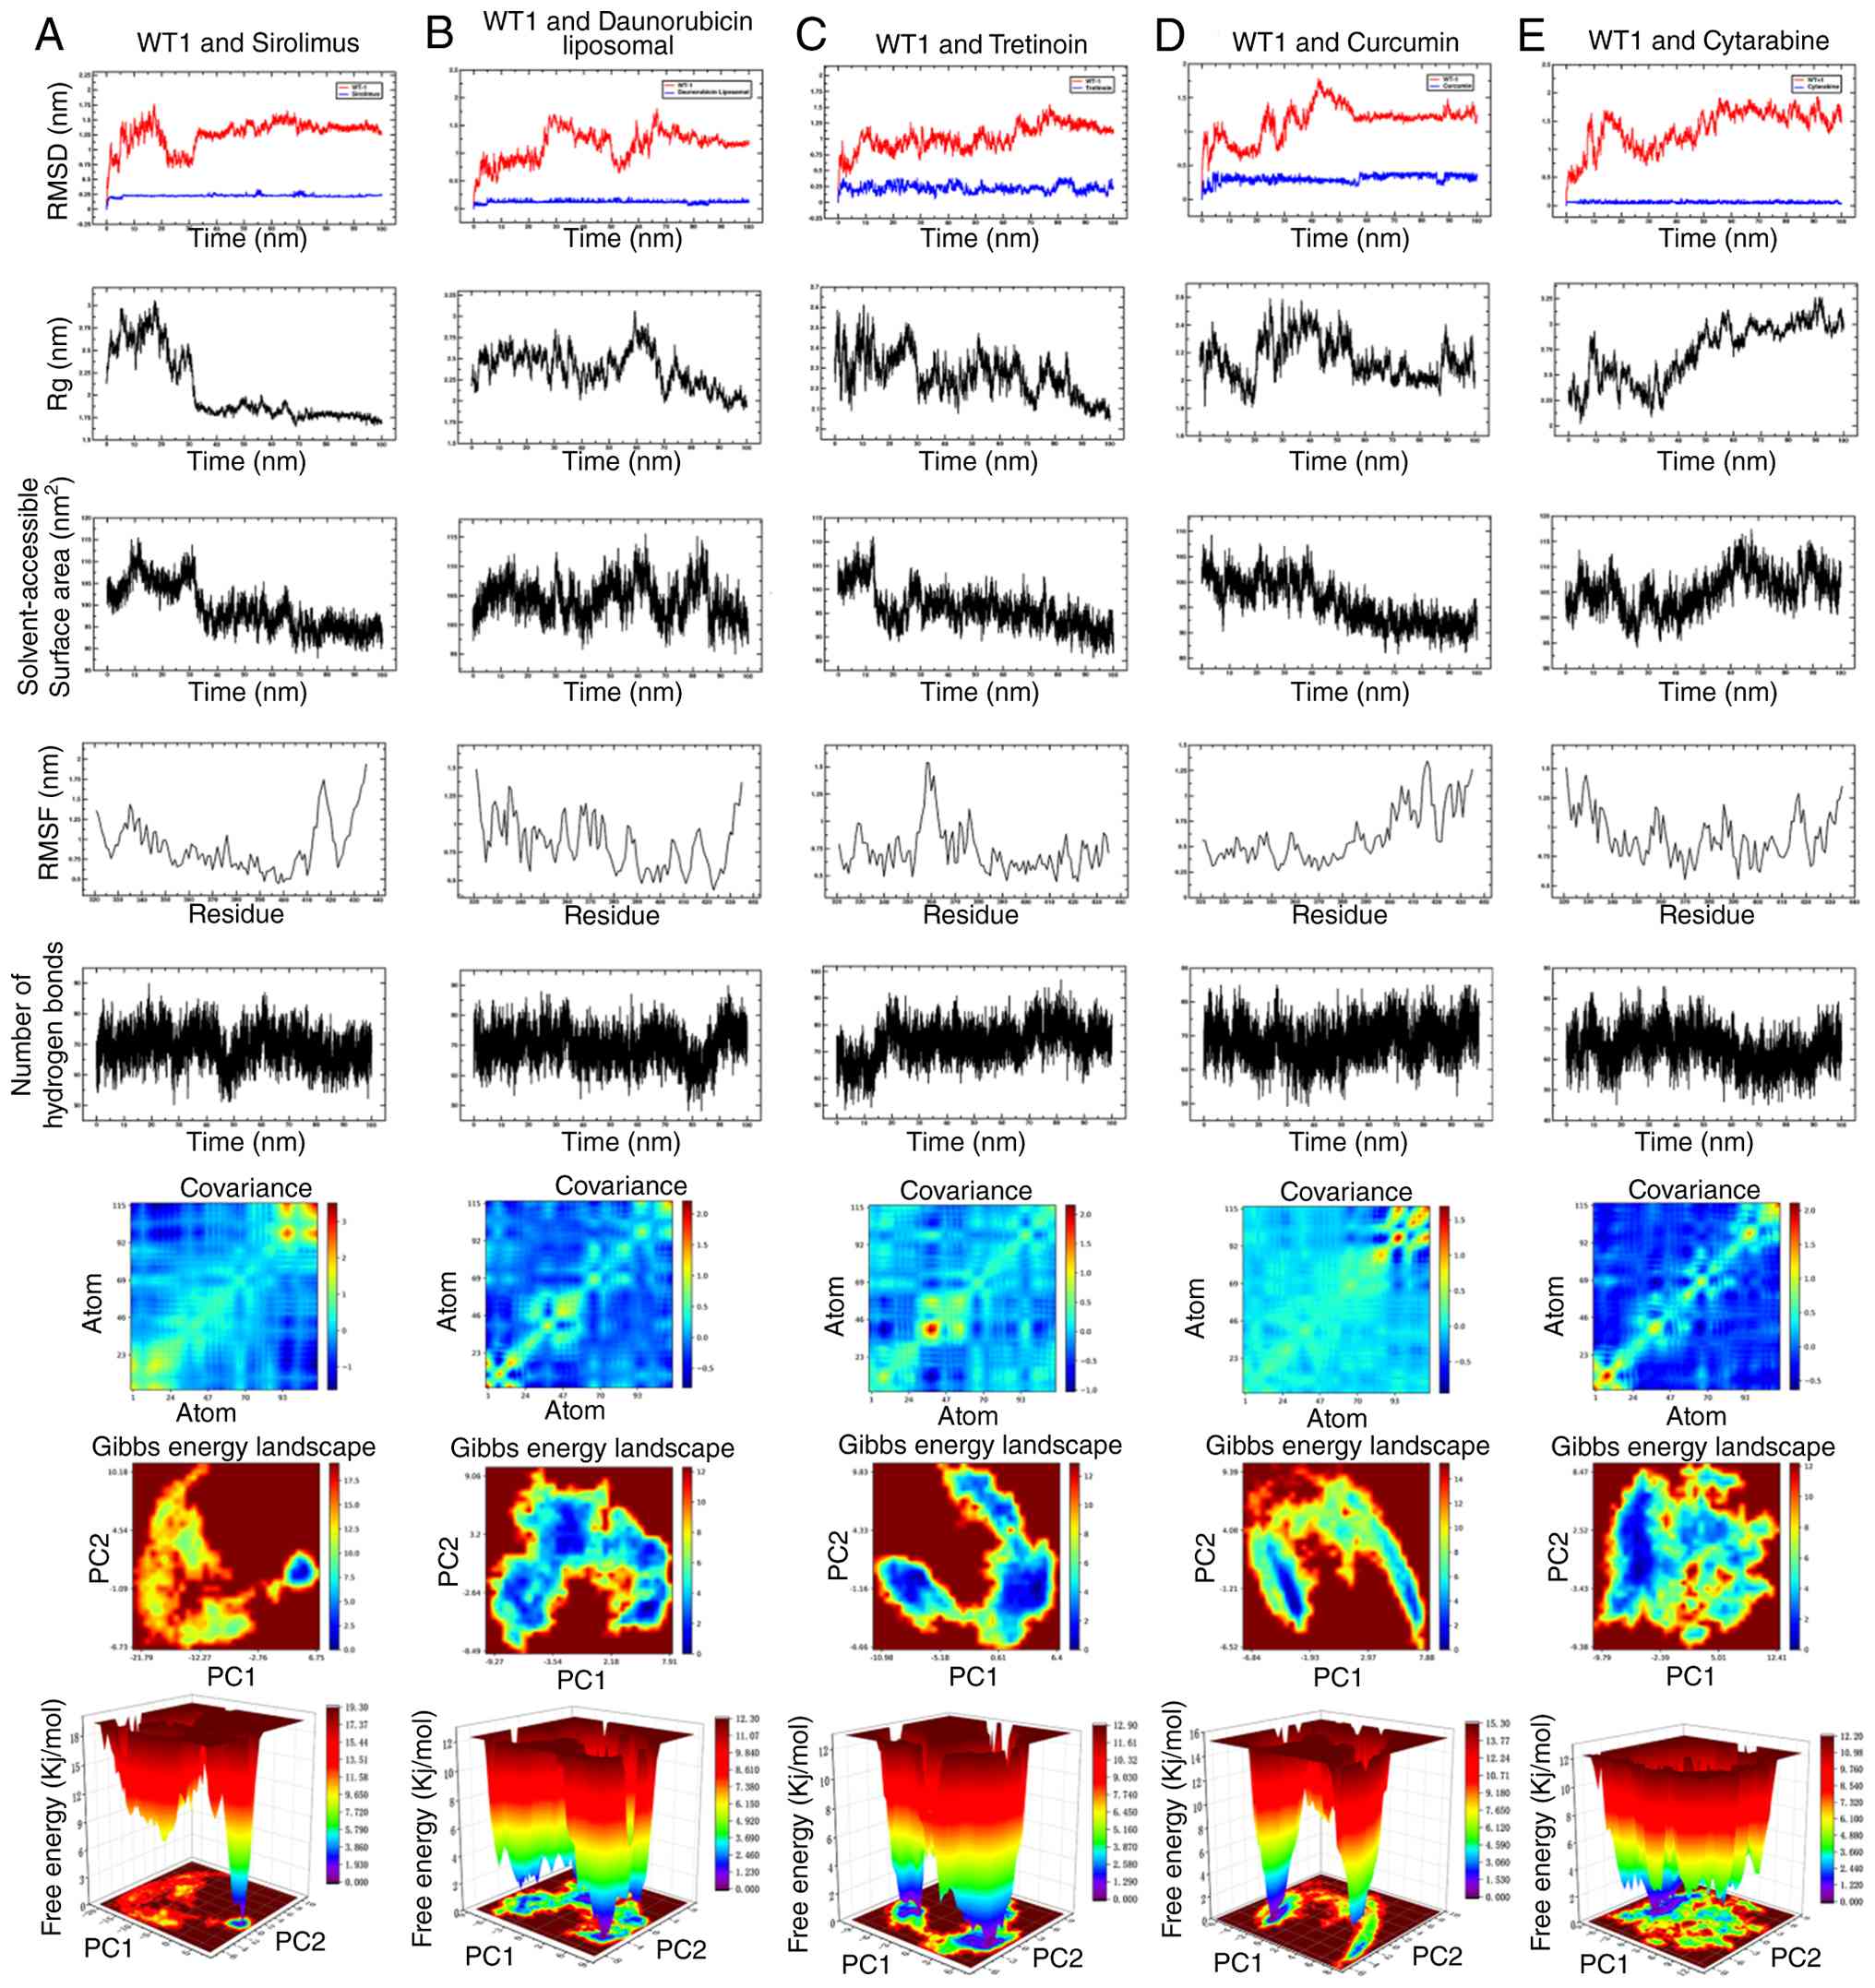
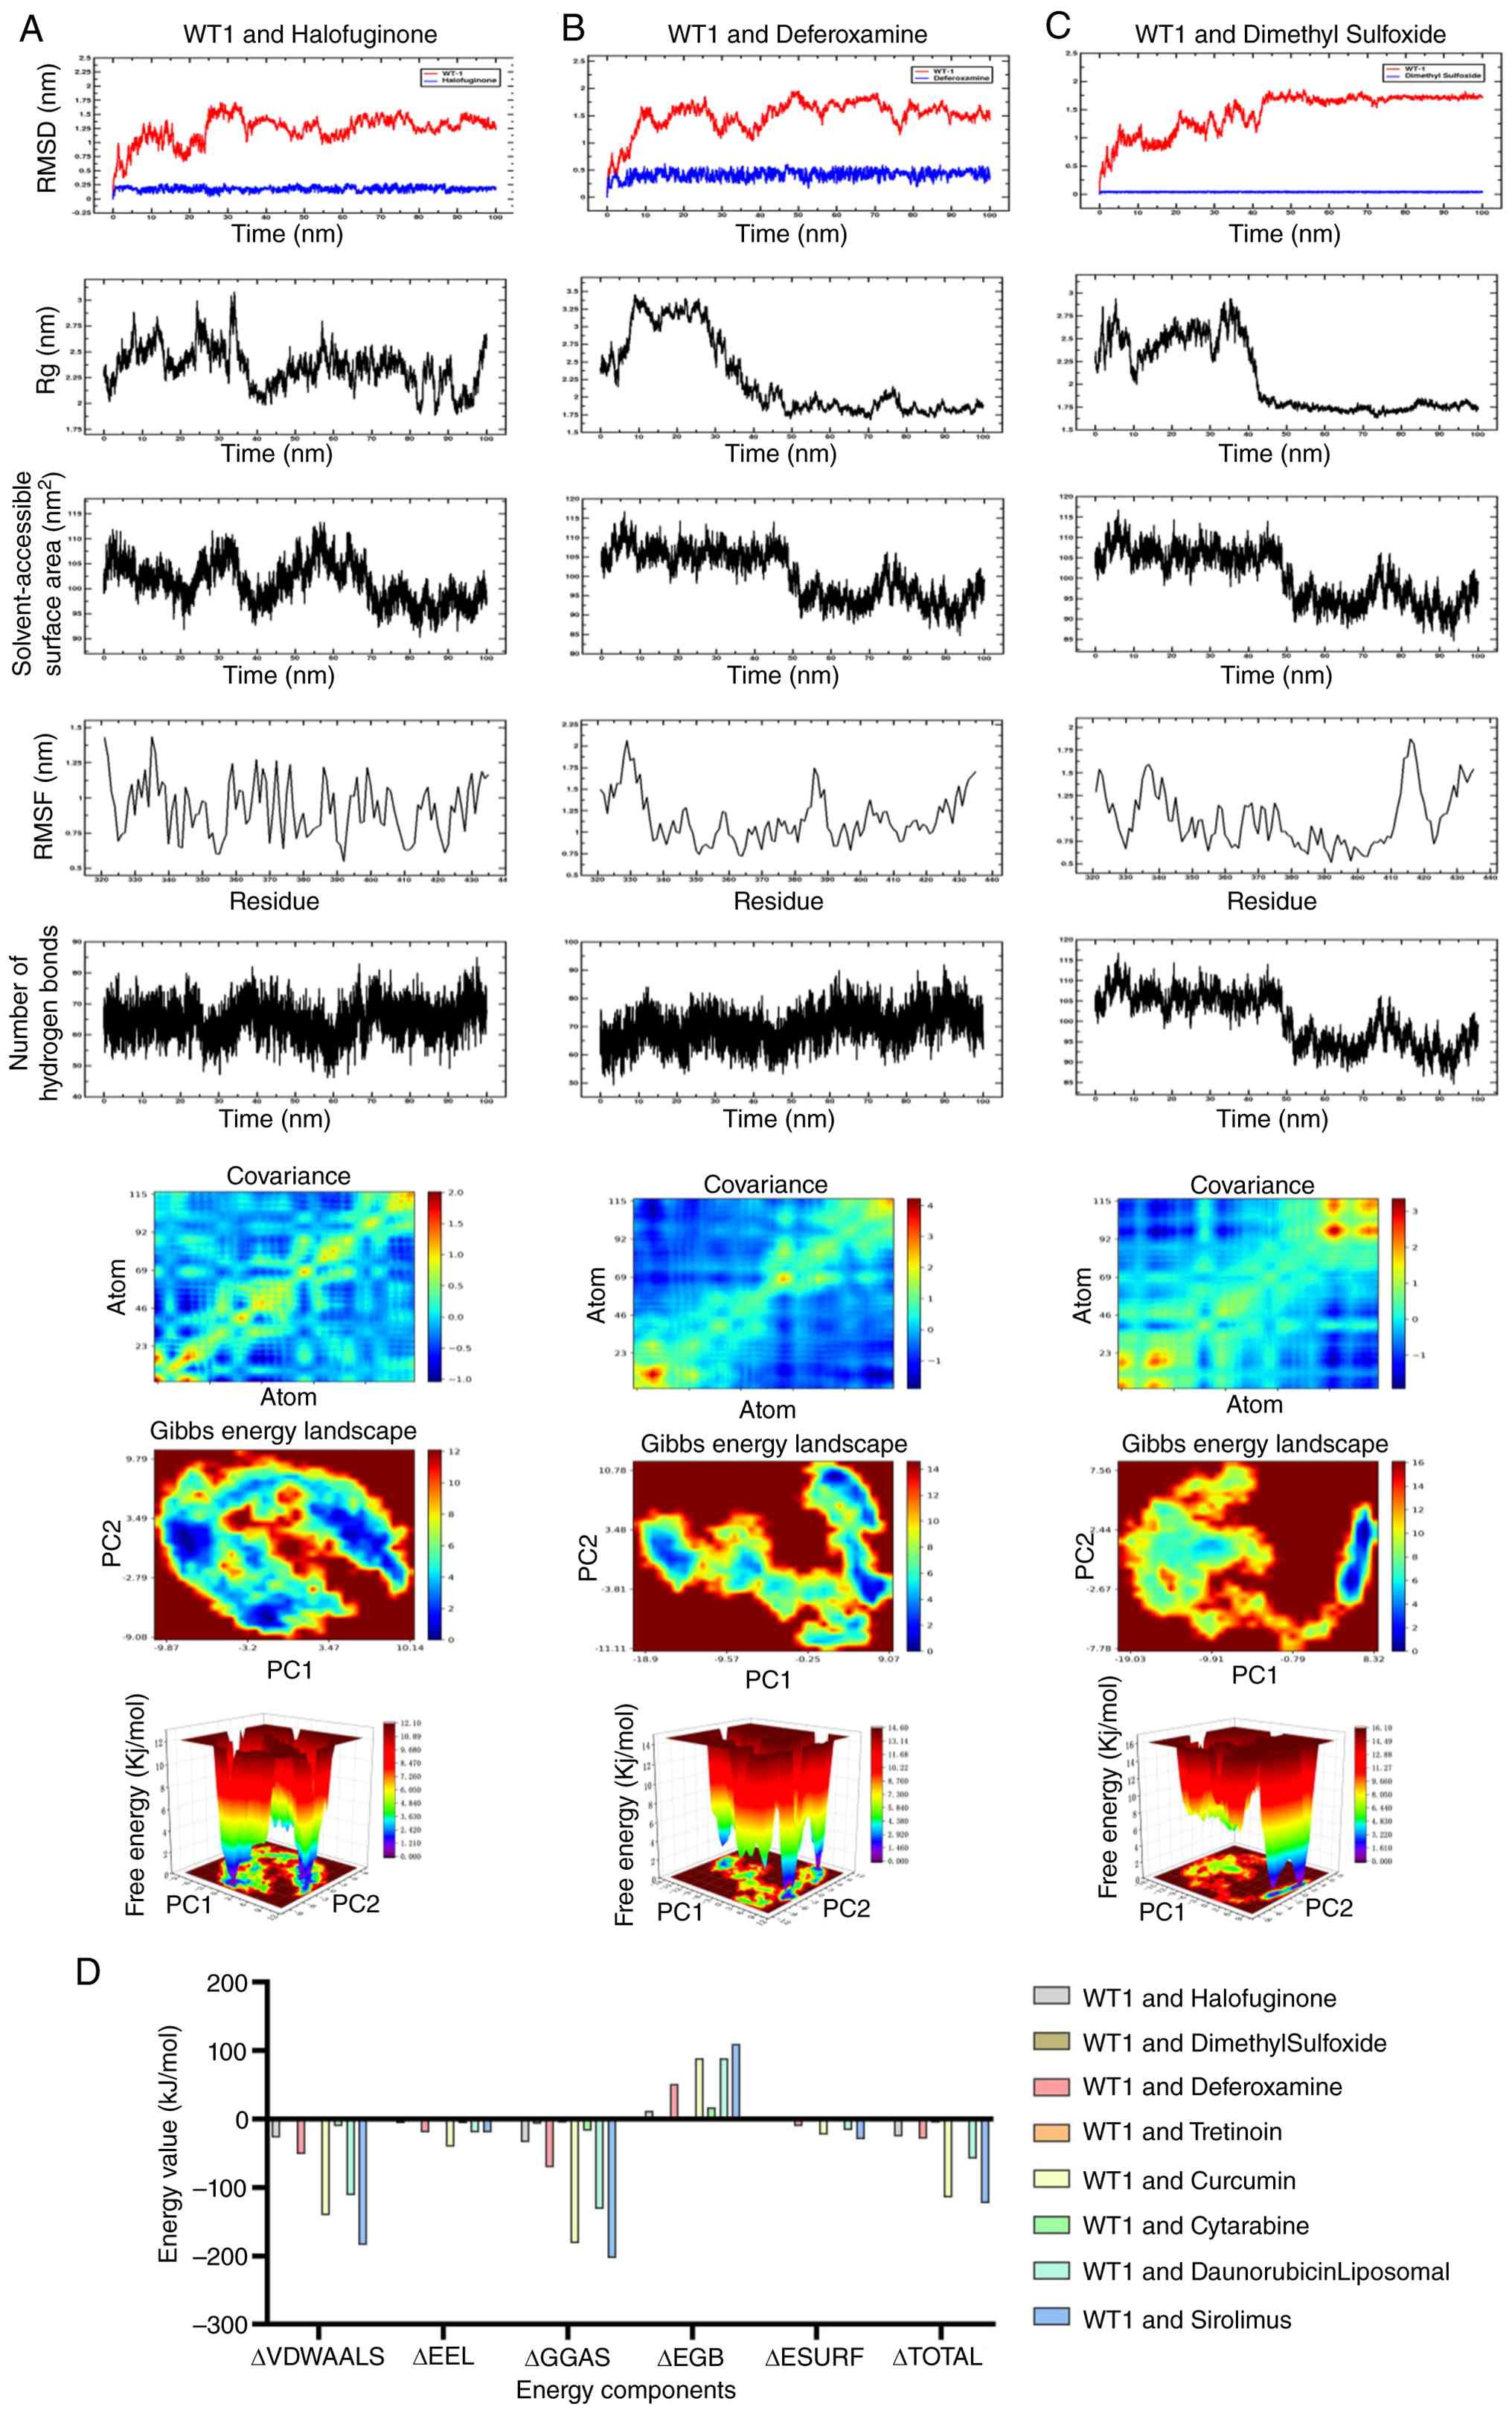
(Fig. 10A-C). To evaluate the
stability of these interactions, 100-ns MD simulations were
performed. Analysis of RMSD, Rg, solvent-accessible surface area
and hydrogen bonding indicated that all three complexes remained
structurally stable over the simulation period (Figs. 11 and 12A-C). Binding free energies estimated
by MM/PBSA suggested favorable interactions, with sirolimus
exhibiting the lowest (-122.88 kJ/mol) ΔG among the tested
compounds (Fig. 12D). In
combination, these computational analyses prioritized sirolimus as
a candidate for further experimental validation of WT1
modulation.
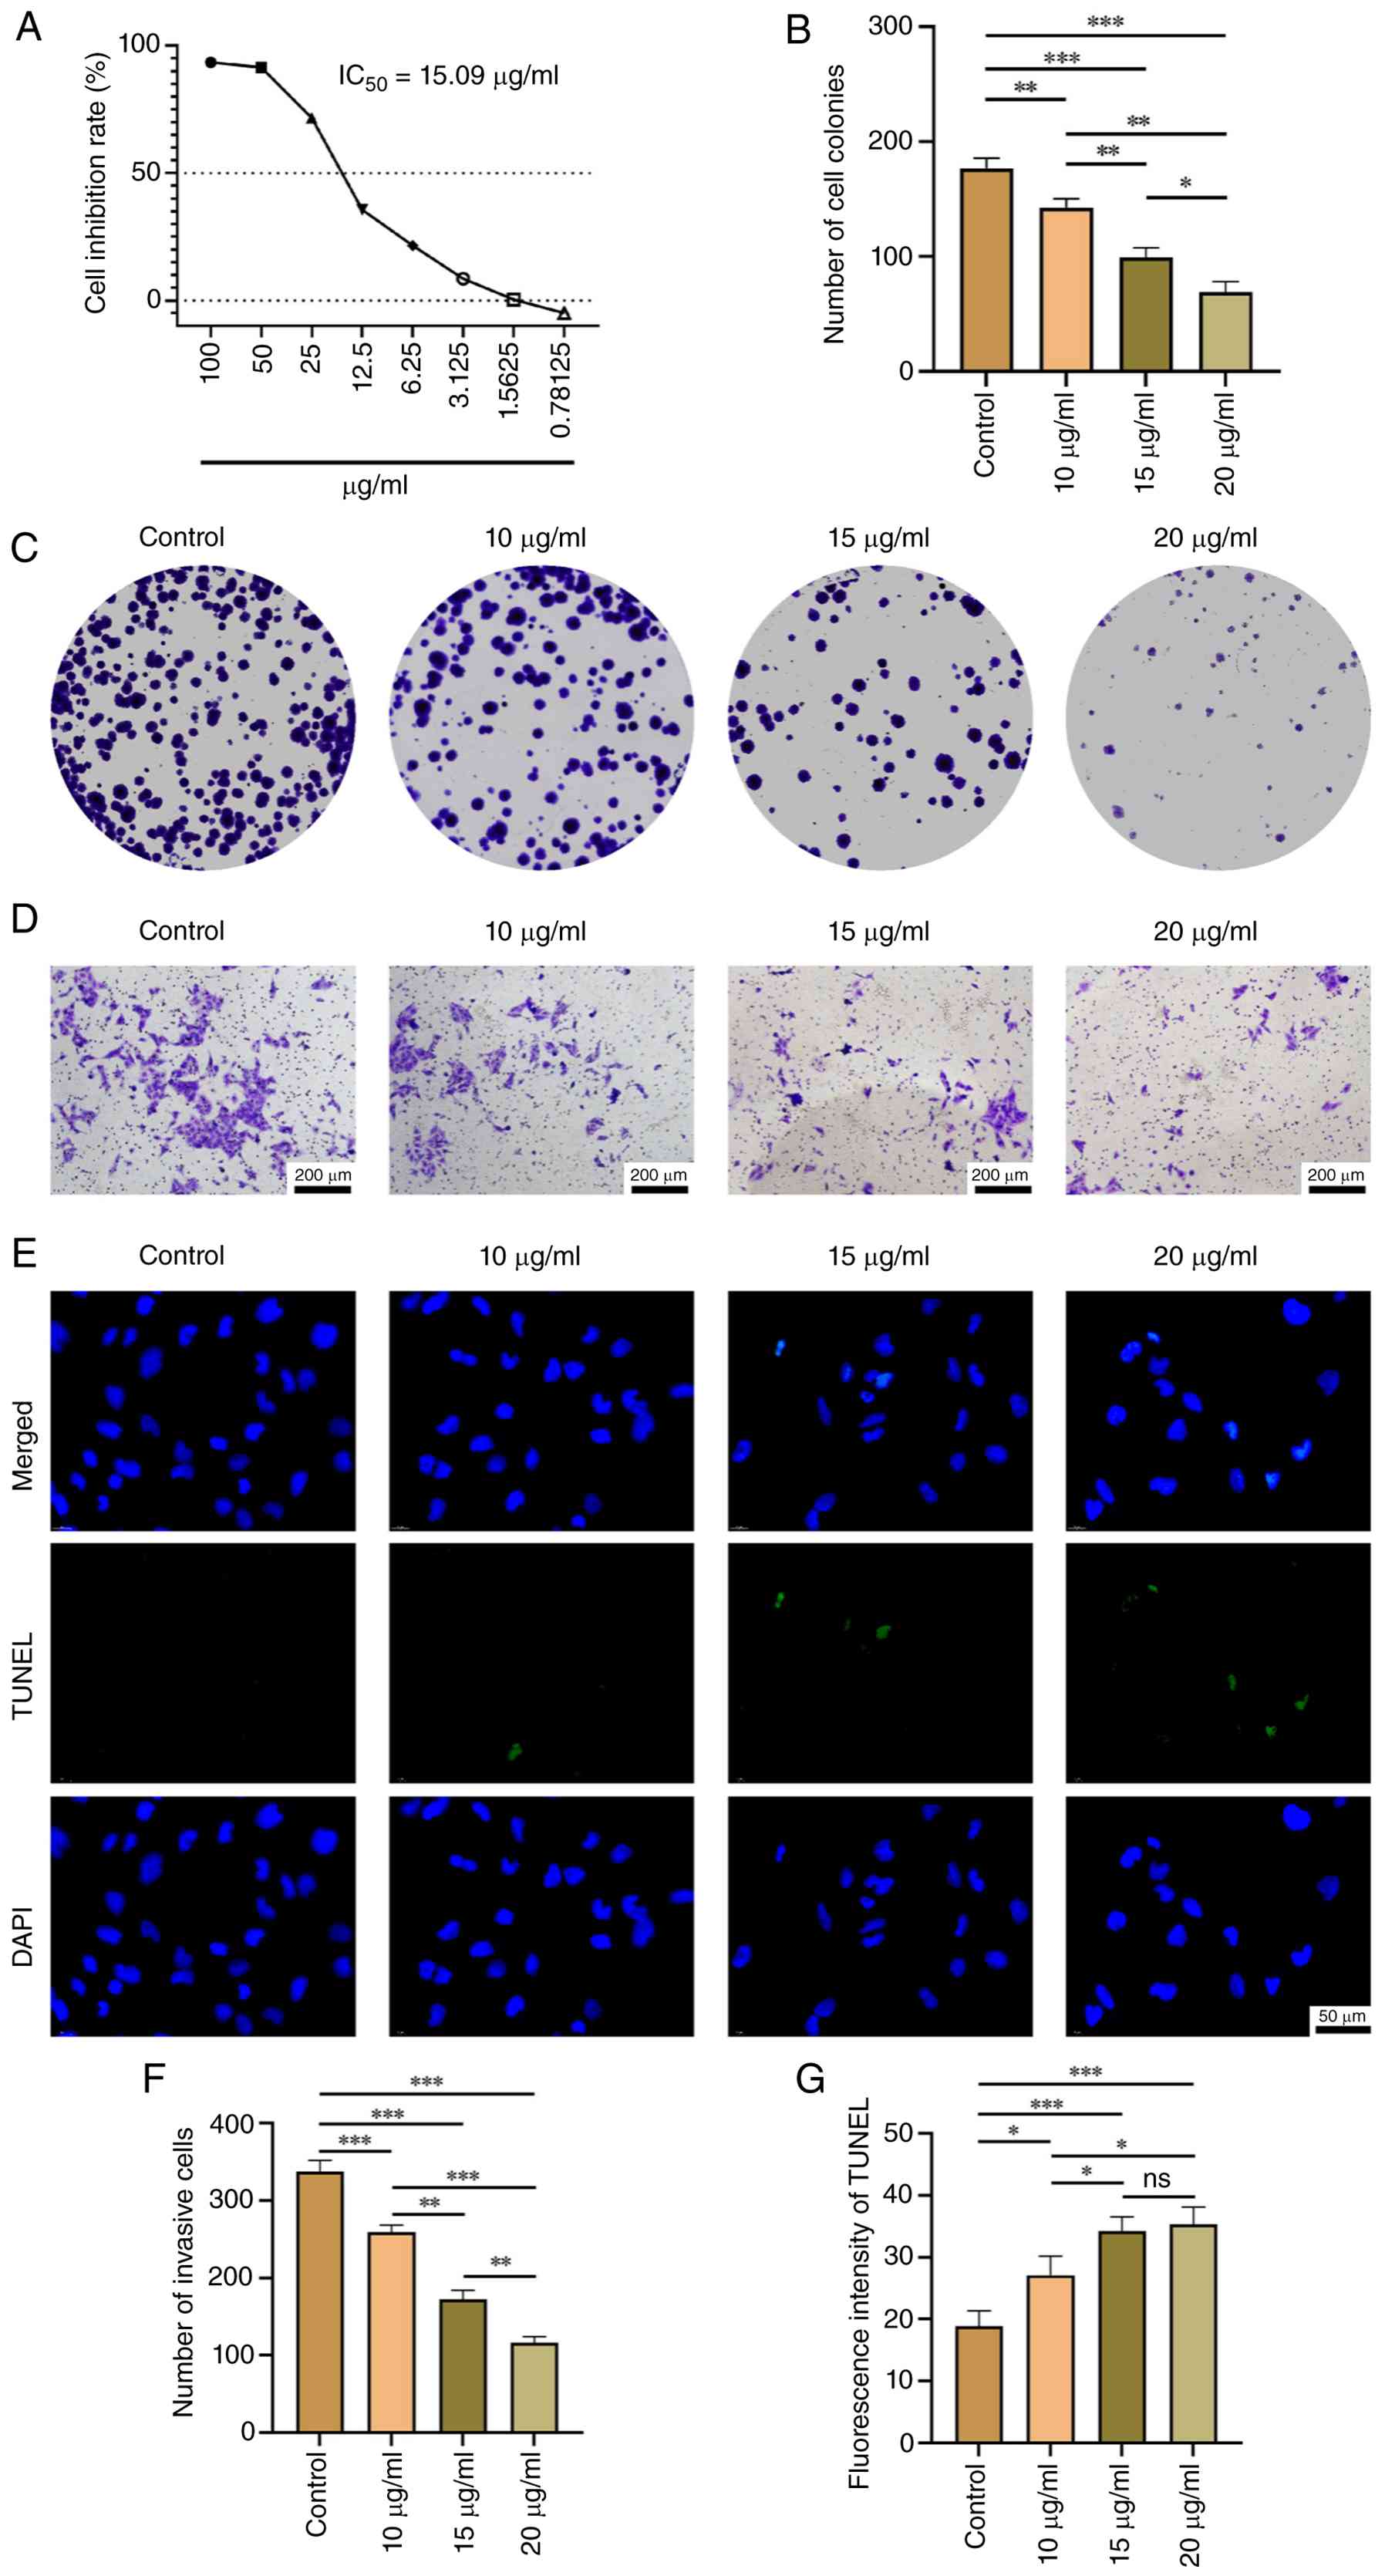
In vitro validation of the antitumor efficacy of
sirolimus. Following the computational identification of
sirolimus as a potential modulator of WT1, its antitumor effects in
the renal carcinoma cell line UOK276 were evaluated. The CCK-8
assay yielded an IC50 of 15.09 µg/ml (≈16.7 µM) for
sirolimus (Fig. 13A). Based on
this, concentrations of 10, 15 and 20 µg/ml were selected for
functional assays. Sirolimus treatment significantly reduced colony
formation in a dose-dependent manner (P<0.05; Fig. 13B and C), indicating suppression of long-term
proliferative capacity. Transwell invasion assays showed a
concentration-dependent decrease in
Matrigel®-penetrating cells (P<0.05; Fig. 13D and F), suggesting impaired invasive
potential. Furthermore, TUNEL staining revealed increased apoptosis
with higher drug concentrations (P<0.05; Fig. 13E and G). These results demonstrated that
sirolimus exerts anti-proliferative, anti-invasive and
pro-apoptotic effects in UOK276 cells under the tested
conditions.
Discussion
The present integrative analysis identified 17 CKDGs
that were dysregulated in both KIRC and CKD, with enrichment in
MAPK and PI3K-Akt signaling, pathways known to drive proliferation
and survival in stressed renal tissue. While epidemiological
studies have long noted the RCC-CKD comorbidity (46,47),
the present study provided a molecular framework linking these
conditions through shared transcriptional programs. Of note,
single-cell profiling revealed that CKDG expression was enriched in
CD4+ T cells and associated with features of functional
maturity, challenging the assumption that comorbidity uniformly
suppresses antitumor immunity. However, the high-expression CKDG
cluster exhibited poor prognosis despite an ‘immune-hot’ phenotype,
possibly reflecting concurrent upregulation of immune checkpoints,
a pattern that may indicate responsiveness to immunotherapy, as
suggested by the elevated TIDE scores.
It is clinically necessary to explore the link
between CKD and KIRC/RCC; CKD affects ~11% of adults in the United
States (48) and is associated
with an elevated risk of kidney cancer, even in the moderate stage,
according to a previous meta-analysis (48). Identifying shared pathogenic
mechanisms between CKD and RCC is essential for early detection and
therapeutic intervention in this high-risk population.
In the present study, among the CKDGs, WT1 showed a
nominal genetic association with renal carcinoma in PheWAS
(P=0.039), although this did not survive multiple-testing
correction. Computational docking and MD simulations predicted
stable binding between WT1 and sirolimus and in vitro assays
confirmed the antitumor effects of sirolimus in UOK276 cells.
However, given the primary action of sirolimus as an mechanistic
target of rapamycin (mTOR) inhibitor and the absence of direct
evidence linking its efficacy to WT1 modulation, these results
should not be interpreted as direct validation of WT1 as a
druggable target. Future studies employing WT1 knockdown or
CRISPR-based perturbation are needed to dissect its causal role.
WT1 encodes a zinc finger DNA-binding protein that acts as a
transcriptional activator or repressor depending on cellular
context. It is required for normal genitourinary system formation
and regulates mesenchymal-to-epithelial transition during kidney
development (49). In normal and
malignant hematopoiesis, WT1 has been implicated in the regulation
of apoptosis, proliferation and differentiation (50).
Despite the integrative multi-omics approach and
experimental validation performed in the present study, the present
study has several limitations. Of note, the present findings are
primarily based on in silico analyses and in vitro
cellular models, lacking in vivo confirmation in animal
models of RCC and CKD. In addition, the translational potential of
the identified WT1-sirolimus axis remains to be evaluated in
clinical settings. Future work will focus on two key directions: i)
Leveraging WT1 as a molecular target to screen and validate novel
therapeutic candidates for RCC through high-throughput drug
discovery platforms; and ii) elucidating previously uncharacterized
mechanisms of sirolimus action in RCC beyond canonical mTOR
inhibition, particularly in the context of CKD-RCC comorbidity.
Ultimately, advancing these findings into preclinical in
vivo models and early-phase clinical studies will be essential
to assess their therapeutic relevance and feasibility.
Beyond cancer, WT1 mutations underlie several
congenital disorders. Congenital WT1 mutations cause WT, Wilms
tumor, Aniridia, Genitourinary anomalies and Range of developmental
delays syndrome, Denys-Drash syndrome and Frasier syndrome
(51). Somatic WT1 mutations occur
in acute and chronic myeloid leukemia, myelodysplastic syndrome and
other blood neoplasms, while increased WT1 expression without
mutation is observed in leukemia and solid tumors (52). These findings underscore the
pleiotropic roles of WT1 across renal, hematological and
developmental diseases. WT1 functions both as a tumor suppressor
gene and as an oncogene, with this duality arising from isoform
diversity and cellular context (53).
In conclusion, in the present study, a multi-omics
framework that links CKD and KIRC was presented through a shared
gene signature, offering new insights into their comorbid
pathogenesis. The identification of WT1 as a candidate hub gene,
coupled with preliminary evidence of sirolimus activity, has
generated testable hypotheses for mechanistic and translational
research. While the present findings do not yet support clinical
application, they provide a rationale for exploring WT1-related
pathways in the context of RCC-CKD comorbidity and highlight the
need for models that recapitulate both tumor and renal
dysfunction.
Finally, it is informative to put the in
vitro observation of sirolimus activity in UOK276 cells into
clinical context. Sirolimus was first approved by the FDA in 1999
for the prophylaxis of organ rejection in patients aged ≥13 years
receiving renal transplants. It is a mTOR inhibitor with both
immunosuppressive and antitumor activities (54). Sirolimus has also been used in
drug-eluting stents to prevent restenosis following angioplasty.
Regarding its safety profile, sirolimus is associated with
increased susceptibility to infection, and possible development of
lymphoma and other malignancies due to immunosuppression. The use
of sirolimus in combination with tacrolimus has been associated
with excess mortality and graft loss in patients following de
novo liver transplant (55).
However, conversion to sirolimus in renal transplant recipients
with a history of cancer appears safe regarding renal function and
graft survival, with patient survival largely dependent on tumor
entity (56). These established
clinical safety and efficacy profiles support the exploration of
sirolimus as a repurposed agent in selected cancer populations.
Supplementary Material
Overall included data for the
meta-analysis.
CKD-related gene data obtained from
the GEO database.
FPKM file of the TCGA-KIRC queue.
Survival data file of the TCGA-KIRC
queue.
Acknowledgements
Not applicable.
Funding
Funding: The present study was supported by Special Fund Project
for Clinical Medical Research of Zhejiang Medical Association
(grant no. 2025ZYC-A13), Science and Technology Co construction
Project of China Traditional Chinese Medicine Comprehensive Reform
Demonstration Zone (grant no. GZY-KJS-ZJ-2026-115) and Joint TCM
Science & Technology Projects of National Demonstration Zones
for Comprehensive TCM Reform (grant no. GZY-KJS-ZJ-115).
Availability of data and materials
The data generated in the present study may be
requested from the corresponding author.
Authors' contributions
WZ, PT, SW and ZS conceived and designed the
experiments and analysis. WZ and ZS performed the experiments and
statistical analysis. WZ, PT, SW and ZS provided technical support
and wrote the paper. WZ and ZS provided funding support and
supervision. All authors read and approved the final version of the
manuscript. ZS and WZ confirm the authenticity of all the raw
data.
Ethics approval and consent to
participate
Not applicable.
Patient consent for publication
Not applicable.
Competing interests
The authors declare that they have no competing
interests.
References
|
1
|
Prelaj A, Miskovic V, Zanitti M, Trovo F,
Genova C, Viscardi G, Rebuzzi SE, Mazzeo L, Provenzano L, Kosta S,
et al: Artificial intelligence for predictive biomarker discovery
in immuno-oncology: A systematic review. Ann Oncol. 35:29–65.
2024.PubMed/NCBI View Article : Google Scholar
|
|
2
|
Powles T, Choueiri TK, Albiges L, Peltola
K, Velasco GD, Burotto M, Suarez C, Ghatalia P, Iacovelli R, Lam
ET, et al: Health-related quality of life with belzutifan versus
everolimus for advanced renal cell carcinoma (LITESPARK-005):
Patient-reported outcomes from a randomised, open-label, phase 3
trial. Lancet Oncol. 26:491–502. 2025.PubMed/NCBI View Article : Google Scholar
|
|
3
|
Li Y, Lih TM, Dhanasekaran SM, Mannan R,
Chen L, Cieslik M, Wu Y, Lu RJH, Clark DJ, Kołodziejczak I, et al:
Histopathologic and proteogenomic heterogeneity reveals features of
clear cell renal cell carcinoma aggressiveness. Cancer Cell.
41:139–163.e17. 2023.PubMed/NCBI View Article : Google Scholar
|
|
4
|
Larcher A, Campi R, Bex A, Freddie B,
Bukavina L, Jonasch E, Jemal A, Linehan WM, Marandino L, Mir MC, et
al: Epidemiology of renal cancer: Incidence, mortality, survival,
genetic predisposition, and risk factors. Eur Urol. 88:341–358.
2025.PubMed/NCBI View Article : Google Scholar
|
|
5
|
Xu Y, Li L, Yang W, Zhang K, Zhang Z, Yu
C, Qiu J, Cai L, Gong Y, Zhang Z, et al: TRAF2 promotes
M2-polarized tumor-associated macrophage infiltration, angiogenesis
and cancer progression by inhibiting autophagy in clear cell renal
cell carcinoma. J Exp Clin Cancer Res. 42(159)2023.PubMed/NCBI View Article : Google Scholar
|
|
6
|
Shu G, Chen M, Liao W, Fu L, Lin M, Gui C,
Cen J, Lu J, Chen Z, Wei J, et al: PABPC1L Induces IDO1 to promote
tryptophan metabolism and immune suppression in renal cell
carcinoma. Cancer Res. 84:1659–1679. 2024.PubMed/NCBI View Article : Google Scholar
|
|
7
|
Achrol AS, Rennert RC, Anders C, Soffietti
R, Ahluwalia MS, Nayak L, Peters S, Arvold ND, Harsh GR, Steeg PS
and Chang SD: Brain metastases. Nat Rev Dis Primers.
5(5)2019.PubMed/NCBI View Article : Google Scholar
|
|
8
|
Li W, Meng X, Yuan H, Xiao W and Zhang X:
A novel immune-related ceRNA network and relative potential
therapeutic drug prediction in ccRCC. Front Genet.
12(755706)2021.PubMed/NCBI View Article : Google Scholar
|
|
9
|
Liu S, Cheng Y, Wang S and Liu H:
Circadian clock genes modulate immune, cell cycle and apoptosis in
the diagnosis and prognosis of pan-renal cell carcinoma. Front Mol
Biosci. 8(747629)2021.PubMed/NCBI View Article : Google Scholar
|
|
10
|
Veroniki AA, Soobiah C, Nincic V, Lai Y,
Rios P, MacDonald H, Khan PA, Ghassemi M, Yazdi F, Brownson RC, et
al: Efficacy of sustained knowledge translation (KT) interventions
in chronic disease management in older adults: Systematic review
and meta-analysis of complex interventions. BMC Med.
21(269)2023.PubMed/NCBI View Article : Google Scholar
|
|
11
|
Guo X, Xu L, Velazquez H, Chen TM,
Williams RM, Heller DA, Burtness B, Safirstein R and Desir GV:
Kidney-targeted renalase agonist prevents cisplatin-induced chronic
kidney disease by inhibiting regulated necrosis and inflammation. J
Am Soc Nephrol. 33:342–356. 2022.PubMed/NCBI View Article : Google Scholar
|
|
12
|
Winquist A, Hodge JM, Diver WR, Rodriguez
JL, Troeschel AN, Daniel J and Teras LR: Case-cohort study of the
association between pfas and selected cancers among participants in
the american cancer society's cancer prevention study II lifelink
cohort. Environ Health Perspect. 131(127007)2023.PubMed/NCBI View Article : Google Scholar
|
|
13
|
Saly DL, Eswarappa MS, Street SE and
Deshpande P: Renal cell cancer and chronic kidney disease. Adv
Chronic Kidney Dis. 28:460–468.e1. 2021.PubMed/NCBI View Article : Google Scholar
|
|
14
|
Long Z, Luo Y, Yu M, Wang X, Zeng L and
Yang K: Targeting ferroptosis: A new therapeutic opportunity for
kidney diseases. Front Immunol. 15(1435139)2024.PubMed/NCBI View Article : Google Scholar
|
|
15
|
Peihui Z, Jianing C, Chuwen L, Hanjin R,
Wenyu Y, Jiaqi Z, Yujie L and Li W: Chronic kidney disease
facilitates TNF-α + neutrophils dysfunction and progression in oral
squamous cell carcinoma. Int Immunopharmacol.
162(115184)2025.PubMed/NCBI View Article : Google Scholar
|
|
16
|
Yekedüz E, Zarba M, Saad E, Chehade REH,
Eid M, Saliby RM, Steiner C, Machaalani M, Nawfal R, Semaan K, et
al: Comorbidity burden and effectiveness of immunotherapy in
metastatic renal cell carcinoma. Clin Genitourin Cancer.
23(102385)2025.PubMed/NCBI View Article : Google Scholar
|
|
17
|
Christensson A, Savage C, Sjoberg DD,
Cronin AM, O'Brien MF, Lowrance W, Nilsson PM, Vickers AJ, Russo P
and Lilja H: Association of cancer with moderately impaired renal
function at baseline in a large, representative, population-based
cohort followed for up to 30 years. Int J Cancer. 133:1452–1458.
2013.PubMed/NCBI View Article : Google Scholar
|
|
18
|
Park J, Shin DW, Han K, Kim D, Chun S and
Jang HR: Associations between kidney function, proteinuria, and the
risk of kidney cancer: A nationwide cohort study involving 10
million participants. Am J Epidemiol. 190:2042–2052.
2021.PubMed/NCBI View Article : Google Scholar
|
|
19
|
Kitchlu A, Reid J, Jeyakumar N, Dixon SN,
Munoz AM, Silver SA, Booth CM, Chan CTM, Garg AX, Amir E, et al:
Cancer risk and mortality in patients with kidney disease: A
population-based cohort study. Am J Kidney Dis. 80:436–448.e1.
2022.PubMed/NCBI View Article : Google Scholar
|
|
20
|
Hofmann JN, Corley DA, Zhao WK, Colt JS,
Shuch B, Chow WH and Purdue MP: Chronic kidney disease and risk of
renal cell carcinoma: Differences by race. Epidemiology. 26:59–67.
2015.PubMed/NCBI View Article : Google Scholar
|
|
21
|
Lowrance WT, Ordoñez J, Udaltsova N, Russo
P and Go AS: CKD and the risk of incident cancer. J Am Soc Nephrol.
25:2327–2334. 2014.PubMed/NCBI View Article : Google Scholar
|
|
22
|
Mok Y, Matsushita K, Ballew SH, Sang Y,
Jung KJ, Lee S, Jee SH and Coresh J: Kidney function, proteinuria,
and cancer incidence: The korean heart study. Am J Kidney Dis.
70:512–521. 2017.PubMed/NCBI View Article : Google Scholar
|
|
23
|
Park S, Lee S, Kim Y, Lee Y, Kang MW, Han
K, Han SS, Lee H, Lee JP, Joo KW, et al: Risk of cancer in
pre-dialysis chronic kidney disease: A nationwide population-based
study with a matched control group. Kidney Res Clin Pract.
38:60–70. 2019.PubMed/NCBI View Article : Google Scholar
|
|
24
|
Wells GA and Shea B, O'Connell D, Wells
GA, O'Connell D and Shea B: The Newcastle-Ottawa Scale (NOS) for
assessing the quality of nonrandomised studies in meta-analyses.
Ottawa Hospital Research Institute, Ottawa, 2011.
|
|
25
|
World Health Organization. International
Statistical Classification of Diseases and Related Health Problems,
10th Revision. Vol 3. 5th edition. World Health Organization,
Geneva, 2016. Available from: https://iris.who.int/handle/10665/246208.
|
|
26
|
Alto SI, Chang CN, Brown K, Kioussi C and
Filtz TM: Gene expression profiling of skeletal muscles. Genes
(Basel). 12(1718)2021.PubMed/NCBI View Article : Google Scholar
|
|
27
|
Mishra S, Singh S, Ashish A, Rai S and
Singh R: Unveiling immune and signalling proteins in recurrent
pregnancy loss: GEO2R analysis sheds light. Comput Biol Med.
194(110535)2025.PubMed/NCBI View Article : Google Scholar
|
|
28
|
Shu K, Cai C, Chen W, Ding J, Guo Z, Wei Y
and Zhang W: Prognostic value and immune landscapes of immunogenic
cell death-associated lncRNAs in lung adenocarcinoma. Sci Rep.
13(19151)2023.PubMed/NCBI View Article : Google Scholar
|
|
29
|
Zhang YJ, Huang C, Zu XG, Liu JM and Li
YJ: Use of machine learning for the identification and validation
of immunogenic cell death biomarkers and immunophenotypes in
coronary artery disease. J Inflamm Res. 17:223–249. 2024.PubMed/NCBI View Article : Google Scholar
|
|
30
|
Hu M, Alkhairy S, Lee I, Pillich RT, Fong
D, Smith K, Bachelder R, Ideker T and Pratt D: Evaluation of large
language models for discovery of gene set function. Nat Methods.
22:82–91. 2025.PubMed/NCBI View Article : Google Scholar
|
|
31
|
Xu S, Hu E, Cai Y, Xie Z, Luo X, Zhan L,
Tang W, Wang Q, Liu B, Wang R, et al: Using clusterProfiler to
characterize multiomics data. Nat Protoc. 19:3292–3320.
2024.PubMed/NCBI View Article : Google Scholar
|
|
32
|
Xie J, Zhu Y, Yang Z, Yu Z, Yang M and
Wang Q: An integrative analysis reveals cancer risk associated with
artificial sweeteners. J Transl Med. 23(32)2025.PubMed/NCBI View Article : Google Scholar
|
|
33
|
Tan Z, Chen X, Zuo J, Fu S, Wang H and
Wang J: Comprehensive analysis of scRNA-Seq and bulk RNA-Seq
reveals dynamic changes in the tumor immune microenvironment of
bladder cancer and establishes a prognostic model. J Transl Med.
21(223)2023.PubMed/NCBI View Article : Google Scholar
|
|
34
|
Ho DW, Tsui YM, Chan LK, Sze KM, Zhang X,
Cheu JW, Chiu YT, Lee JMF, Chan ACY, Cheung ETY, et al: Single-cell
RNA sequencing shows the immunosuppressive landscape and tumor
heterogeneity of HBV-associated hepatocellular carcinoma. Nat
Commun. 12(3684)2021.PubMed/NCBI View Article : Google Scholar
|
|
35
|
Li C, Hao R, Li C, Liu L and Ding Z:
Integration of single-cell and bulk RNA sequencing data using
machine learning identifies oxidative stress-related genes LUM and
PCOLCE2 as potential biomarkers for heart failure. Int J Biol
Macromol. 300(140793)2025.PubMed/NCBI View Article : Google Scholar
|
|
36
|
Cheng C, Chen W, Jin H and Chen X: A
review of single-cell RNA-Seq annotation, integration, and
cell-cell communication. Cells. 12(1970)2023.PubMed/NCBI View Article : Google Scholar
|
|
37
|
Jin S, Guerrero-Juarez CF, Zhang L, Chang
I, Ramos R, Kuan CH, Myung P, Plikus MV and Nie Q: Inference and
analysis of cell-cell communication using CellChat. Nat Commun.
12(1088)2021.PubMed/NCBI View Article : Google Scholar
|
|
38
|
Hu X, Ni S, Zhao K, Qian J and Duan Y:
Bioinformatics-led discovery of osteoarthritis biomarkers and
inflammatory infiltrates. Front Immunol. 13(871008)2022.PubMed/NCBI View Article : Google Scholar
|
|
39
|
Zheng H, Liu H, Li H, Dou W, Wang J, Zhang
J, Liu T, Wu Y, Liu Y and Wang X: Characterization of stem cell
landscape and identification of stemness-relevant prognostic gene
signature to aid immunotherapy in colorectal cancer. Stem Cell Res
Ther. 13(244)2022.PubMed/NCBI View Article : Google Scholar
|
|
40
|
Huang ZY, Luo ZY, Cai YR, Chou CH, Yao ML,
Pei FX, Kraus VB and Zhou ZK: Single cell transcriptomics in human
osteoarthritis synovium and in silico deconvoluted bulk RNA
sequencing. Osteoarthritis Cartilage. 30:475–480. 2022.PubMed/NCBI View Article : Google Scholar
|
|
41
|
Pierre-Jean M, Mauger F, Deleuze JF, Le
Floch E and Pint MF: Penalized integrative matrix factorization
method for multi-omics data. Bioinformatics. 38:900–907.
2022.PubMed/NCBI View Article : Google Scholar
|
|
42
|
Bastarache L, Denny JC and Roden DM:
Phenome-wide association studies. JAMA. 327:75–76. 2022.PubMed/NCBI View Article : Google Scholar
|
|
43
|
Sudha G, Singh P, Swapna LS and Srinivasan
N: Weak conservation of structural features in the interfaces of
homologous transient protein-protein complexes. Protein Sci.
24:1856–73. 2015.PubMed/NCBI View Article : Google Scholar
|
|
44
|
Cao F, Guo C and Guo J: Deciphering CSU
pathogenesis: Network toxicologyand molecular dynamics of DOTP
exposure. Ecotoxicol Environ Saf. 291(117864)2025.PubMed/NCBI View Article : Google Scholar
|
|
45
|
Kehrein J and Sotriffer C: Molecular
dynamics simulations for rationalizing polymer bioconjugation
strategies: Challenges, recent developments, and future
opportunities. ACS Biomater Sci Eng. 10:51–74. 2024.PubMed/NCBI View Article : Google Scholar
|
|
46
|
GBD 2021 Stroke Risk Factor Collaborators.
Global, regional, and national burden of stroke and its risk
factors, 1990-2021: A systematic analysis for the global burden of
disease study 2021. Lancet Neurol. 23:973–1003. 2024.PubMed/NCBI View Article : Google Scholar
|
|
47
|
GBD 2023 Demographics Collaborators.
Global age-sex-specific all-cause mortality and life expectancy
estimates for 204 countries and territories and 660 subnational
locations, 1950-2023: A demographic analysis for the global burden
of disease study 2023. Lancet. 406:1731–1810. 2025.PubMed/NCBI View Article : Google Scholar
|
|
48
|
Papageorgiou AC, Shapiro R and Acharya KR:
Molecular recognition of human angiogenin by placental ribonuclease
inhibitor-an X-ray crystallographic study at 2.0 A resolution. EMBO
J. 16:5162–5177. 1997.PubMed/NCBI View Article : Google Scholar
|
|
49
|
Webster AC, Nagler EV, Morton RL and
Masson P: Chronic kidney disease. Lancet. 389:1238–1252.
2017.PubMed/NCBI View Article : Google Scholar
|
|
50
|
Brooks ER, Siriruchatanon M, Prabhu V,
Charytan DM, Huang WC, Chen Y and Kang SK: Chronic kidney disease
and risk of kidney or urothelial malignancy: Systematic review and
meta-analysis. Nephrol Dial Transplant. 39:1023–1033.
2024.PubMed/NCBI View Article : Google Scholar
|
|
51
|
Kreidberg JA, Sariola H, Loring JM, Maeda
M, Pelletier J, Housman D and Jaenisch R: WT-1 is required for
early kidney development. Cell. 74:679–691. 1993.PubMed/NCBI View Article : Google Scholar
|
|
52
|
Ariyaratana S and Loeb DM: The role of the
Wilms tumour gene (WT1) in normal and malignant haematopoiesis.
Expert Rev Mol Med. 9:1–17. 2007.PubMed/NCBI View Article : Google Scholar
|
|
53
|
Nian Q, Lin Y, Zeng J, Zhang Y and Liu R:
Multifaceted functions of the Wilms tumor 1 protein: From its
expression in various malignancies to targeted therapy. Transl
Oncol. 52(102237)2025.PubMed/NCBI View Article : Google Scholar
|
|
54
|
Wu J, Yan H and Xiang C: Wilms' tumor gene
1 in hematological malignancies: Friend or foe. Hematology.
28(2254557)2023.PubMed/NCBI View Article : Google Scholar
|
|
55
|
Naik MG, Arns W, Budde K, Diekmann F,
Eitner F, Gwinner W, Heyne N, Jürgensen JS, Morath C, Riester U, et
al: Sirolimus in renal transplant recipients with malignancies in
Germany. Clin Kidney J. 14:2047–2058. 2021.PubMed/NCBI View Article : Google Scholar
|
|
56
|
Asrani SK, Wiesner RH, Trotter JF,
Klintmalm G, Katz E, Maller E, Roberts J, Kneteman N, Teperman L,
Fung JJ and Millis JM: De novo sirolimus and reduced-dose
tacrolimus versus standard-dose tacrolimus after liver
transplantation: The 2000-2003 phase II prospective randomized
trial. Am J Transplant. 14:356–366. 2014.PubMed/NCBI View Article : Google Scholar
|