Introduction
Diabetic kidney disease (DKD) is one of the most
serious microvascular complications of diabetes mellitus, with its
incidence steadily rising and has become the primary cause of
end-stage kidney disease (ESKD) in Europe, the United States, and
Asian countries (1,2). Despite the evidence from several
randomized controlled trials demonstrating the efficacy of
renin-angiotensin system inhibitors, sodium-glucose cotransporter 2
inhibitors, and non-steroidal mineralocorticoid receptor
antagonists in reducing renal endpoints, there remains a persistent
risk of DKD progression. The incidence of DKD and resulting ESKD is
still on the rise, and the available Western medical treatments
have not yet led to an inflection point in the occurrence and
progression of DKD. Once DKD has progressed to severe renal
insufficiency, it is considered an irreversible and extremely
high-risk stage; therefore, there is a pressing need to continually
investigate more sensitive biomarkers for the diagnosis and
intervention of DKD.
Ferroptosis, a form of iron-dependent cell death
driven by lipid peroxidation discovered in 2012, is caused by an
imbalance in cellular redox homeostasis, leading to massive lipid
peroxidation and eventual accumulation of excess iron-dependent
lipid hydroperoxides to lethal levels, which in turn causes
intracellular mitochondrial atrophy, an increase in the density of
bilayers, and a decrease in or disappearance of the mitochondrial
cristae (3). It is widely
investigated in the fields of oncology, heart failure and
neurological diseases (4). Since
the presence of ferroptosis in DKD was first reported in
2020(5), a growing amount of
research evidence suggests that ferroptosis is an essential driver
in the development of DKD, which can damage a wide range of renal
intrinsic cells and reduce renal function (6). Additionally, inhibition of
ferroptosis can effectively delay the development of renal lesions
in diabetic mice (4). The
pathogenesis of DKD is complex and involves multiple pathways, such
as metabolic disorders, hemodynamic abnormalities, inflammation and
fibrosis reactions, oxidative stress and cell death (7). However, the exact mechanism remains
unclear. Previous studies have primarily focused on metabolic and
hemodynamic changes (8), but
increasing evidence suggests that immune disorders and inflammatory
responses play a crucial role in the occurrence and progression of
DKD (9). Recently, it has also
been shown that ferroptosis can trigger kidney injury through an
immune cell-mediated inflammatory response (10), and monitoring the degree of kidney
immune infiltration and inflammation may guide clinical
decision-making. However, the mechanisms underlying abnormal iron
metabolism and immune inflammation in DKD remain unclear.
In the present study, bioinformatics technology was
used to screen differentially expressed genes (DEGs) associated
with ferroptosis in DKD and reveal the biological functions and
signal transduction pathways they are involved in, as well as to
obtain key genes by combining WGCNA. Hub genes were obtained based
on key genes to construct and validate the DKD diagnostic model.
The correlation between hub genes and immune infiltration was also
explored. The results of the present study would help provide new
ideas for the pathogenesis of DKD and new molecular targets for the
treatment of DKD.
Materials and methods
Microarray dataset collection and data
process
The DKD-related datasets GSE30528(11), GSE30529(11), GSE30122 (11,12)
and GSE96804 (13,14) were downloaded from the GEO database
via the R package GEOquery (15),
in which the datasets GSE30528, GSE30529 and GSE30122 served as the
test set and the dataset GSE96804 served as the validation set. All
DKD samples and control samples were included in the present study.
The characteristics of these datasets are listed in Table SI. The R package sva (16) was used to de-batch the datasets
GSE30528, GSE30529 and GSE30122 to obtain the combined GEO
datasets, which contained 19 DKD samples and 50 control samples.
Finally, the combined GEO datasets and dataset GSE96804 were
subjected to normalization using the R package limma (17), along with annotation of probes and
other standardization and normalization procedures.
Ferroptosis-related genes (FRGs) were collected from
the GeneCards database by searching for ‘ferroptosis’ and retaining
only those categorized as ‘Protein Coding’, yielding 654 FRGs
(18). Additionally, a systematic
literature search on PubMed using the keyword ‘ferroptosis’ was
performed, and FRGs with at least one in vitro or in
vivo experimental validation reported in peer-reviewed
publications were manually curated, yielding 60 FRGs (19). After merging and removing
duplicates, a final set of 667 FRGs was obtained (Table SII). The data processing flowchart
is depicted in Fig. 1.
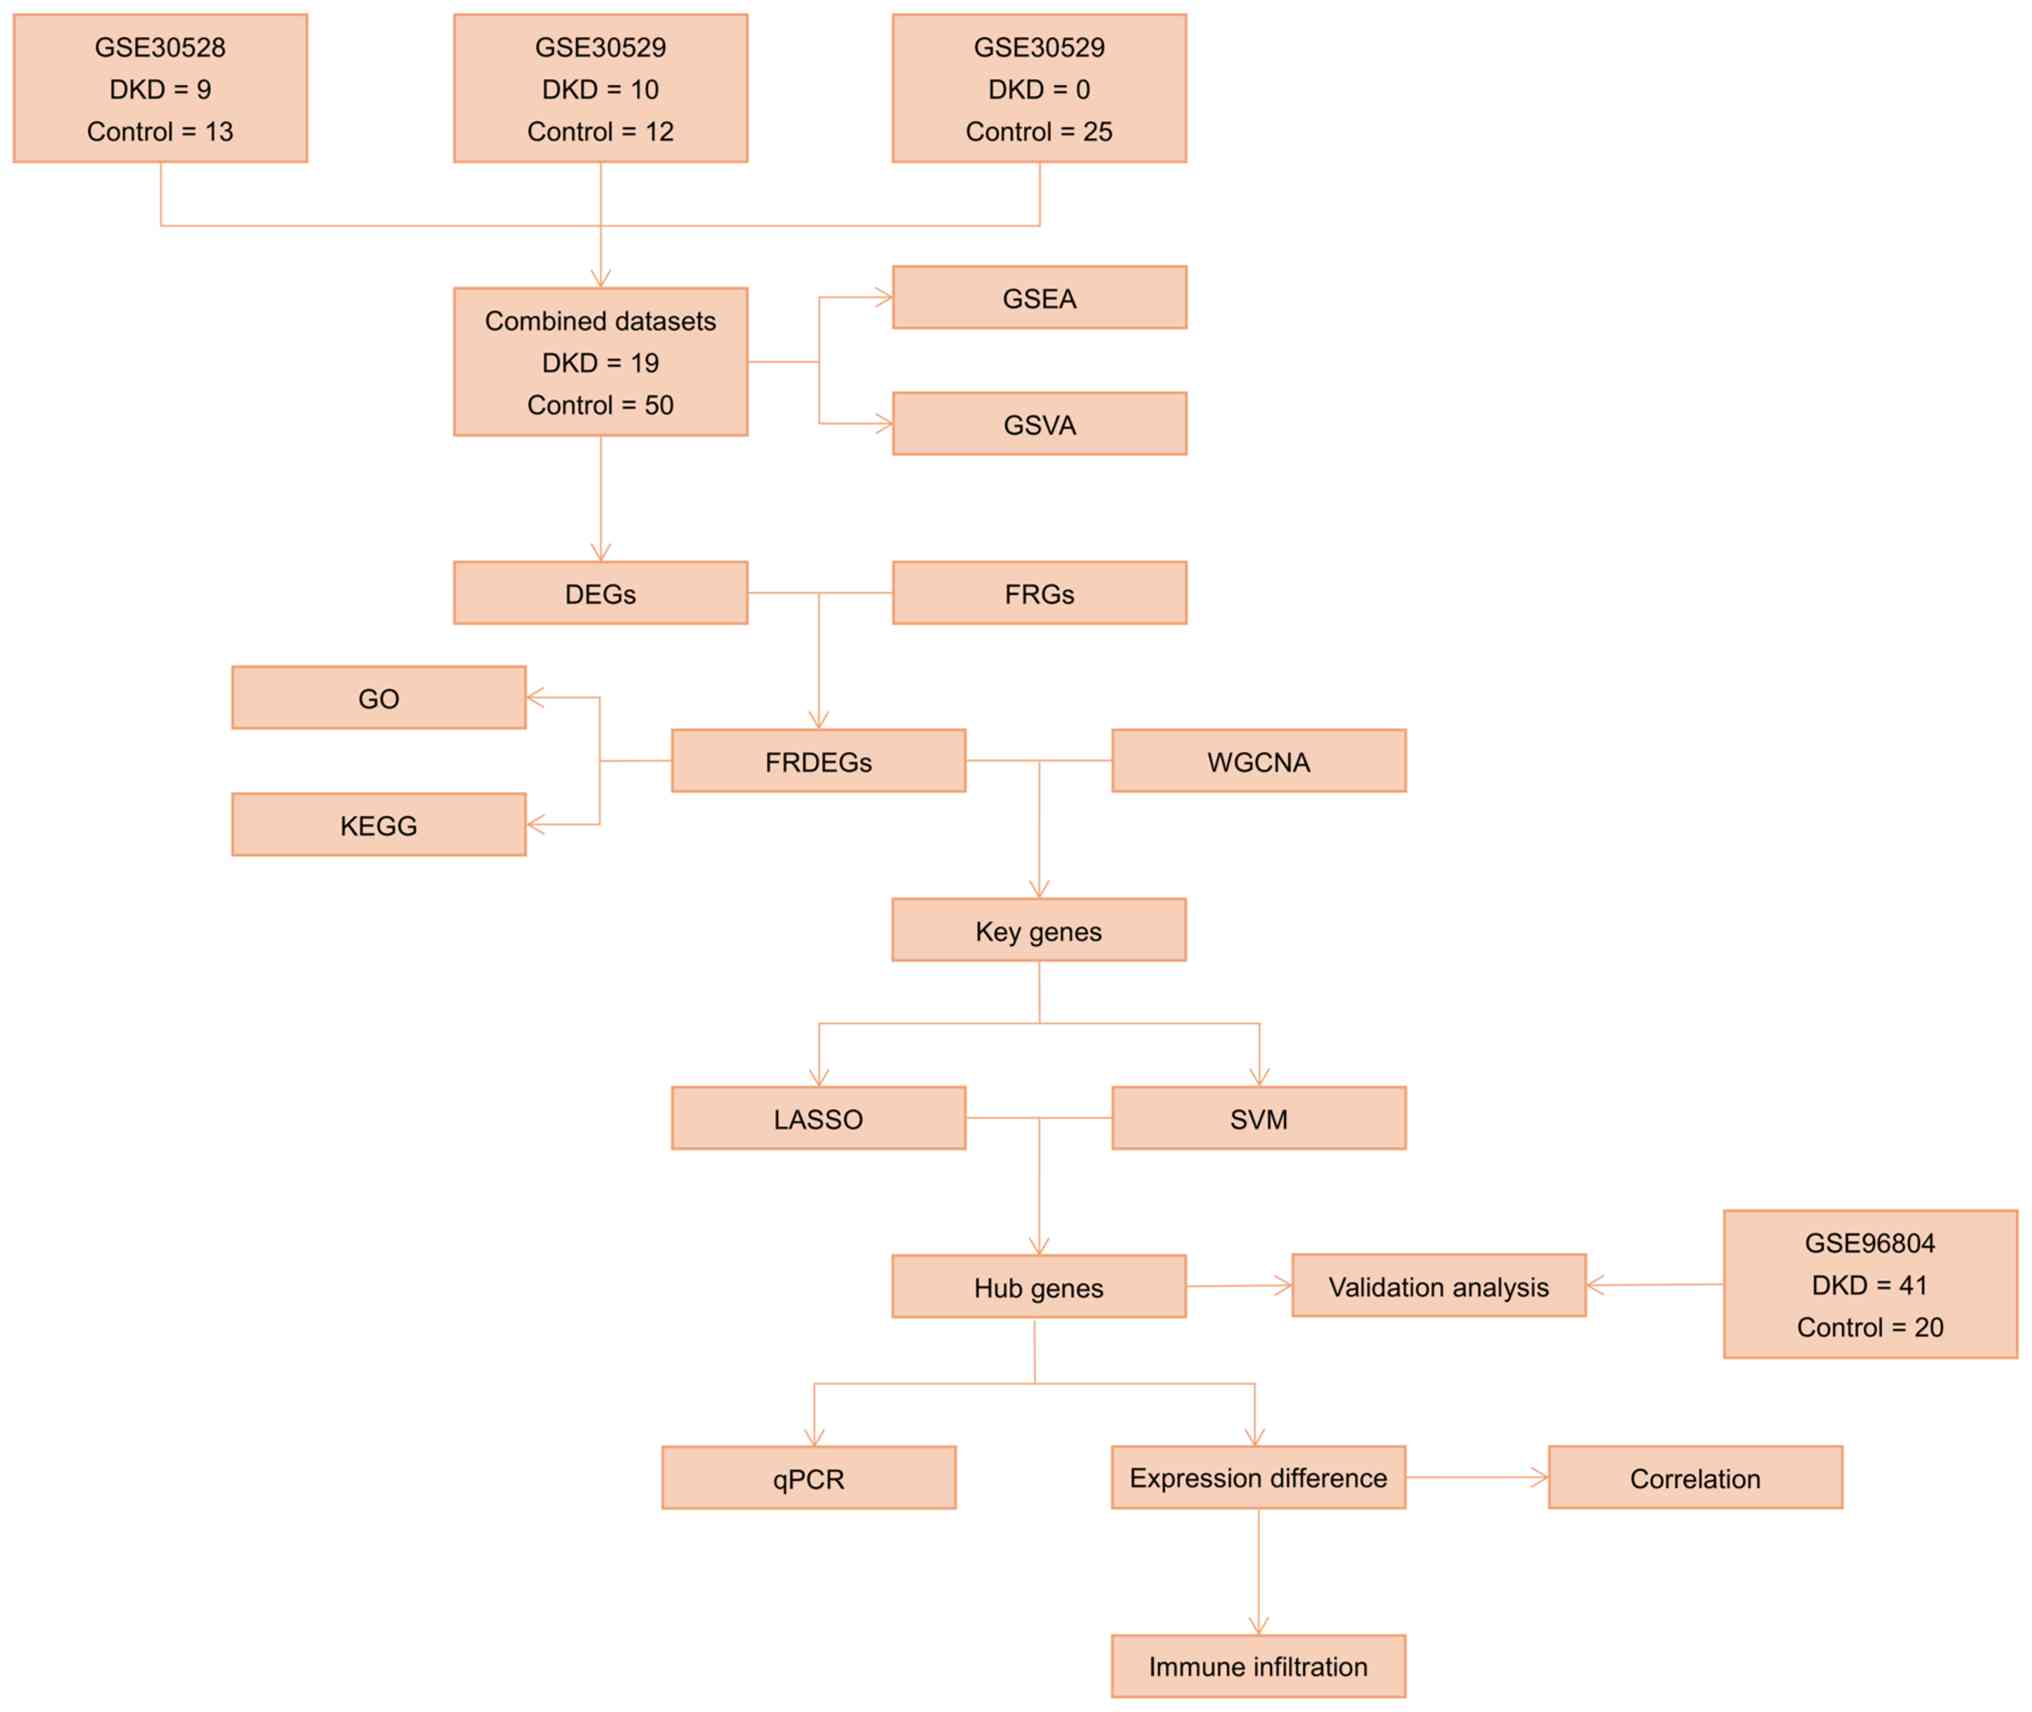 | Figure 1Flow chart for the comprehensive
analysis of FRDEGs. DKD, diabetic kidney disease; DEGs,
differentially expressed genes; FRGs, ferroptosis-related genes;
GSEA, gene set enrichment analysis; GSVA, gene set variation
analysis; GO, Gene Ontology; KEGG, Kyoto Encyclopedia of Genes and
Genomes; FRDEGs, ferroptosis-related DEGs; WGCNA, weighted
correlation network analysis; LASSO, least absolute shrinkage and
selection operator; SVM, support vector machine; qPCR, quantitative
polymerase chain reaction. |
Ferroptosis-related differentially
expressed genes (FRDEGs) screening
The R package limma (17) was utilized to analyze the gene
expression differences between the DKD and control samples. A
threshold of |logFC|>0.0 and adj. P<0.05 was established to
identify DEGs, with the intent of maximizing the capture of FRGs
exhibiting statistically significant changes in DKD. This initial
screening strategy was subsequently complemented by multi-step
stringent filtering to ensure the robustness of the final
diagnostic biomarkers. Specifically, genes with logFC >0.0 and
adj. P<0.05 were considered upregulated, while genes with logFC
<0.0 and adj. P<0.05 were deemed downregulated. Subsequently,
the DEGs were intersected with FRGs to obtain FRDEGs. The R package
ggplot2 demonstrated the results of the differential analysis for
volcano mapping.
Gene set enrichment and variation
analysis
To determine the effect of expression levels of all
genes in the combined GEO datasets on DKD, gene set enrichment
analysis (GSEA) (20) and gene set
variation analysis (GSVA) (21)
were performed to explore the differences in pathways and
biological processes of the samples in the combined GEO datasets.
The c2.all.v7.5.1.symbols.gmt gene set for GSEA and GSVA was
obtained from the Molecular Signatures Database (MSigDB) database
(22). The screening criteria for
GSEA were adj. P<0.05 and FDR value (q-value) <0.25, and the
screening criteria for GSVA were |logFC|>0.50 and P<0.05.
Gene ontology (GO) and kyoto
encyclopedia of genes and genomes (KEGG) enrichment analysis
GO analysis (23)
is essential for exploring biological function, including
biological process (BP), cellular component (CC) and molecular
function (MF). The KEGG (24) is a
widely used database storing information about genomes, biological
pathways diseases and drugs and is often used to explore potential
pathways. GO and KEGG analysis of FRDEGs were performed using the R
package clusterProfiler (25),
with screening criteria of adj. P<0.05 and FDR value (q-value)
<0.25 considered statistically significant, and adj.p correction
by Benjamini-Hochberg.
Weighted gene co-expression network
analysis (WGCNA)
In order to screen the co-expression modules of the
combined GEO datasets and analyze the core genes in the network,
WGCNA was performed on the genes in the top 25% of the variance of
all samples in the combined GEO datasets using the R package WGCNA
package (26). During the process,
the correlation of both DKD and control groups with different
modules was measured, and the genes in each module were recorded,
where the genes in each module were considered module signature
genes. Finally, the modules with |r value| >0.30 were screened,
and all the genes in the modules were intersected with FRDEGs
respectively. All the intersected genes obtained from the different
modules were the key genes.
Construction and verification of the
DKD diagnostic model
In order to obtain the DKD diagnostic model of
combined GEO datasets, the key genes were screened with P<0.05.
Subsequently, a logistic regression model was constructed, and the
molecular expression of the key genes included in this model was
illustrated using a Forest Plot. Furthermore, Least Absolute
Shrinkage and Selection Operator (LASSO) regression analysis was
performed on the selected key genes included in the logistic
regression model using the R package glmnet (27), with the parameter set.seed ‘500’.
The outcomes of the LASSO regression analysis were visually
presented through diagnostic model plots and variable trajectory
plots. In addition, the Support Vector Machine (SVM) model was
constructed based on key genes by the SVM (28) algorithm and the key genes were
screened based on the number of genes with the highest accuracy and
lowest error rate. The key genes in the LASSO regression model and
those in the SVM model were taken as intersections to get
ferroptosis-related hub genes. R package rms drew a nomogram based
on the results of LASSO regression analysis to show the
interrelationships of ferroptosis-related hub genes.
To validate the accuracy and resolution of the DKD
diagnostic model, the R package ggDCA was used to plot decision
curve analysis (DCA) (29) based
on the ferroptosis-related hub genes in the combined GEO datasets.
Meanwhile, the R package pROC was used to plot the combined ROC
curves in the combined GEO datasets and calculate the area under
the curve (AUC) values to assess the diagnostic effect of LASSO
risk score expression on the occurrence of DKD. The AUC of the ROC
curves generally ranges between 0.5 and 1. The closer the AUC is to
1, the better the diagnostic effect. The AUC has a low accuracy at
0.5 to 0.7, a certain accuracy at 0.7 to 0.9, and a high accuracy
at AUC above 0.9. The formula for calculating the LASSO risk score
is as follows:
The dataset GSE96804 verified the accuracy and
resolution of this DKD diagnostic model.
Identification and validation of the
optimal Hub FRDEGs
Group comparisons were plotted based on the
expression of ferroptosis-related hub genes in the DKD and control
groups in the training and validation sets. R package pROC was used
to plot the ROC curves of ferroptosis-related hub genes in the
training and validation sets and calculate the AUC to assess the
diagnostic effect of the expression of ferroptosis-related hub
genes on the occurrence of DKD.
Immune cell infiltration analysis
CIBERSORT (30) is
based on the principle of linear support vector regression for the
back-convolution of transcriptome expression matrices to estimate
the composition and abundance of immune cells in a mixture of
cells. The CIBERSORT algorithm was used to combine the LM22 feature
gene matrix and filter the output of data with immune cell
enrichment scores greater than zero to finally obtain the specific
results of the immune cell infiltration matrix. Finally, the R
package ggplot2 was used to draw group comparison plots to show the
expression differences of LM22 immune cells in the DKD and control
groups in the combined GEO datasets. The R package pheatmap was
used to draw correlation heatmaps to show the LM22 immune cells and
the correlation analysis results between ferroptosis-related hub
genes and LM22 immune cells.
Reverse transcription-quantitative PCR
(RT-qPCR)
In the present study, a total of 9 male db/db mice
(BKS.Cg-Leprdb/Leprdb) and 3 male db/m littermates
(BKS.Cg-Leprdb/+) were obtained from Jiangsu Ailingfei
Biotechnology Co., Ltd. db/m mice were used in the control group
and db/db mice in the DKD group as the DKD model. All mice were 8
weeks of age at the start of the study, with body weights of 40±2.5
g for db/db mice and 25±2 g for db/m mice. The animals were housed
in a specific pathogen-free facility under controlled conditions:
Temperature, 23±2˚C; humidity, 50-60%; and a 12/12 h light/dark
cycle, with free access to standard chow and water. Mice were
acclimated for 1 week prior to the experiment. Both rosiglitazone
(RZ) and hyperoside (HPS) groups used db/db mice as DKD models, and
the two groups were gavaged respectively with RZ (cat. no. 210310;
Chengdu Hengrui Pharmaceutical Co., Ltd.) at a dose of 5 mg/kg/d
and HPS (cat. no. B20631; Shanghai Yuanye Biotechnology Co., Ltd.)
at a quantity of 20 mg/kg/d. The intervention period was 12 weeks.
Total RNA was extracted from the kidney of mice using the Animal
Total RNA Isolation Kit (cat. no. RE-03011; Chengdu Fuji
Biotechnology Co., Ltd.) and quantified using a spectrophotometer
(cat. no. N50Touch; Implen GmbH). The thermocycling conditions for
qPCR were as follows: Initial denaturation at 95˚C for 2 min,
followed by 40 cycles of denaturation at 95˚C for 10 sec and
annealing/extension at 60˚C for 30 sec. A melting curve analysis
was performed from 65 to 95˚C with a ramp rate of 0.5˚C/5 sec.
Relative quantification was performed using the comparative
quantification cycle (Cq) (2-ΔΔCq) method (31). The iScript™ cDNA
Synthesis Kit (cat. no. 1708891; Bio-Rad Laboratories, Inc.) was
used strictly according to the manufacturer's instructions. The
standard reverse transcription temperature protocol includes primer
annealing at 65˚C for 5 min followed by immediate ice incubation,
cDNA synthesis at 42-55˚C for 20-60 min [42-45˚C for oligo(dT),
50-55˚C for thermostable reverse transcriptases and GC-rich RNA],
and final enzyme inactivation at 70-85˚C for 5-15 min.
Subsequently, qPCR was performed using the Sso Advanced™
Universal SYBR® Green Supermix kit (cat. no. 1725274;
Bio-Rad Laboratories, Inc.) to detect the expression of
lactotransferrin (LTF). The experiment was repeated at least three
times with three sub-wells for each experiment. The primer
sequences utilized in the investigation are presented in Table SIII. Anesthesia was performed when
conducting animal sampling and surgical manipulation in the present
study. Pentobarbital sodium as the anesthetic agent at a dosage of
50 mg/kg body weight, administered via intraperitoneal injection.
All experimental mice were humanely euthanized by cervical
dislocation after isoflurane inhalation anesthesia. Animal
experiments were approved by the Animal Ethics Committee in
Affiliated Hospital of Nanjing University of Traditional Chinese
Medicine (approval no. 2023DW-039-01; Nanjing, China).
Statistical analysis
Data processing and analysis were based on R
software (version 4.2.0) and GraphPad Prism (version 9.5.0;
Dotmatics). The continuous variables were presented as the mean ±
standard deviation. Comparisons between the two groups were made
using the Wilcoxon rank sum test. If not specified, results were
calculated by Spearman's correlation analysis of the correlation
coefficients between the different molecules. P<0.05 was used as
a criterion for statistically significant difference.
Results
Identification of FRDEGs
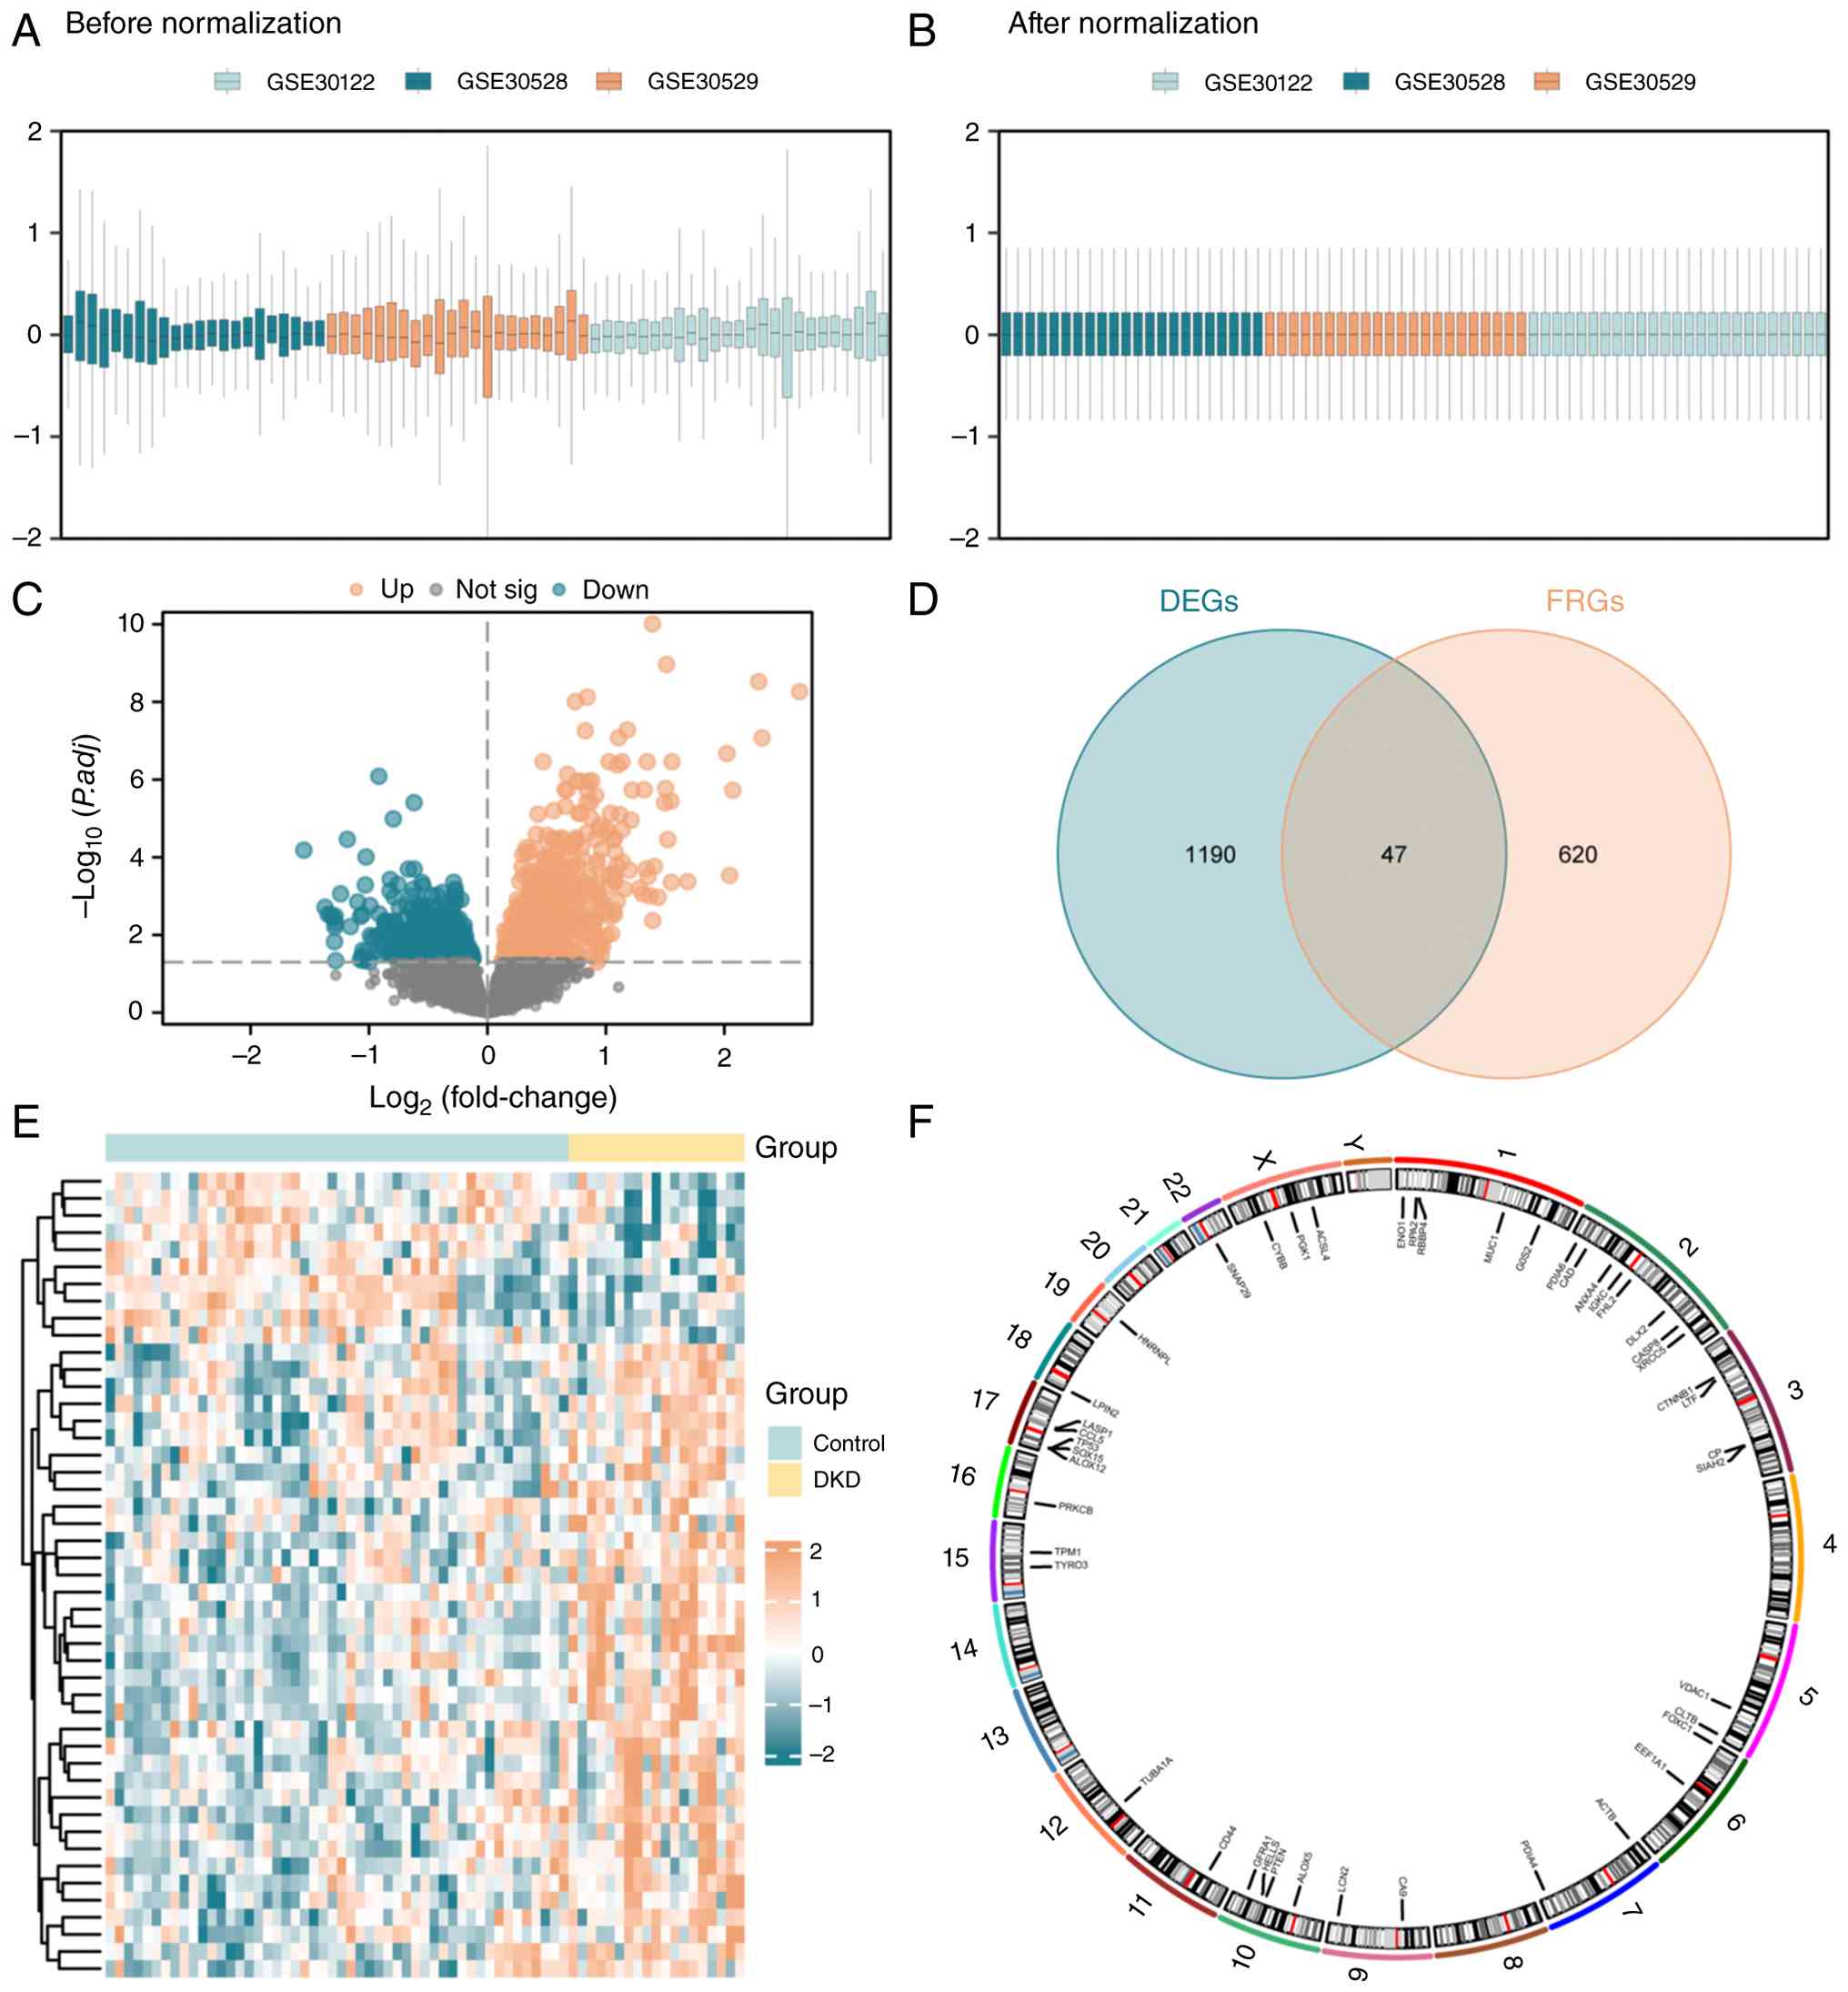
Firstly, the distribution box plots indicated the
successful elimination of the batch effect in the DKD dataset
following the batch removal procedure (Fig. 2A and B). Among the combined GEO datasets, 1,237
DEGs were identified, with 731 genes exhibiting upregulation and
506 genes displaying down-regulation (Fig. 2C). By intersecting the 1,237 DEGs
with the 667 FRGs, a subset of 47 FRDEGs was obtained, which were
LTF, CD44, CYBB, chemokine ligand 5 (CCL5), IGKC, RBBP4, ENO1,
ALOX5, PRKCB, LCN2, TPM1, TUBA1A, PDIA4, CASP8, XRCC5, LASP1, ACTB,
RPA2, HELLS, PTEN, SIAH2, ACSL4, GFRA1, KRT19, ANXA4, HNRNPL,
EEF1A1, MUC1, CTNNB1, FHL2, PGK1, LPIN2, TP53, PDIA6, CP, CAD,
VDAC1, SNAP29, SOX15, NFE2L1, G0S2, ALOX12, DLX2, CA9, CLTB,
Forkhead box C1 (FOXC1) and TYRO3 (Fig. 2D). Then, based on the intersection
results, the results of the expression differences of FRDEGs among
different sample subgroups in the combined GEO datasets were shown
in Fig. 2E.
GSEA and GSVA for the combined GEO
datasets
To avoid the one-sidedness caused by only using the
intersection gene enrichment, we also utilized GSEA on all the
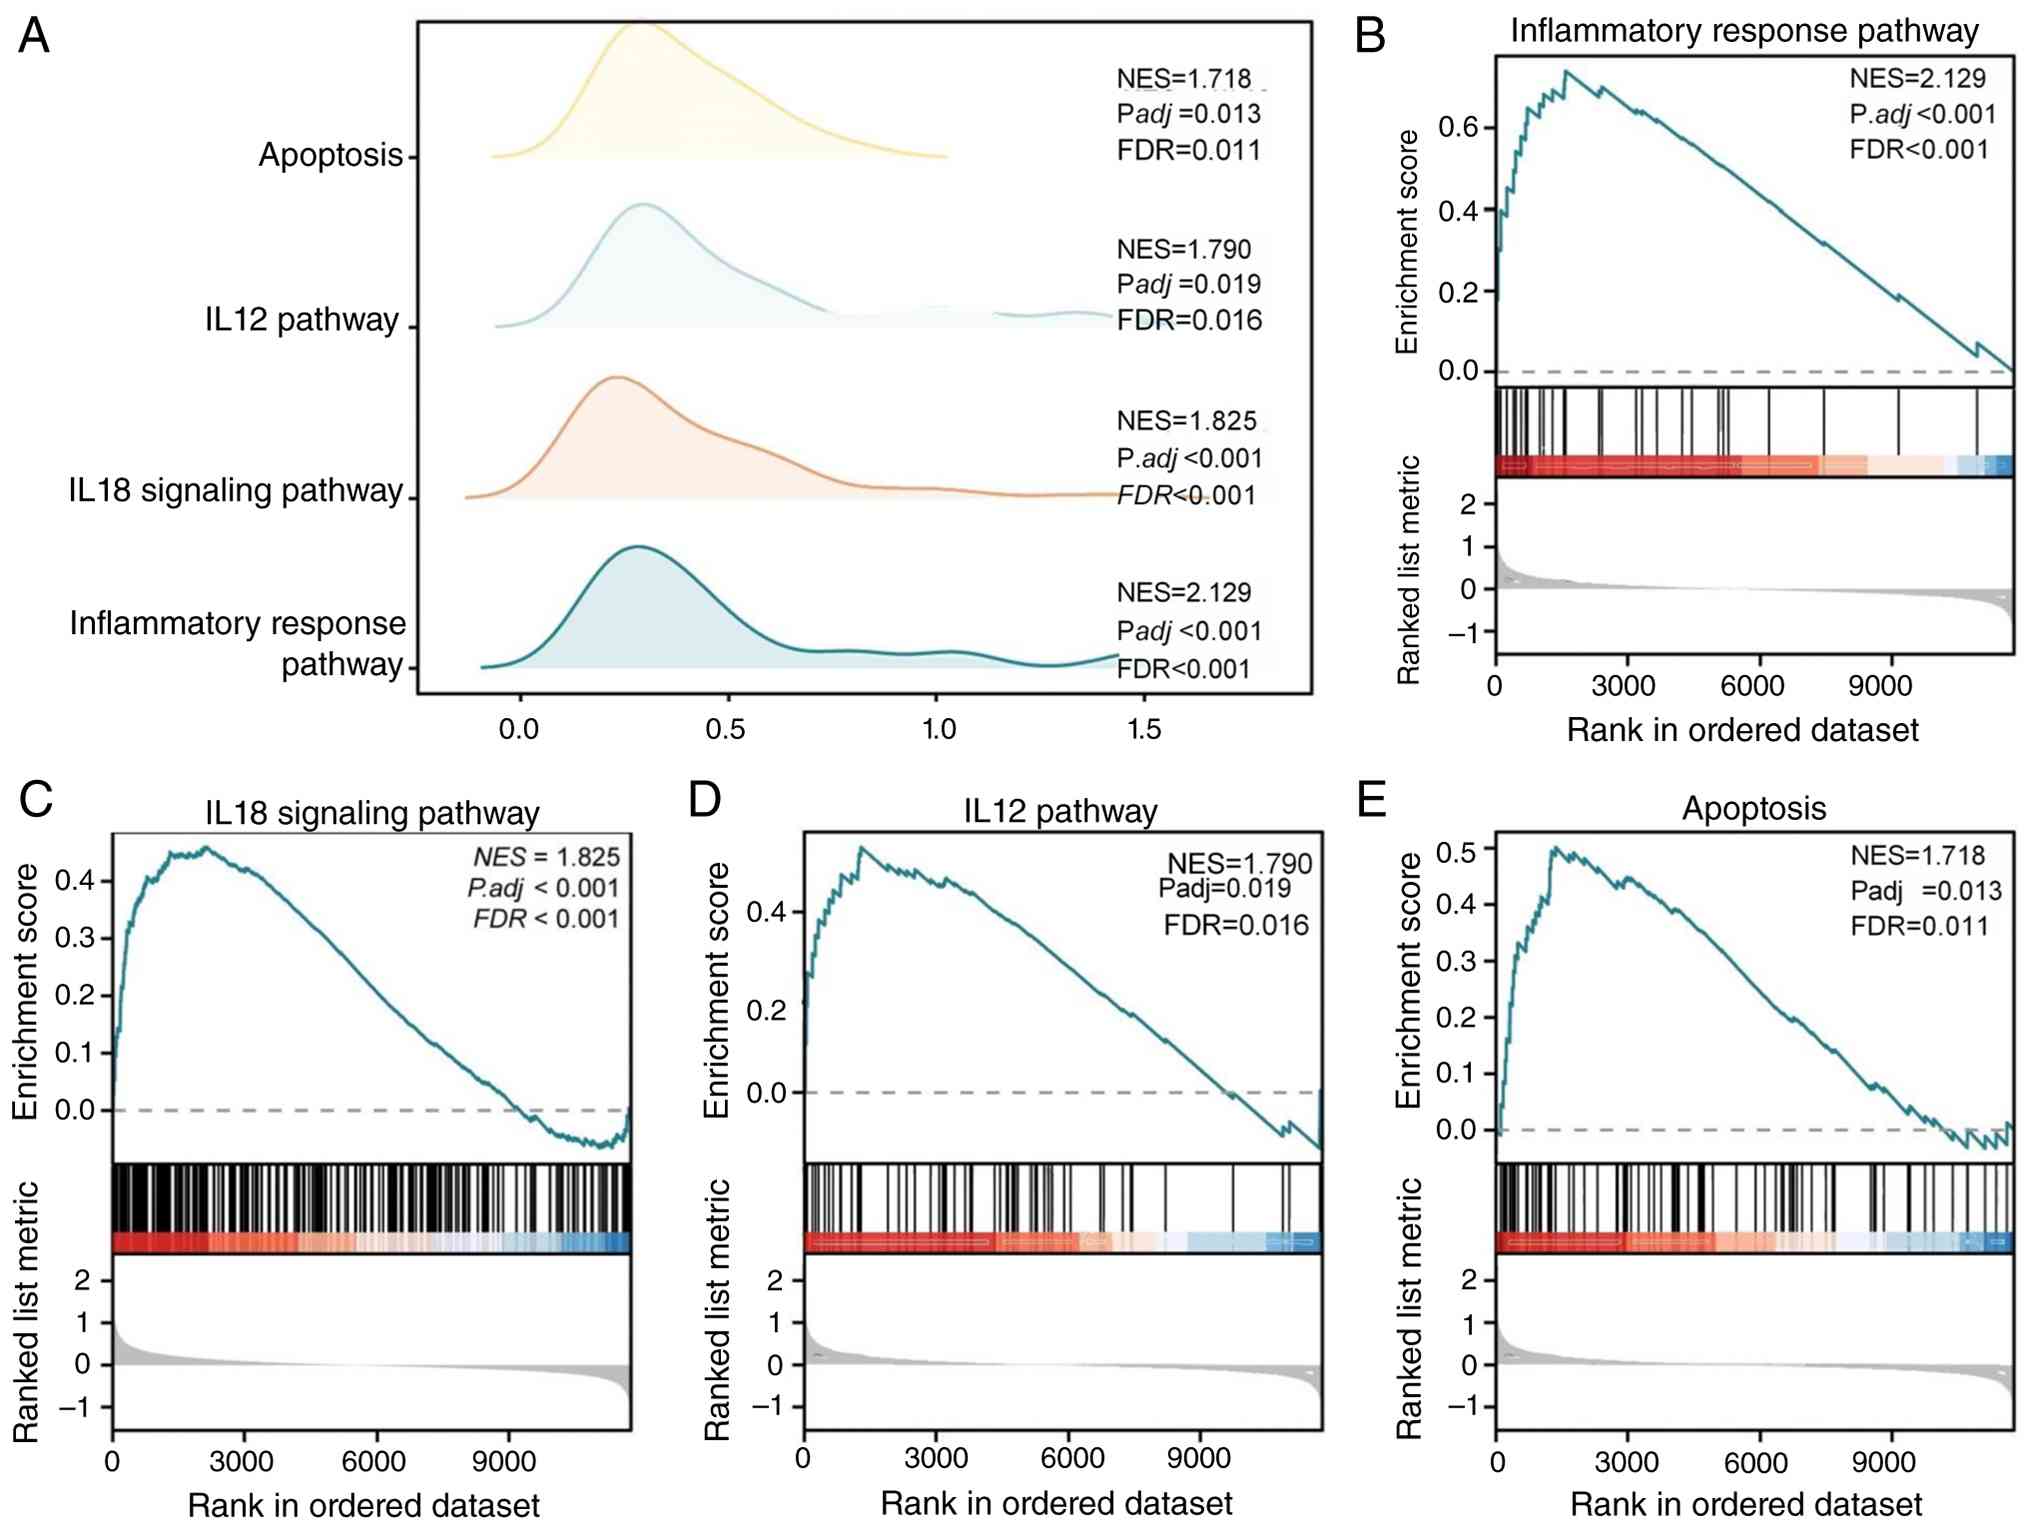
genes of the combined GEO datasets. The findings of the GSEA
indicated that most genes exerted a significant impact on the
inflammatory response pathway IL18 signaling pathway, IL-12 pathway
and apoptosis, among others (Fig.
3A-E). The specific outcomes are presented in Table SIV.
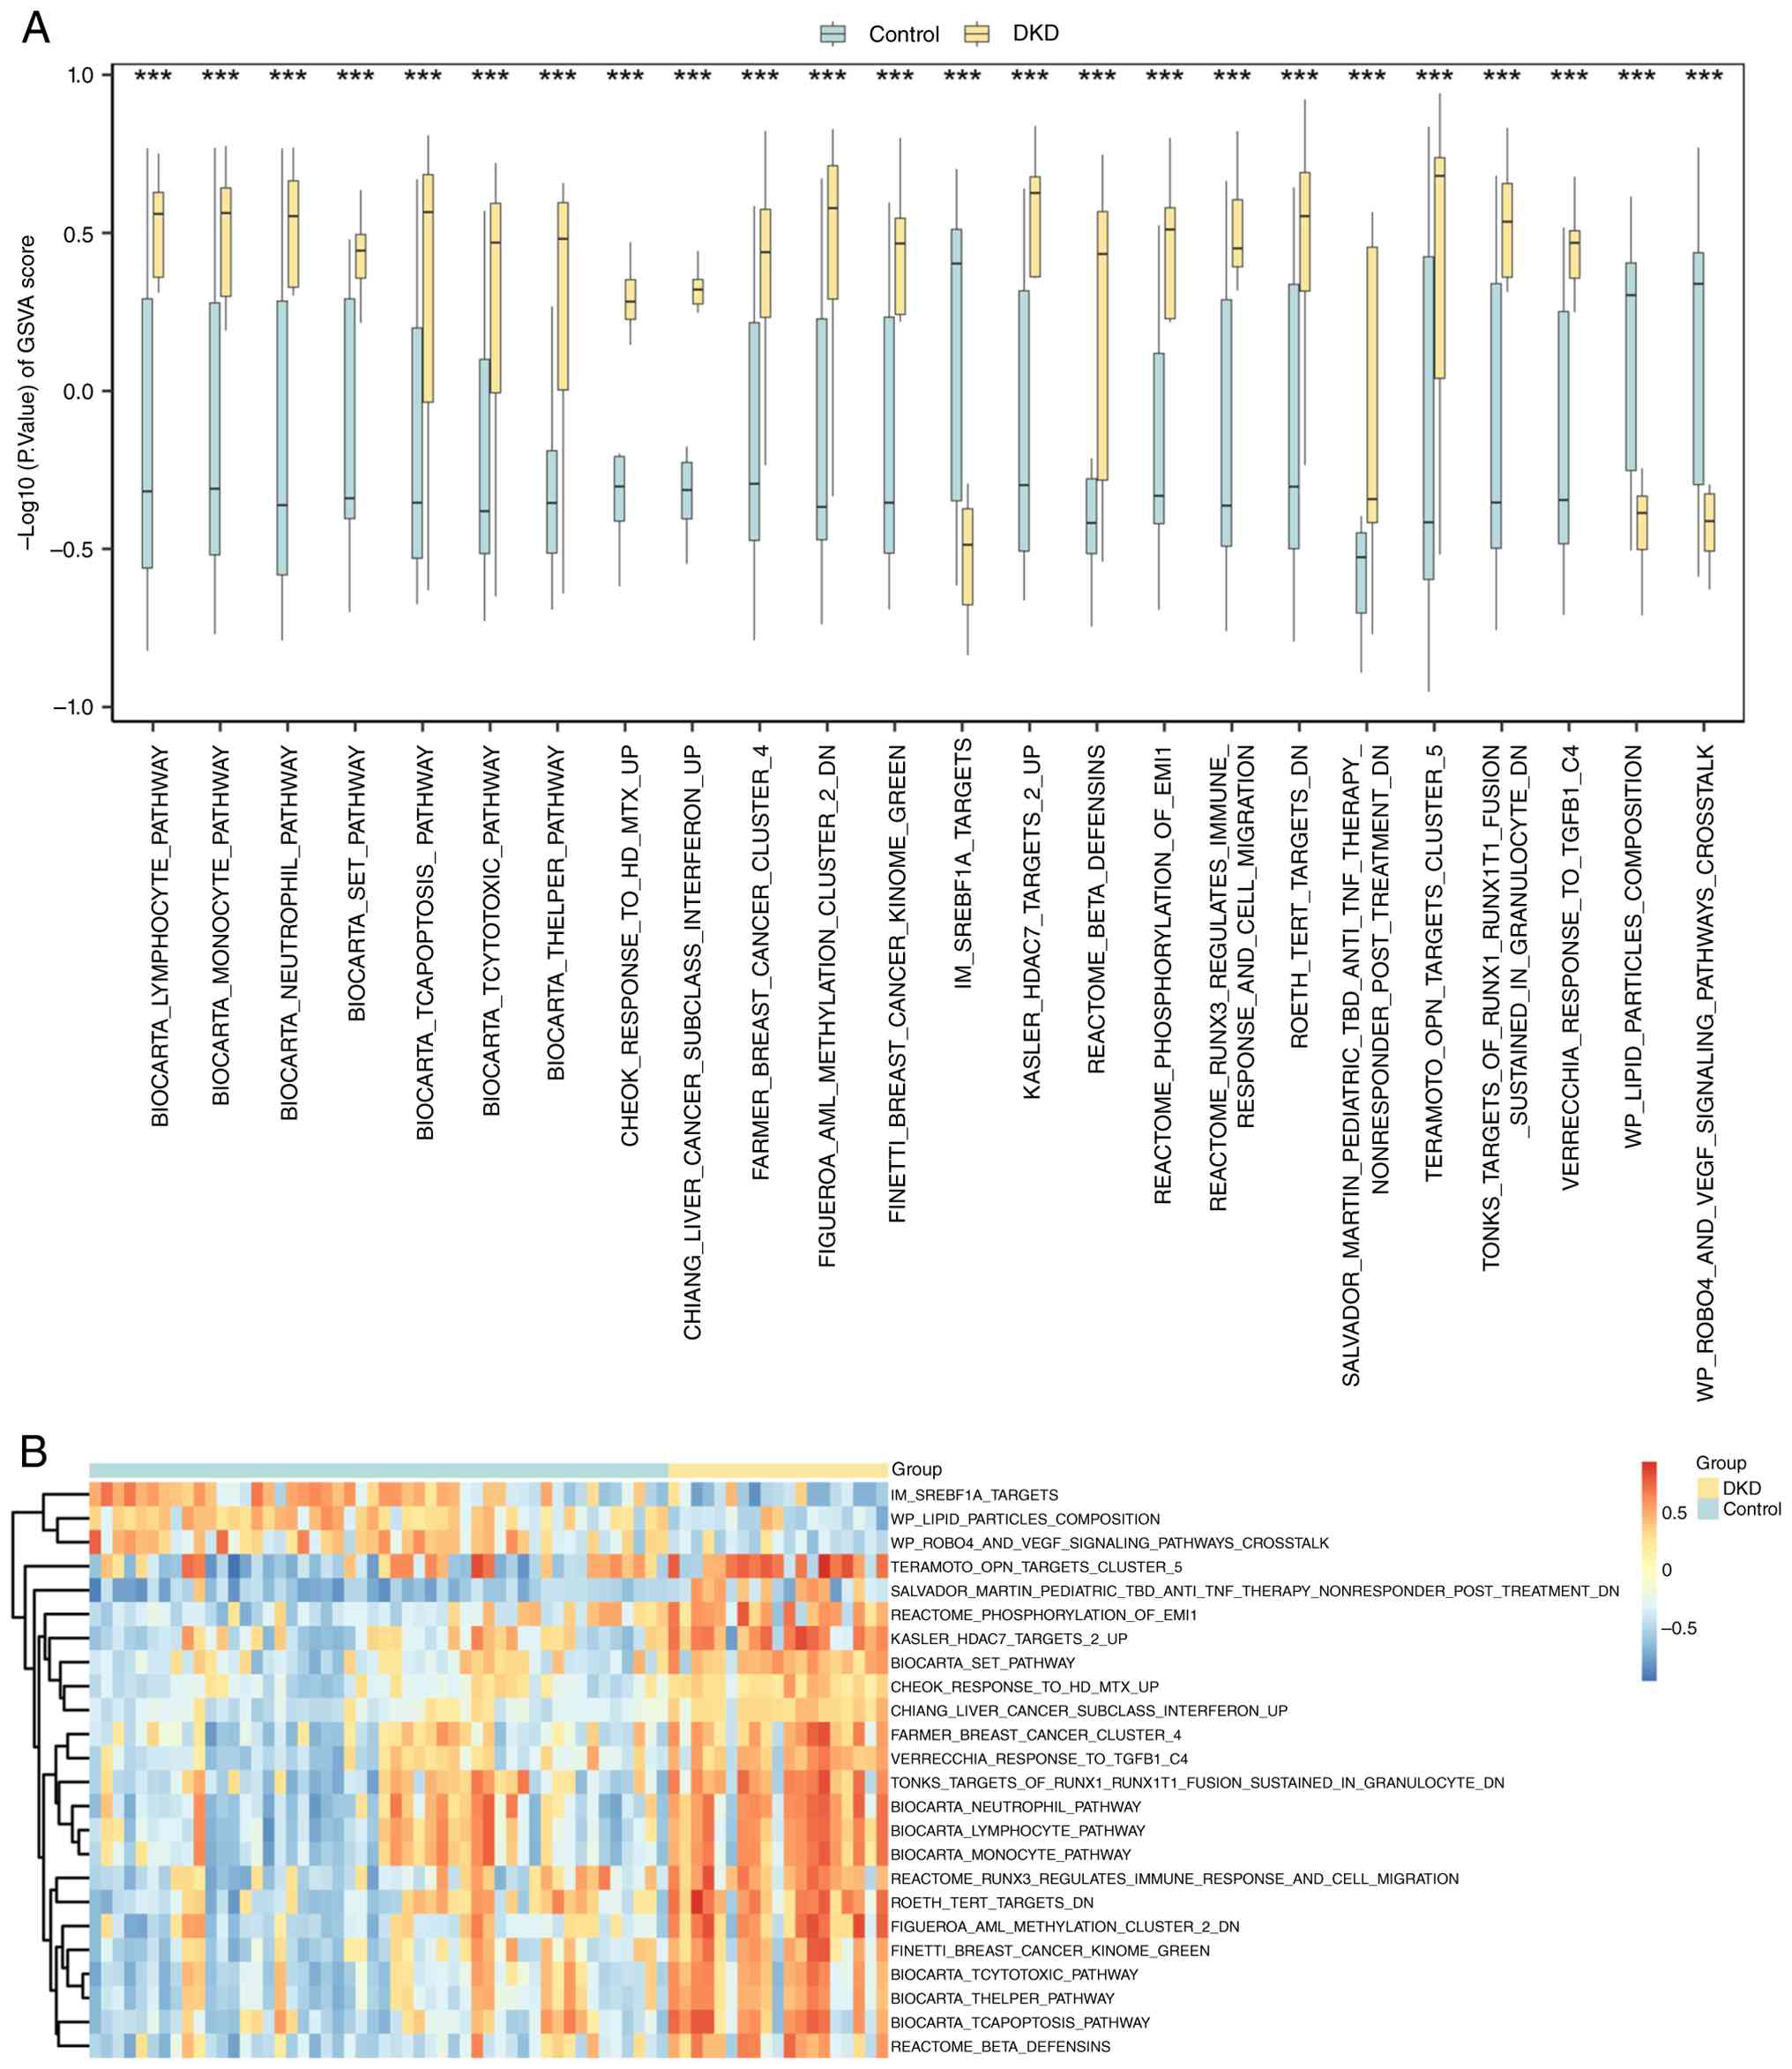
The GSVA results showed that a total of 24 pathways
exhibited statistical significance (P<0.05) in both the DKD and
control groups (Fig. 4A and
B). The DKD group exhibited a
notable enrichment in the regulation of pathways associated with
immunity, phosphorylation, apoptosis, methylation and
deacetylation, such as the T cell receptor signaling pathway,
monocyte signaling pathway, neutrophil signaling pathway, as well
as the regulation of runt-related transcription factors and histone
deacetylases. Conversely, pathways linked to lipid synthesis and
accumulation were found to be suppressed. The details can be found
in Table SV.
Enrichment analysis of FRDEGs
A total of 47 FRDEGs were performed for enrichment
analysis (Fig. 5A). In GO-BP
analysis (Fig. 5B), the FRDEGs
were mainly related to apoptosis regulation and cell proliferation.
In GO-CC analysis (Fig. 5C), cell
cortex, cell membrane and macromolecular compounds were
significantly enriched. The results of enrichment analysis in GO-MF
(Fig. 5D) indicated that these
FRDEGs were mainly related to protein, enzyme and transcription
factors. According to the results of the KEGG analysis, these
FRDEGs were mainly associated with ferroptosis, HIF-1 signaling
pathway, leukocyte trans-endothelial migration and Influenza A
(Fig. 5E).
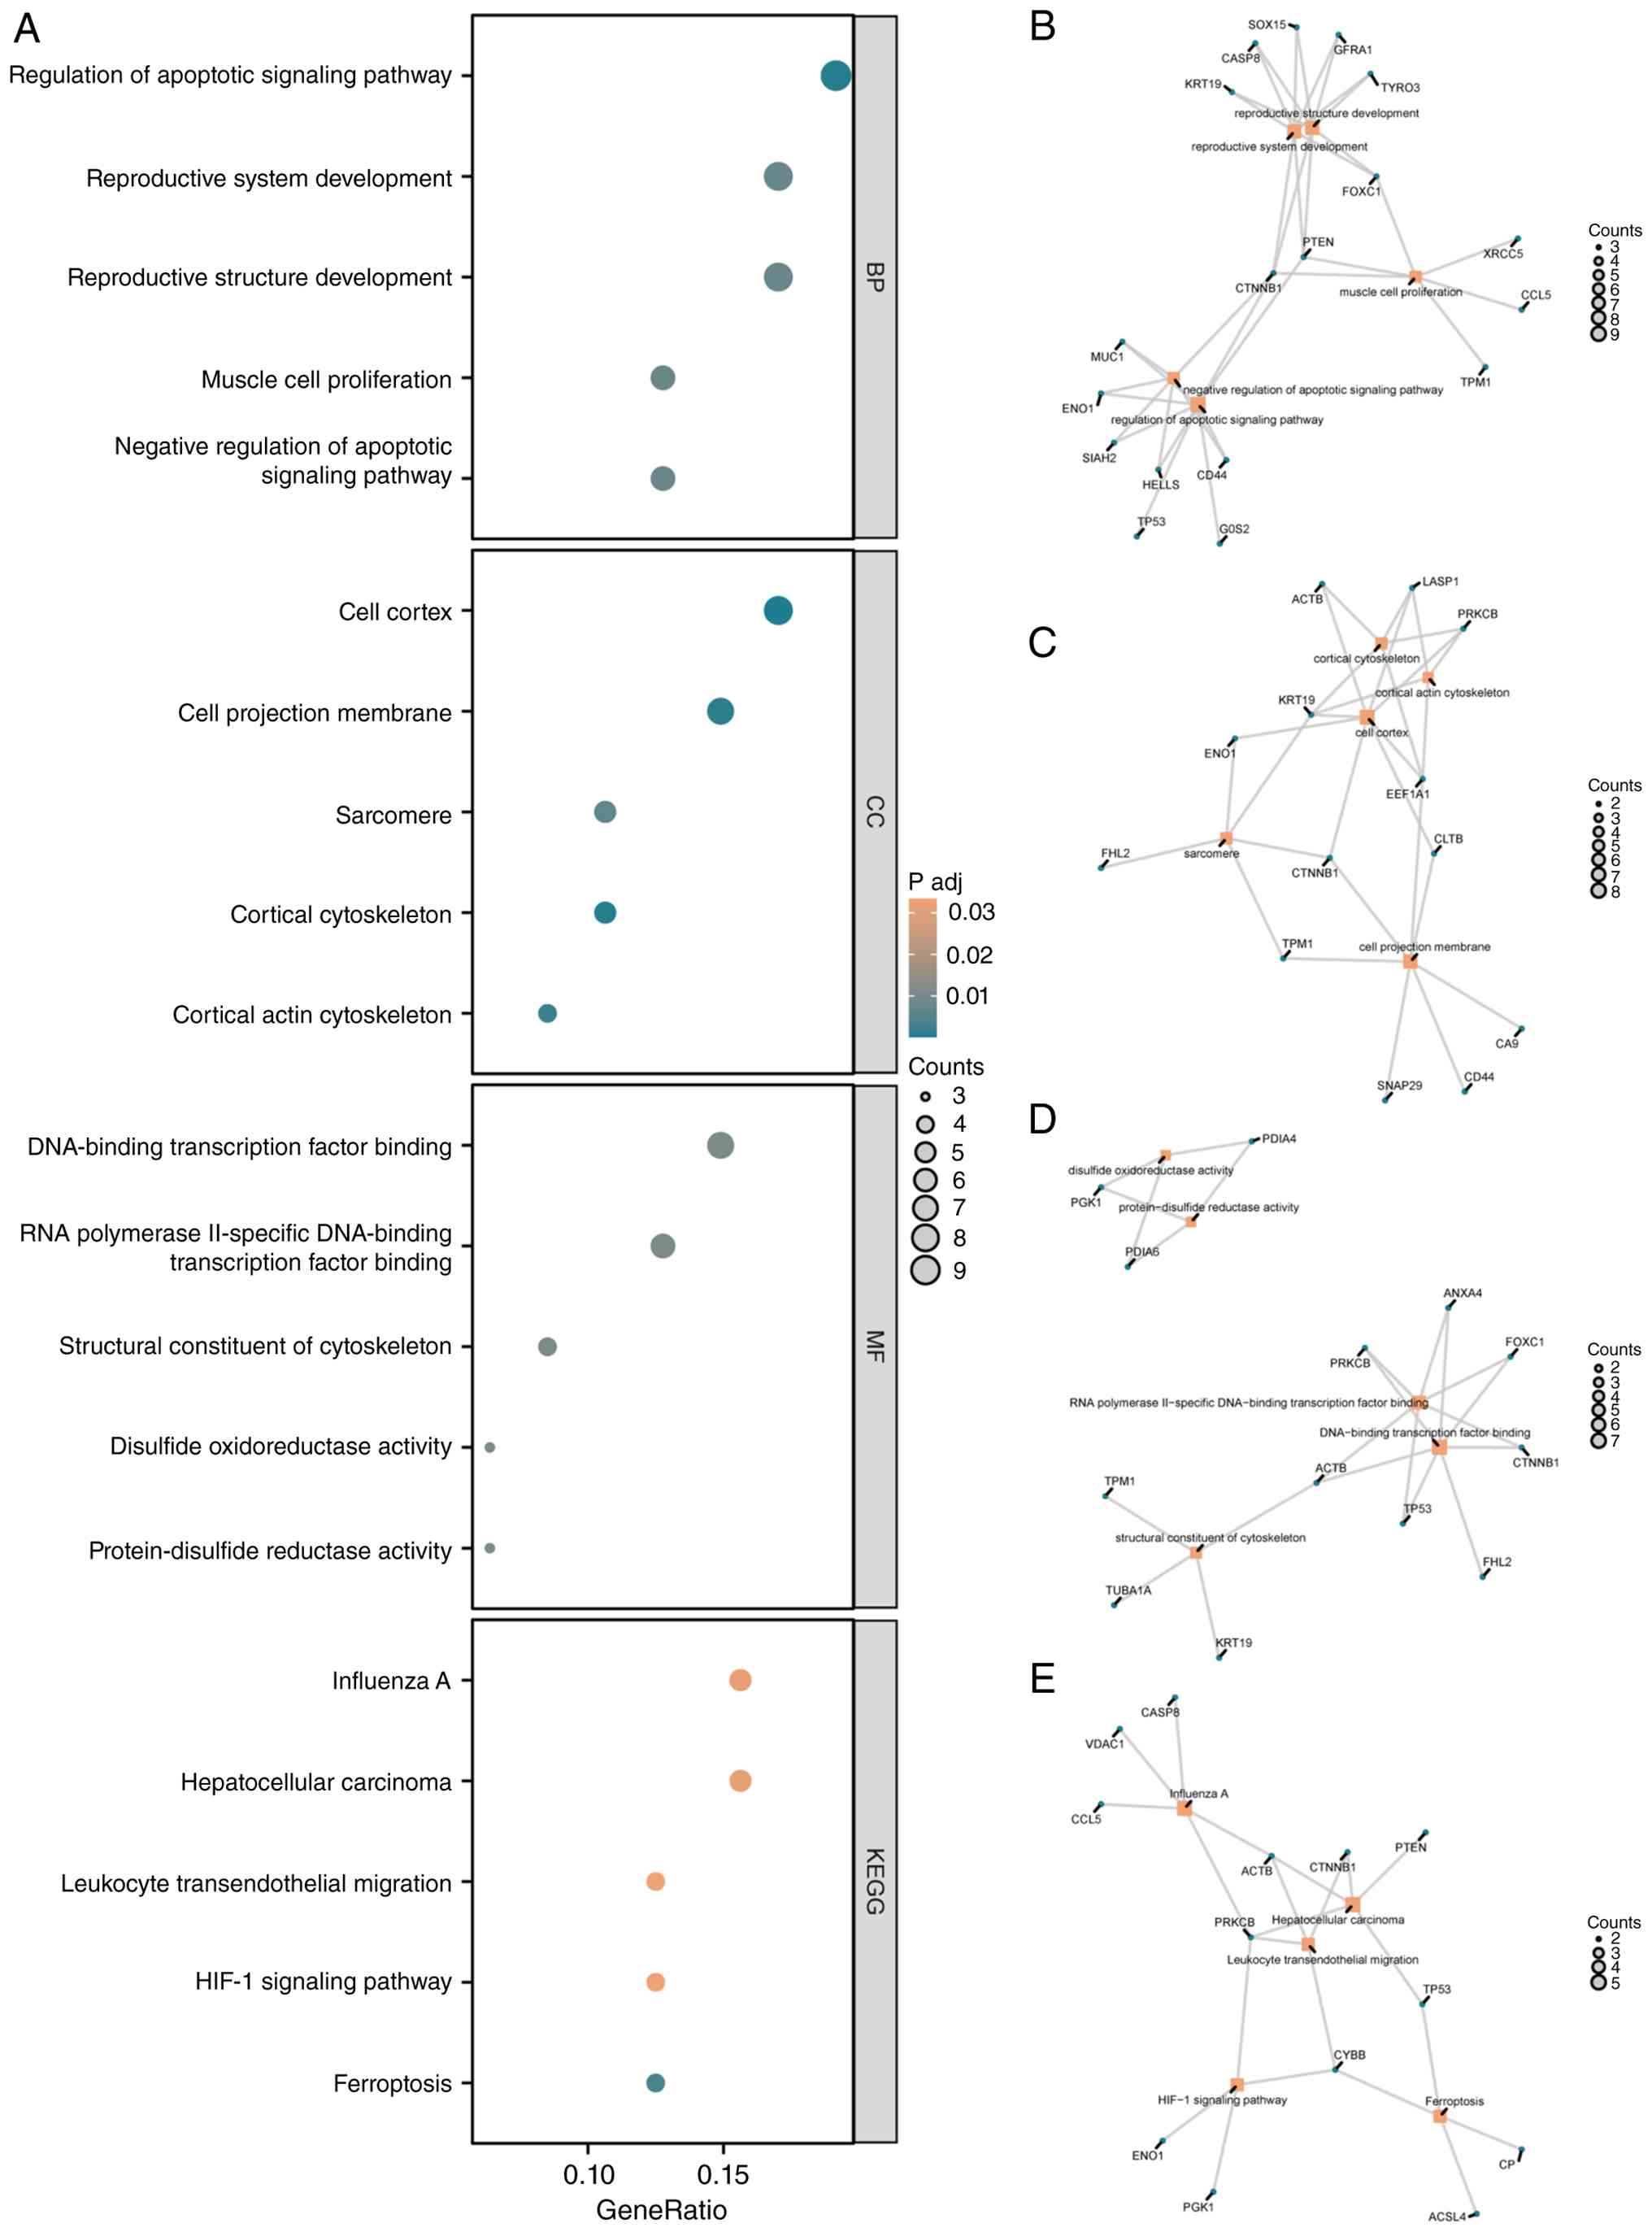 | Figure 5GO and KEGG enrichment analysis for
FRDEGs. (A) Bubble plots showing the results of GO and KEGG
enrichment analyses of FRDEGs, including BP, CC, MF and KEGG
pathway. Horizontal coordinates are GO terms and KEGG terms. BP,
CC, MF and KEGG. (B) BP enrichment analysis of FRDEGs. (C) CC
enrichment analysis of FRDEGs. (D) MF enrichment analysis of
FRDEGs. (E) KEGG pathway enrichment analysis of FRDEGs. Orange
nodes represent entries, dark blue nodes represent molecules, and
connecting lines represent the relationship between entries and
molecules. The screening criteria for GO and KEGG enrichment
analyses were adj. P<0.05 and FDR value (q-value) <0.25.
FRDEGs, ferroptosis-related differentially expressed genes; GO,
Gene Ontology; KEGG, Kyoto Encyclopedia of Genes and Genomes; BP,
Biological Process; CC, Cellular Component; MF, Molecular
Function. |
Construction of co-expression modules
and determination of key genes
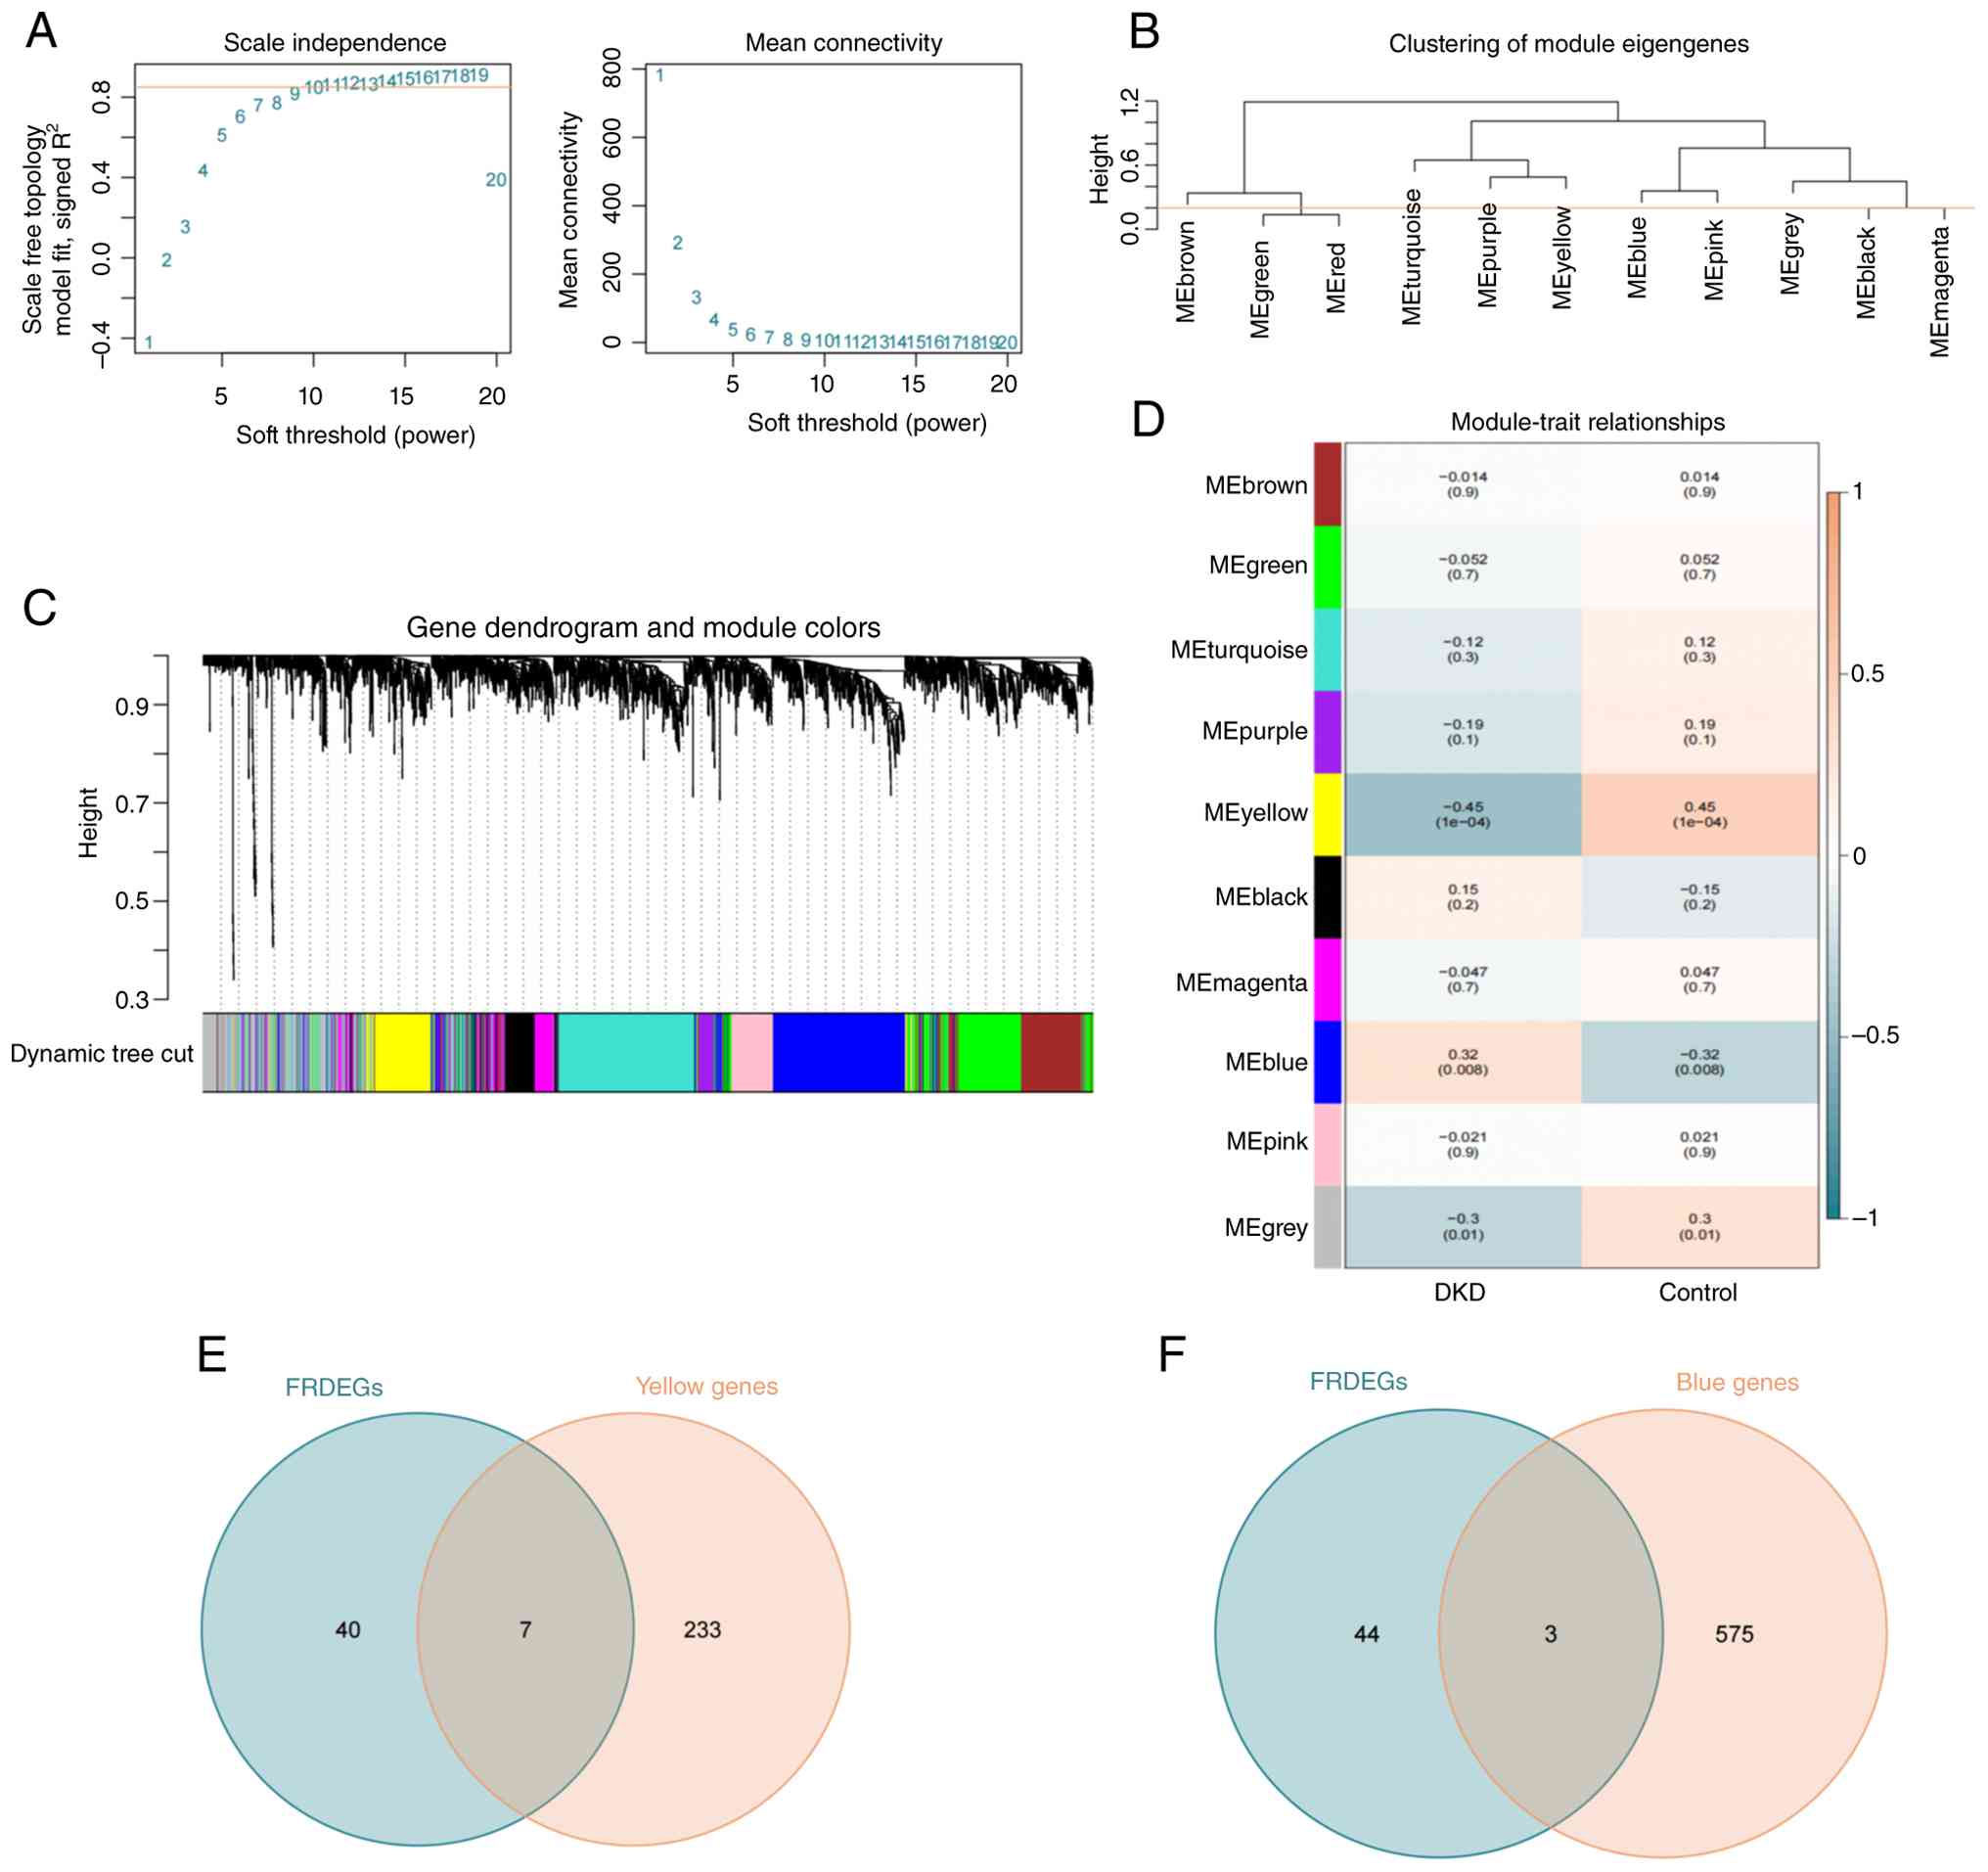
Firstly, the constructed network exhibited higher
conformity with the scale-free topology, as evidenced by the
computation and presentation of scale-free fitting indices
(Fig. 6A) across various soft
threshold values. The findings indicated that a scale-free fitting
index of 0.85 corresponds to the minimum soft threshold value of
11, which fulfilled the criteria for constructing an optimal
scale-free network. The co-expression network was constructed using
the optimal soft threshold, and genes with the top 25% variance are
clustered using a clustering tree (Fig. 6B) and labeled with the grouping
information. The results showed that genes in the top 25% of
variance were clustered into 10 modules when the screening
criterion was 0.2, and then the relationship between the genes and
the merged modules was visualized (Fig. 6C). The correlation between all
genes in the ten modules and the DKD group and control group in the
combined GEO datasets was determined based on the expression
patterns of the module genes (Fig.
6D). Genes within the MEyellow (|r value|=0.45) and MEblue (|r
value|=0.32) modules were screened using a criterion of |r
value|>0.30, and their intersections with the 47 FRDEGs were
plotted using Venn diagrams (Fig.
6E and F). Ultimately, 10 key
genes were identified: FOXC1, G0S2, TYRO3, CCL5, FHL2, IGKC, LCN2,
LTF, MUC1 and PRKCB.
Construction and validation of the
prognostic DKD model of FRGs
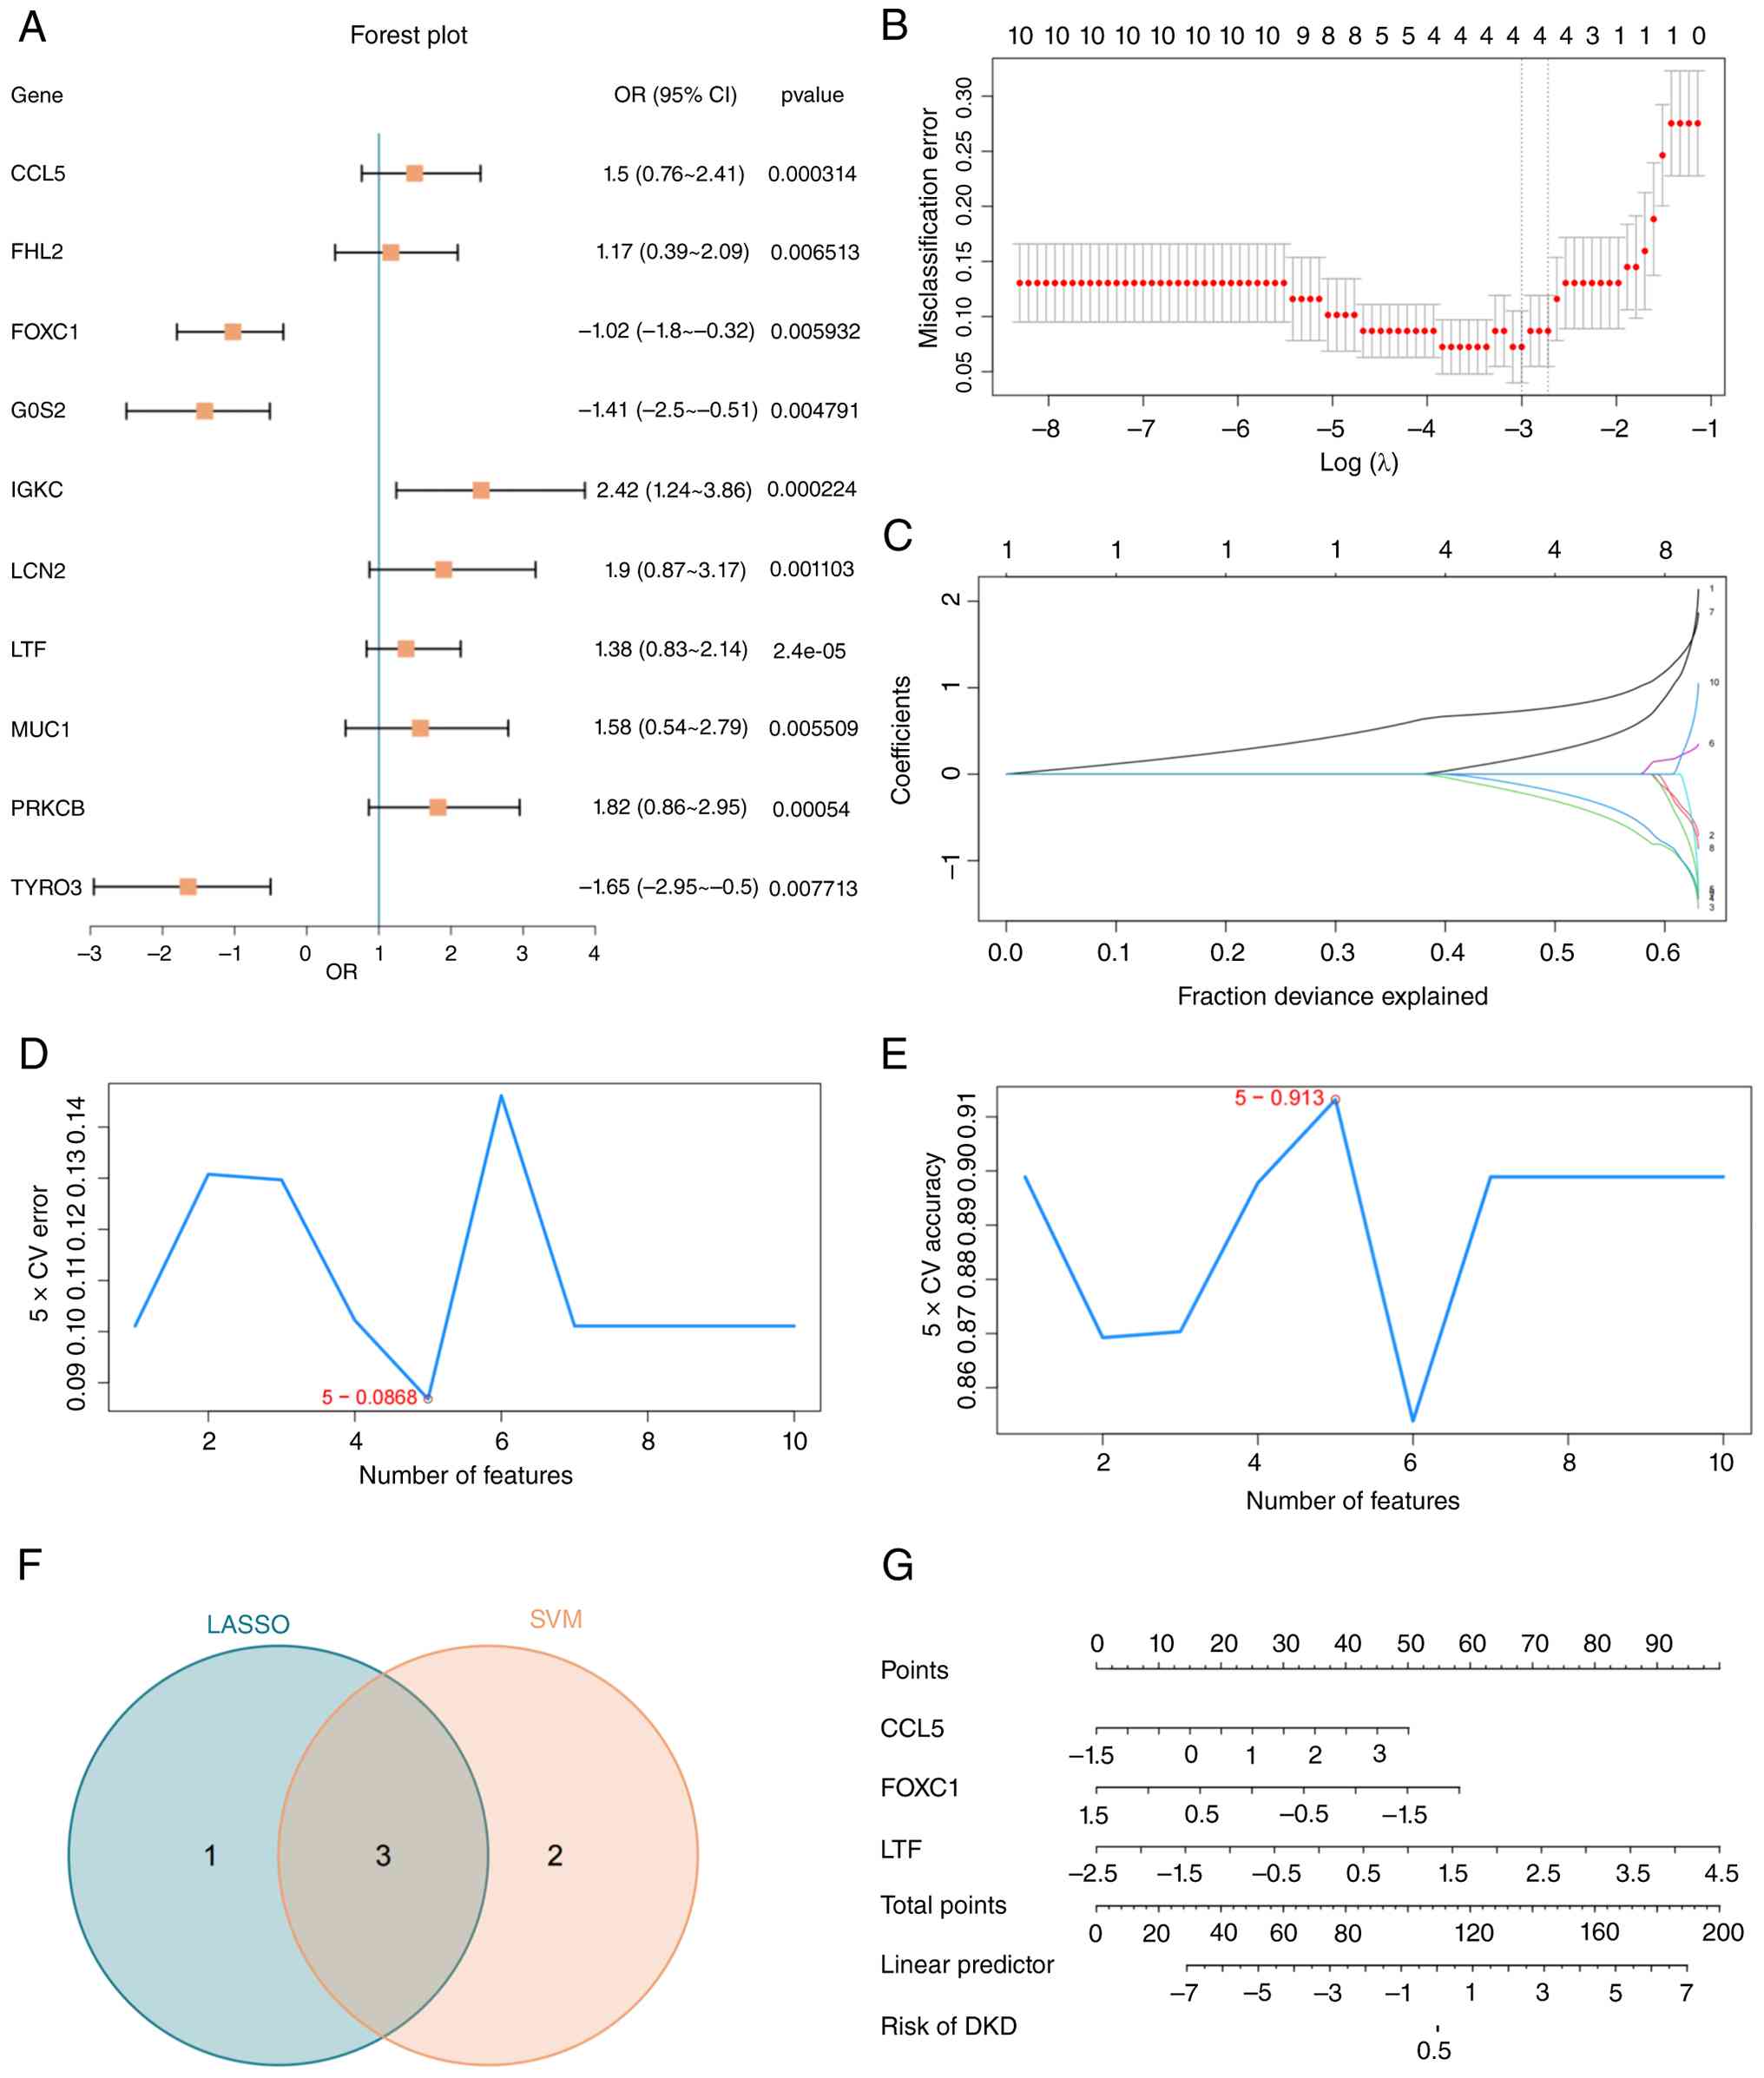
Logistic regression was performed based on the ten
key genes, and a logistic regression model was constructed and
visualized by Forest Plot (Fig.
7A). The results showed that all 10 key genes included in the
logistic regression model were statistically significant
(P<0.05). Then, the LASSO regression model (Fig. 7B and C) was constructed based on 10 key genes,
and the results contained four key genes, which were CCL5, FOXC1,
G0S2, and LTF. Meanwhile, the SVM model was constructed based on 10
key genes and the SVM algorithm to get the number of genes with the
lowest error rate (Fig. 7D) and
the highest accuracy (Fig. 7E).
The results showed that the SVM model has the highest accuracy when
the number of genes is 5. The five key genes were LTF, PRKCB, CCL5,
MUC1 and FOXC1. The intersection of the key genes of the two models
was received and three ferroptosis-related hub genes were obtained,
CCL5, FOXC1 and LTF (Fig. 7F).
Finally, to further validate the value of the DKD diagnostic model,
a nomogram was developed to illustrate the interrelationships of
ferroptosis-related hub genes, as depicted in Fig. 7G. The findings indicated that the
expression of LTF exhibited notably greater efficacy in the DKD
diagnostic model compared with other variables, while the
expression of CCL5 demonstrated significantly lower efficacy in the
DKD diagnostic model than the other variables.
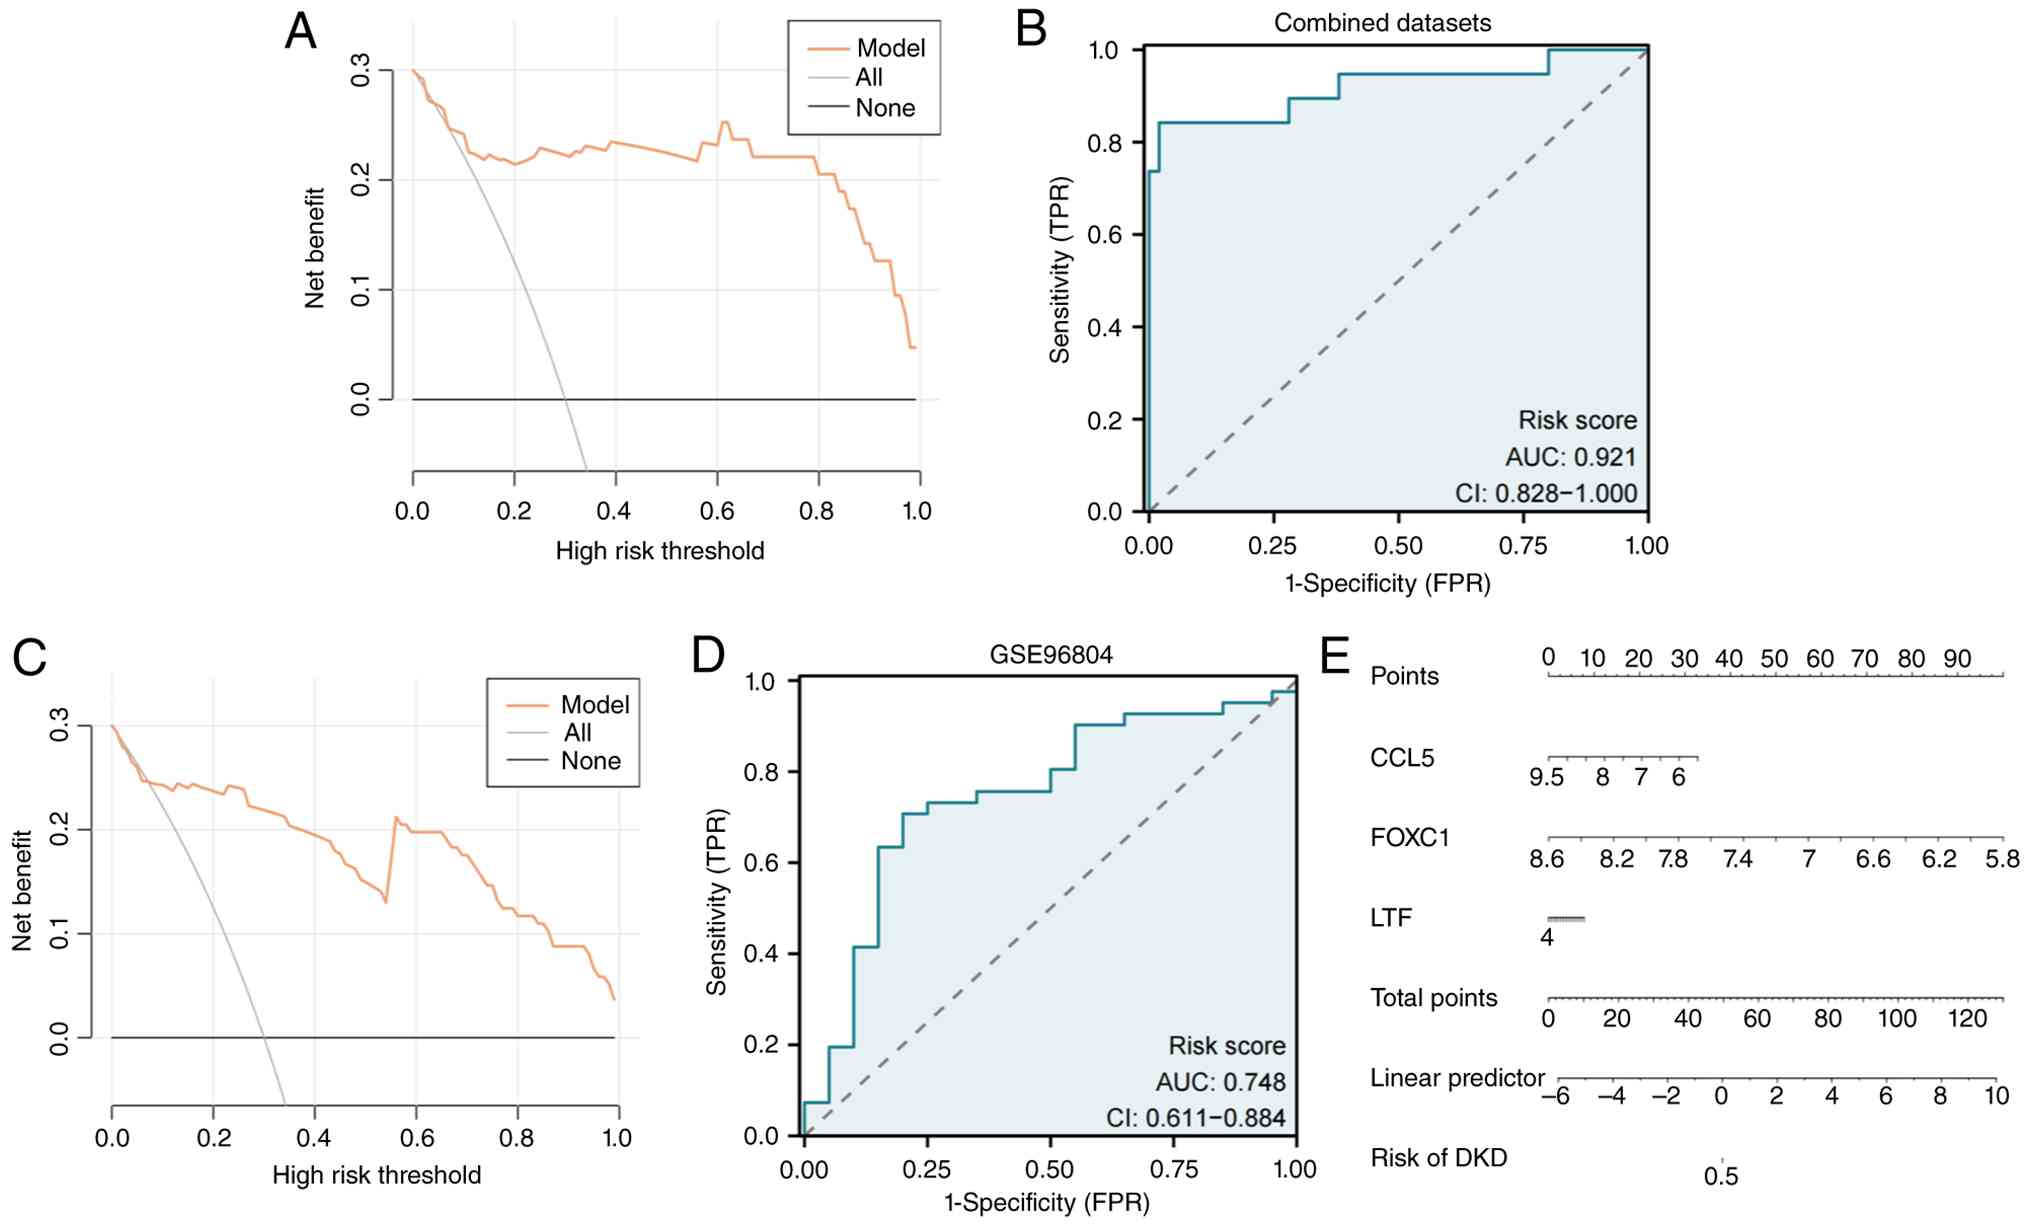
In order to evaluate and validate the accuracy and
discriminatory capacity of the DKD diagnostic model, the role of
the DKD diagnostic model was assessed in clinical utility through
DCA based on ferroptosis-related hub genes in the combined GEO
datasets. The results showed that the line of the DKD model was
stably higher than all positive and all negative in a specific
range, resulting in a substantial net gain. Consequently, the model
demonstrated effectiveness in accurately diagnosing DKD (Fig. 8A). Furthermore, ROC curves were
generated using the LASSO risk score derived from the combined GEO
datasets (Fig. 8B). These ROC
curves demonstrated the robustness of the LASSO risk score in
accurately predicting the expression level within various
subgroups, as evidenced by an AUC exceeding 0.9. The calculation of
the LASSO risk score was performed as follows:
The DKD diagnostic model's accuracy and
discriminatory capacity were validated using the GSE96804 dataset.
The results of the DCA demonstrated that the model consistently
outperformed both the ‘All positive’ and ‘All negative’ scenarios
within a specific range, indicating a high net gain and overall
effectiveness (Fig. 8C).
Additionally, the ROC curves revealed that the LASSO risk score
expression level in the GSE96804 dataset exhibited varying accuracy
across different subgroups, with AUC values ranging from 0.7 to 0.9
(Fig. 8D). Finally, a nomogram was
constructed to illustrate the interplay among ferroptosis-related
hub genes in dataset GSE96804 (Fig.
8E). The results showed that the expression of FOXC1, a
ferroptosis-related hub gene, exhibited notably greater efficacy in
the DKD diagnostic model compared with other variables. Conversely,
the expression of LTF demonstrated significantly diminished utility
in the DKD diagnostic model compared with the other variables.
Determination and validation of the
optimal Hub FRDEGs
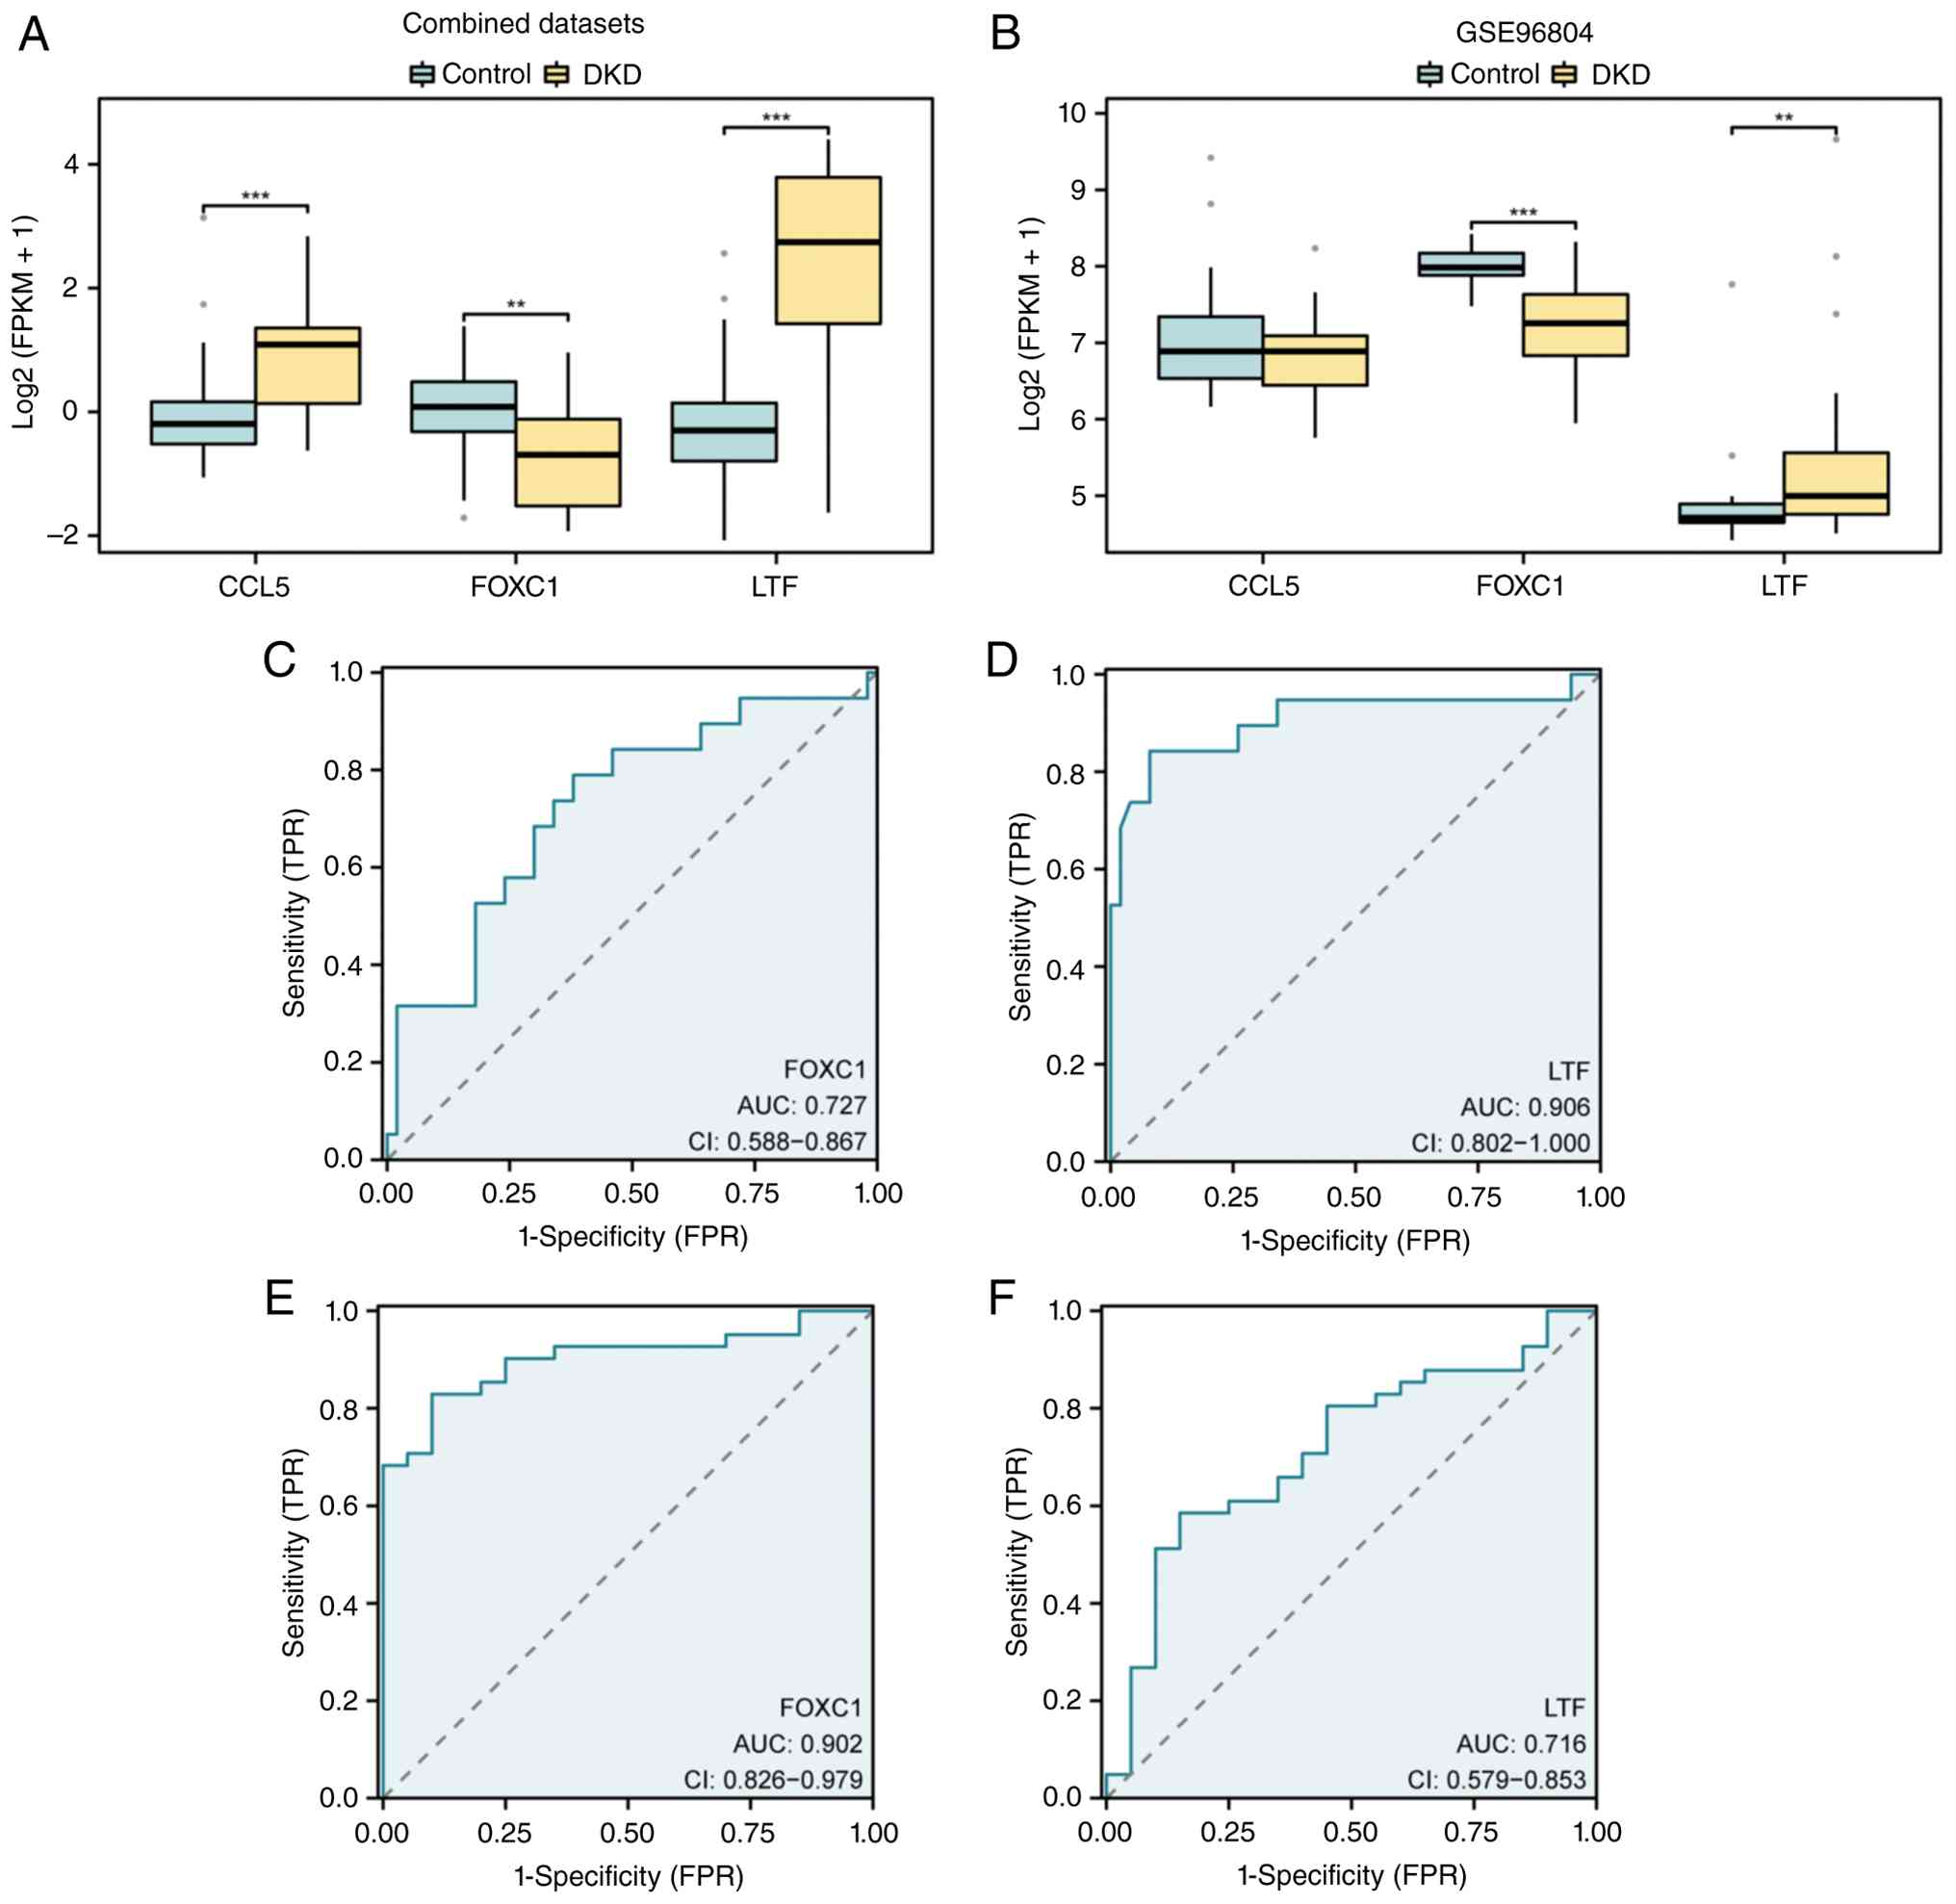
The expression of CCL5, FOXC1, and LTF were all
statistically significant (P<0.05) in the DKD and control groups
in the combined GEO datasets (Fig.
9A). Whereas in dataset GSE96804 (Fig. 9B), only the expression of FOXC1 and
LTF were statistically significant (P<0.05). Subsequently, the
accuracy of FOXC1 expression levels in the combined GEO datasets
was confirmed a certain level of accuracy (0.7< AUC <0.9), as
well as higher accuracy (AUC >0.9) in the GSE96804 dataset.
Meanwhile, LTF in the combined GEO datasets exhibited high accuracy
(AUC >0.9) in the expression levels across different groups
while also demonstrating a certain level of accuracy (0.7< AUC
<0.9) in the GSE96804 dataset among different subgroups
(Fig. 9C-F).
CIBERSORT estimation
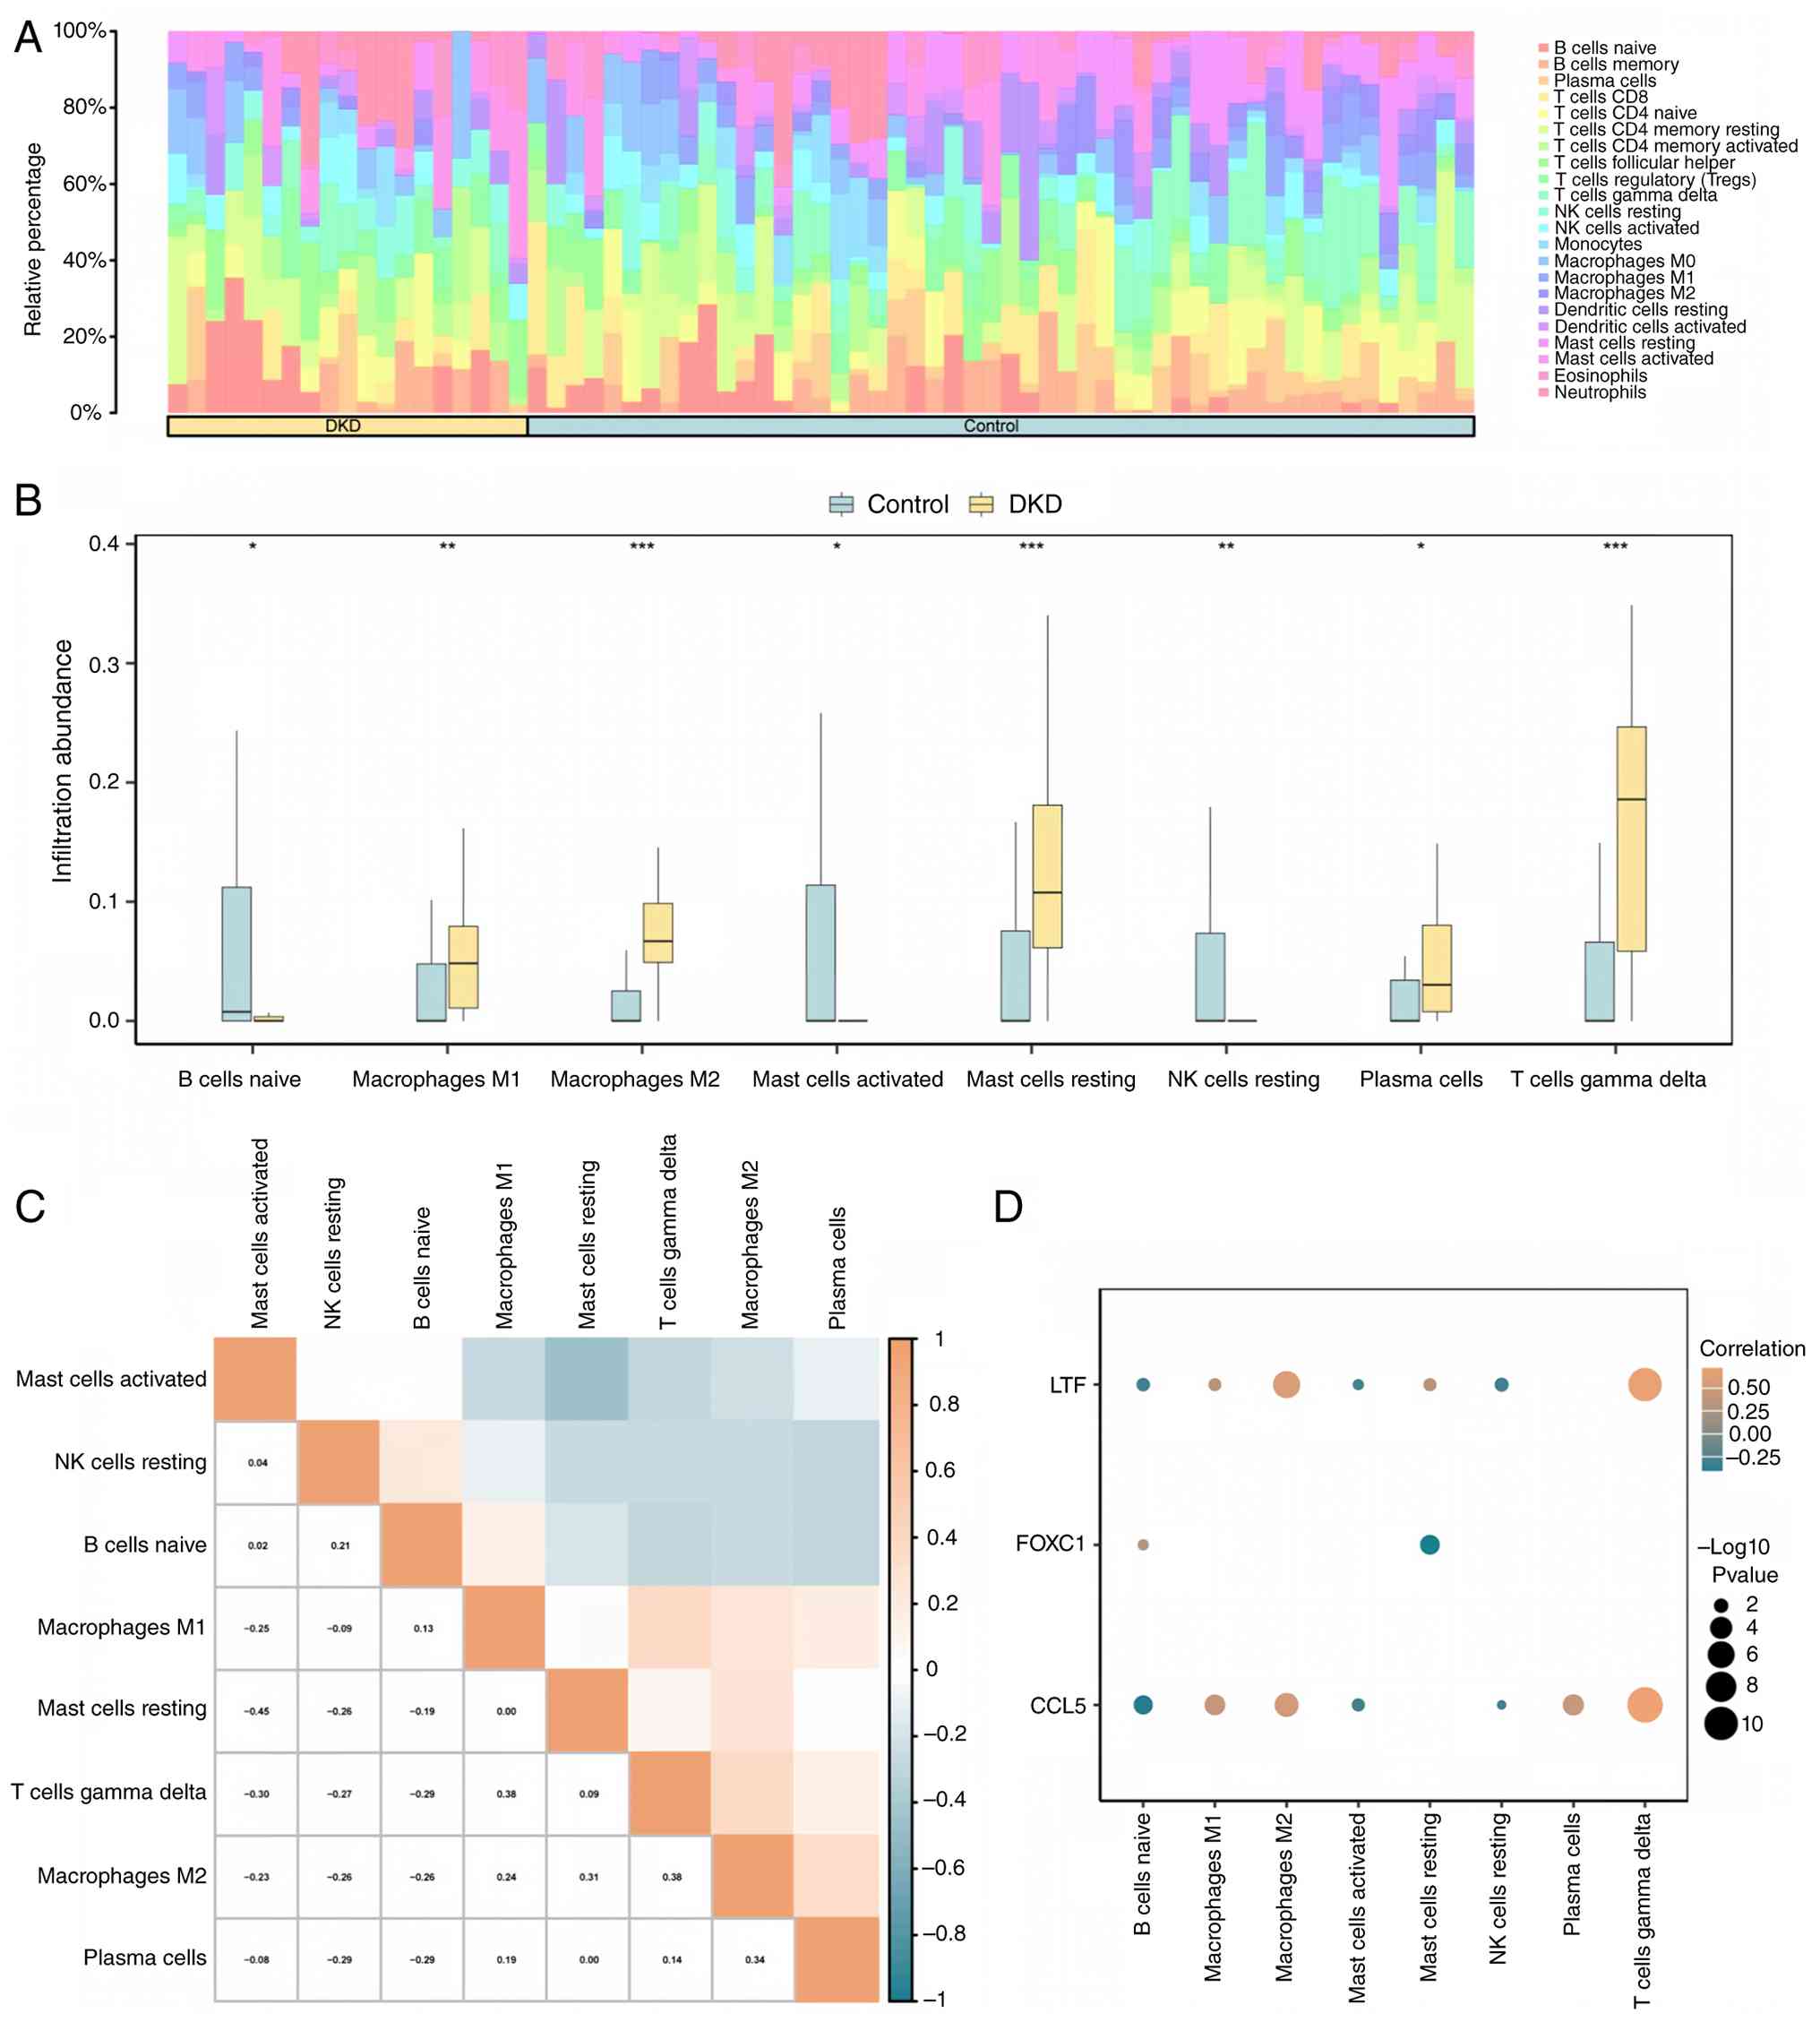
The CIBERSORT algorithm was employed to calculate
the correlation between the 22 immune cells in the DKD group and
the control group, and a histogram illustrating the percentage of
immune cells in the combined GEO datasets was plotted (Fig. 10A). The box line plot (Fig. 10B) provided evidence of the
disparity in immune cell infiltration abundance between DKD and
control groups in the combined GEO datasets. The statistical
analysis revealed that the expression levels of eight immune cell
types, namely B cells naive, plasma cells, T cells gamma delta, NK
cells resting, macrophages M1, macrophages M2, mast cells resting
and mast cells activated, were significantly different (P<0.05)
between the two groups. Subsequently, the correlation between the
infiltration abundance of the eight immune cells was illustrated
through correlation dot plots (Fig.
10C). The findings revealed that T cells gamma delta and
macrophages M2, as well as T cells gamma delta and macrophages M1,
exhibited the highest level of positive correlation (r=0.38).
Conversely, mast cells resting and mast cells activated displayed
the most substantial negative correlation (r=-0.45). Finally, the
correlation heatmap analysis revealed that LTF and CCL5, two of the
ferroptosis-related hub genes, significantly correlated with immune
cells, and both showed a significant positive correlation with
immune cell T cells gamma delta (Fig.
10D).
Validation of the optimal Hub
FRDEGs
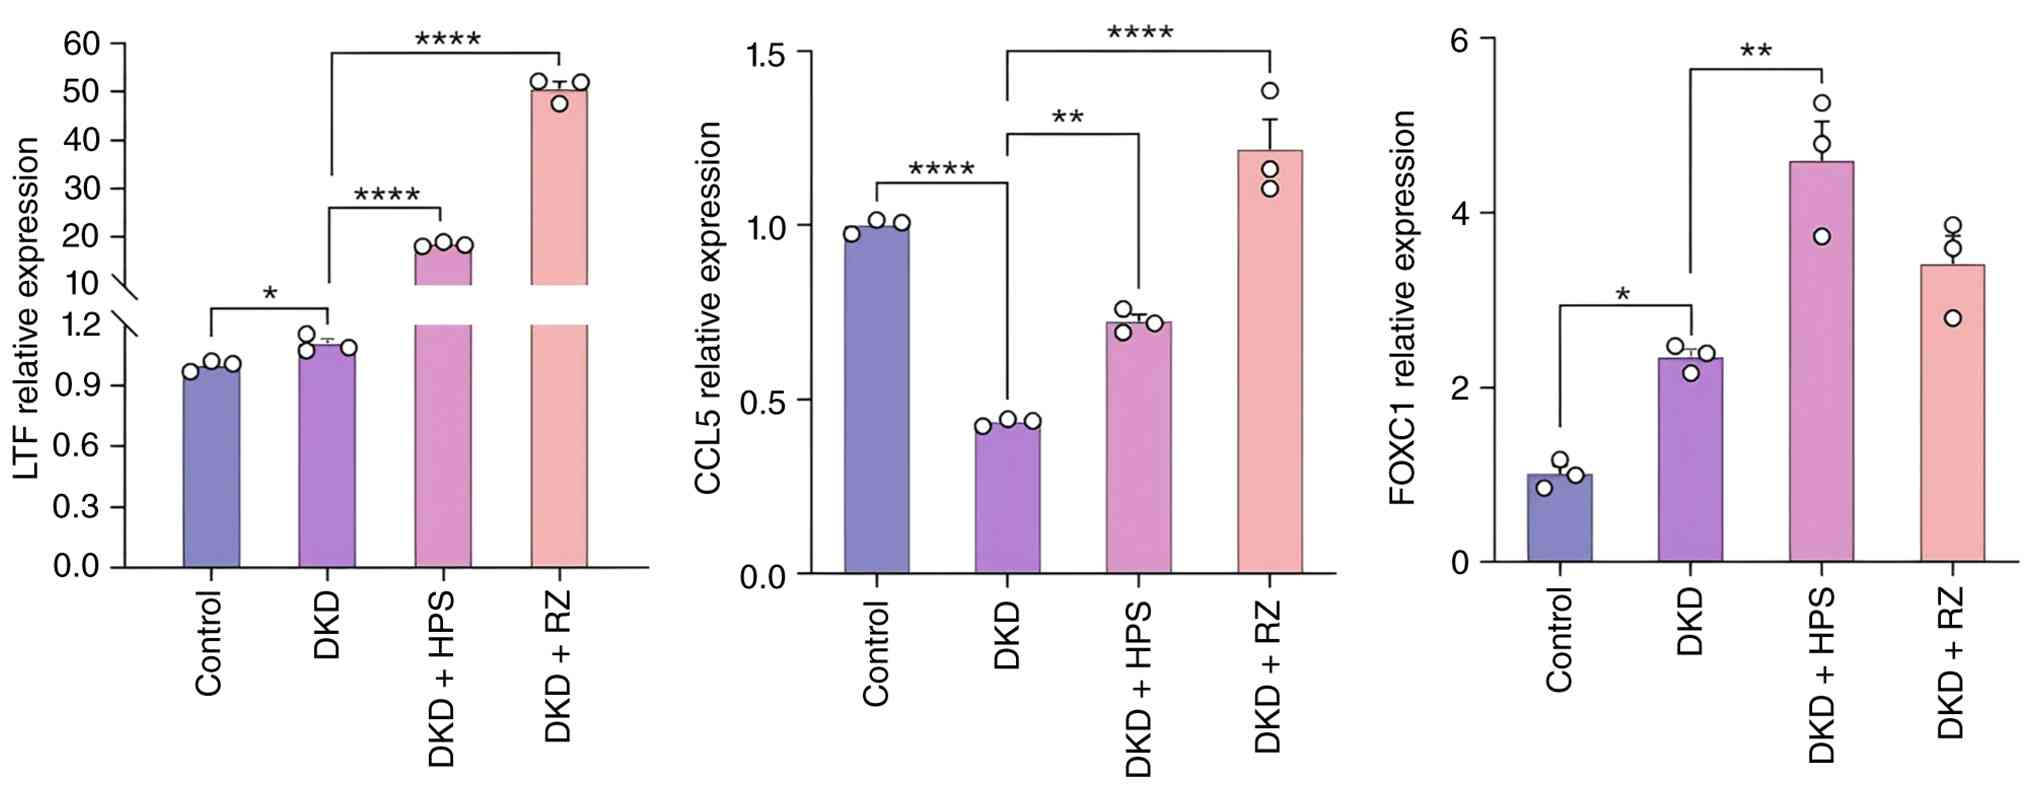
In the DKD group, LTF and FOXC1 exhibited higher
expression levels compared with the control group, while CCL5
expression was lower. Upon intervention with RZ and HPS on the DKD
model, LTF and CCL5 expression levels were significantly increased
compared with the DKD group. Similarly, FOXC1 expression was
significantly elevated following interventions with HPS, although
FOXC1 exhibited a trend to increase in response to RZ intervention,
the difference was not statistically significant (Fig. 11).
Discussion
Ferroptosis, a regulated cell death pathway marked
by the accumulation of intracellular iron overload, heightened
lipid peroxidation, and an abundance of reactive oxygen species
(ROS) (32), has a close
association with the pathological progression of DKD. Previous
studies have observed alterations in iron deposition and markers
related to ferroptosis in renal tissues of different animal models
of DKD (33). Furthermore, the
extent of renal iron accumulation has exhibited a positive
correlation with levels of serum creatinine and urinary protein
(34). Iron is filtered through
the glomerulus and subsequently reabsorbed in the renal tubules
within the human body. These renal tubules, being energy-consuming
organs, play a crucial role in reabsorbing substances against
concentration gradients. To obtain the necessary energy, they rely
on fatty acid oxidation, a process that takes place in numerous
mitochondria (35). In the
presence of elevated glucose levels, renal mitochondria generate
substantial quantities of ROS, leading to potential harm to various
renal intrinsic cells at the genetic, transcriptional, and protein
levels (36). These ROS are
considered to serve as an upstream regulatory mechanism for
microvascular injury induced by diabetes (37). Recent research has indicated that
the inhibition of ferroptosis in renal tubular epithelial cells and
the mitigation of hyperglycemia-induced decline in renal function
can be achieved through the targeting of ferroptosis, such as by
employing the antioxidant quercetin (38). Emerging evidence has established a
definitive interplay between ferroptosis and inflammatory fibrosis
in organs, and targeting ferroptosis has been proposed as a
potential therapeutic strategy against renal inflammatory fibrosis.
Nevertheless, further investigation is still required to fully
elucidate the precise mechanisms underlying ferroptosis in DKD
(39).
The present study initially discovered that DKD was
correlated with immune inflammation, apoptosis, and lipid
metabolism through the utilization of GSEA and GSVA analyses.
Subsequently, through the analysis of differential gene expression,
a total of 47 FRGs were identified in DKD. The enrichment analysis
conducted using GO and KEGG revealed a significant enrichment of
FRDEGs associated with ferroptosis, hypoxia response, immune
inflammation, and other functions and pathways in DKD. Among them,
hypoxia-inducible factor-1 (HIF-1) is a pivotal player in the
transcriptional response to oxygen homeostasis and exerts a
significant influence on intracellular metabolism in the context of
kidney injury (40). Extensive
evidence indicates that HIF-1 orchestrates metabolic reprogramming,
mitochondrial dysfunction, and the induction of inflammatory and
fibrotic factors, thereby contributing to target organ damage
(41). In a db/db mouse model,
Feng et al (42)
demonstrated that the HIF-1α/HO-1 pathway may mediate ferroptosis
in renal tubular injury and fibrosis. Moreover, HIF-1α directly
represses carnitine palmitoyl-transferase 1A promoter activity,
reducing mitochondrial fatty acid transport and promoting
intracellular lipid droplet formation, ultimately leading to
lipotoxic stress, lipid peroxidation and ferroptosis (43,44).
Additionally, leukocyte trans-endothelial migration, a key
regulator of immune and inflammatory responses, may be linked to
ferroptosis. In DKD, elevated glucose and lipid levels activate
inflammatory signaling, leading to excessive production of
pro-inflammatory factors and chemokines (10), which promote leukocyte accumulation
and activation along vascular endothelial cells, initiating further
inflammatory cascades (45).
Chronic renal inflammation subsequently fosters a fibrotic
microenvironment, driving structural remodeling and irreversible
functional decline (9). Extensive
research has confirmed that ferroptosis and inflammatory immune
responses co-exist and mutually reinforce each other, forming a
local auto-amplification loop (46). Recent studies have further
validated the contribution of ferroptosis to kidney fibrosis
(47,48). In DKD, damage-associated molecular
patterns released by ferroptotic cells activate various immune
cells, exacerbating renal damage through chemokine-or
cytokine-mediated inflammatory responses (36). This process begins with the
recruitment of leukocytes, predominantly neutrophils, to the site
of inflammation (45).
Concurrently, numerous pro-inflammatory factors and cytokines
generated in DKD can stimulate immune cells, thereby inducing
ferroptosis. Collectively, these findings account for the
enrichment of inflammatory immune response pathways observed in our
GSEA analysis.
In the present study, three ferroptosis-related hub
genes (CCL5, FOXC1 and LTF) were further screened out to establish
the DKD diagnostic model. CCL5, a vital member of the CC chemokine
family, can recruit immune cells to sites of inflammation or injury
(49) and is closely associated
with DKD (50). In renal biopsy
specimens from patients with DKD, CCL5 levels are notably altered,
particularly in tubular cells, and correlate strongly with NF-κB
activation, mesangial cell infiltration and proteinuria severity
(51). Under hyperglycemic
conditions, damaged tubular and mesangial cells upregulate CCL5
expression, promoting monocyte, macrophage, and T-cell recruitment
into glomeruli and tubulo-interstitium, thereby exacerbating
inflammation, triggering ferroptosis, and ultimately contributing
to kidney injury (50). FOXC1,
belonging to the FOXC subfamily of transcription factors, plays a
crucial role in diverse biological processes and is indispensable
for the preservation of cellular functionality and resilience
against oxidative stress (52). As
it is widely acknowledged, the impairment and depletion of
podocytes in DKD lead to a decline in renal function (53). In this context, the regulatory role
of FOXC1 in governing the expression of genes responsible for
maintaining podocyte integrity is of utmost importance (54). Notably, elevated FOXC1 expression
induces epithelial-mesenchymal transition (EMT) and promotes
fibrosis, whereas FOXC1 suppression in high-expressing cells
reverses EMT (55,56). Furthermore, high glucose conditions
upregulate HIF-1α in renal and vascular cells (57), which in turn activates FOXC1
transcription, inducing ferroptosis and causing target organ damage
(58). Among the three
ferroptosis-related hub genes, LTF, a glycoprotein belonging to the
transferrin family, has been found to play a crucial role in the
regulation of iron homeostasis (59). Several preclinical studies have
demonstrated the ability of LTF to mitigate inflammation and
oxidative stress, improve mitochondrial dysfunction, and act as a
biomarker for ferroptosis and renal fibrosis, thereby may exerting
a protective effect in DKD (60).
Additionally, LTF has been shown to reduce lipid peroxidation,
alleviate inflammation and oxidative stress in damaged tissues, and
inhibit ferroptosis through modulation of the
HGMB1/TLR-4/MyD88/Nrf2 signaling pathway (61). Mohamed et al (62) substantiated the role of LTF in the
downregulation of ferroptosis and the safeguarding of renal tissues
through by promoting NRF2/HO-1 signaling and inhibiting NF-κB
pathway expression.
Therefore, in vivo animal experiments were
further carried out to verify the role of LTF, CCL5 and FOXC1 in
DKD, so as to increase the reliability of the present analysis. In
addition, intervention in DKD model mice was conducted using RZ, a
Western drug, and HPS, the active ingredient of the traditional
Chinese medicine Abelmoschus Manihot, respectively; it was
found that all the three ferroptosis-related hub genes were
significantly elevated in both groups. Clinical studies confirmed
that RZ (63,64) and Abelmoschus Manihot
(64) can effectively treat DKD.
RZ, as a drug targeting ferroptosis in the treatment of DKD, can
effectively modulate the inflammatory pathway to inhibit
ferroptosis, which has been demonstrated in several in vitro
and in vivo studies, including those involving STZ-induced
diabetic mice, db/db mice, and high glucose-treated NRK-52E and
HK-2 cells (36). In 2020, Wang
et al (5) verified that RZ
could reduce urinary albumin levels by inhibiting ferroptosis and
inflammation in db/db mice. The present study suggested that RZ
significantly affected the ferroptosis-related biomarkers in DKD,
which might contribute to subsequent studies exploring the
mechanisms and targets of RZ in the treatment of DKD. Meanwhile,
HPS, a flavonoid compound, is established as the exclusive quality
control indicator for Abelmoschus Manihot in the 2020
edition of the Chinese Pharmacopoeia and represents the principal
active constituent in Abelmoschus manihot (65). It predominantly localizes in
the kidneys and livers of animals (66). HPS demonstrates anti-inflammatory,
antioxidant and immunomodulatory activities. Extensive research has
substantiated its efficacy in alleviating DKD, with evidence
indicating its therapeutic benefits through the improvement of
ferroptosis (66,67). LTF, CCL5 and FOXC1, the target
ferroptosis-related hub genes, may be essential targets for HPS in
treating DKD, thereby providing ideas for future research.
Imbalances in human immune function are inextricably
linked to the development of DKD (9). Infiltration of immune cells in renal
tissues is a distinctive feature of DKD, associated with an
increased risk of DKD progression (50). Immune cell infiltration analysis
revealed dysregulation in eight distinct immune cell types between
patients with DKD and the controls. Specifically, γδT cells, M1
macrophages, M2 macrophages and resting mast cells exhibited
significantly higher levels in renal tissues of patients with DKD
than the controls. Moreover, there existed distinct regulatory
associations among these different immune cells. γδT cells are
unconventional T cells with unique T cell receptors on their
surface. Despite comprising 1-5% of T cells in peripheral blood,
γδT cells possess remarkable potency and versatility. They serve as
a crucial link between innate and adaptive immunity, playing
multiple roles in inflammation regulation, tissue repair and damage
surveillance (68). Renal tissues
afflicted with tubulointerstitial fibrosis exhibited considerably
elevated γδ T cell counts compared with healthy renal tissues
(69). Additionally, these γδ T
cells were found to generate substantial quantities of the
pro-inflammatory cytokine IL-17A, thereby facilitating the renal
inflammatory response (68,69).
In the presence of elevated glucose levels, a significant influx of
macrophages occurs within the kidney and secrete diverse
pro-inflammatory mediators (70).
This process induces renal inflammation and fibrosis, thereby
expediting renal injury and playing a pivotal role in the
progression of DKD, aligning with prior research findings (70,71).
In an inflammatory environment, γδ T cells can regulate macrophages
through direct interactions, cytokine secretion and chemotaxis
induction, leading to macrophage proliferation, activation, and
polarization towards either pro-inflammatory (M1-like) or
anti-inflammatory (M2-like) states (72,73).
It is consistent with the significant positive correlation between
γδ T cells and macrophages observed in the present study.
Significantly, the present study revealed a notable
positive correlation between the FRGs LTF and CCL5 and γδT cells,
suggesting their involvement in the immune microenvironment of DKD.
From a functional perspective, this correlation is biologically
plausible. Activated human γδT cells have been shown to express
functional lactoferrin receptors at a markedly higher proportion
than αβT cells, making them particularly responsive to LTF-mediated
immunoregulation. LTF may suppress ferroptosis through the
NRF2/HO-1 and NF-κB pathways (57,58),
while also modulating γδT cell activity via iron-dependent
mechanisms. Regarding CCL5, emerging evidence indicates that γδT
cell-derived IL-17A can promote renal fibrosis through
CCL5-mediated leukocyte infiltration (66,74),
establishing a functional link between γδT cells and CCL5-driven
chemotaxis. Therefore, the interplay between γδT cells and these
hub genes suggests a complex immuno-regulatory network in which γδT
cells contribute to both the inflammatory milieu and
ferroptosis-associated pathology in DKD. LTF, a crucial factor in
facilitating both innate and acquired immune responses (74), exhibited a considerably higher
proportion of expression in activated γ-δ T cells compared with
activated α-β T cells (75).
Meanwhile, it has been observed that CCL5, a chemokine, plays a
significant role in facilitating the recruitment of T-cells to both
glomeruli and tubular interstitium (50). In conclusion, the observed strong
association between ferroptosis and the infiltration of immune
cells implied that ferroptosis could potentially play a role in the
pathogenesis of DKD by triggering immune cell infiltration and
subsequent immune responses. Further investigation is warranted to
validate these bioinformatic predictions through overexpression or
knockout models of the identified hub genes.
There are inevitable limitations to our study that
should be acknowledged. Firstly, one notable obstacle encountered
was the lack of renal specimens from patients with DKD, which
consequently necessitated the future conduction of a prospective
clinical study to validate the clinical applicability of the
present model. Secondly, the validation in the present study was
confined to RT-qPCR analysis of CCL5, LTF and FOXC1, with no
protein-level verification or further mechanistic investigation
into immune-inflammatory pathways and ferroptosis. Further studies
are required to corroborate these findings at the protein level and
to elucidate the precise mechanisms through which FRGs and immune
cell infiltration contribute to DKD. In future basic DKD
experiments, it is intended to validate all the pertinent
ferroptosis markers in vivo and in vitro and explore
the immune-inflammatory pathways that may be regulated by the
target hub genes, thereby enhancing the persuasiveness of the
present analysis. Last but not least, the observed discrepancy
regarding FOXC1 expression levels and analytical outcomes may be
attributed to the limited sample size and inherent biological
heterogeneity. It is noteworthy that the bioinformatic analysis was
conducted using publicly available human renal specimens, whereas
experimental validation was performed in the mouse kidney model,
introducing potential interspecies variations. Furthermore, RNA
expression is inherently subject to temporal and spatial
specificity. Although FOXC1 is expressed across multiple renal cell
types, including podocytes, vascular endothelial cells and tubular
epithelial cells, its regulatory mechanisms may vary in a cell
type-dependent manner. Differences in cellular composition or DKD
staging between the bioinformatic cohorts and the experimental
model may also contribute to the divergent results. Therefore,
further validation using a substantial number of human renal
tissues from both DKD patients and control subjects is essential to
corroborate the diagnostic biomarkers more comprehensively.
Additionally, leveraging single-nucleus RNA sequencing could help
elucidate the cell type-specific expression profiles of FOXC1 in
DKD. Nevertheless, the present study provides a basis for exploring
ferroptosis mechanisms in DKD and targets for future therapies.
In the present study, a total of 47 FRDEGs were
screened. Through bioinformatics analysis, three hub genes (CCL5,
LTF and FOXC1) were identified, which are closely associated with
the development of DKD. These findings contribute to the enhanced
comprehension of the molecular pathological mechanisms underlying
DKD, offering potential benefits in terms of diagnosis and
therapeutic interventions targeting ferroptosis and immune cell
infiltration. However, additional experimental investigations are
warranted to validate the role of ferroptosis in DKD.
Supplementary Material
GEO microarray chip information.
List of the 667 ferroptosis-related
genes.
Primer sequences of the hub
genes.
Results of Gene Set Enrichment
Analysis for combined datasets.
Results of Gene Set Variation Analysis
for combined datasets.
Acknowledgements
Not applicable.
Funding
Funding: The present study was supported by the National Natural
Science Foundation of China (grant nos. 82374355 and 82575019), the
Science and Technology Support Program of Jiangsu (grant no.
ZT202206), the Jiangsu Traditional Chinese Medicine Science and
Technology Development Plan Project (grant no. QN202506) and the
Jiangsu Hospital of Chinese Medicine Institutional Research
Projects (grant no. Y25066).
Availability of data and materials
The data generated in the present study may be
requested from the corresponding author.
Authors' contributions
YT conceptualized and supervised the study,
visualized, curated and validated data, conduced formal analysis
and project administration, developed methodology, performed
software analysis, wrote the original draft, and wrote, reviewed
and edited the manuscript. ZL curated data, performed formal
analysis and wrote the original draft. SS conducted formal analysis
and developed methodology. LZ performed formal analysis and
supervised the study. YS contributed to data organization and
statistical analysis. XZ contributed to the study design and
experimental validation. JY and QY conceptualized and supervised
the study, acquired funding, validated data, conducted project
administration, and wrote, reviewed and edited the manuscript. YT
and QY confirm the authenticity of all the raw data. All authors
read and approved the final version of the manuscript.
Ethics approval and consent to
participate
Animal experiments received the approval from the
Animal Ethics Committee in Affiliated Hospital of Nanjing
University of Traditional Chinese Medicine (approval no.
2023DW-039-01; Nanjing, China) and were conducted in accordance
with institutional and national guidelines for the care and use of
laboratory animals.
Patient consent for publication
Not applicable.
Competing interests
The authors declare that they have no competing
interests.
References
|
1
|
Afkarian M, Zelnick LR, Hall YN, Heagerty
PJ, Tuttle K, Weiss NS and de Boer IH: Clinical manifestations of
kidney disease among US adults with diabetes, 1988-2014. JAMA.
316:602–610. 2016.PubMed/NCBI View Article : Google Scholar
|
|
2
|
Zhang L, Long J, Jiang W, Shi Y, He X,
Zhou Z, Li Y, Yeung RO, Wang J, Matsushita K, et al: Trends in
chronic kidney disease in China. N Engl J Med. 375:905–906.
2016.PubMed/NCBI View Article : Google Scholar
|
|
3
|
Zheng J and Conrad M: The metabolic
underpinnings of ferroptosis. Cell Metab. 32:920–937.
2020.PubMed/NCBI View Article : Google Scholar
|
|
4
|
Jiang X, Stockwell BR and Conrad M:
Ferroptosis: Mechanisms, biology and role in disease. Nat Rev Mol
Cell Biol. 22:266–682. 2021.PubMed/NCBI View Article : Google Scholar
|
|
5
|
Wang Y, Bi R, Quan F, Cao Q, Lin Y, Yue C,
Cui X, Yang H, Gao X and Zhang D: Ferroptosis involves in renal
tubular cell death in diabetic nephropathy. Eur J Pharmacol.
888(173574)2020.PubMed/NCBI View Article : Google Scholar
|
|
6
|
Sanz AB, Sanchez-Niño MD, Ramos AM and
Ortiz A: Regulated cell death pathways in kidney disease. Nat Rev
Nephrol. 19:281–299. 2023.PubMed/NCBI View Article : Google Scholar
|
|
7
|
Ilyas Z, Chaiban JT and Krikorian A: Novel
insights into the pathophysiology and clinical aspects of diabetic
nephropathy. Rev Endocr Metab Disord. 18:21–28. 2017.PubMed/NCBI View Article : Google Scholar
|
|
8
|
Anders HJ, Huber TB, Isermann B and
Schiffer M: CKD in diabetes: Diabetic kidney disease versus
nondiabetic kidney disease. Nat Rev Nephrol. 14:361–377.
2018.PubMed/NCBI View Article : Google Scholar
|
|
9
|
Tang SCW and Yiu WH: Innate immunity in
diabetic kidney disease. Nat Rev Nephrol. 16:206–222.
2020.PubMed/NCBI View Article : Google Scholar
|
|
10
|
Rayego-Mateos S, Rodrigues-Diez RR,
Fernandez-Fernandez B, Mora-Fernández C, Marchant V, Donate-Correa
J, Navarro-González JF, Ortiz A and Ruiz-Ortega M: Targeting
inflammation to treat diabetic kidney disease: The road to 2030.
Kidney Int. 103:282–296. 2023.PubMed/NCBI View Article : Google Scholar
|
|
11
|
Woroniecka KI, Park AS, Mohtat D, Thomas
DB, Pullman JM and Susztak K: Transcriptome analysis of human
diabetic kidney disease. Diabetes. 60:2354–2369. 2011.PubMed/NCBI View Article : Google Scholar
|
|
12
|
Na J, Sweetwyne MT, Park ASD, Susztak K
and Cagan RL: Diet-induced podocyte dysfunction in Drosophila and
mammals. Cell Rep. 12:636–647. 2015.PubMed/NCBI View Article : Google Scholar
|
|
13
|
Pan Y, Jiang S, Hou Q, Qiu D, Shi J, Wang
L, Chen Z, Zhang M, Duan A, Qin W, et al: Dissection of glomerular
transcriptional profile in patients with diabetic nephropathy:
SRGAP2a protects podocyte structure and function. Diabetes.
67:717–730. 2018.PubMed/NCBI View Article : Google Scholar
|
|
14
|
Shi JS, Qiu DD, Le WB, Wang H, Li S, Lu YH
and Jiang S: Identification of transcription regulatory
relationships in diabetic nephropathy. Chin Med J (Engl).
131:2886–2890. 2018.PubMed/NCBI View Article : Google Scholar
|
|
15
|
Davis S and Meltzer PS: GEOquery: A bridge
between the gene expression omnibus (GEO) and BioConductor.
Bioinformatics. 23:1846–1847. 2007.PubMed/NCBI View Article : Google Scholar
|
|
16
|
Leek JT, Johnson WE, Parker HS, Jaffe AE
and Storey JD: The sva package for removing batch effects and other
unwanted variation in high-throughput experiments. Bioinformatics.
28:882–883. 2012.PubMed/NCBI View Article : Google Scholar
|
|
17
|
Ritchie ME, Phipson B, Wu D, Hu Y, Law CW,
Shi W and Smyth GK: Limma powers differential expression analyses
for RNA-sequencing and microarray studies. Nucleic Acids Res.
43(e47)2015.PubMed/NCBI View Article : Google Scholar
|
|
18
|
Stelzer G, Rosen N, Plaschkes I, Zimmerman
S, Twik M, Fishilevich S, Stein TI, Nudel R, Lieder I, Mazor Y, et
al: The GeneCards suite: From gene data mining to disease genome
sequence analyses. Curr Protoc Bioinformatics. 54:1.30.1–1.30.33.
2016.PubMed/NCBI View
Article : Google Scholar
|
|
19
|
Liang JY, Wang DS, Lin HC, Chen XX, Yang
H, Zheng Y and Li YH: A novel ferroptosis-related gene signature
for overall survival prediction in patients with hepatocellular
carcinoma. Int J Biol Sci. 16:2430–2441. 2020.PubMed/NCBI View Article : Google Scholar
|
|
20
|
Subramanian A, Tamayo P, Mootha VK,
Mukherjee S, Ebert BL, Gillette MA, Paulovich A, Pomeroy SL, Golub
TR, Lander ES and Mesirov JP: Gene set enrichment analysis: A
knowledge-based approach for interpreting genome-wide expression
profiles. Proc Natl Acad Sci USA. 102:15545–15550. 2005.PubMed/NCBI View Article : Google Scholar
|
|
21
|
Hänzelmann S, Castelo R and Guinney J:
GSVA: Gene set variation analysis for microarray and RNA-seq data.
BMC Bioinformatics. 14(7)2013.PubMed/NCBI View Article : Google Scholar
|
|
22
|
Liberzon A, Subramanian A, Pinchback R,
Thorvaldsdottir H, Tamayo P and Mesirov JP: Molecular signatures
database (MSigDB) 3.0. Bioinformatics. 27:1739–1740.
2011.PubMed/NCBI View Article : Google Scholar
|
|
23
|
Mi H, Muruganujan A, Ebert D, Huang X and
Thomas PD: PANTHER version 14: More genomes, a new PANTHER GO-slim
and improvements in enrichment analysis tools. Nucleic Acids Res.
47 (D1):D419–D426. 2019.PubMed/NCBI View Article : Google Scholar
|
|
24
|
Kanehisa M and Goto S: KEGG: Kyoto
encyclopedia of genes and genomes. Nucleic Acids Res. 28:27–30.
2000.PubMed/NCBI View Article : Google Scholar
|
|
25
|
Yu G, Wang LG, Han Y and He QY:
clusterProfiler: An R package for comparing biological themes among
gene clusters. OMICS. 16:284–287. 2012.PubMed/NCBI View Article : Google Scholar
|
|
26
|
Langfelder P and Horvath S: WGCNA: An R
package for weighted correlation network analysis. BMC
Bioinformatics. 9(559)2008.PubMed/NCBI View Article : Google Scholar
|
|
27
|
Engebretsen S and Bohlin J: Statistical
predictions with glmnet. Clin Epigenetics. 11(123)2019.PubMed/NCBI View Article : Google Scholar
|
|
28
|
Sanz H, Valim C, Vegas E, Oller JM and
Reverter F: SVM-RFE: Selection and visualization of the most
relevant features through non-linear kernels. BMC Bioinformatics.
19(432)2018.PubMed/NCBI View Article : Google Scholar
|
|
29
|
Van Calster B, Wynants L, Verbeek JFM,
Verbakel JY, Christodoulou E, Vickers AJ, Roobol MJ and Steyerberg
EW: Reporting and interpreting decision curve analysis: A guide for
investigators. Eur Urol. 74:796–804. 2018.PubMed/NCBI View Article : Google Scholar
|
|
30
|
Newman AM, Liu CL, Green MR, Gentles AJ,
Feng W, Xu Y, Hoang CD, Diehn M and Alizadeh AA: Robust enumeration
of cell subsets from tissue expression profiles. Nat Methods.
12:453–457. 2015.PubMed/NCBI View Article : Google Scholar
|
|
31
|
Livak KJ and Schmittgen TD: Analysis of
relative gene expression data using real-time quantitative PCR and
the 2(-Delta Delta C(T)) method. Methods. 25:402–408.
2001.PubMed/NCBI View Article : Google Scholar
|
|
32
|
Li J, Cao F, Yin HL, Huang ZJ, Lin ZT, Mao
N, Sun B and Wang G: Ferroptosis: past, present and future. Cell
Death Dis. 11(88)2020.PubMed/NCBI View Article : Google Scholar
|
|
33
|
Dominguez JH, Liu Y and Kelly KJ: Renal
iron overload in rats with diabetic nephropathy. Physiol Rep.
3(e12654)2015.PubMed/NCBI View Article : Google Scholar
|
|
34
|
Chaudhary K, Chilakala A, Ananth S,
Mandala A, Veeranan-Karmegam R, Powell FL, Ganapathy V and
Gnana-Prakasam JP: Renal iron accelerates the progression of
diabetic nephropathy in the HFE gene knockout mouse model of iron
overload. Am J Physiol Renal Physiol. 317:F512–F517.
2019.PubMed/NCBI View Article : Google Scholar
|
|
35
|
Ma J, Li C, Liu T, Zhang L, Wen X, Liu X
and Fan W: Identification of markers for diagnosis and treatment of
diabetic kidney disease based on the ferroptosis and immune. Oxid
Med Cell Longev. 2022(9957172)2022.PubMed/NCBI View Article : Google Scholar
|
|
36
|
Wang H, Liu D, Zheng B, Yang Y, Qiao Y, Li
S, Pan S, Liu Y, Feng Q and Liu Z: Emerging role of ferroptosis in
diabetic kidney disease: Molecular mechanisms and therapeutic
opportunities. Int J Biol Sci. 19:2678–2694. 2023.PubMed/NCBI View Article : Google Scholar
|
|
37
|
Yuchen C, Hejia Z, Fanke M, Qixin D,
Liyang C, Xi G, Yanxia C, Xiongyi Y, Zhuohang X, Guoguo Y and Min
F: Exploring the shared molecular mechanism of microvascular and
macrovascular complications in diabetes: Seeking the hub of
circulatory system injury. Front Endocrinol (Lausanne).
14(1032015)2023.PubMed/NCBI View Article : Google Scholar
|
|
38
|
Feng Q, Yang Y, Qiao Y, Zheng Y, Yu X, Liu
F, Wang H, Zheng B, Pan S, Ren K, et al: Quercetin ameliorates
diabetic kidney injury by inhibiting ferroptosis via activating
Nrf2/HO-1 signaling pathway. Am J Chin Med. 51:997–1018.
2023.PubMed/NCBI View Article : Google Scholar
|
|
39
|
Lai W, Wang B, Huang R, Zhang C, Fu P and
Ma L: Ferroptosis in organ fibrosis: From mechanisms to therapeutic
medicines. J Transl Int Med. 12:22–34. 2024.PubMed/NCBI View Article : Google Scholar
|
|
40
|
Tang D, Chen X, Kang R and Kroemer G:
Ferroptosis: Molecular mechanisms and health implications. Cell
Res. 31:107–125. 2021.PubMed/NCBI View Article : Google Scholar
|
|
41
|
Chen Y, Zhang J, Zhang M, Song Y, Zhang Y,
Fan S, Ren S, Fu L, Zhang N, Hui H and Shen X: Baicalein
resensitizes tamoxifen-resistant breast cancer cells by reducing
aerobic glycolysis and reversing mitochondrial dysfunction via
inhibition of hypoxia-inducible factor-1α. Clin Transl Med.
11(e577)2021.PubMed/NCBI View Article : Google Scholar
|
|
42
|
Feng X, Wang S, Sun Z, Dong H, Yu H, Huang
M and Gao X: Ferroptosis enhanced diabetic renal tubular injury via
HIF-1α/HO-1 pathway in db/db mice. Front Endocrinol (Lausanne).
12(626390)2021.PubMed/NCBI View Article : Google Scholar
|
|
43
|
Du W, Zhang L, Brett-Morris A, Aguila B,
Kerner J, Hoppel CL, Puchowicz M, Serra D, Herrero L, Rini BI, et
al: HIF drives lipid deposition and cancer in ccRCC via repression
of fatty acid metabolism. Nat Commun. 8(1769)2017.PubMed/NCBI View Article : Google Scholar
|
|
44
|
Helsley RN, Park SH, Vekaria HJ, Sullivan
PG, Conroy LR, Sun RC, Romero MDM, Herrero L, Bons J, King CD, et
al: Ketohexokinase-C regulates global protein acetylation to
decrease carnitine palmitoyltransferase 1a-mediated fatty acid
oxidation. J Hepatol. 79:25–42. 2023.PubMed/NCBI View Article : Google Scholar
|
|
45
|
Maas SL, Soehnlein O and Viola JR:
Organ-specific mechanisms of transendothelial neutrophil migration
in the lung, liver, kidney, and aorta. Front Immunol.
9(2739)2018.PubMed/NCBI View Article : Google Scholar
|
|
46
|
Linkermann A, Stockwell BR, Krautwald S
and Anders HJ: Regulated cell death and inflammation: An
auto-amplification loop causes organ failure. Nat Rev Immunol.
14:759–767. 2014.PubMed/NCBI View Article : Google Scholar
|
|
47
|
Lai W, Huang R, Wang B, Shi M, Guo F, Li
L, Ren Q, Tao S, Fu P and Ma L: Novel aspect of neprilysin in
kidney fibrosis via ACSL4-mediated ferroptosis of tubular
epithelial cells. MedComm (2020). 4(e330)2023.PubMed/NCBI View Article : Google Scholar
|
|
48
|
Wang B, Yang LN, Yang LT, Liang Y, Guo F,
Fu P and Ma L: Fisetin ameliorates fibrotic kidney disease in mice
via inhibiting ACSL4-mediated tubular ferroptosis. Acta Pharmacol
Sin. 45:150–165. 2024.PubMed/NCBI View Article : Google Scholar
|
|
49
|
Qiu Y, Tang J, Zhao Q, Jiang Y, Liu YN and
Liu WJ: From diabetic nephropathy to end-stage renal disease: The
effect of chemokines on the immune system. J Diabetes Res.
2023(3931043)2023.PubMed/NCBI View Article : Google Scholar
|
|
50
|
Cao H, Rao X, Jia J, Yan T and Li D:
Exploring the pathogenesis of diabetic kidney disease by microarray
data analysis. Front Pharmacol. 13(932205)2022.PubMed/NCBI View Article : Google Scholar
|
|
51
|
Mezzano S, Aros C, Droguett A, Burgos ME,
Ardiles L, Flores C, Schneider H, Ruiz-Ortega M and Egido J:
NF-kappaB activation and overexpression of regulated genes in human
diabetic nephropathy. Nephrol Dial Transplant. 19:2505–2512.
2004.PubMed/NCBI View Article : Google Scholar
|
|
52
|
Lay K, Kume T and Fuchs E: FOXC1 maintains
the hair follicle stem cell niche and governs stem cell quiescence
to preserve long-term tissue-regenerating potential. Proc Natl Acad
Sci USA. 113:E1506–E1515. 2016.PubMed/NCBI View Article : Google Scholar
|
|
53
|
Yin T, Yang L, Tang L, Li J, Liu D, Guo F,
Mu Y, Wu Q, Feng Y, Tan Z, et al: Podocyte FFAR4 deficiency
aggravated glomerular diseases and aging. Mol Ther. 33:4636–4654.
2025.PubMed/NCBI View Article : Google Scholar
|
|
54
|
Motojima M, Kume T and Matsusaka T: Foxc1
and Foxc2 are necessary to maintain glomerular podocytes. Exp Cell
Res. 352:265–272. 2017.PubMed/NCBI View Article : Google Scholar
|
|
55
|
Gilding LN and Somervaille TCP: The
diverse consequences of FOXC1 deregulation in cancer. Cancers
(Basel). 11(184)2019.PubMed/NCBI View Article : Google Scholar
|
|
56
|
Li Q, Wu J, Wei P, Xu Y, Zhuo C, Wang Y,
Li D and Cai S: Overexpression of forkhead Box C2 promotes tumor
metastasis and indicates poor prognosis in colon cancer via
regulating epithelial-mesenchymal transition. Am J Cancer Res.
5:2022–2034. 2015.PubMed/NCBI
|
|
57
|
Iacobini C, Vitale M, Pugliese G and
Menini S: Normalizing HIF-1α signaling improves cellular glucose
metabolism and blocks the pathological pathways of hyperglycemic
damage. Biomedicines. 9(1139)2021.PubMed/NCBI View Article : Google Scholar
|
|
58
|
Lin YJ, Shyu WC, Chang CW, Wang CC, Wu CP,
Lee HT, Chen LJ and Hsieh CH: Tumor hypoxia regulates forkhead box
C1 to promote lung cancer progression. Theranostics. 7:1177–1191.
2017.PubMed/NCBI View Article : Google Scholar
|
|
59
|
Madkour AH, Helal MG, Said E and Salem HA:
Dose-dependent renoprotective impact of lactoferrin against
glycerol-induced rhabdomyolysis and acute kidney injury. Life Sci.
302(120646)2022.PubMed/NCBI View Article : Google Scholar
|
|
60
|
Zahan MS, Ahmed KA, Moni A, Sinopoli A, Ha
H and Uddin MJ: Kidney protective potential of lactoferrin:
Pharmacological insights and therapeutic advances. Korean J Physiol
Pharmacol. 26:1–13. 2022.PubMed/NCBI View Article : Google Scholar
|
|
61
|
Essam RM, Saadawy MA, Gamal M, Abdelsalam
RM and El-Sahar AE: Lactoferrin averts neurological and behavioral
impairments of thioacetamide-induced hepatic encephalopathy in rats
via modulating HGMB1/TLR-4/MyD88/Nrf2 pathway. Neuropharmacology.
236(109575)2023.PubMed/NCBI View Article : Google Scholar
|
|
62
|
Mohamed OS, Abdel Baky NA, Sayed-Ahmed MM
and Al-Najjar AH: Lactoferrin alleviates cyclophosphamide
induced-nephropathy through suppressing the orchestration between
Wnt4/β-catenin and ERK1/2/NF-κB signaling and modulating klotho and
Nrf2/HO-1 pathway. Life Sci. 2023;319:121528.
|
|
63
|
Miyazaki Y, Cersosimo E, Triplitt C and
DeFronzo RA: Rosiglitazone decreases albuminuria in type 2 diabetic
patients. Kidney Int. 72:1367–1373. 2007.PubMed/NCBI View Article : Google Scholar
|
|
64
|
Bjornstad P, Hughan K, Kelsey MM, Shah AS,
Lynch J, Nehus E, Mitsnefes M, Jenkins T, Xu P, Xie C, et al:
Effect of surgical versus medical therapy on diabetic kidney
disease over 5 years in severely obese adolescents with type 2
diabetes. Diabetes Care. 43:187–195. 2020.PubMed/NCBI View Article : Google Scholar
|
|
65
|
Chen YZ, Gong ZX, Cai GY, Gao Q, Chen XM,
Tang L, Wei RB and Zhou JH: Efficacy and safety of flos
Abelmoschus manihot (Malvaceae) on type 2 diabetic
nephropathy: A systematic review. Chin J Integr Med. 21:464–472.
2015.PubMed/NCBI View Article : Google Scholar
|
|
66
|
Luan F, Wu Q, Yang Y, Lv H, Liu D, Gan Z
and Zeng N: Traditional uses, chemical constituents, biological
properties, clinical settings, and toxicities of Abelmoschus
manihot L.: A comprehensive review. Front Pharmacol.
11(1068)2020.PubMed/NCBI View Article : Google Scholar
|
|
67
|
Xu S, Chen S, Xia W, Sui H and Fu X:
Hyperoside: A review of its structure, synthesis, pharmacology,
pharmacokinetics and toxicity. Molecules. 27(3009)2022.PubMed/NCBI View Article : Google Scholar
|
|
68
|
Zhang K, Li M, Yin K, Wang M, Dong Q, Miao
Z, Guan Y, Wu Q and Zhou Y: Hyperoside mediates protection from
diabetes kidney disease by regulating ROS-ERK signaling pathway and
pyroptosis. Phytother Res. 37:5871–5882. 2023.PubMed/NCBI View Article : Google Scholar
|
|
69
|
Kaminski H, Couzi L and Eberl M:
Unconventional T cells and kidney disease. Nat Rev Nephrol.
17:795–813. 2021.PubMed/NCBI View Article : Google Scholar
|
|
70
|
Law BMP, Wilkinson R, Wang X, Kildey K,
Lindner M, Beagley K, Healy H and Kassianos AJ: Effector γδ T cells
in human renal fibrosis and chronic kidney disease. Nephrol Dial
Transplant. 34:40–48. 2019.PubMed/NCBI View Article : Google Scholar
|
|
71
|
Calle P and Hotter G: Macrophage phenotype
and fibrosis in diabetic nephropathy. Int J Mol Sci.
21(2806)2020.PubMed/NCBI View Article : Google Scholar
|
|
72
|
Yan J, Li X, Liu N, He JC and Zhong Y:
Relationship between macrophages and tissue microenvironments in
diabetic kidneys. Biomedicines. 11(1889)2023.PubMed/NCBI View Article : Google Scholar
|
|
73
|
Vigeland CL, Collins SL, Chan-Li Y, Hughes
AH, Oh MH, Powell JD and Horton MR: Deletion of mTORC1 activity in
CD4+ T cells is associated with lung fibrosis and increased γδ T
cells. PLoS One. 11(e0163288)2016.PubMed/NCBI View Article : Google Scholar
|
|
74
|
Hu W, Zhang X, Sheng H, Liu Z, Chen Y,
Huang Y, He W and Luo G: The mutual regulation between γδ T cells
and macrophages during wound healing. J Leukoc Biol. 115:840–851.
2024.PubMed/NCBI View Article : Google Scholar
|
|
75
|
Actor JK, Hwang SA and Kruzel ML:
Lactoferrin as a natural immune modulator. Curr Pharm Des.
15:1956–1973. 2009.PubMed/NCBI View Article : Google Scholar
|
|
76
|
Mincheva-Nilsson L, Hammarström S and
Hammarström ML: Activated human gamma delta T lymphocytes express
functional lactoferrin receptors. Scand J Immunol. 46:609–618.
1997.PubMed/NCBI View Article : Google Scholar
|