Introduction
Obesity and osteoporosis, two disorders of body
composition, are growing in prevalence. Obesity is not only a state
of increased adipose tissue, but also a state of chronic low-grade
inflammation, characterized by macrophage infiltration (1). Osteoporosis is another highly
prevalent disease characterized by accelerated bone resorption and
attenuated bone formation, resulting in progressive loss of
mineralized bone and a reduction in both bone quantity and quality
(2,3). Recently, several studies have
provided evidence suggesting their correlation. The traditional
view is that obesity is detrimental to bone health, and a negative
correlation between body weight or body mass index and bone mass
has been reported (4,5). Challenging this widely held view,
numerous studies have provided evidence to the contrary, indicating
that adipose tissue protects the skeleton (6,7).
Recently, the Gilsanz laboratory found that, in young adults,
subcutaneous adipose tissue is directly related to bone size and
density, whereas visceral adipose tissue is inversely correlated
with bone mass (8). Given these
discrepancies in results, further investigations aimed at
elucidating the relationship between bone and adipose tissue are
warranted.
High-fat diet (HFD)-induced obesity in animal models
is believed to best mimic the physiological functions of an obese
body. Animal experiments supporting the influence of obesity on
bone formation in terms of bone marrow mesenchymal stem cell (BMSC)
differentiation are limited. It is well-known that the
developmental fate of BMSCs is largely determined by the expression
of specific transcription factors that act as molecular switches to
drive differentiation (9).
However, it remains to be determined whether adipose tissue
regulates specific transcription factors in BMSC
differentiation.
In the present study, a HFD obese mice model was
established, and BMSC differentiation between normal control (NC)
and HFD mice was compared systematically. The aim was to determine
whether adipocytes are an important source of factors that
influence bone formation and, most importantly, whether dietary
components, particularly free fatty acids, (FFAs) act as
circulating regulators of BMSCs.
Materials and methods
Reagents
FFAs (palmitic and oleic acid) were purchased from
Sigma-Aldrich (St. Louis, MO, USA). FFA-free BSA was purchased from
Wako (Japan). 3-Isobutyl-1-methylxanthine, dexamethasone and
insulin were also purchased from Sigma. TRIzol was purchased from
Invitrogen (San Diego, CA, USA). Moloney murine leukemia virus
reverse transcriptase (M-MLV), dNTP, RNase inhibitor and other
reverse transcription agents were purchased from Promega Corp.
(USA). Anti-murine PPARγ and Runx2 antibodies were purchased from
Abcam Corp. (USA).
Animals
C57BL/6 mice (male, 2-week-old) were obtained from
Slac Laboratories (Shanghai, China) and randomly divided into
normal control (NC) (n=15) and HFD (n=15) groups. Mice in each
group were respectively fed normal chow or a HFD for 24 weeks
continuously. The mice were maintained under a 12-h light/dark
cycle, housed three or four per cage, and had ad libitum
access to water. All mice were maintained under humane conditions
according to the regulations of the Home Office Animals (Scientific
Procedures) Act 1986. The experimental design of this animal study
was approved by the Nanjing Medical University Animal Care and Use
Committee.
PIXImus measurements
After the femurs were fixed with 4%
paraformaldehyde, bone mineral density (BMD) (total and distal part
of femurs) was measured using the PIXImus small animal dual-energy
X-ray absorptiometry (DEXA) system (GE Medical System Lunar,
Madison, WI, USA).
Histomorphometry
The right proximal femur metaphysis (PFM) was opened
to expose the marrow cavity using an isometric low speed saw
(Buechler Ltd., USA), and was subsequently fixed in 10%
phosphate-buffered formalin for 24 h. It was then dehydrated in
ethanol, defatted in xylene and embedded undecalcified in
methylmethacrylate. The frontal sections were cut into 5-μm
sections with a microtome (Leica RM2155, Germany), then stained
with Goldner's Trichrome staining and Masson-Goldner Trichrome
staining for static histomorphometric measurement. A semi-automatic
digitizing image analysis system (Osteometrics, Inc., Decatur, GA,
USA) was used for quantitative bone histomorphometric measurements.
The studied region was cancellous bone between 0.25 and 2 mm distal
to the growth plate-epiphyseal junction. Regions 0.5 and 1 mm
distal to the growth plate of PFM were omitted in order to exclude
the primary spongiosa. Static measurements included total tissue
area, trabecular area, trabecular perimeter, osteoclast number and
osteoclast surface perimeter. These parameters were used to
calculate trabecular number, trabecular thickness, trabecular
separation, percent osteoclast perimeter and osteoclast number.
Histomorphometric parameters were calculated and expressed
according to guidelines of the ASBMR Nomenclature Committee
(10).
Mouse bone marrow mesenchymal stem
cell cultures
BMSCs were obtained from the bone marrow of the
mouse femurs. The marrow cavity was flushed with α-MEM
(Invitrogen), and the marrow was centrifuged at 1,000 rpm for 10
min. The cell pellet was suspended in a basal culture medium
containing 10% fetal bovine serum, 100 U/ml penicillin and 100
mg/ml streptomycin, and the cells were then seeded into 6-well
plates at a concentration of 1–3×10⁵ cells/well. Bone
marrow cells were incubated at 37°C in a 5% CO2
humidified atmosphere, and the medium was replaced every 3 days.
Non-adherent cells were removed when the medium was replaced.
Second passage cells were used for the experiment.
Colony formation assay
For the CFU-osteo assay, BMSCs were grown in basal
culture medium for 6 days. The cells were then grown in an
osteogenesis-inducing culture medium that comprised basal culture
medium supplemented with 10−7 M dexamethasone, 0.2 mM
ascorbic acid phosphate and 10 mM β-glycerophosphate
(Sigma-Aldrich). After 21 days, the cells were fixed with 10%
formalin and stained with 0.1% alizarin red, then the number of
positive colonies was counted under a light microscope. Only
colonies in which the majority (>50%) of cells were
histologically stained were scored as positive.
For the CFU-adipo assay, BMSCs were grown for 21
days in an adipogenesis-inducing culture medium containing basal
culture medium supplemented with 10−6 M dexamethasone,
0.5 mM isobutyl-methylxanthine and 3.3 μl/ml insulin. Oil Red O was
then added to each well in order to stain the accumulated lipid
vacuoles of the cells, and used as a marker of intracellular lipid
accumulation in cells. The stained cells were counted under a light
microscope.
Preparation of adipocyte-condition
medium
Mouse fibroblast 3T3-L1 pre-adipocytes were
purchased from the Institute of Biochemistry and Cell Biology
(Shanghai, China). For adipo-genesis, 3T3-L1 pre-adipocytes were
grown to confluence in a 60-mm plate and incubated in an adipogenic
cocktail (10−6 M dexamethasone, 0.5 mM
isobutylmethylxanthine and 3.3 μg/ml insulin) for 2 days. This was
followed by incubation in insulin-supplemented medium for an
additional 4 days. The cells were transferred to normal medium on
Day 7. Palmitic acid and oleic acid were mixed with FFA-free BSA at
a weight ratio of 2:1 to produce BSA-bound FFAs. The 3T3-L1
adipocytes were serum-starved overnight in 0.1% BSA DMEM
(Invitrogen) and were then treated with BSA-bound FFAs. FFAs were
added to the supernatant from Day 0 to Day 4 of the period of
adipogenesis. The mature adipocytes were harvested from the
conditioned medium (CM) from Day 8 to Day 10.
Adipocyte-CM was prepared as follows: confluent
cells were washed and maintained in serum-free DMEM medium with
0.2% BSA without any growth factors for 24 h. Then, the medium was
collected and centrifuged (11,000 rpm for 10 min at 4°C) to remove
cell debris. The FFA-treated CM is referred to as FCM.
RNA preparation and quantitative
real-time PCR
Total RNA was extracted from the cultured cells
using TRIzol and quantified using real-time PCR. Total RNA (2 μg)
was reverse-transcribed with 200 units M-MLV (Promega, Madison, WI,
USA) in the presence of 0.5 mmol/l deoxynucleotide triphosphate, 25
units RNase inhibitor and 0.5 μg N9 random primers, in a total
volume of 25 μl. PCR primers were designed by Primer5 software
(Table I). Each quantitative
real-time PCR was carried out in triplicate in a 25 μl volume of
SYBR Green Real-time PCR Master Mix (Toyobo, Osaka, Japan). The PCR
program was as follows: 10 sec at 95°C, followed by 40 cycles of 30
sec at 94°C, 30 sec at 60°C, 40 sec at 72°C and 5 sec at 80°C, on a
plate reader (Rotor Gene-3000; Corbett Research, Sydney,
Australia).
 | Table I.Primer sequences for real-time
PCR. |
Table I.
Primer sequences for real-time
PCR.
| Gene | Forward primer | Reverse primer |
|---|
| β-actin |
TAAAGACCTCTATGCCAACACAGT |
CACGATGGAGGGGCCGGACTCATC |
| PPARγ |
GACCACTCGCATTCCTTT |
CCACAGACTCGGCACTCA |
| C/EBPα |
CAGTTTGGCAAGAATCAGAGCA |
GGGTGAGTTCATGGAGGAATGG |
| Pref-1 |
GCTTTTTGTGGTGGAGTTTG |
GGGTTCTTAGATAGCGTGGT |
| Runx2 |
GGTGAAACTCTTGCCTCGTC |
AGTCCCAACTTCCTGTGCT |
| Sox9 | ACCATTTTGAGGGGAT | GAAGGCTAAGGGACAC |
| Osterix |
GCCAGGAGTAAAGAATA |
AGAGAGACACCCACAGA |
| Dlx5 |
TGAAAAACGGGGAGATGC |
GCTGAGAGAGCGGGATGA |
The mean value of triplicates for each sample was
calculated and expressed as the cycle threshold (Ct). For each gene
studied, the extent of gene expression was calculated as the ΔCt:
the difference between the Ct value of the sample and the Ct value
of β-actin as the endogenous control. The relative expression level
was evaluated by the comparative ΔΔCt method, and the software tool
REST-384©. Expression for each gene was arbitrarily set
at 1 to facilitate comparison between several groups.
Western blotting for Runx2 and
PPARγ
Primary BMSCs were cultured as previously described,
then washed and lysed using RIPA buffer [50 mM Tris-HCl (pH 7.4),
150 mM NaCl, 1% NP40, 0.5% sodium deoxycholate, 5 mM EDTA, 5 mM
NaF, 1 mM PMSF, 5 μg/ml leupeptine and 5 μg/ml aprotinin]. Aliquots
of cell lysates containing 30 μg of total proteins were subjected
to SDS-PAGE, transferred to a PVDF membrane and immunoblotted with
anti-Runx2, PPARγ and GAPDH antibodies.
Statistical analysis
Values are presented as the mean ± SD. The
difference between groups was tested by the two-tailed t-test or
rank-sum test according to the distribution of the data. P<0.05
was regarded as a significant difference.
Results
In vivo study
Establishment of a high-fat
diet-induced obese mice model
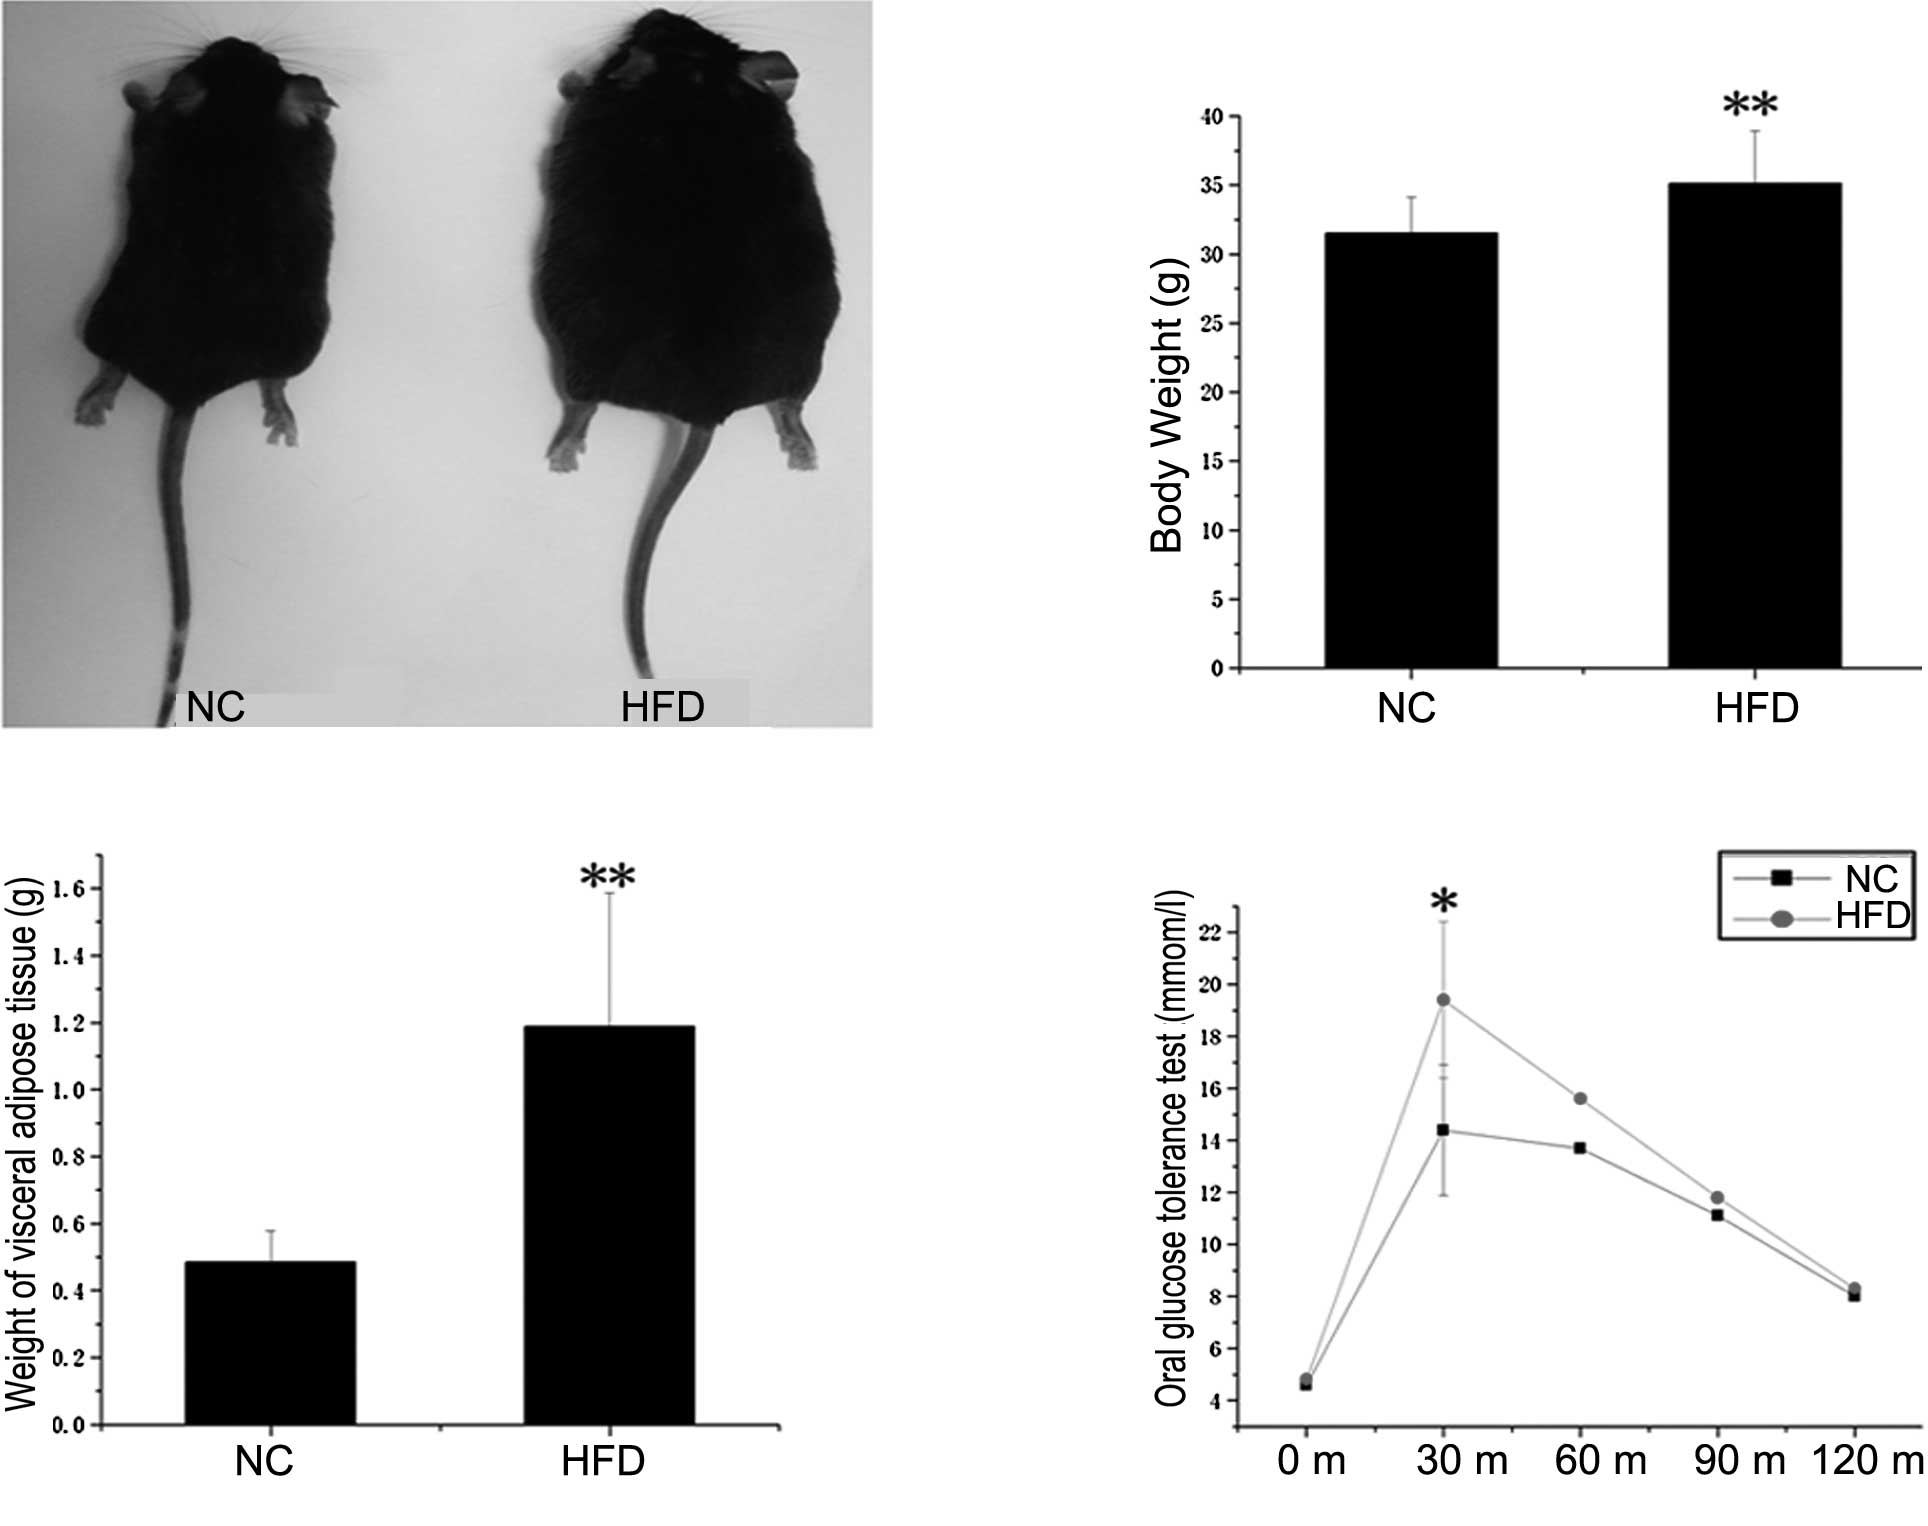
The physical and metabolic characteristics of the NC
and HFD mice are presented in Fig.
1. As expected, body weight (Fig.
1B) and visceral adipose tissue weight (Fig. 1C) were significantly higher in the
HFD mice, which had been maintained with HFD for 20 weeks, compared
to the NC mice (P<0.01). To assess the effect of the HFD on
glucose homeostasis in adipose tissues, an oral glucose tolerance
test was performed (Fig. 1D). The
obese mice exhibited sustained hyperglycemia at fasting blood
glucose levels and at 15, 30, 60 and 120 min after glucose
treatment by intragastric administration. In particular, the level
of sugar in blood was significantly elevated at 15 min (P<0.05).
These results indicate that the HFD-induced obese mice model was
successfully established.
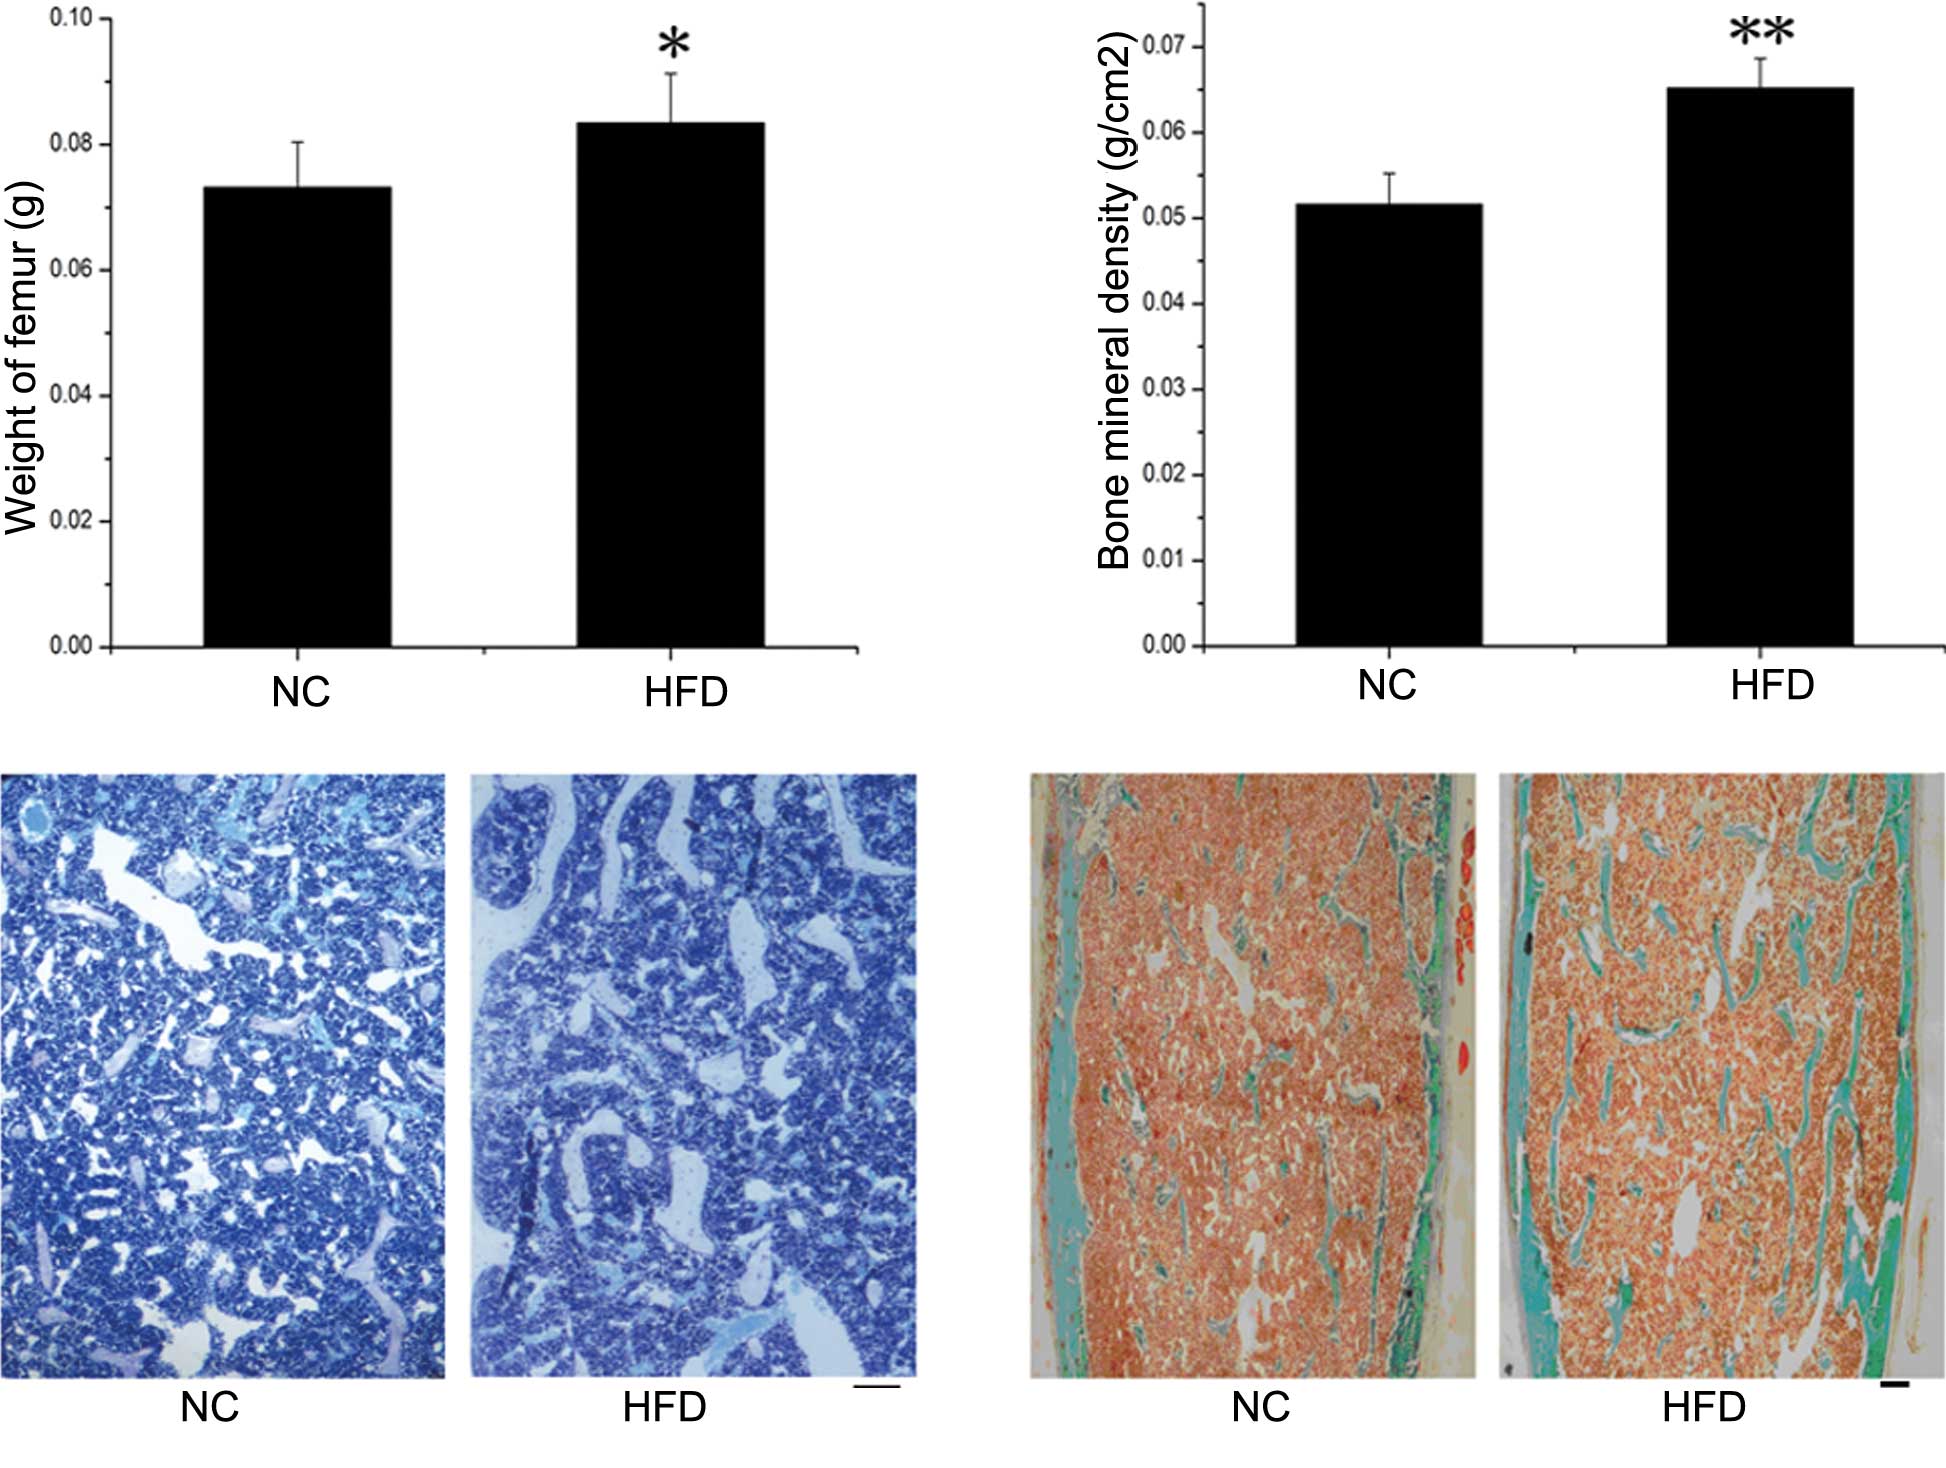
BMD evaluations and static bone
histomorphometric analysis
Significant differences in the weight of femurs from
the HFD mice compared to the control mice were observed (P<0.05)
(Fig. 2A). The BMD in the proximal
femurs was examined by DEXA in the NC and HFD mice (Fig. 2B) and was significantly higher in
the HFD mice compared to the NC group (P<0.01). More extensive
histomorphometric studies were performed in both groups. Table II documents the static
histomorphometric parameters of the femurs, which were fixed in
sections and stained with toluidine blue (Fig. 2C) and Masson-Goldner Trichrome
(Fig. 2D), both of which showed
more bone trabecula in the HFD than in the NC mice. Trabecular
thickness was significantly higher in the HFD mice (P=0.05). The
trabecular number and trabecular surface were higher, while the
trabecular separation was lower, in the HFD compared to the NC
mice, although this was without significance. In addition, no
significant differences were detected in any of the parameters
related to the bone absorption rate, such as osteoclast number and
osteoclast perimeter.
| Table II.Static histomorphometry. |
Table II.
Static histomorphometry.
| Bone parameter | Normal control
mice | High-fat diet
mice | P-value |
|---|
| Trabecular surface
(%) | 11.223±2.658 | 12.814±2.313 | NS |
| Trabecular thick
(μm) | 43.161±3.143 | 48.498±4.946 | 0.05 |
| Trabecular no.
(no./mm) | 2.581±0.479 | 2.659±0.522 | NS |
| Trabecular separation
(μm) | 356.901±84.585 | 339.321±70.534 | NS |
| Osteoclast no.
(no./mm) | 0.275±0.137 | 0.254±0.172 | NS |
| Osteoclast perimeter
(%) | 0.115±0.049 | 0.128±0.089 | NS |
CFU assay and expression of
differentiation genes in BMSCs
To investigate the cause of bone structure changes
in the HFD mice, primary osteoblasts and osteoclasts were induced
from BMSCs and bone marrow monocytes in both the HFD and NC mice.
Tartrate-resistant acid phosphatase (TRAP) staining revealed no
significant changes in the number of osteoclasts, and real-time PCR
showed no significant changes in the mRNA levels of specific genes,
including TRAP, integrin-α and cathepsin K expressed by
osteoclasts, between NC and HFD mice (data not shown). These
results indicate that obesity may have no impact on
osteoclasts.
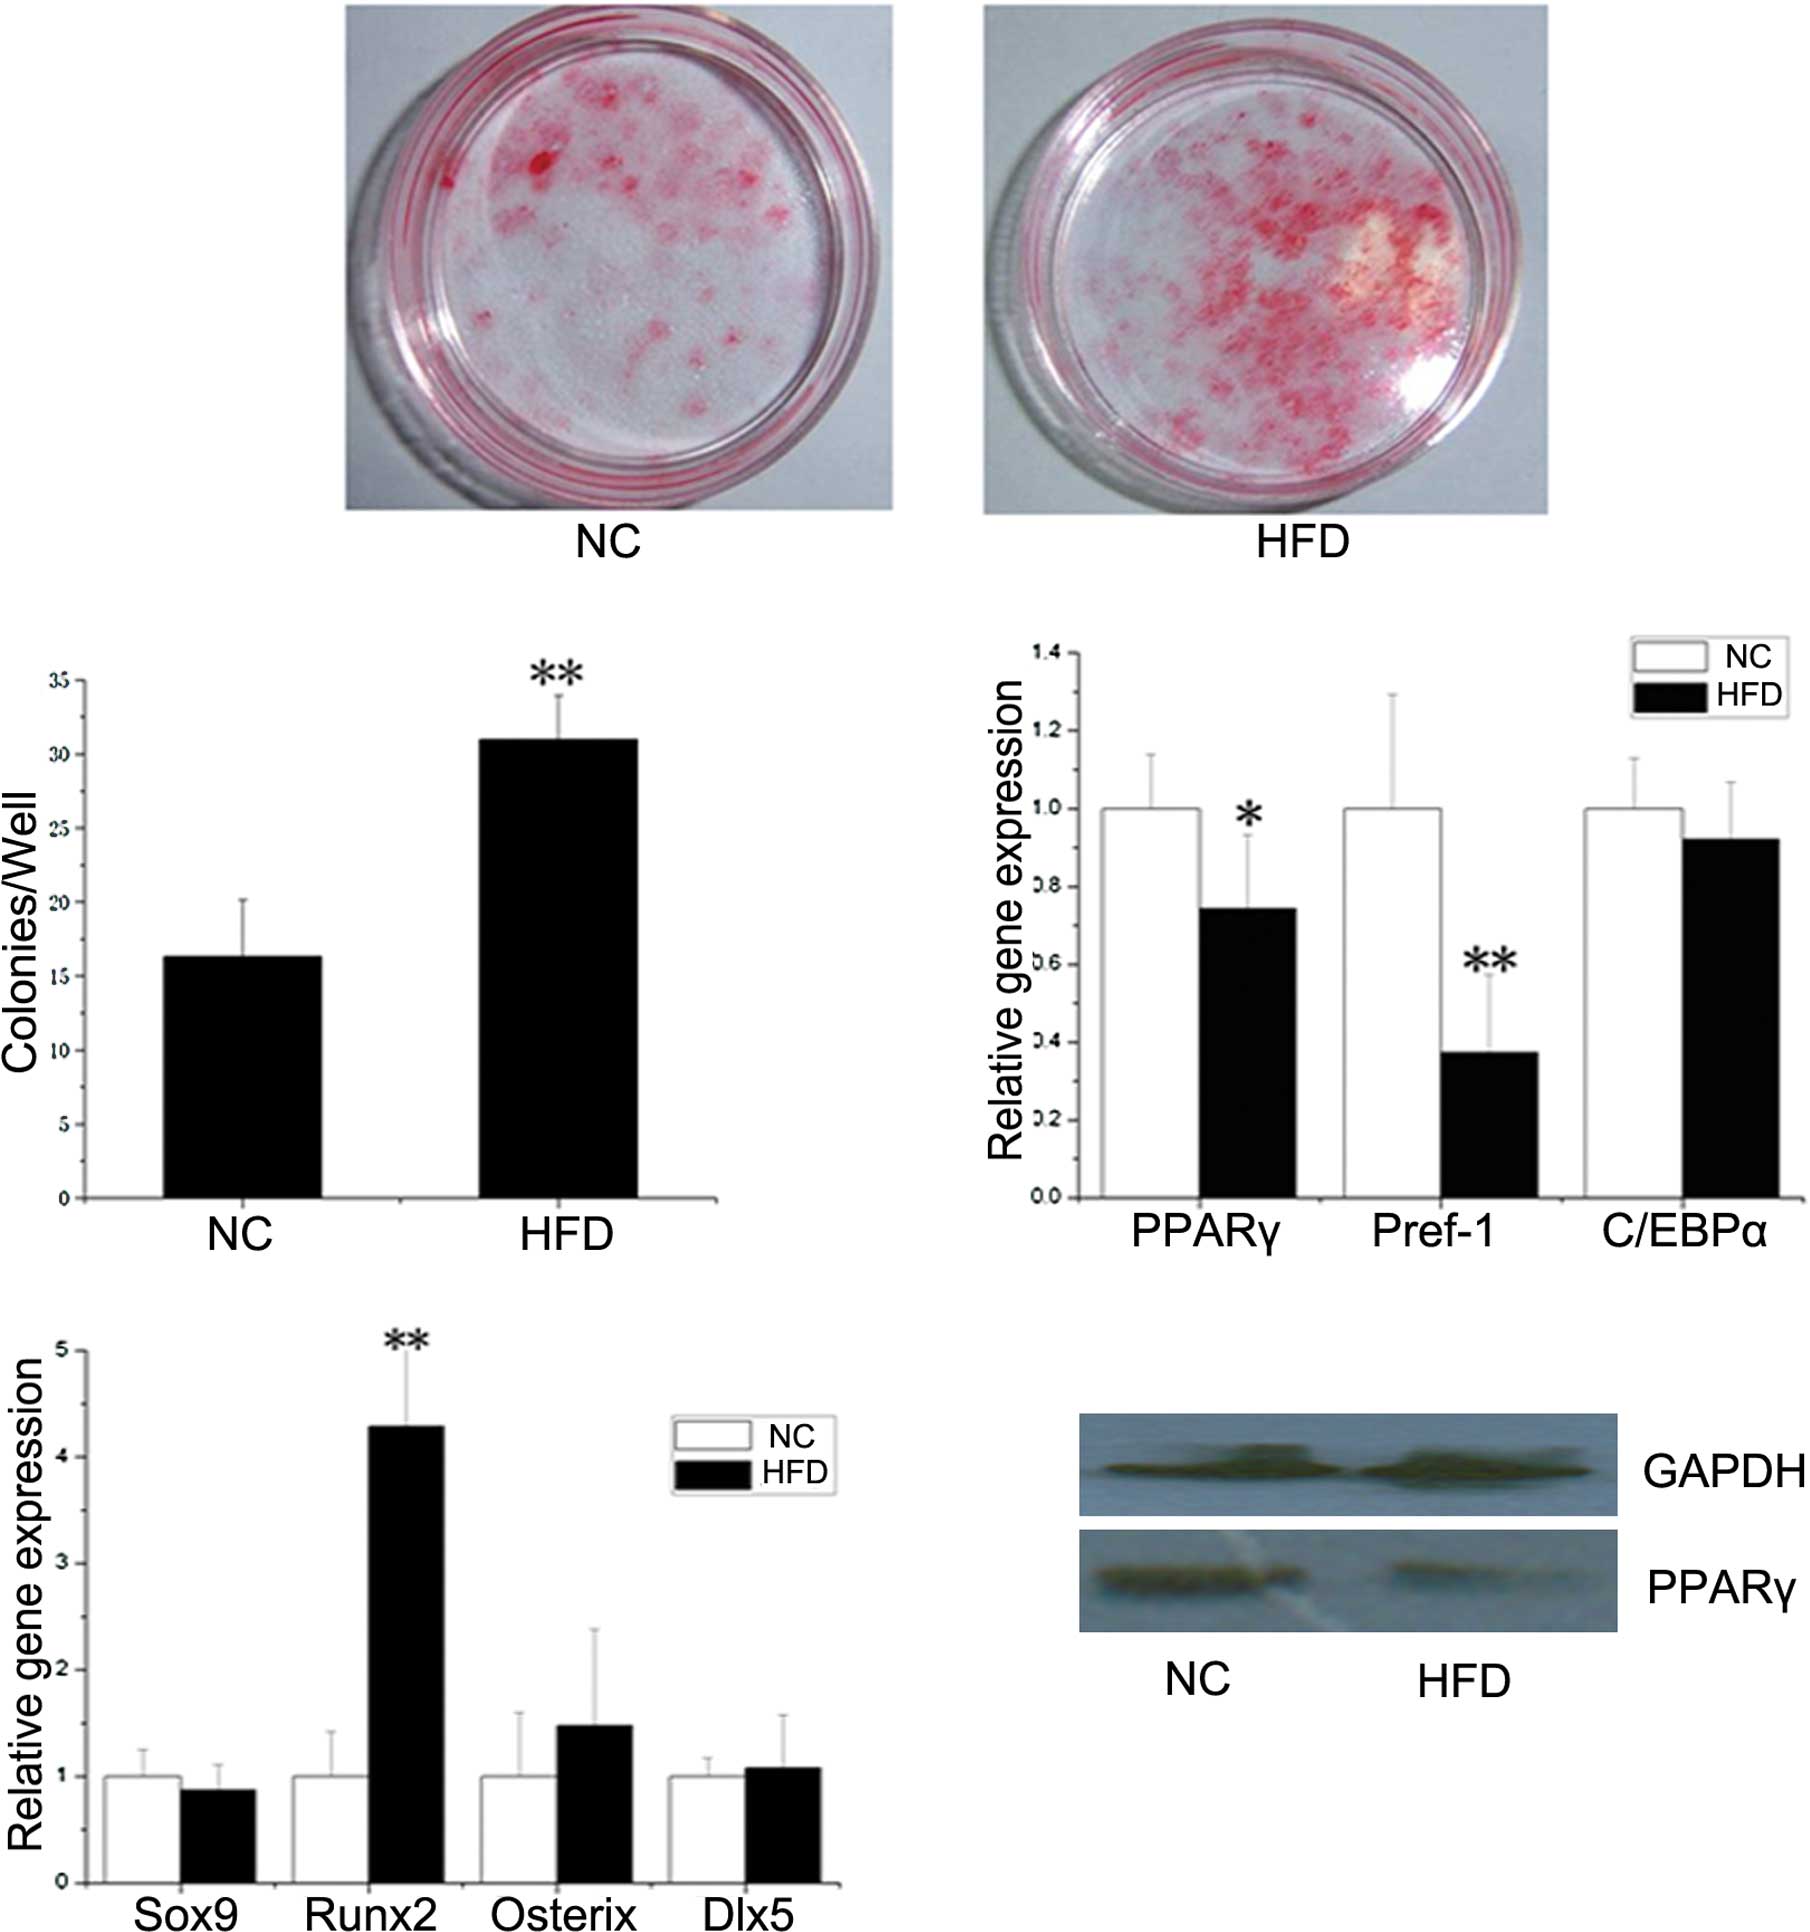
A BMSC differentiation experiment was performed to
determine whether the effect of obesity occurred at the level of
stem progenitor cells, which are able to differentiate into
osteoblasts and adipocytes (11).
As shown in Fig. 3A and B, there
was a significantly increased CFU-osteo number (stained by alizarin
red) in the HFD mice (P<0.01). As for CFU-adipo, no statistical
difference was found between the HFD and NC groups (data not
shown).
In order to analyze the effect of obesity on the
osteogenic and adipogenic potential of BMSCs at the molecular
level, the expression levels of several osteogenic (Sox9, Runx2,
Osterix and Dlx5) and adipogenic (PPARγ, Pref-1 and C/EBPα) genes
were determined by real-time PCR. As shown in Fig. 3C and D, the expression level of
Runx2 was significantly higher, while the mRNA transcripts of PPARγ
and Pref-1 were significantly lower, in BMSCs from the HFD group
compared to the NC group. As the prime regulator of BMSC
differentiation, the protein expression of PPARγ in BMSCs from the
NC mice was higher than that from the HFD mice (Fig. 4E), which coincided with PPARγ gene
expression.
In addition, the activity of alkaline phosphatase
(ALP) was assayed in isolated murine calvariae osteoblasts. Higher
ALP activity in the HFD mice than in the NC mice was noted,
although this was not significant (data not shown). The mRNA levels
of BMP2 and COLIa1 in osteoblasts analyzed by real-time PCR were
also higher in the HFD vs. the NC mice, although this was without
significance (data not shown).
In vitro study
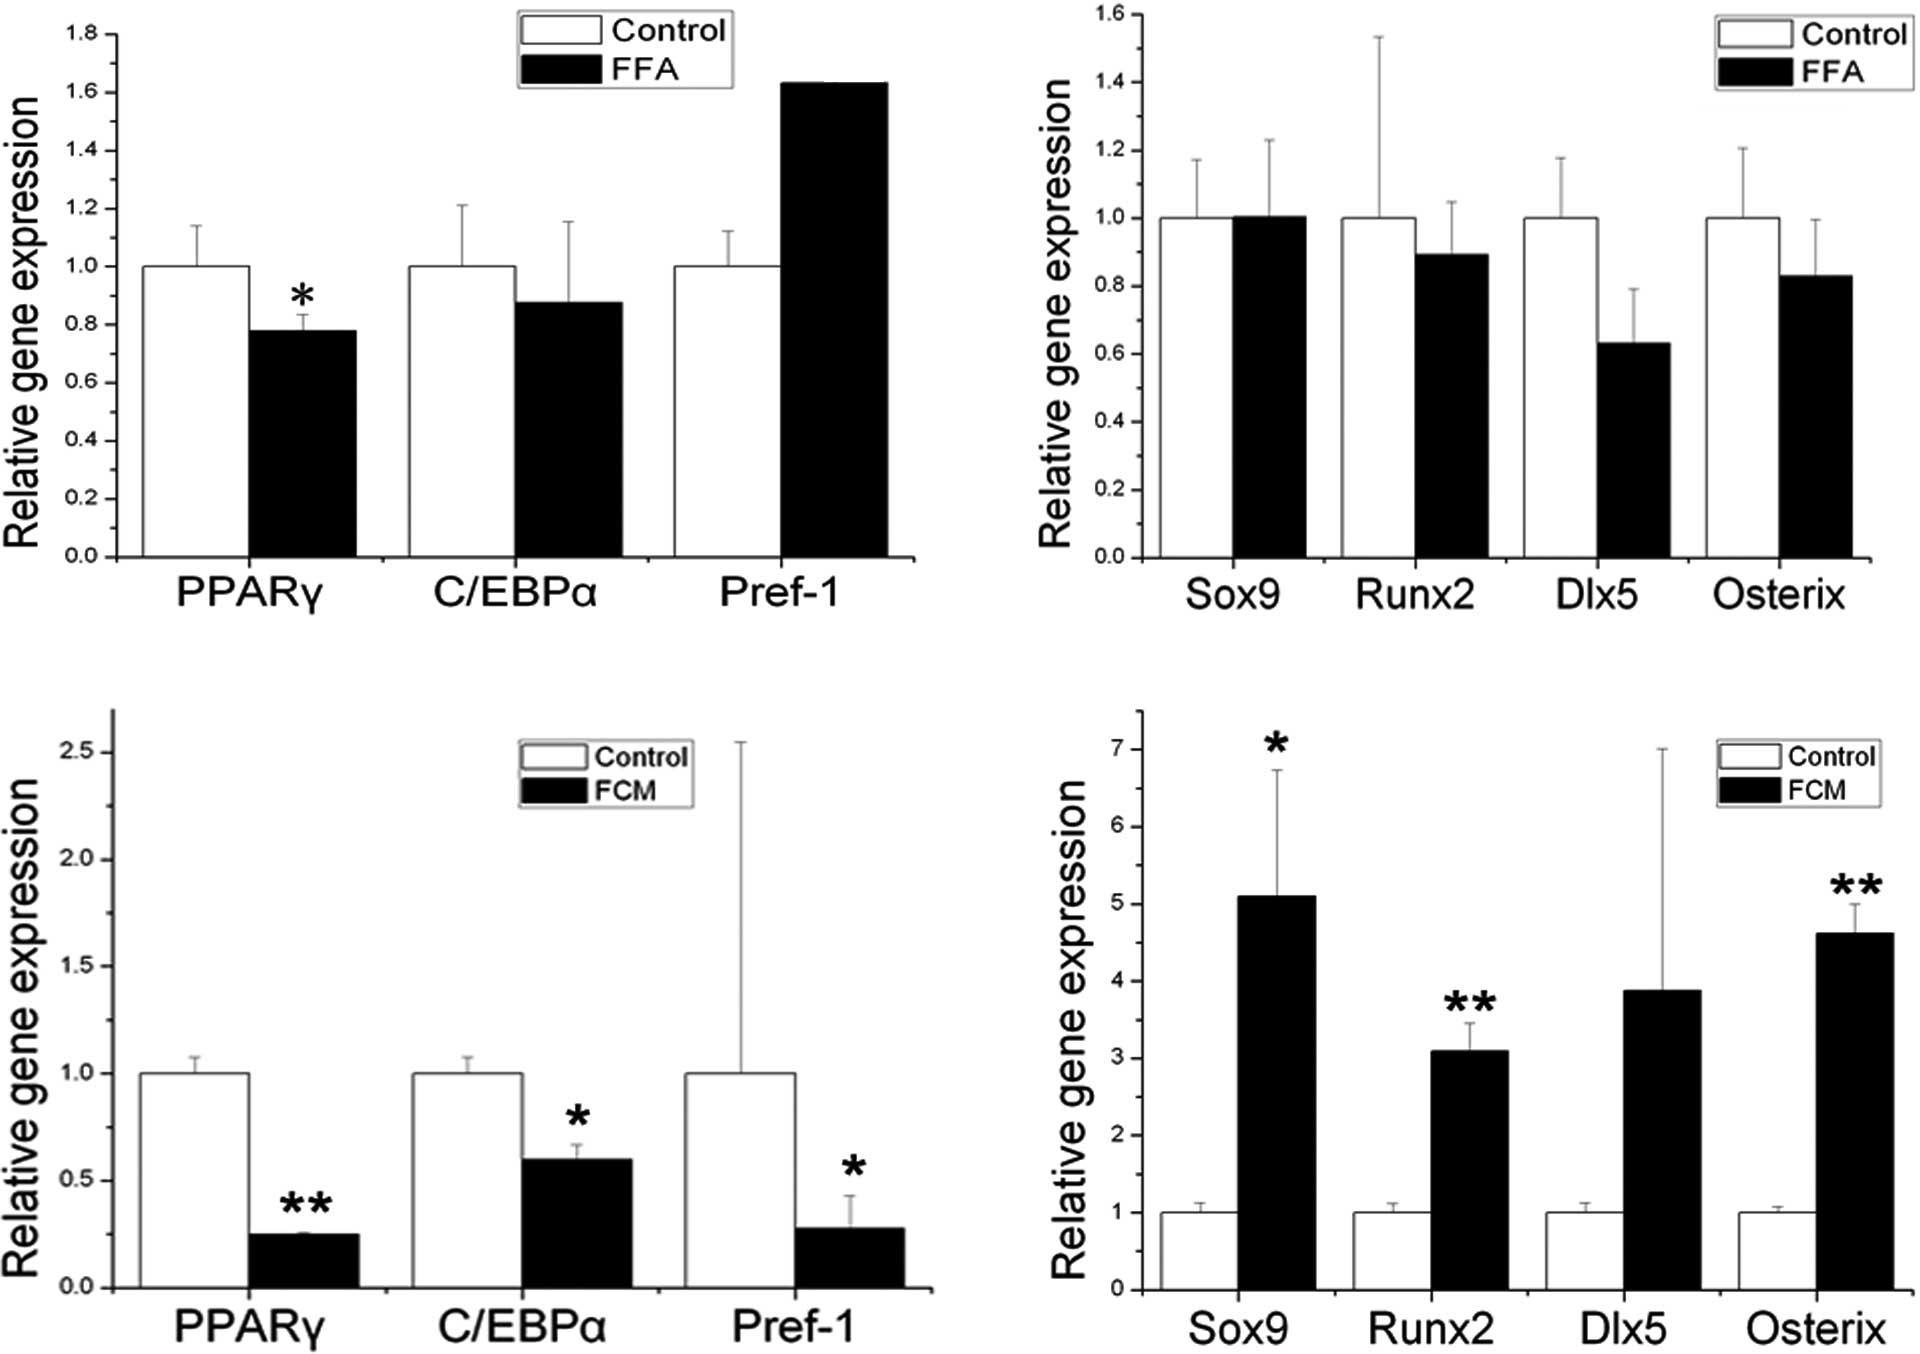
Direct and indirect effect of FFAs on
mouse BMSCs
The diet administered to the HFD mice contained
mainly FFAs, therefore BMSCs were directly stimulated by FFAs for
48 h (Fig. 4A and B). Compared to
the control, direct treatment of FFAs significantly decreased only
the expression level of PPARγ (P<0.05).
To obtain further insight into whether adipocytes
are an important source of factors acting as circulating regulators
of BMSCs, FCM was applied to the BMSCs in vitro for 24 and
48 h. As early as 24 h after the initiation of treatment, a
significant decrease in specific adipogenic genes and an increase
in the early specific osteogenic gene Sox9 was observed (data not
shown). After the BMSCs were exposed to FCM for 48 h, the
expression levels of PPARγ, C/EBPα and Pref-1 were significantly
decreased (Fig. 4C) (PPARγ,
P<0.01; C/EBPα and Pref-1, P<0.05), while the expression
levels of Sox9, Runx2 and Osterix were significantly increased
(Fig. 4D) (Sox9, P<0.05; Runx2
and Osterix, P<0.01).
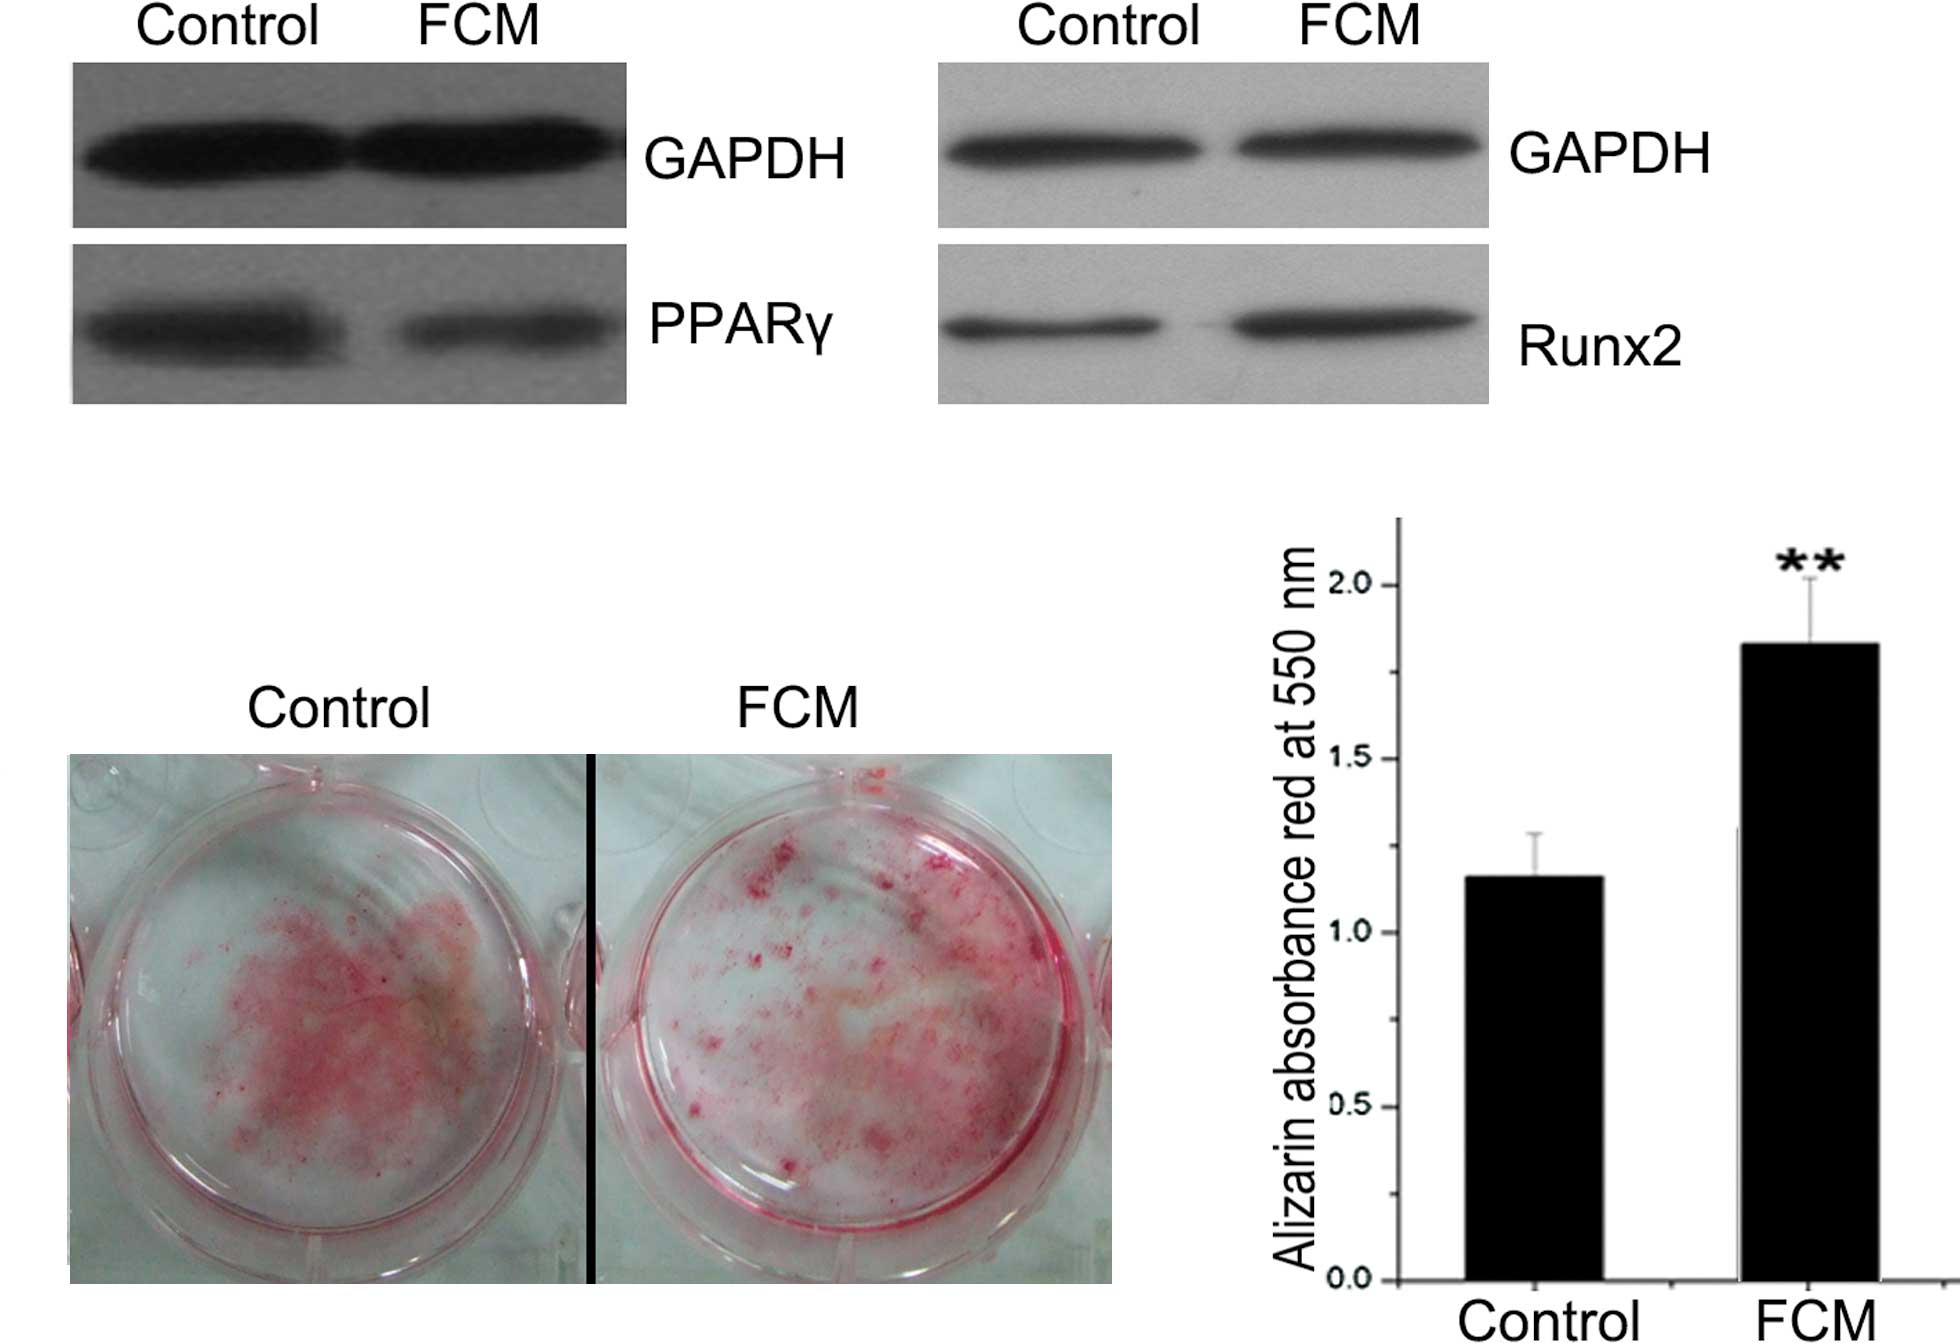
Effect of FCM on protein expression
and mineralization in mouse BMSCs
As the prime adipogenic and osteogenic genes, the
protein expression of PPARγ and Runx2 was analyzed by Western
blotting. PPARγ expression was lower and Runx2 expression was
higher in the FCM-treated BMSCs compared to the controls (Fig. 5A). BMSCs were also cultured for
mineralization, during which FCM was added continuously. After
induction for 21 days, the mineral nodus was stained with alizarin
red, which was quantified by ethylpyridium chloride extraction by
absorbance at 550 nm (Fig. 5B and
C). As a result, FCM was found to significantly promote BMSC
mineralization (P<0.01).
Discussion
Increased obesity is a major public health concern
and a risk factor for many diseases, but determining whether it is
beneficial or detrimental to bone health is difficult.
Our data showed that HFD-induced obesity exerts a
protective effect in the development of osteoporosis, consistent
with the findings of many clinical research studies (12). BMD, the parameter of femur
trabecula and the number of CFU-osteo were increased in obese mice,
which may have been regulated through the enhancement of BMSC
differentiation towards osteoblasts. However, there was no
influence on the number and function of osteoclasts. These results
indicate that HFD-induced obesity has an impact on osteoporosis at
the level of osteoblasts, but not osteoclasts.
Several potential mechanisms have been proposed to
explain the relationship between fat and bone mass. One explanation
is that a greater fat mass imposes a greater mechanical stress on
bone and, in response, bone mass increases to accommodate the
greater load. However, only 27 and 38% of total body weight in
white men and women are attributable to fat mass, respectively
(13). Therefore,
weight-associated gravitational forces associated with increased
fat mass may be insufficient to explain the impact of fat mass on
bone.
The dietary components fed to the HFD mice contained
mainly FFAs, which serve as a major link between HFD and obesity
(14). To date, the study of FFAs
has focused largely on their roles in glucose metabolism and
insulin resistance (15,16). However, in recent years, a novel
viewpoint has emerged asserting that certain dietary components,
specifically FFAs, may influence bone metabolism (17–19).
In this study, BMSCs were directly stimulated by FFAs, but no
significant difference was detected in osteogenic or adipogenic
genes, and only PPARγ was decreased. However, after the BMSCs were
stimulated by CM from mature adipocytes treated with FFAs, a
significantly higher expression level of osteogenic genes,
including Runx2, Osterix and Dlx5, and a lower expression level of
adipogenic genes, including PPARγ, Pref-1 and C/EBPα, were noted.
These results indicate that FFA plays a role in BMSC
differentiation mainly in an indirect manner, first by affecting
adipocyte hypertrophy and then by impacting BMSC differentiation
through the alteration of factors secreted by adipocytes.
Indeed, adipose tissue is an endocrine organ that
secretes multiple hormones, cytokines and inflammatory factors. It
is likely that the important relationships between bone and obesity
are mediated by adipocyte-derived factors that act on bone.
However, different factors have various effects on bone.
Inflammatory factors and their detrimental effects on vasculature
as well as muscle have long been recognized; not surprisingly, they
also inhibit bone formation (20).
Several studies have shown that leptin directly promotes the
differentiation of osteoblasts (21,22).
As for adiponectin, it has a negative effect on bone formation due
to an indirect induction of osteoclast formation and inhibition of
osteoprotegerin production in osteoblasts (23,24).
It is well-known that active factors secreted by
adipocytes can be altered when stimulated by FFAs. For example,
acute elevation of plasma FFAs activated the pro-inflammatory
nuclear factor NF-κB pathway, which resulted in increased gene
expression of TNF-α and MCP-1 (14). Moreover, FFAs decreased the
secretion of adiponectin and leptin into medium (25,26).
Collectively, this research and our study indicate that adiponectin
or other novel factors secreted by FFA-treated adipocytes may
played a key role in BMSC differentiation.
In conclusion, our results provide evidence that
HFD-induced obesity may play a protective role in bone formation
through factors secreted by FFA-treated adipocytes. This supports
the hypothesis that adiponectin or other factors, excepting leptin
and inflammatory factors, may play a role in concomitantly
promoting the osteogenic and suppressing the adipogenic
differentiation of BMSCs. These possible factors may function as a
suppressor of osteoporosis in future bio-therapy.
Acknowledgements
This study was supported by grant no.
30900505 from the China National Natural Scientific Foundation.
References
|
1.
|
Wellen KE and Hotamisligil GS:
Obesity-induced inflammatory changes in adipose tissue. J Clin
Invest. 112:1785–1788. 2003. View
Article : Google Scholar : PubMed/NCBI
|
|
2.
|
Raisz LG: Pathogenesis of osteoporosis:
concepts, conflict, and prospects. J Clin Invest. 115:3318–3325.
2005. View
Article : Google Scholar : PubMed/NCBI
|
|
3.
|
Melton LJ III: Adverse outcomes of
osteoporotic fractures in the general population. J Bone Miner Res.
18:1139–1141. 2003. View Article : Google Scholar : PubMed/NCBI
|
|
4.
|
Goulding A, Cannan R, Williams SM, Gold
EJ, Taylor RW and Lewis-Barned NJ: Bone mineral density in girls
with forearm fractures. J Bone Miner Res. 13:143–148. 1998.
View Article : Google Scholar : PubMed/NCBI
|
|
5.
|
Nagasaki K, Kikuchi T, Hiura M and
Uchiyama M: Obese Japanese children have low bone mineral density
after puberty. J Bone Miner Metab. 22:376–381. 2004. View Article : Google Scholar : PubMed/NCBI
|
|
6.
|
Clark EM, Ness AR and Tobias JH: Adipose
tissue stimulates bone growth in prepubertal children. J Clin
Endocrinol Metab. 91:2534–2541. 2006. View Article : Google Scholar : PubMed/NCBI
|
|
7.
|
Reid IR: Relationships among body mass,
its components, and bone. Bone. 31:547–555. 2002.PubMed/NCBI
|
|
8.
|
Gilsanz V, Chalfant J, Mo AO, Lee DC,
Dorey FJ and Mittelman SD: Reciprocal relations of subcutaneous and
visceral fat to bone structure and strength. J Clin Endocrinol
Metab. 94:3387–3393. 2009. View Article : Google Scholar : PubMed/NCBI
|
|
9.
|
Beresford JN, Bennett JH, Devlin C, Leboy
PS and Owen ME: Evidence for an inverse relationship between the
differentiation of adipocytic and osteogenic cells in rat marrow
stromal cell cultures. J Cell Sci. 102:341–351. 1992.PubMed/NCBI
|
|
10.
|
Parfitt AM, Drezner MK, Glorieux FH, Kanis
JA, Malluche H and Meunier PJ: Bone histomorphometry:
standardization of nomenclature, symbols, and units. Report of the
ASBMR Histomorphometry Nomenclature Committee. J Bone Miner Res.
2:595–610. 1987. View Article : Google Scholar
|
|
11.
|
Pittenger MF, Mackay AM, Beck SC, Jaiswal
RK, Douglas R, Mosca JD, Moorman MA, Simonetti DW, Craig S and
Marshak DR: Multilineage potential of adult human mesenchymal stem
cells. Science. 284:143–147. 1999. View Article : Google Scholar : PubMed/NCBI
|
|
12.
|
Reid IR: Relationships between fat and
bone. Osteoporos Int. 19:595–606. 2008. View Article : Google Scholar
|
|
13.
|
Zhao LJ, Jiang H, Papasian CJ, Maulik D,
Drees B, Hamilton J, Deng HW and Zhao LJ: Correlation of obesity
and osteoporosis: effect of fat mass on the determination of
osteoporosis. J Bone Miner Res. 23:17–29. 2008. View Article : Google Scholar : PubMed/NCBI
|
|
14.
|
Boden G, She P, Mozzoli M, Cheung P,
Gumireddy K, Reddy P, Xiang X, Luo Z and Ruderman N: Free fatty
acids produce insulin resistance and activate the proinflammatory
nuclear factor-κB pathway in rat liver. Diabetes. 54:3458–3465.
2005.PubMed/NCBI
|
|
15.
|
Soga T, Ohishi T, Matsui T, Saito T,
Matsumoto M, Takasaki J, Matsumoto S, Kamohara M, Hiyama H, Yoshida
S, Momose K, Ueda Y, Matsushime H, Kobori M and Furuichi K:
Lysophosphatidylcholine enhances glucose-dependent insulin
secretion via an orphan G protein-coupled receptor. Biochem Biophys
Res Commun. 326:744–751. 2005. View Article : Google Scholar : PubMed/NCBI
|
|
16.
|
Yamada C, Yamada Y, Tsukiyama K, Yamada K,
Udagawa N, Takahashi N, Tanaka K, Drucker DJ, Seino Y and Inagaki
N: The murine glucagon-like peptide-1 receptor is essential for
control of bone resorption. Endocrinology. 149:574–579. 2008.
View Article : Google Scholar : PubMed/NCBI
|
|
17.
|
Grey A: Fatty acids and bone. Clinic Rev
Bone Miner Metab. 7:210–215. 2009. View Article : Google Scholar
|
|
18.
|
Cornish J, MacGibbon A, Lin JM, Watson M,
Callon KE, Tong PC, Dunford JE, van der Does Y, Williams GA, Grey
AB, Naot D and Reid IR: Modulation of osteoclastogenesis by fatty
acids. Endocrinology. 149:5688–5695. 2008. View Article : Google Scholar : PubMed/NCBI
|
|
19.
|
Watkins BA, Li Y, Allen KG, Hoffmann WE
and Seifert MF: Dietary ratio of (n-6)/(n-3) polyunsaturated fatty
acids alters the fatty acid composition of bone compartments and
biomarkers of bone formation in rats. J Nutr. 130:2274–2284.
2000.PubMed/NCBI
|
|
20.
|
Morley JE and Baumgartner RN:
Cytokine-related aging process. J Gerontol A Biol Sci Med Sci.
59:M924–M929. 2004. View Article : Google Scholar : PubMed/NCBI
|
|
21.
|
Steppan CM, Crawford DT, Chidsey-Frink KL,
Ke H and Swick AG: Leptin is a potent stimulator of bone growth in
ob/ob mice. Regul Pept. 92:73–78. 2000. View Article : Google Scholar : PubMed/NCBI
|
|
22.
|
Frühbeck G: Intracellular signalling
pathways activated by leptin. Biochem J. 393:7–20. 2006.
|
|
23.
|
Luo XH, Guo LJ, Xie H, Yuan LQ, Wu XP,
Zhou HD and Liao EY: Adiponectin stimulates RANKL and inhibits OPG
expression in human osteoblasts through the MAPK signaling pathway.
J Bone Miner Res. 21:1648–1656. 2006. View Article : Google Scholar : PubMed/NCBI
|
|
24.
|
Oshima K, Nampei A, Matsuda M, Iwaki M,
Fukuhara A, Hashimoto J, Yoshikawa H and Shimomura I: Adiponectin
increases bone mass by suppressing osteoclast and activating
osteoblast. Biochem Biophys Res Commun. 331:520–526. 2005.
View Article : Google Scholar : PubMed/NCBI
|
|
25.
|
Berger J, Tanen M, Elbrecht A,
Hermanowski-Vosatka A, Moller DE, Wright SD and Thieringer R:
Peroxisome proliferator-activated receptor-γ ligands inhibit
adipocyte 11β-hydroxysteroid dehydrogenase type 1 expression and
activity. J Biol Chem. 276:12629–12635. 2001.
|
|
26.
|
Shintani M, Nishimura H, Yonemitsu S,
Masuzaki H, Ogawa Y, Hosoda K, Inoue G, Yoshimasa Y and Nakao K:
Downregulation of leptin by free fatty acids in rat adipocytes:
effects of triacsin C, palmitate, and 2-bromopalmitate. Metabolism.
49:326–330. 2000. View Article : Google Scholar : PubMed/NCBI
|